


1. Introduction
Plants produce various tissues from stem cells that are maintained at the shoot apex and root tips. Stem cells divide to replenish themselves, and also to give rise to specialized cells that develop into various tissues. To ensure the normal development of organs, the fates of stem cells are precisely controlled in a spatio-temporal manner by plant hormones, mobile transcription factors, and secreted peptides (reviewed in Hu et al., Reference Hu, Lu, Hassan, Zhang, Yuan, Abraham, Shrestha, Villalobos Solis, Chen, Tschaplinski, Doktycz, Tuskan, Cheng and Yang2021, Pierre-Jerome et al., Reference Pierre-Jerome, Drapek and Benfey2018, Gundu et al., Reference Gundu, Tabassum and Blilou2020). To achieve a better understanding of plant growth and development at high spatio-temporal resolution, a method that can monitor and quantify gene expression dynamics at the single cell level is needed.
Various techniques have been used for the spatial analysis of gene expression in plants. For example, reporter analysis using β-glucuronidase (GUS) and fluorescent proteins, and in situ hybridization are the most popular approaches for detecting the expression patterns of genes-of-interest at the single cell or tissue level. For a comprehensive analysis of gene expression, microarrays and RNA-seq, combined with laser captured microdissection, are the useful methods (reviewed in Gautam et al., Reference Gautam and Sarkar2015). Recently, “spatially-resolved transcriptomics” was developed to obtain transcriptome information linked to positional information (Stahl et al., Reference Ståhl, Salmén, Vickovic, Lundmark, Navarro, Magnusson, Giacomello, Asp, Westholm, Huss, Mollbrink, Linnarsson, Codeluppi, Borg, Pontén, Costea, Sahlén, Mulder, Bergmann, Lundeberg and Frisén2016, Larsson et al., Reference Larsson, Frisén and Lundeberg2021). While this method can capture gene expression at high spatial resolution, acquisition of temporal information is difficult. By contrast, temporal analysis of gene expression in plants is mainly achieved by investigating changes in expression levels along a developmental time scale (Voß et al., Reference Voß, Wilson, Kenobi, Gould, Robertson, Peer, Lucas, Swarup, Casimiro, Holman, Wells, Péret, Goh, Fukaki, Hodgman, Laplaze, Halliday, Ljung, Murphy, Hall and Bennett2015, Zhang et al., Reference Zhang, Eswaran, Alonso-Serra, Kucukoglu, Xiang, Yang, Elo, Nieminen, Damén, Joung, Yun, Lee, Ragni, Barbier de Reuille, Ahnert, Lee, Mähönen and Helariutta2019). However, such an approach lacks spatial information because of the use of whole tissues or organs. In recent years, methods for single-cell transcriptome analysis developed and were optimized for plant developmental studies. Such methods allowed the identification of cell types by bioinformatical clustering, and enabled mathematical reconstruction of developmental trajectories at pseudo-times (reviewed in Stuart and Satija, Reference Stuart and Satija2019). Although these methods reveal gene expression profiles of specific cell types, the estimated spatio-temporal information is not always accurate (Campbell and You, Reference Campbell and Yau2016).
Another approach for spatio-temporal observations of gene expression is time-lapse imaging of promoters fused to fluorescence proteins. These promoter-fluorescence proteins in the tissues can be detected by a fluorescence or confocal microscope. This observation has an advantage that we can monitor fluorescence with both eye observation and camera shooting. However, light required for the excitation of fluorescence proteins leads to sample autofluorescence and photobleaching. Autofluorescence and photobleaching distort image quality, which leads to unreliable quantitative data. Furthermore, the depletion of fluorescent signals resulting from photobleaching makes long-term observations difficult.
Luciferase is another reporter used for quantifying gene expression that relies on monitoring luminescence. It catalyzes luminescence reactions in the presence of the substrate D-Luciferin (reviewed in Fleiss and Sarkisyan, Reference Fleiss and Sarkisyan2019). Because measuring luminescence does not require excitation light, luciferase presents an alternative cellular reporter to fluorescence proteins for quantitative and long-term imaging of biological processes. For example, time-course measurements of photons for luminescence in bulk tissues were used to analyze the oscillatory nature of circadian clock-related genes (Millar et al., Reference Millar, Carré, Strayer, Chua and Kay1995, Alabadi et al., Reference Alabadí, Oyama, Yanovsky, Harmon, Más and Kay2001, Doyle et al., Reference Doyle, Davis, Bastow, McWatters, Kozma-Bognár, Nagy, Millar and Amasino2002, Más et al., Reference Más, Alabadí, Yanovsky, Oyama and Kay2003). However, luminescence signals are too weak to detect with eye observation under a microscope. Therefore, developing an experimental system for time-lapse imaging of luminescence using a microscope equipped with a highly sensitive camera is crucial for the reliable use of luciferase for observing spatio-temporal dynamics of gene expression.
Vascular development is a process, in which cambial cells behave as vascular stem cells to produce xylem and phloem cells, which arise at opposite sides of the vascular cambium when a plant organ is viewed in a transverse orientation (reviewed in Fischer et al., Reference Fischer, Kucukoglu, Helariutta and Bhalerao2019). This process can be mimicked in an in vitro culture system called Vascular Cell Induction Culture System Using Arabidopsis Leaves (VISUAL) (Kondo et al., Reference Kondo, Nurani, Saito, Ichihashi, Saito, Yamazaki, Mitsuda, Ohme-Takagi and Fukuda2016). In VISUAL, mesophyll cells of Arabidopsis thaliana cotyledons first acquire cambial identity before differentiating into xylem or phloem cells. Vascular transdifferentiation is triggered by culturing cotyledons in induction medium containing cytokinin, auxin, and bikinin, which is an inhibitor of glycogen synthase kinase 3-like kinase (GSK3-like kinase, De Rybel et al., Reference De Rybel, Audenaert, Vert, Rozhon, Mayerhofer, Peelman, Coutuer, Denayer, Jansen, Nguyen, Vanhoutte, Beemster, Vleminckx, Jonak, Chory, Inzé, Russinova and Beeckman2009). VISUAL was recently used to obtain time-course transcriptome data at 6-hour intervals. This led to the identification of gene modules corresponding to each stage of vascular development by co-expression network analysis (Furuya et al., Reference Furuya, Saito, Uchimura, Satake, Nosaki, Miyakawa, Shimadzu, Yamori, Tanokura, Fukuda and Kondo2021). In addition, fluorescence imaging combined with tissue clearing methods in VISUAL-induced cotyledons revealed the importance of positional information in determining whether vascular stem cells differentiate into xylem or phloem cells (Nurani et al., Reference Nurani, Ozawa, Furuya, Sakamoto, Ebine, Matsunaga, Ueda, Fukuda and Kondo2020). These insights indicate that cell fates dynamically change according to spatio-temporal information during vascular development. However, VISUAL has yet to be used for simultaneously acquiring spatial and temporal information on vascular development.
In this study, we developed a luminescence microscope imaging system that was optimized for VISUAL. By capturing luminescence signals with an inverted microscope equipped with an Electron Multiplying Charge Coupled Device (EMCCD) camera which is suitable for observation of extremely weak signal, changes in promoter activity of vascular-related genes were monitored at spatio-temporal resolution throughout the vascular differentiation process. Based on these imaging data, a method was developed to quantify sequential changes of luminescence intensity at the single cell level. In addition, the use of dual-color luciferases enabled the simultaneous imaging of the dynamics of different cell fate markers during vascular development. Therefore, the imaging system described here provides a new tool for quantitative and long-term spatio-temporal imaging of plant developmental processes at the single cell level.
2. Methods
2.1. Plant materials
The Arabidopsis thaliana accession used in this study is Columbia-0. The proSEOR1:SEOR1-YFP line (Froelich et al., Reference Froelich, Mullendore, Jensen, Ross-Elliott, Anstead, Thompson, Pélissier and Knoblauch2011) was provided by Dr Michael Knoblauch. The proUBQ14:ELUC and proIRX3:ELUC lines used in this study are described in Kondo, Reference Kondo2022.
2.2. Plasmid constructs and transformation
Gateway cloning technology (Invitrogen) was used for vector construction. ELUC fused with the PEST domain (Toyobo) was used as a short half-life luminescence protein. Site-directed mutations of S246H and H347A were introduced into ELUC to generate PtRLUC according to the methods of Nishiguchi et al. (Reference Nishiguchi, Yamada, Nasu, Ito, Yoshimura and Ozawa2015). DNA fragments of ELUC and PtRLUC, including PEST was amplified and then cloned into the pENTR/D-TOPO vector (Life Technologies). Using LR clonase II (Life Technologies), the region between attL1 and attL2 in the entry vector was recombined into the destination vector, pH35G, for generating the 35S:ELUC and 35S:PtRLUC constructs. To generate the proSEOR1:PtRLUC construct, the SEOR1 promoter region was cloned from wild-type genomic DNA and inserted into the HindIII site of the pGWB1 destination vector (Nakagawa et al., Reference Nakagawa, Kurose, Hino, Tanaka, Kawamukai, Niwa, Toyooka, Matsuoka, Jinbo and Kimura2007). The PtRLUC region in the entry vector was recombined into pGWB1-proSEOR1 by the LR reaction. The DNA fragment of proSEOR1:PtRLUC was then cloned into pENTR/D-TOPO and recombined into the pFAST-G01 destination vector (Shimada et al., Reference Shimada, Shimada and Hara-Nishimura2010). To construct other luminescence reporter vectors, ELUC or PtRLUC DNA fragments were amplified and inserted into the SacI site of pGWB1 to make pGWB1-ELUC or pGWBI-PtRLUC. An approximately 2 kb DNA fragment upstream of the predicted start codon of AtHB8, NAC004, and GH3.1 was amplified and cloned into pENTR/D-TOPO. The region between attL1 and attL2 in the entry vector was recombined into pGWB1:ELUC or pGWB1:PtRLUC by the LR reaction. For constructing proNAC004:ELUC, an approximately 1.0 kb DNA fragment downstream of the predicted stop codon was cloned and fused. proSEOR1:PtRLUC in pFAST-G01 was transformed into proIRX3:ELUC transgenic plants and other constructs were introduced into the wild type by the floral dip method (Clough and Bent, Reference Clough and Bent1998) using Agrobacterium (Rhizobium radiobactor) strain GV3101 MP90. Primers used in this study were listed in Supplemental Table S1.
2.3. Preparing samples for luminescence imaging
In this manuscript, plant samples were analyzed mainly using VISUAL as described previously (Kondo et al., Reference Kondo, Nurani, Saito, Ichihashi, Saito, Yamazaki, Mitsuda, Ohme-Takagi and Fukuda2016) with slight modifications. Luminescence reporter lines were grown on conventional half-strength MS solid medium, pH 5.7, at 22°C under 60–70 μmol m-2s-1 continuous white light for 7 days. The VISUAL induction medium was mixed with 1.5% low melting point agarose (Lonza) and heated until the agarose was fully dissolved before adding 2,4-D (final 0.25 mg L-1), kinetin (final 1.25 mg L-1), bikinin (final 20 μM) and D-Luciferin (final 200 μM). Cotyledons were embedded in polymerized induction medium with the glass-bottom dish, D11130H (Matsunami), and secured with a microscope coverslip (12 mm Φ, Fisher Scientific) with adaxial side of the cotyledon attached to the bottom. After incubation at 22°C under 90 μmol m-2s-1 continuous white light for 5–24 h, samples were moved to the luminescence microscope for time-lapse imaging. For the imaging of the diffusion speed of D-Luciferin, half-strength MS medium was mixed with 1.5% low melting point agarose and D-luciferin (final 200 μM). Imaging was started soon after embedding 35S:ELUC cotyledons.
2.4. Luminescence imaging
An inverted microscope (IX81, OLYMPUS) equipped with a fluorescence light source (U-HGLGPS, Olympus), a x10 objective lens (UPLSAPO 10X, NA = 0.4, Olympus) and a x20 objective lens (UPLSAPO 20X, NA = 0.75, Olympus) was connected to a high-sensitivity EMCCD camera (iXon Ultra 897, digitization: 16bit, 512 x 512 pixels, EM gain x1000, ANDOR), yielding a pixel size of 4.57 μm (10x) and 2.29 μm (20x). They were placed in a dark chamber (Fig. 1A). The microscope was controlled using the Cellsense Dimension imaging software (OLYMPUS). Imaging was performed by automatically repeating the following steps: 1) light illumination for VISUAL induction (Illuminating period), 2) 85 seconds of dark phase for reducing remaining light (Dark phase), 3) luminescence imaging under dark illumination, and 4) blight-field imaging at regular intervals (20 or 60 min) (Fig. 1C). The focus was manually set based on the bright-field image at the start of the imaging and was maintained during time-lapse imaging using laser-based IX3 Z-Drift Compensator (IX3-ZDC, Olympus). Appropriate exposure time for detecting luminescence was determined depends on the promoter activity of each marker. Illuminating period was set as long as possible within the residual time of the imaging interval of 20 minutes for successful VISUAL induction. Especially, the promoter activity of proNAC004:ELUC/proGH3.1:PtRLUC was too weak to detect by short exposure time. In this case, it took a total of 15 minutes for exposure time, then imaging interval was set to 60 minutes. For single-color imaging, ELUC signal was detected using a YFP filter set (U-FYFP, OLYMPUS). For dual-color imaging, ELUC and PtRLUC signals were detected using GFP filter set (U-FGFP, OLYMPUS) and mCherry filter set (U-FMCHE, OLYMPUS), respectively. The number of times for each imaging was performed as shown below; proUBQ14:ELUC (n=3), proAtHB8:ELUC (n=3), proIRX3:ELUC/proSEOR1:PtRLUC (n=1) and proNAC004:ELUC/proGH3.1:PtRLUC (n=3). Information of supplemental movies and transgenic plants was compiled in Supplemental table S2.
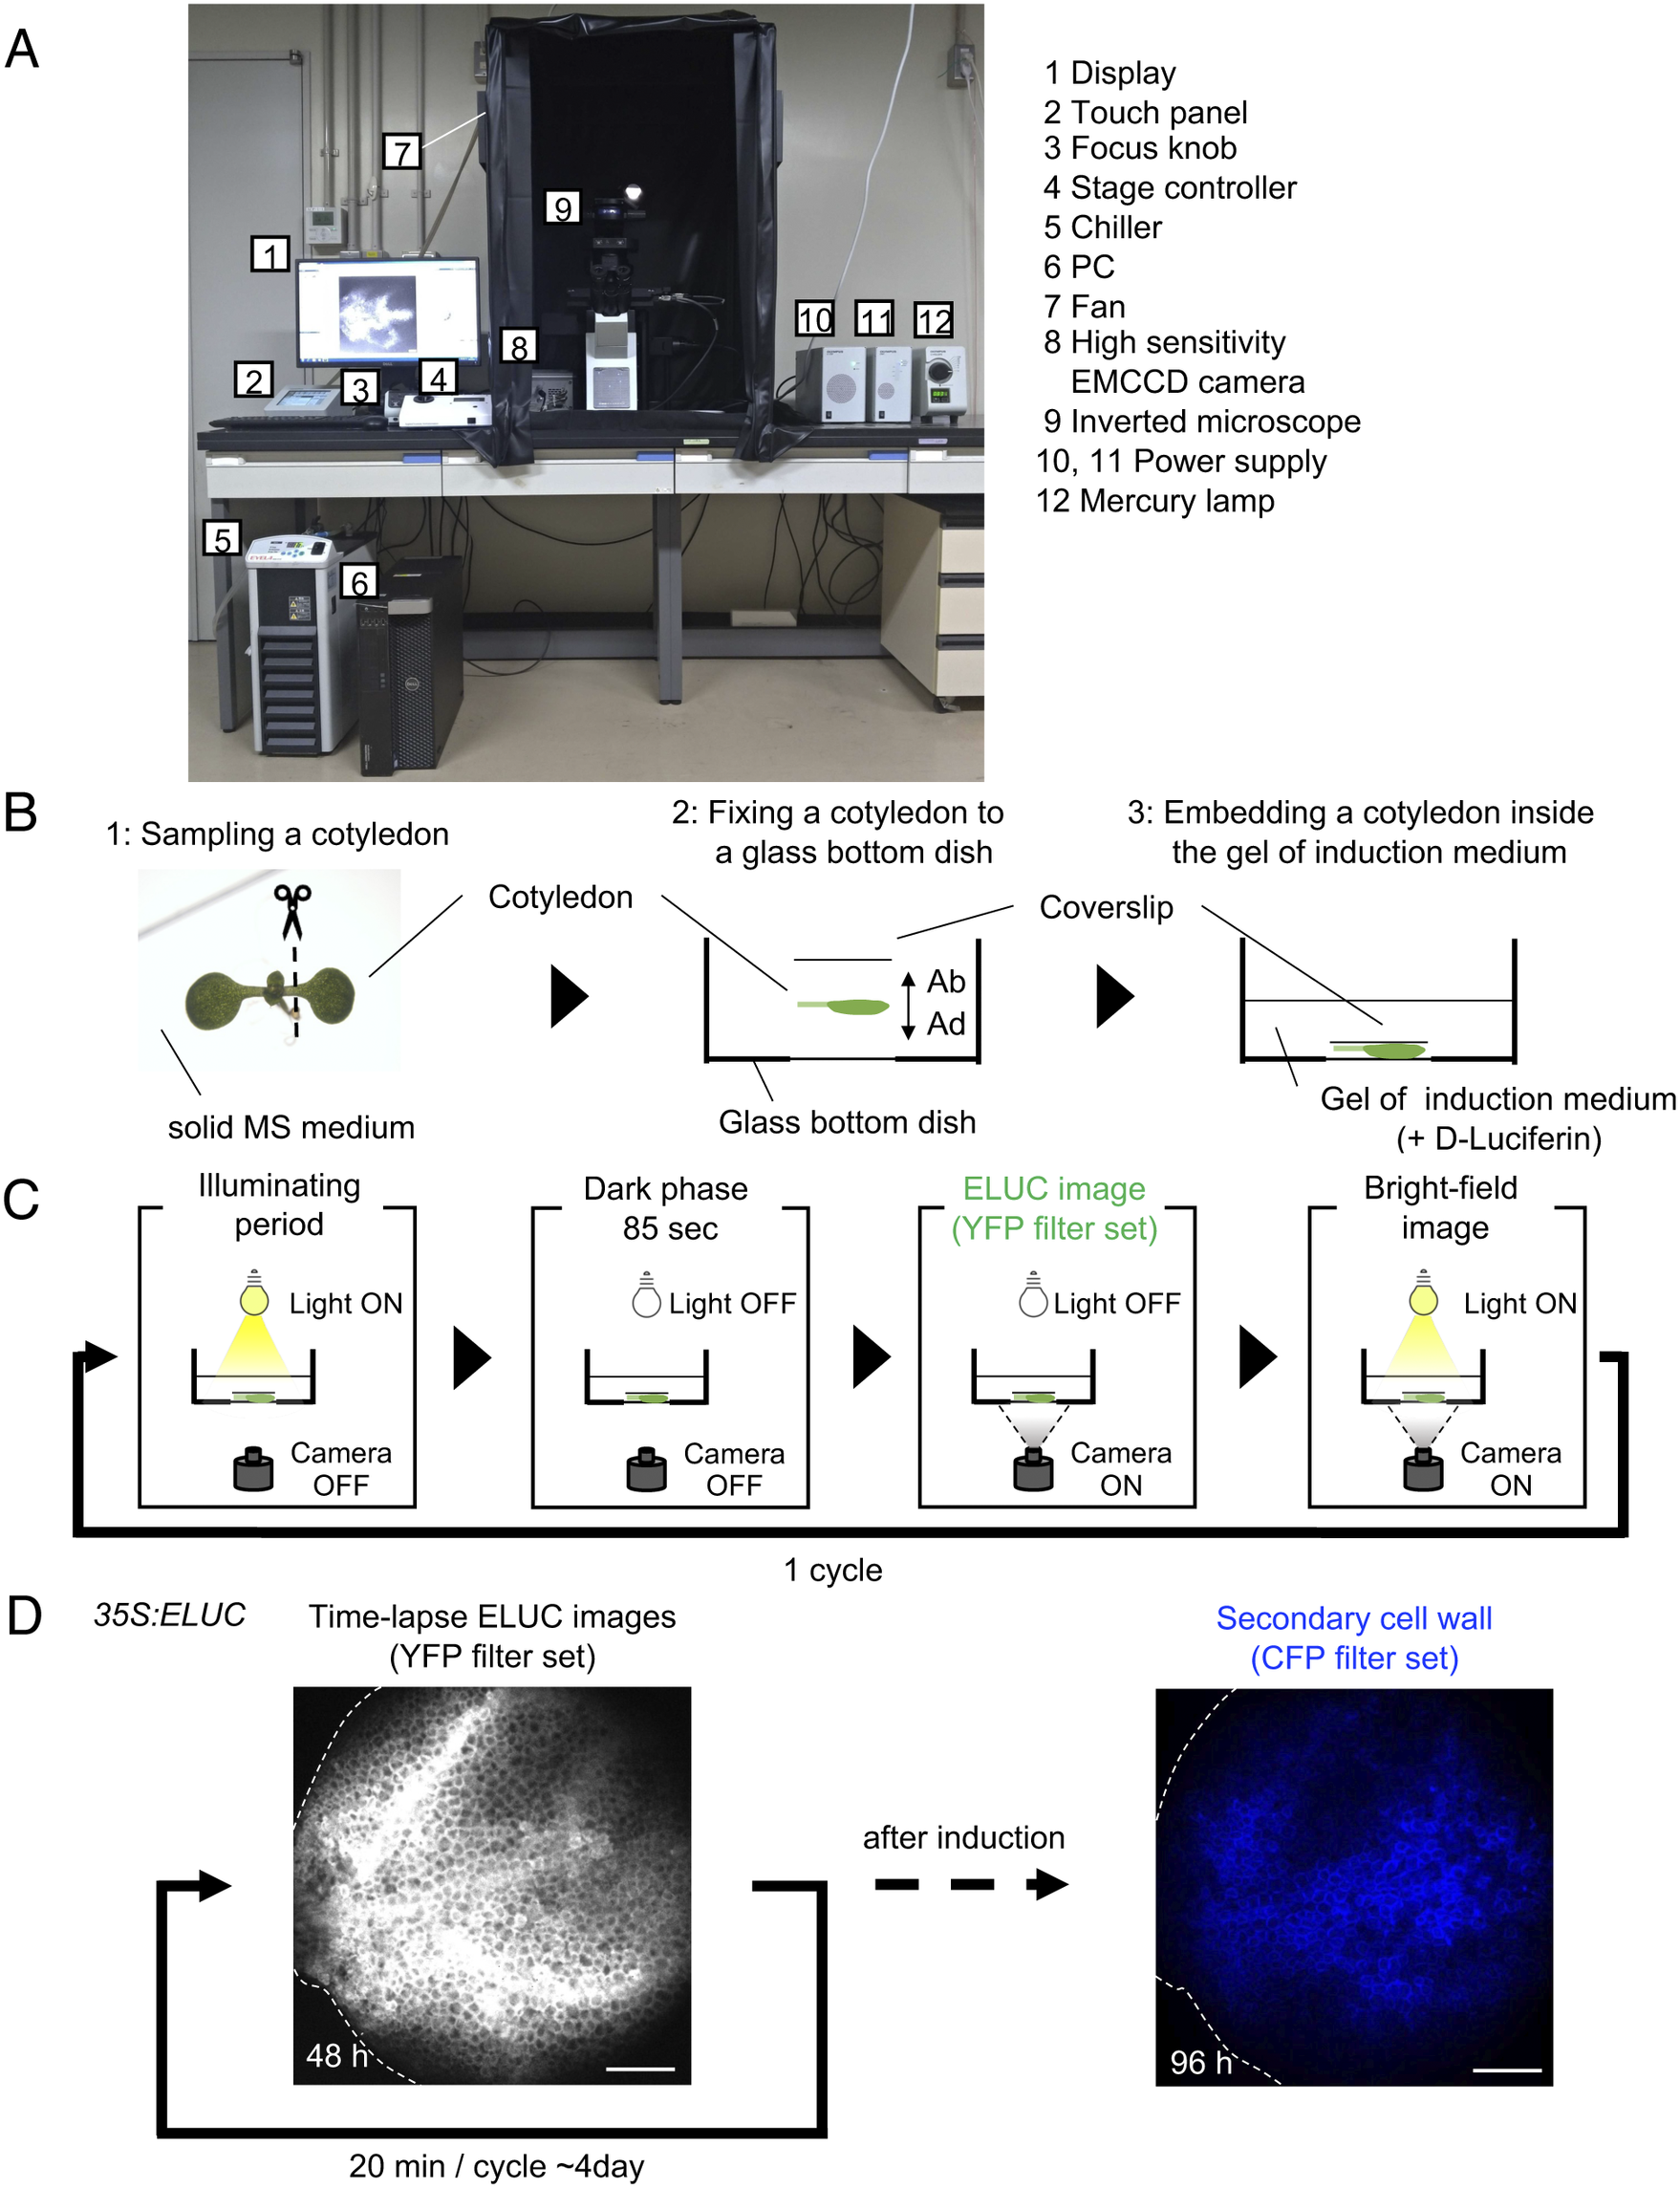
Fig. 1. Luminescence imaging set-up adapted for the VISUAL induction system. (a) Image of the luminescence microscope. The numbers in the figure correspond to the components of the system, which are indicated on the right side of the image. (b) Schematic diagram of sample preparation for VISUAL induction for imaging vascular development with the luminescence microscope. Excised Arabidopsis cotyledons from seedlings grown on solid MS medium for 7 days (1) are fixed to a glass-bottom dish (2). The adaxial side (AD) of the cotyledon faces the bottom of the dish. The cotyledon is secured with a second cover slip placed on the abaxial side (AB) of the flattened cotyledon (3). (c) Schematic diagram of the steps for luminescence imaging of vascular development. Steps for imaging include an illuminating period under light illumination, a dark phase that lasts for 85 seconds for cooling, and to reduce residual light, luminescence imaging under dark with the EMCCD camera, and bright field imaging under light illumination. These four steps are automatically repeated at regular intervals. (d) Verification of the luminescence imaging system adapted for VISUAL. Luminescence images of the cotyledon of 35S:ELUC transgenic plants were taken at exposure of 30 s with intervals of 20 min for 4 days. The image on the left was taken at 48 h after the start of induction. After 4 days of imaging luminescence, an autofluorescence image of same sample was captured using a CFP filter set. ELUC signal is displayed as a greyscale image. Autofluorescence of xylem cells is shown in blue. Dotted line indicates outline of cotyledon. Scale bars: 400 μm.
2.5. Remove outliers
To optimize the method of removing the signals from cosmic rays, “Maximum intensity projection” function in ImageJ was applied to time-lapse images of proAtHB8:ELUC (slices = 253, exposure time = 3 min, interval = 20 min, Supplemental movie S2) after testing various parameters (radius, threshold) for “Remove outliers” (Schneider et al., Reference Schneider, Rasband and Eliceiri2012) (Supplemental Fig. 4A). Images visualizing the difference between before and after executing “Remove outliers” in each parameter to the proAtHB8:ELUC luminescence images were produced by “Image Calculator” function in ImageJ (Supplemental Fig. 4B). Based on these results, we decided to use the parameter “Radius = 3.0” and “Threshold = 10000” for “Remove outliers”.
2.6. Clearfield equalization
For clearfield equalization, the averaged intensity of 10 x 10 pixels in the upper left corner of the view was calculated as dark noise and subtracted from all pixels of the image. These processes were executed respectively in all images by ImageJ macro (Supplemental text file S1).
2.7. Transient expression assay in Nicotiana benthamiana
Agrobacterium GV3101 MP90 strains harboring the expression constructs of 35S:ELUC or 35S:PtRLUC were cultured in Luria Broth liquid medium (MERCK) for 1 day with shaking at 27°C, and then centrifuged at 1800 g for 10 min. The pellet was resuspended in infiltration buffer (10 mM MES, 10 mM MgCl2, and 150 μM acetosyringone; pH 5.7). After adjusting the optical density to 1.0, each buffer containing Agrobacterium was mixed with the same volume of culture harboring the p19k suppressor construct. The mixed cultures were respectively injected into leaves of N. benthamiana using a 1 mL syringe (Terumo). Injected plants were incubated for 2 days.
2.8. Filter unmixing
Excised disks of the infected Nicotiana benthamiana leaves were treated with 200 μM D-Luciferin for 5 min prior to imaging. Luminescence signals through GFP and mCherry filter sets ([GFP] and [mCherry]) were imaged with a luminescence microscope described above at 30 s exposure. After executing clearfield equalization, the intensity of luminescence for 96 pixels in well-focused expressing cells was measured at each pixel using ImageJ. Plots were made from 4 independent biological replicates. Linear regressions were calculated by least square method when the line passes through the origin. Leakage of 35S:PtRLUC into the GFP filter was judged as negligible. Based on the coefficient of the regression line of 35S:ELUC, the following equation by which actual signal intensities of ELUC and PtRLUC ([ELUC] and [PtRLUC]) were estimated.
 $$\begin{align*} \begin{array}{c}\left[\mathrm{ELUC}\right] = \left[\mathrm{GFP}\right]\\ {}\left[\mathrm{PtRLUC}\right] = \left[\mathrm{mCherry}\right] \text{-}0.32\left[\mathrm{GFP}\right]\end{array} \end{align*}$$
To apply this equation to the dual-color luminescence images, the “Math” and “Image calculator” function in ImageJ was used. When exposure time was not equal between [GFP] and [mCherry], the signal intensity of the image taken with a shorter exposure was adjusted to that taken with a longer exposure based on the ratio of the exposure duration before filter unmixing.
2.9. Calculating luminescence intensity at the single cell level
From the bright-field or luminescence images, the coordinates of the pixel at the center of the cell was identified manually with our eyes. Luminescence intensities of the 5 × 5 pixels around the center were extracted and averaged. These processes were carried out for all timepoints by ImageJ macro (Supplemental text file S2).
2.10. Kymograph
For kymograph along proximal-distal axis, the average of the luminescence intensity of pixels located in each column were calculated and ordered along proximal-distal axis. For kymograph along medial-lateral axis, the average of pixels located in each row were calculated and ordered along medial-lateral axis. These processes were carried out for all timepoints. Intensities are represented with pseudo-color according to a color chart. These processes were carried out for all time points by ImageJ macro (Supplemental text file S3).
3. Results
3.1. Setting up a luminescence imaging system adapted for VISUAL
A set-up consisting of an inverted microscope for high-resolution luminescence imaging of cultured cells in VISUAL was established. In this system, an inverted microscope equipped with a high-sensitivity EMCCD camera was placed in a dark chamber (Fig. 1A). For efficient induction of vascular cell differentiation in VISUAL, temperature and light intensities were adjusted to 22°C and 70–90 μmol m-2 s-1, respectively (Kondo et al., Reference Kondo, Nurani, Saito, Ichihashi, Saito, Yamazaki, Mitsuda, Ohme-Takagi and Fukuda2016, Yamazaki et al., Reference Yamazaki, Kondo, Kojima, Takebayashi, Sakakibara and Fukuda2018). Reconstituting the required VISUAL temperature and light parameters was achieved by connecting the camera to a water chiller and installing ventilation fans to prevent the internal temperature from elevating. A liquid culture medium is usually used for VISUAL induction (Kondo et al., Reference Kondo, Nurani, Saito, Ichihashi, Saito, Yamazaki, Mitsuda, Ohme-Takagi and Fukuda2016). For this particular imaging system, however, cotyledons were embedded in polymerized low melting point agarose supplemented with D-Luciferin to enable fixed-point observations (Fig. 1B). Here, cotyledons from Arabidopsis seedlings grown on solid Murashige and Skoog (MS) medium were excised and placed flat on a glass-bottom dish with the adaxial surface facing the bottom of the dish and microscope objective. The cotyledon was then stabilized with a coverslip placed on the abaxial side (Fig. 1B). Since it took about 4 h to distribute D-Luciferin almost uniformly throughout cotyledons (Supplemental Fig. S1), incubation time of at least 5 h was prepared prior to imaging.
Because of weak luminescence from the luciferase reaction, light illumination for VISUAL induction increased image background. To overcome this problem, the microscope was controlled using the software “Cellsense” (Olympus), which allowed repeated cycles of differentiation induction under illuminating period, and luminescence imaging under dark (Fig. 1C). Moreover, a dark phase lasting for 85 sec was provided prior to luminescence imaging to reduce the effect of residual light derived from the illuminating period for successful VISUAL induction. In this analysis, the emerald luciferase (ELUC) containing the PEST sequence, which commits rapid turnover of ELUC by enhancing protein degradation, was used as a short-life luminescence reporter (Leclerc et al., Reference Leclerc, Boockfor, Faught and Frawley2000, Voon et al., Reference Voon, Subrata, Baltic, Leu, Whiteway, Wong, Knight, Christiansen and Daly2005, Nakajima et al., Reference Nakajima, Yamazaki, Nishii, Noguchi, Hoshino, Niwa, Viviani and Ohmiya2010, Yasunaga et al., Reference Yasunaga, Murotomi, Abe, Yamazaki, Nishii, Ohbayashi, Oshimura, Noguchi, Niwa, Ohmiya and Nakajima2015). For detecting ELUC signals specifically, the yellow fluorescent protein (YFP) filter set (515–560 nm) was selected because ELUC has an emission peak of 538 nm (Viviani et al., 2008 ). To verify whether the experimental system worked properly, 35S:ELUC transgenic plants were generated. When excised cotyledon during VISUAL was imaged with the luminescence microscope for 4 days, luminescence of ELUC was successfully detected throughout the vascular differentiation process (Fig. 1D, Supplemental Movie S1). After luminescence imaging was completed, autofluorescence images were acquired from thickened secondary cell walls of induced xylem cells through a cyan fluorescence protein (CFP) filter (Fig. 1D). The captured images of secondary walls confirmed that xylem differentiation was successfully induced in the luminescence imaging system. On the other hand, no luminescent signal of 35S:ELUC was observed in the absence of D-Luciferin, confirming that the luminescence signal of ELUC is detected by this imaging system (Supplemental Fig. S2).
3.2. Quantitative analysis of luminescence images
VISUAL induction takes places in cotyledon mesophyll cells, which have a thickness. To optimize the set of a focal plane (Z-direction) for quantitative analysis, we captured images of VISUAL-induced cotyledon expressing ELUC under the control of ARABIDOPSOS THALIANA HOMEOBOX GENE 8 (AtHB8) promoter at various focal planes. The proAtHB8:ELUC signals were the most brightly detected at the focal plane where the cell outline is clearly visible in the bright-field image. As defocused the focal plane adjusted based on a bright-field image, the luminescence signal was gradually decreased (Supplemental Fig. S3A). Since mesophyll cells are spatially arranged in a plane, here we captured time-lapse images of VISUAL-induced cotyledon after adjusting the focal plane based on the bright-field image (Supplemental movie S2). In the time-lapse movie of proAtHB8:ELUC, we found strong false signals originated from cosmic rays due to long time exposure. Indeed, “Maximum intensity projection” function in ImageJ for obtained time-lapse images detected numerous false signals (Supplemental Fig. S4A). To eliminate these false signals, we utilized the “Remove outliers” function and optimized their parameters (“Radius” and “threshold”) for our luminescence imaging (Li et al., Reference Li, Shan, Desai, Cox, Weinberger and Takahashi2020) (Supplemental Fig. S4, 5). When the parameter was set to “Radius = 3.0” and “Threshold = 10000” for “Remove outliers”, not only were the false positive signals removed efficiently, but the true positive signals were less affected (Supplemental Fig. S5).
Another concern for quantitative imaging is background noise in captured images. For estimating the signal intensity coming from dark background, luminescence images without samples were taken at exposure of 30 s, 1 min, 2 min, 3 min, 5 min and 10 min. The luminescence intensities of all pixels of the image were measured by ImageJ and then their histograms were made using Microsoft Excel (Supplemental Fig. S6A). Despite various exposure times, the averaged intensities of 10 x10 pixels located at the corner and the center show almost constant values (Supplemental Fig. S6B). Then we subtracted the averaged intensity of 10 x10 pixels in the upper left corner from the intensity of all pixels, hereafter called this calculation as “Clearfield equalization”.
3.3. Spatio-temporal dynamics of cambial identity acquisition in VISUAL
To monitor gene expression changes during vascular differentiation, transgenic plants expressing ELUC under the control of the POLIUBIQUITIN 14 (UBQ14) and AtHB8 promoters were used. UBQ14 is a ubiquitously expressed gene and used as an internal control in VISUAL (Kondo et al., Reference Kondo, Fujita, Sugiyama and Fukuda2015; Kondo, Reference Kondo2022), while AtHB8 is a cambium marker gene (Donner et al., Reference Donner, Sherr and Scarpella2009). ELUC luminescence images of cotyledons from these transgenic plants were obtained under the luminescence microscope and then treated with “Remove outliers” and “Clearfield equalization” (Fig. 2A, Supplemental Movie S3, S4, S5, S6). Quantitative analysis of luminescence intensity revealed that temporal changes of ELUC signals followed similar trends as UBQ14 and AtHB8 expression changes in the VISUAL time-course microarray experiments (Furuya et al., Reference Furuya, Saito, Uchimura, Satake, Nosaki, Miyakawa, Shimadzu, Yamori, Tanokura, Fukuda and Kondo2021, Supplemental Fig. S7A–D).
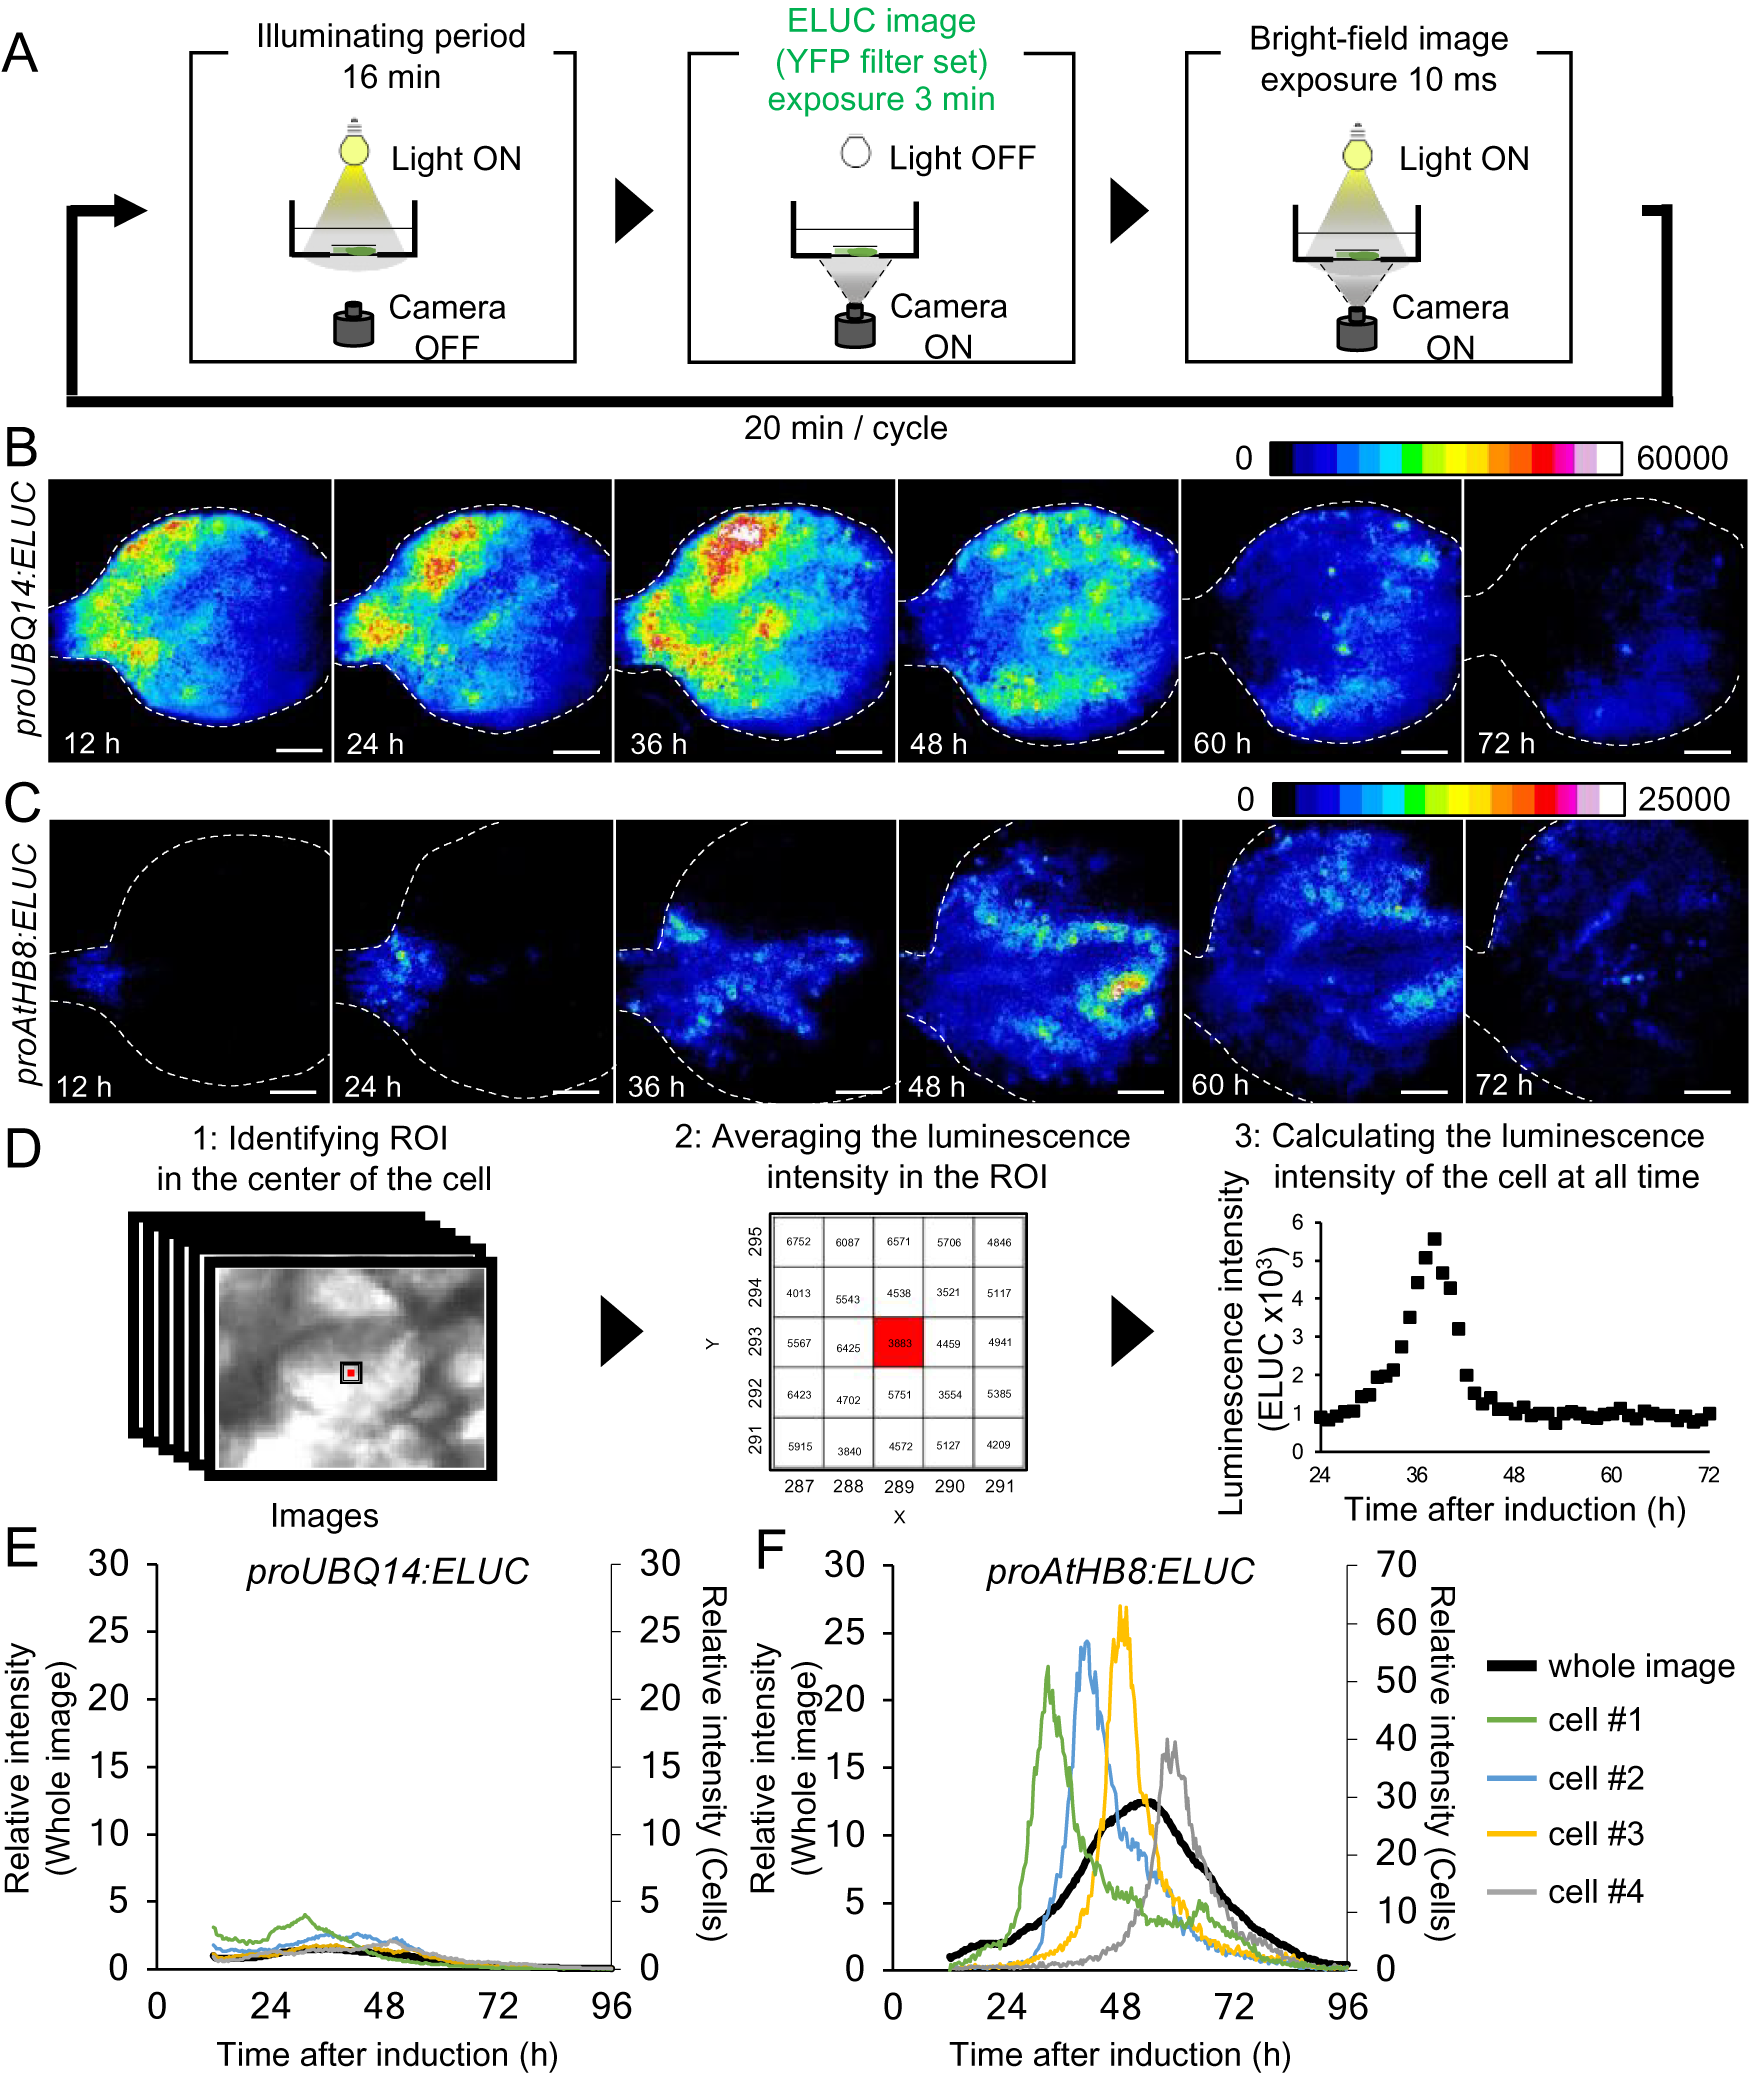
Fig. 2. Comparison of changes in luminescence intensity of proUBQ14:ELUC and proAtHB8:ELUC at the whole organ and single cell level. (a) Schematic diagram of the procedure used for luminescence imaging of transgenic plants expressing proUBQ14:ELUC and proAtHB8:ELUC. (b), (c) Montage of luminescence images of VISUAL-induced cotyledons expressing proUBQ14:ELUC (B) and proAtHB8:ELUC (C). Luminescence intensities are represented as pseudo-color images according to the color chart on the top of the image. The elapsed time from the start of the induction to the time of imaging is indicated at the lower left corner of each pseudo-colored image. Dotted line indicates outline of cotyledon. Scale bars: 400 μm. (d) Schematic diagram for calculating luminescence intensity at the single cell level. (e), (f) Time series data of luminescence intensities in proUBQ14:ELUC (E) and proAtHB8:ELUC (F) at the single cell level. Luminescence intensities were calculated at each time point relative to the whole image at time 12 h. Intensity time series of four distinct cells are highlighted with different colors. Cells are shown as “1” to “4” in Supplemental Fig. S8A and C, respectively. Relative luminescence intensities of the whole image (Supplemental Fig. S7 A, C) are indicated in the same graph as a black solid line.
The spatio-temporal dynamics of cambial identity acquisition was analyzed next from luminescence time-lapse images of proAtHB8:ELUC cotyledons during VISUAL. Pseudo-colored luminescence images showed that proUBQ14:ELUC signals were uniformly distributed throughout the cotyledon during vascular differentiation (Fig. 2B). By contrast, the signal of proAtHB8:ELUC was initially observed only at the bottom of the cotyledon and around the leaf veins 12 h after VISUAL induction. The proAtHB8:ELUC signal gradually shifted to the apical tip of the cotyledon as differentiation progressed (Fig. 2C). To quantify the changes in the luminescence intensity at the single cell level, the average luminescence intensity of 25 (5 × 5) pixels around the central pixel of the cell at each time point, was calculated (Fig. 2D). The time-course of proUBQ14:ELUC signal intensity from individual cells followed a similar trend as the mean intensity values calculated from the whole cotyledon (Fig. 2E, Supplemental Fig. S8A, B). On the other hand, individual cells of proAtHB8:ELUC displayed distinct luminescence peaks that were not detected in whole cotyledon calculations (Fig. 2F, Supplemental Fig. S8C, D). These results suggest that the timing of acquisition of cambial identity differs among individual cells. Furthermore, the data show that the acquisition of cambium identity when examined at the single cell level is more transient than that obtained from whole organ analysis.
3.4. Dual-color luminescence imaging with the luminescence microscope
A red-shifted variant of ELUC from Photinus termitilluminans (PtRLUC) was used for dual-color imaging. This ELUC variant carries two amino acid substitutions that shifts the peak emission wavelength from 538 nm to 602 nm (Nishiguchi et al., Reference Nishiguchi, Yamada, Nasu, Ito, Yoshimura and Ozawa2015, Watanabe et al., Reference Watanabe, Isoda, Muranaka, Ito and Oyama2021). However, the wavelengths of ELUC and PtRLUC partially overlap, which makes it challenging to distinguish the signal of one luciferase variant from the other during dual-color imaging (Nishiguchi et al., Reference Nishiguchi, Yamada, Nasu, Ito, Yoshimura and Ozawa2015). To computationally separate the luminescence of the two luciferase variants, 35S:ELUC and 35S:PtRLUC was transiently expressed respectively into leaves of Nicotiana benthamiana, and then obtained their images using green fluorescent protein (GFP) filter set (495–540 nm) and mCherry filter set (600–690 nm). Each epidermal cell has a distinct number of transgene insertions into distinct sites on chromosomes, thereby expressing LUC at different levels (Supplemental Fig. S9A). The intensity of luminescence for 96 pixels in expressing cells was measured at each pixel using ImageJ function. By plotting the luminescence intensity acquired from 4 independent biological replicates (Supplemental Fig. S9B), a linear relationship was found between the luminescence intensity detected by the GFP and mCherry filters (Fig. 3A, B). From this linear relationship, the equation for the estimation of the actual luminescence intensities of ELUC and PtRLUC, was derived.
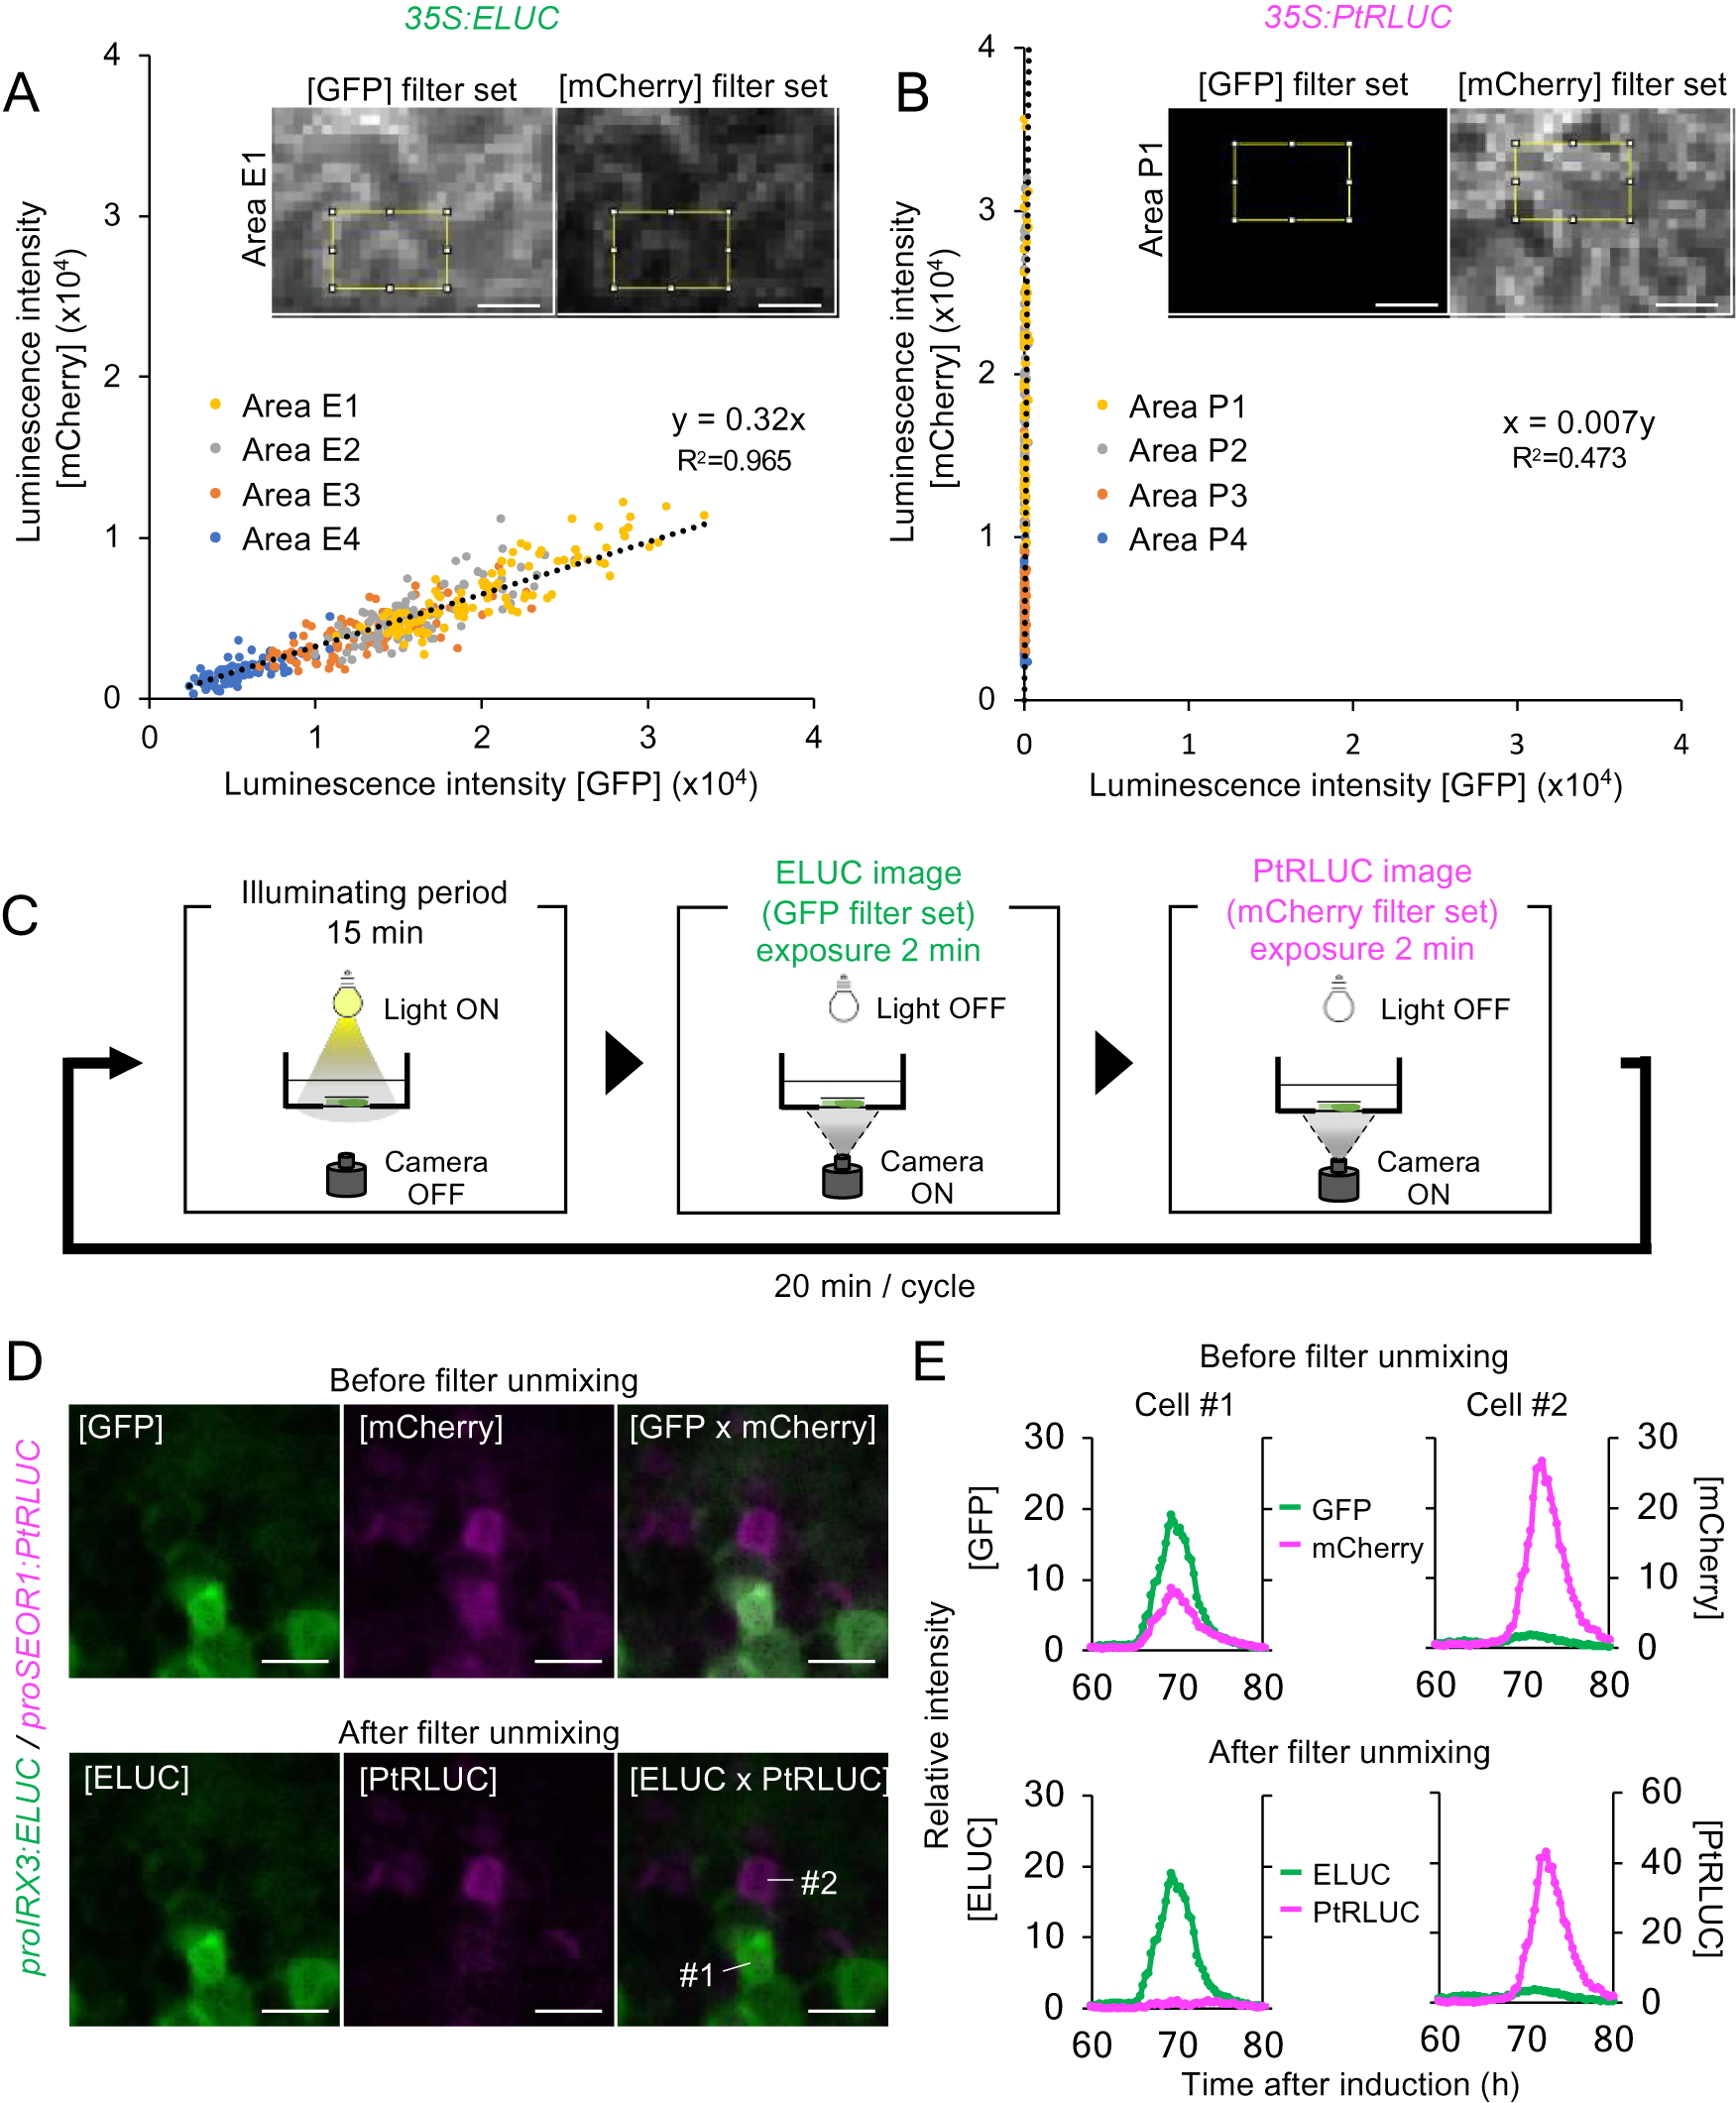
Fig. 3. A method for estimating the actual luminescence intensities of ELUC and PtRLUC. (a), (b) Scatter plot of luminescence intensity of each pixel of the ELUC (A) and PtRLUC signal (B) acquired through the GFP filter set and mCherry filter set, respectively. Luminescence images showing at the upper sides and Supplemental Fig. S9 were captured from Nicotiana benthamiana leaves transiently transformed with 35S:ELUC or 35S:PtRLUC constructs. The yellow square indicates the area from which pixel were obtained. Pixels from four distinct areas are highlighted with different colors. Dotted lines indicate approximated straight lines. Based on these parameters, an equation for estimating the actual luminescence intensities of ELUC and PtRLUC was derived. Scale bars: 20 μm. (c) Schematic diagram of the dual-color imaging procedure for proIRX3:ELUC/proSEOR1:PtRLUC. (d) Luminescence images of VISUAL-induced cotyledons of proIRX3:ELUC/proSEOR1:PtRLUC before and after filter unmixing. [GFP] and [mCherry] indicate the images acquired through that particular filter set. [ELUC] and [PtRLUC] indicate the images after applying the equation of filter unmixing. Scale bars: 100 μm. (e) Time series data of luminescence intensities of proIRX3:ELUC/proSEOR1:PtRLUC at the single cell level before and after filter unmixing. Cells are shown as “1” and “2” in the image of [ELUC x PtRLUC] in (D), respectively. Luminescence intensities were calculated at each time point relative to the average intensity value of all pixels in the image taken at 60 h.
This computational process for the separating overlapping wavelengths of ELUC and PtRLUC is hereafter referred to as filter unmixing, and was tested in differentiating xylem and phloem cells that were each marked with a specific luciferase variant. Xylem and phloem cells are commonly derived from cambial cells during vascular development. To confirm whether the filter unmixing method can be applied to time-lapse imaging of VISUAL-induced cotyledons, dual-color imaging of promoter activity of the late xylem cell marker gene, IRREGULAR XYLEM 3 (IRX3), and the late phloem cell marker gene, SIEVE-ELEMENT-OCCLUSION-RELATED 1 (SEOR1), was performed. Transgenic plants expressing ELUC and PtRLUC under IRX3 and SEOR1 promoters, respectively, were generated. Luminescence images of VISUAL-induced cotyledons expressing proIRX3:ELUC and proSEOR1:PtRLUC were captured using GFP and mCherry filters, respectively (Fig. 3C). Without filter unmixing, ELUC and PtRLUC signals partially overlapped in the same cell (Fig. 3D, Supplemental Movie S7). On the other hand, ELUC and PtRLUC signals were well separated when filter unmixing was applied (Fig. 3D, Supplemental Movie S8). In addition, temporal changes in luminescence intensity of ELUC and PtRLUC were well separated at the single cell level (Fig. 3E). The results show that filter unmixing was successful in capturing the promoter activities of two genes at high spatio-temporal resolution.
3.5. Spatio-temporal dynamics of vascular cell differentiation in VISUAL
Using the unmixed time-course images of proIRX3:ELUC and proSEOR1:PtRLUC, the spatio-temporal dynamics of xylem and phloem cell differentiation in VISUAL-induced cotyledons was investigated (Fig. 4A). At 30 h after VISUAL induction, proIRX3:ELUC signals increased around the cotyledon veins. At 36 h, proSEOR1:PtRLUC signals were dominant at the base of the cotyledon. At 48 h, proIRX3:ELUC signals increased at the cotyledon base. However, the region in the cotyledon base, in which proIRX3:ELUC increased, was different from that of proSEOR1:PtRLUC. Luminescence signals of proIRX3:ELUC and proSEOR1:PtRLUC sequentially shifted to the apical region of the cotyledon at later time points (i.e., 60–72 h). To investigate the relationship between cell position and xylem/phloem differentiation in more detail, the distribution of ELUC and PtRLUC signals was calculated along the apical-basal or medial-lateral axis, and the temporal changes were represented as kymographs (Fig. 4B). These kymographs showed that signal distribution of proIRX3:ELUC and proSEOR1:PtRLUC changed sequentially along the basal-to-apical axis, while no clear relationship along the central-lateral axis was observed.
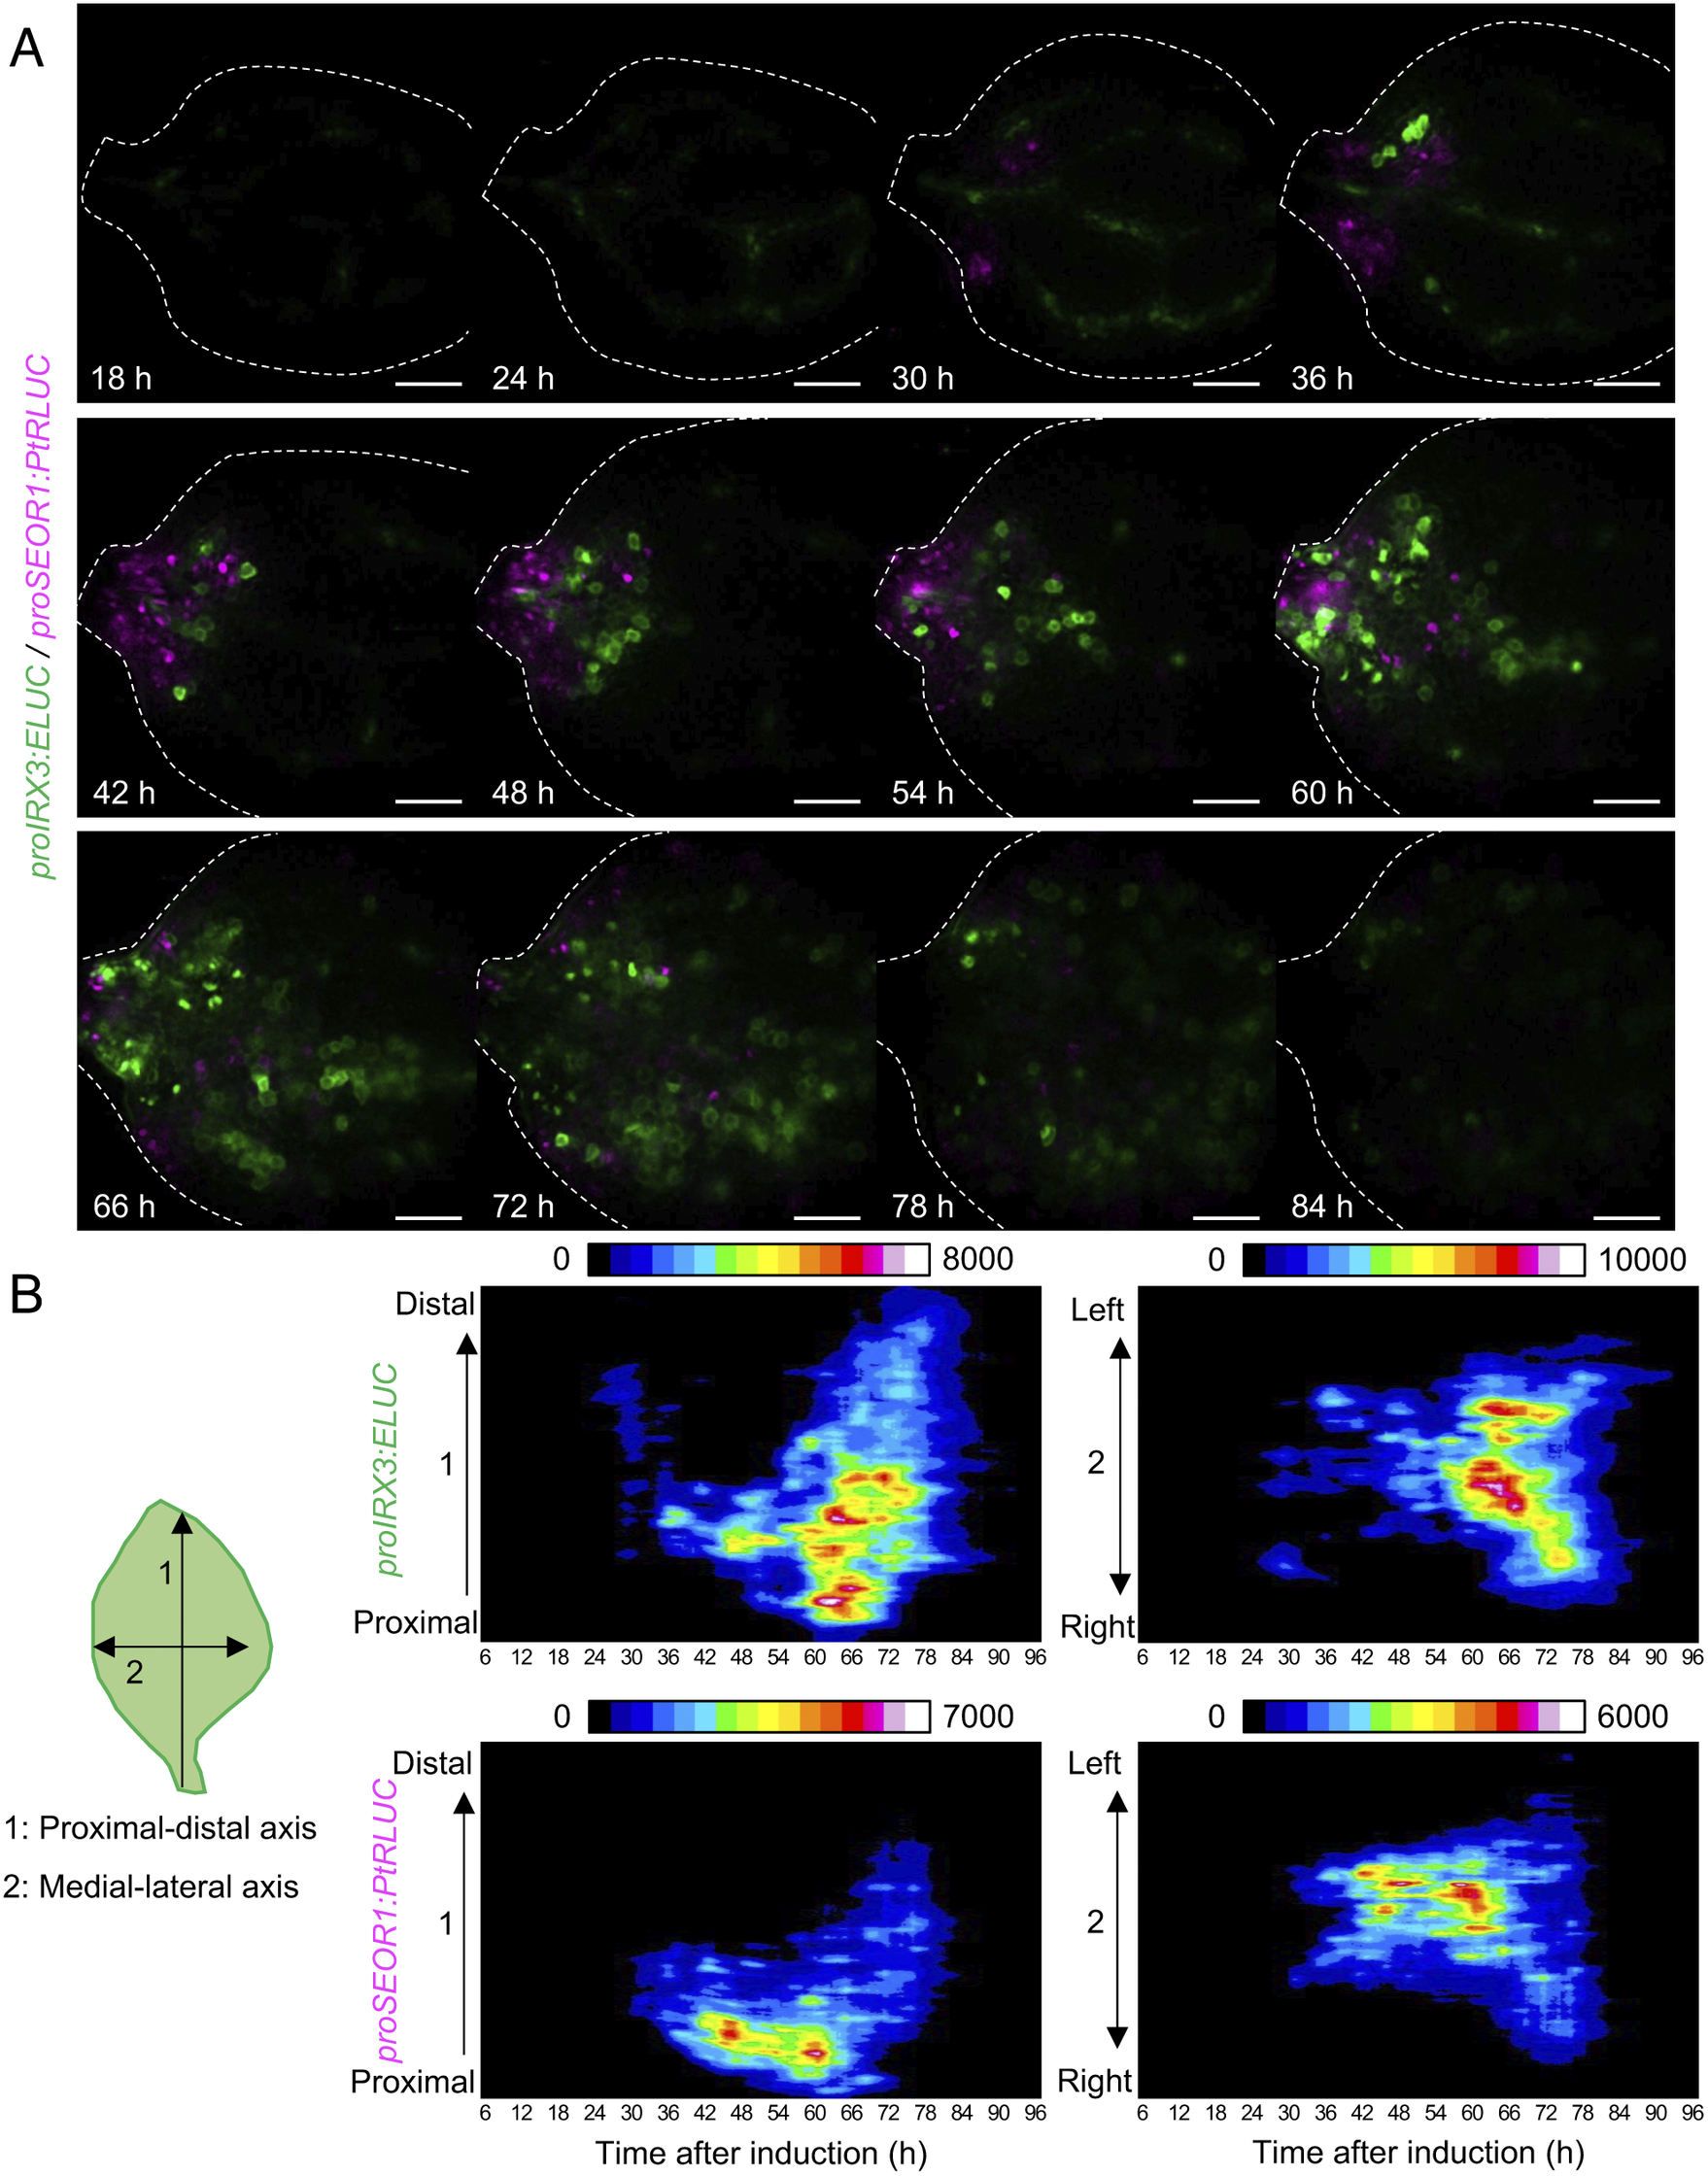
Fig. 4. Spatio-temporal changes in luminescence intensity of proIRX3:ELUC/proSEOR1:PtRLUC. (a) Montage of luminescence images of VISUAL-induced cotyledons expressing proIRX3:ELUC/proSEOR1:PtRLUC. ELUC and PtRLUC signals are shown in green and magenta, respectively. The elapsed time from the start of the induction to the time of image capture is indicated at the lower left corner of each image. Dotted line indicates outline of cotyledon. Scale bars: 400 μm. (b) Kymograph of luminescence intensity of proIRX3:ELUC and proSEOR1:PtRLUC corresponding to images shown in (A). 1: the proximal-distal axis and 2: the medial-lateral axis. Luminescence intensities are presented as pseudo-colored images according to the color chart on the top of each image.
Our previous co-expression network analysis of vascular development with VISUAL categorized vasculature-related genes into four distinct modules: procambium-, cambium-, xylem-, and phloem-modules (Furuya et al., Reference Furuya, Saito, Uchimura, Satake, Nosaki, Miyakawa, Shimadzu, Yamori, Tanokura, Fukuda and Kondo2021). To capture the process of acquiring cambial identity in a spatial-temporal manner, the GRETCHEN HAGEN 3.1 (GH3.1) genes from the procambial-related module, and the NAC004 gene from cambium-related module, were selected. Transgenic plants expressing proNAC004:ELUC and proGH3.1:PtRLUC in the background of the phloem fluorescent marker, proSEOR1:SEOR1-YFP, were generated. Dual-color luminescence time-lapse imaging was used to monitor signals from proGH3.1:PtRLUC- and proNAC004:ELUC-expressing cotyledons at 27–36 h, and at 30–45 h, respectively, after the start of VISUAL induction (Fig. 5A, B, Supplemental Movie S9,S10). Results showed that the activation of the GH3.1 promoter occurred earlier than that of the NAC004 promoter, which is consistent with findings from the co-expression gene network analysis (Furuya et al., Reference Furuya, Saito, Uchimura, Satake, Nosaki, Miyakawa, Shimadzu, Yamori, Tanokura, Fukuda and Kondo2021).

Fig. 5. Comparison of luminescence intensity changes between xylem and phloem cells of proNAC004:ELUC/proGH3.1:PtRLUC lines. (a) Schematic diagram of the procedure for dual-color imaging of proNAC004:ELUC/proGH3.1:PtRLUC. (b) Montage of luminescence images of VISUAL-induced cotyledons expressing proIRX3:ELUC/proSEOR1:PtRLUC. ELUC and PtRLUC signals are shown in green and magenta, respectively. The elapsed time from the start of the induction to the time of image acquisition is indicated at the lower left corner of each image. Images were captured using GFP and mCherry filter sets, and ELUC images and PtRLUC images were calculated by filter unmixing. Dotted line indicates outline of cotyledon. Scale bars: 200 μm. (c) Fluorescence image of a VISUAL-induced cotyledon expressing proNAC004:ELUC/proGH3.1:PtRLUC/proSEOR1:SEOR1-YFP using CFP and YFP filter sets after completing LUC imaging. Autofluorescence signal of xylem cells detected by the CFP filter set, and YFP signals representing induced phloem cells, are shown in blue and yellow, respectively. Dotted line indicates outline of cotyledon. Scale bars: 200 μm. (d) Time series data of luminescence intensities of ELUC (green) ant PtRLUC (magenta) of xylem cells and phloem cells which are shown as “X1”-“X3” and “P1”-“P3” corresponding to the image in (C), respectively. Luminescence intensities were calculated at each time point relative to the average intensity value of all pixels in the image taken at 24 h.
3.6. Cell fate tracking analysis using phloem fluorescence markers
Xylem and phloem cells arise from vascular stem cells located inside the cambium (Smetana et al., Reference Smetana, Mäkilä, Lyu, Amiryousefi, Sánchez Rodríguez, Wu, Solé-Gil, Leal Gavarrón, Siligato, Miyashima, Roszak, Blomster, Reed, Broholm and Mähönen2019, Shi et al., Reference Shi, Lebovka, López-Salmerón, Sanchez and Greb2019). However, it is not clear whether future xylem and phloem cells differ in the acquisition of cambium identity. To address this question, cell fate tracking analysis was carried out. This method involved visualizing the secondary cell wall of induced xylem cells with CFP filters, and then imaging the signal of the phloem marker, proSEOR1:SEOR1-YFP, with YFP filters to determine cell fates after completing luminescence imaging (Fig. 5C). ELUC and PtRLUC signals were quantified at the single cell level by comparing LUC time-lapse movies and the fluorescence images, while visually distinguishing xylem from phloem cells. Regardless of whether cells differentiated into xylem or phloem, the initial increase in proGH3.1:PtRLUC signal followed by the subsequent rise in proNAC004:ELUC signal, occurred in a common pool of precursor cells (Fig. 5D). This result suggests that the transition from the procambium to cambium is a common event in the establishment of xylem and phloem cell identity in VISUAL-induced cotyledons.
4. Discussion
In this study, time-lapse luminescence imaging of VISUAL-induced cotyledons with a luminescence microscope was successfully performed (Fig. 1A). By eliminating noise caused by residual light before and during imaging, weak single-cell luminescence signals were captured as movies (Fig. 1D, 4A, 4B, Supplemental Movie S1, S3, S5). For example, the promoter activity of AtHB8, a cambial cell marker gene, showed clear peaks at the single cell level (Fig. 2F). This result revealed that luminescence imaging can detect differences in the timing of gene expression among individual cells, which are masked in whole cotyledons. In addition, the utility of combining VISUAL with luminescence microscope to visualize spatio-temporal dynamics of vascular cell differentiation was demonstrated by experiments showing that cambial cell formation initiated at the basal part of the cotyledon before gradually propagating toward the tip (Fig. 2C). This result suggests that the progressive stages of cambium formation depend on cell location within the cotyledon, which may result from the differential distribution of chemical compounds and/or phytohormones from the VISUAL induction medium.
The method described here also enabled promoter activity of two genes to be imaged simultaneously. This was accomplished by using ELUC and its variant, PtRLUC, which have different peak emission wavelengths. Simultaneous imaging of IRX3 and SEOR1 promoters revealed that xylem and phloem genes are expressed at distinct cellular regions in VISUAL-induced cotyledons, suggesting that late xylem and phloem cell identities do not overlap (Fig. 4A, Supplemental Movie S8). Furthermore, simultaneous imaging of GH3.1 and NAC004 promoters, which were identified in the procambial gene module and cambial gene module, respectively, was performed (Furuya et al., Reference Furuya, Saito, Uchimura, Satake, Nosaki, Miyakawa, Shimadzu, Yamori, Tanokura, Fukuda and Kondo2021). The promoter activities of both genes increased in a common order (i.e., from GH3.1 to NAC004) among the cells that ultimately differentiated into xylem and phloem. These findings demonstrated temporal transitions in cell identity from the procambium to cambium (Fig. 5D). Thus, the luminescence imaging system developed here enabled the visualization of the spatio-temporal relationships between two distinct cell fates.
The luminescence imaging system established in this study successfully monitored spatio-temporal gene expression dynamics at the single cell level. Such events are usually masked in whole tissue- or organ-level analysis. While circadian clock-related genes oscillate synchronously in each cell, numerous reports show that non-synchronized gene expression dynamics among cells are involved in cell differentiation during organogenesis. Computer simulations suggest that multipotent stem cells have more complex oscillatory gene expression dynamics at the cellular level than those of differentiated cells (Furusawa and Kaneko, Reference Furusawa and Kaneko2012). Indeed, animal neural stem cells exhibit oscillatory expression of multiple fate-determination factors, while cells in a differentiated state possess sustained expression of only a single factor (Imayoshi et al., Reference Imayoshi, Isomura, Harima, Kawaguchi, Kori, Miyachi, Fujiwara, Ishidate and Kageyama2013). Therefore, the luminescence imaging system established in this study offers a powerful tool for quantitatively detecting non-synchronized gene expression dynamics that underlie growth and development.
Quantification of not only gene expression, but also hormones or the signals they transduce, is essential for understanding morphogenesis. In plants, phytohormones such as auxin and cytokinin are differently synthesized, metabolized, and transported in a position-dependent manner. For instance, a synthetic auxin-responsive promoter (Ulmasov et al., Reference Ulmasov, Murfett, Hagen and Guilfoyle1997) reveals that auxin responses oscillate in the root basal meristem and elongation zone to determine the position of lateral root founder cells (Moreno-Risueno et al., Reference Moreno-Risueno, Van Norman, Moreno, Zhang, Ahnert and Benfey2010). Moreover, competitive interactions between auxin and cytokinin play essential roles in forming tissue boundaries during growth and development (reviewed in Schaller et al. Reference Schaller, Bishopp and Kieber2015). The luminescence imaging system described here has the potential to visualize spatio-temporal dynamics of hormone responses at the cellular level. In contrast to the confocal microscope, the luminescence microscope detects signals from unfocused planes (Supplemental Fig. S3), which may cause a risk in quantitative analysis especially with three-dimensional (3D) structured tissues. Luminescent imaging system with high spatial resolution for Z axis needs to be developed for further studies.
Despite the ability of the luminescence imaging system to monitor gene expression at the single cell level, it is not yet applicable to use for comprehensive gene expression analysis. In the future, spatio-temporal monitoring of gene expression dynamics by luminescence imaging combined with transcriptome analysis, is expected to reveal plant developmental mechanisms that are difficult to uncover by whole tissue- and organ-level analysis.
Acknowledgements
We thank Yuki Fukaya, Akiho Suizu, Ayako Hata and Risa Wakasugi for technical support.
Financial support
This work was funded by the Ministry of Education, Culture, Sports, Science and Technology, Japan (Scientific Research on Priority Areas and Scientific Research on Innovative Areas; grant nos. 17H06476, 20H05407 and 22H04720 to Y.K.), by the Japan Society for the Promotion of Science (grant nos. 21J20775 to S.S., grant nos. 20K15813 to T.F., grant no. 21H02500 to H.F., and grant nos. 20K15815 and 22H02647 to Y.K.), and by the Sasakawa Scientific Research Grant from The Japan Science Society (grant nos. 2019-4018 to S.S.).
Conflict of interest
The authors declare no competing interests.
Authorship contribution
S.S. and Y.K. designed the experiments, coordinated the project; S.S, Y.O, and Y.K. performed the experiments; S.S, T.F, and Y.K. wrote the manuscript; H.F. participated in discussions. All authors reviewed and edited the manuscript.
Data availability statement
The data reported in this study are available from the corresponding author upon request.
Supplementary Materials
To view supplementary material for this article, please visit http://doi.org/10.1017/qpb.2022.12.


 Open access
Comments
Dear editors for Quantitative Plant Biology,
We are submitting a manuscript entitled, “Visualization of the spatio-temporal cell fate dynamics at the single cell level using luminescence microscope” by S. Shimadzu et al. where we established a luminescence imaging system and monitored spatio-temporal dynamics of cell fate markers at the single cell level during vascular development in vascular cell induction system named VISUAL. This system enables dual-color imaging to detect gene expression dynamics associated with cell identity transition in a spatio-temporal manner. It would be appreciated if you kindly considerate its suitability for publication in Quantitative Plant Biology.
Plants produce various organs additionally from the stem cell regions maintained at the shoot apex and root tips. During plant development, stem cell fates should be strictly regulated spatio-temporally by cell-cell communication. To achieve the better understanding of plant growth and development with a high spatio-temporal resolution, a method that can monitor and quantify the gene expression dynamics at the single cell level has been highly desired. So far, various kinds of techniques have been developed for the spatial or temporal analysis of gene expression in plants, but it is difficult to analyze both spatial and temporal information at the same time. For spatio-temporal analysis, time-lapse imaging using fluorescence reporters has been widely performed. However, the use of fluorescence reporters causes a risk of autofluorescence and photobleaching, which affects quantitative and long-term time-lapse imaging. Unlike fluorescence reporters, luminescence reporters do not require excitation light, thus offering a potency to achieve the spatio-temporal analysis.
In this study, we established an imaging system for luciferase reporters and optimized it for vascular cell induction system named VISUAL1. Vascular development involves a relatively simple developmental process, in which cambial cells behave as vascular stem cells to produce xylem and phloem cells into the opposite side2,3. We successfully monitored changes in promoter activity of vascular-related genes at spatio-temporal resolution. Interestingly, each single cell had a sharp peak of luminescence of a cambium marker proAtHB8:ELUC at different time point. Furthermore, dual-color luminescence imaging successfully captured a spatio-temporal relationship between two distinct cell fates; xylem-phloem and procambium-cambium. Thus, our luminescence imaging system visualizes the spatio-temporal dynamics during plant vascular development at the single cell level.
Reference lists
1. Kondo et al. 2016. Vascular Cell Induction Culture System Using Arabidopsis Leaves (VISUAL) Reveals the Sequential Differentiation of Sieve Element-Like Cells. Plant Cell, 28, 1250-1262.
2. Smetana et al., 2019. High levels of auxin signalling define the stem-cell organizer of the vascular cambium. Nature, 565,485-489
3. Shi et al., 2019. Bifacial cambium stem cells generate xylem and phloem during radial plant growth. Development, 146(1), dev171355
Our submission includes:
manuscript,
5 figures comprising 20 separate panels in total,
and Supplemental Information (1 Figures, 1 Tables, and 5 Movies).
Our manuscript includes:
85 characters in title,
150 words in abstract
4606 words in main text,
and 39 references,
List of supplemental data:
Supplemental Figure 1
(Additional supporting data that would be of interest only to specialists)
Supplemental table 1
(Additional supporting data that would be of interest only to specialists)
Supplemental Movie 1 - 6
(Large-scale data sets that are impractical to include in the main manuscript.)
The authors declare no conflict of interest.
Information on corresponding author:
Yuki Kondo, PhD, Associate Professor
Department of Biology, Graduate School of Science,
Kobe University, 1-1, Rokkodai-cho, Nada-ku, Kobe-city, 657-8501, Japan
TEL: +81-78-803-5724, e-mail: pkondo@tiger.kobe-u.ac.jp
The authors:
Shunji Shimadzu1,2, Tomoyuki Furuya2, Hiroo Fukuda3, Yuki Kondo2*
Affiliation:
1Graduate School of Science, The University of Tokyo, Tokyo, Japan
2Graduate School of Science, Kobe University, Kobe, Japan
3Department of Bioscience and Biotechnology, Faculty of Bioenvironmental Science, Kyoto University of Advanced Science, Kameoka, Japan
We declare that this manuscript is original, has not been published before, and is not currently being considered for publication elsewhere. We hope you find our manuscript suitable for publication, and we are looking forward to hearing from you.
Sincerely yours,
Yuki Kondo
Department of Biology, Graduate School of Science,
Kobe University, 1-1, Rokkodai-cho, Nada-ku, Kobe-city, 657-8501, Japan
TEL: +81-78-803-5724, e-mail: pkondo@tiger.kobe-u.ac.jp