


INTRODUCTION
The spotted hyena, Crocuta crocuta (Erxleben 1777), is currently native to Africa, but during the Pleistocene the species inhabited large areas of Eurasia (Werdelin and Solounias Reference Werdelin and Solounias1991; Lewis and Werdelin Reference Lewis and Werdelin2022). There it was an important member of the mammoth steppe ecosystem (Kurtén Reference Kurtén1968; Kahlke Reference Kahlke1999). European populations, often referred to as cave hyenas and sometimes grouped into a separate subspecies or species, C. c. spelaea or C. spelaea, became extinct by the end of the Late Pleistocene (Stuart and Lister Reference Stuart and Lister2014). Their disappearance was among the early signals of the late Quaternary megafaunal mass extinction (Koch and Barnosky Reference Koch and Barnosky2006; Stuart and Lister Reference Stuart and Lister2014).
A large-scale radiocarbon (14C) survey by Stuart and Lister (Reference Stuart and Lister2014) revealed that cave hyena disappeared from Central and Eastern Europe ca. 40 ka BP and survived until ca. 31 ka BP in the western and southern parts of the continent. However, of the 104 14C dates available for cave hyena remains from Europe by 2014, only 15 of them were from Central Europe. Recently published 14C dates from Lindenthaler Höhle (Westbury et al. Reference Westbury, Hartmann, Barlow, Preick, Ridush, Nagel, Rathgeber, Ziegler, Baryshnikov and Sheng2020) provided evidence of quite late occurrence of hyena in eastern Germany, as late as ca. 22 ka BP. This suggests that the European cave hyena extinction was more complex, and hyenas could have survived longer in some parts of Central Europe. Therefore, more chronological data from variable regions are needed to comprehensively understand the paleobiogeography of the hyena’s late populations and the complexity of their extinction.
In this paper, we investigated the population’s evolutionary history from a region so far weakly studied, the Polish Jura in southern Poland. We focused here on a Late Pleistocene cave hyena den recently discovered at Perspektywiczna Cave. We used direct 14C dating supported by genetic and stable isotope data to infer the paleobiology of this population. The results brought important evidence of the cave hyena regional survival and its genetic variabilty in Central Europe.
The Site—Perspektywiczna Cave and Its Hyena Den
Perspektywiczna Cave is located in Udorka Valley (50°26’33.5’N, E 19°46’1.5’E), in the middle part of Kraków-Częstochowa Upland, southern Poland. The cave includes two chambers and a gallery between them (Figure 1). Its size is difficult to estimate, as some parts of the cave are totally filled with sediments. Two entrances, facing W and NW, are situated at elevations of 340 m and 345 m above the sea level (Krajcarz et al. Reference Krajcarz, Krajcarz, Sudoł-Procyk, Tyc, Krajcarz, Sudoł-Procyk and Krajcarz2022).

Figure 1 The site, Perspektywiczna Cave. Localization map and plan of the cave are shown in panels (a) and (b); hatched fields in (b) are for excavated area. Panel (c) shows simplified stratigraphic logs of the sedimentary fills of cave chambers (after Krajcarz et al. Reference Krajcarz, Krajcarz, Sudoł-Procyk, Tyc, Krajcarz, Sudoł-Procyk and Krajcarz2022) and the distribution of hyena-related fossils within the stratigraphy.
The excavations began in 2012 and uncovered about 30 m2 by 2022. The sedimentary fill of the upper chamber is poorly known. The 2013 and 2022 test pittings were the only excavations in this part so far. It revealed Holocene series (layer C1) disturbed by badger burrowing, and gray and yellowish-brown loamy sands with limestone debris (layers C2 and C3) below it (Figure 1). This sediment was dated to early Marine Isotopic Stage (MIS) 3 on the basis of 14C dating of cave bear bones (Krajcarz et al. Reference Krajcarz, Pacher, Krajcarz, Laughlan, Rabeder, Sabol, Wojtal and Bocherens2016a). It is rich in coprolite fragments and gnawed and/or digested bone fragments, and few cave hyena bones and teeth—an assemblage typical for hyena den deposits (Brugal et al. Reference Brugal, Fosse, Guadelli, Hannus, Rossum and Winham1997; Fosse Reference Fosse, Turner and Gaudzinski1999; Diedrich and Žák Reference Diedrich and Žák2006; Villa et al. Reference Villa, Sánchez Goñi, Bescós, Grün, Ajas, García Pimienta and Lees2010; Orbach and Yeshurun Reference Orbach and Yeshurun2021; Palomares et al. Reference Palomares, Ruiz-Villar, Morales-González, Calzada, Román, Rivilla, Revilla, Fernández-Gil and Delibes2022).
The lower chamber was intensively excavated in 2012–2019. It contains thick Late Glacial (layers 9, 9a) and Holocene (layers 8–1) series of gravels, silts, loams, and limestone debris (Figure 1), with archaeological material of Late Paleolithic, Mesolithic, and Middle Ages (Krajcarz et al. Reference Krajcarz, Krajcarz, Sudoł-Procyk, Tyc, Krajcarz, Sudoł-Procyk and Krajcarz2022). The series comprises eolian, alluvial, and colluvial deposits, moderately bioturbated. Within the series there are two lenses of sandy loams (layers 7c and 4a), of similar lithology and faunal composition to the layer C3 from the upper chamber. These strata can be regarded as colluvially re-deposited sediments of the hyena den. Hyena remains and hyena-related (gnawed, digested) bones were found within these strata. Isolated finds were also found among other stratigraphic units of the Holocene series, both in the lower and upper chambers, likely dispersed by post-depositional processes (such as colluvial activity, anthropic digging, and burrowing).
The taphocenosis consisted of remains of adult, senile and juvenile hyena individuals. Remains of prey belonged to a number of large ungulates, including reindeer, woolly rhino, steppe bison, giant deer, and mammoth. Moreover, some cave bear and cave hyena bones were also heavily gnawed.
METHODS
Material
Our research materials were hyena bones and teeth coming from several stratigraphic contexts in Perspektywiczna Cave: (1) as in situ deposit in the upper chamber (layer C3); (2) in a secondary position within compact packets of colluvially re-deposited deposits (layers 7c and 4a); and (3) secondarily dispersed among the cave fill. Despite their stratigraphic positions, we considered all these fossils to represent a single original taphocenosis. Attribution to a single assemblage was suggested by: (i) the presence of one original context (layer C3); (ii) distribution of bones in the Holocene series, so in sediments likely much younger than a hyena extinction in Europe, and thus indicating the post-depositional dispersal; and (iii) similar appearance of bones from variable stratigraphic contexts (similar color, bone density, external surface preservation state). Nevertheless, all studied bones were assumed to be directly 14C dated to check their chronological attribution.
The taxonomy was preliminary identified on the basis of bone/tooth morphology and then checked by mtDNA analysis (see the Paleogenetic Analysis section). We also selected 100 unidentifiable digested bone fragments to be checked by ZooMS proteomics method (at BioArCh, University of York) and those exhibiting carnivoran affiliation were then tested by mtDNA analysis. Only those confirmed to be hyenas were taken for further analyses. The details of our research material are presented in the Appendix.
14C Dating
We performed 14C dating directly on 19 hyena remains (18 bones and 1 tooth); two more bone fragments were too small to be sampled, so only mtDNA and stable isotope analyses were done on them. The analyzed fraction was collagen. First, the macroscopic sediment remains were drilled off from the external surfaces with a diamond-coated bit. Then, fossils were bathed in an ultrasonic cleaner, first in acetone to break down clay mineral aggregates, then several times in demineralized water, until water was visually clean, to remove any remained sediment and dirt. The collagen extraction followed Longin (Reference Longin1971) with further modifications according to Piotrowska and Goslar (Reference Piotrowska and Goslar2002). Briefly: mechanical crushing to grain size <0.3 mm; 2M HCl treatment (room temp., 20 min); centrifugation and residuum collection; 0.1M NaOH treatment (room temp., 1 hr); centrifugation and residuum collection; HCl pH=3 maceration (temp. 80°C, 10 hr); centrifugation and supernatant collection. The extracts were ultrafiltered on pre-cleaned Vivaspin 15 MWCO 30 kD filters (Bronk Ramsey et al. Reference Bronk Ramsey, Higham, Bowles and Hedges2004). Quality of the collagen was assessed basing on C:N atomic ratio (interval of acceptance: 2.9–3.6) (DeNiro Reference DeNiro1985; Ambrose Reference Ambrose1990) and collagen extraction yield (acceptance threshold: 0.5%).
For most samples, CO2 was produced by combustion in closed (sealed under vacuum) quartz tubes with CuO and Ag wool (temp. 900°C, 10 hr). The gas was dried in a vacuum line and reduced with hydrogen (H2), using 2 mg of Fe powder as a catalyst. For samples processed more recently (in this paper: all samples with Poz- numbers above 100000) combustion and reduction of the obtained CO2 was performed with automated graphitization system AGE (Wacker et al. Reference Wacker, Němec and Bourquin2010) coupled with elemental analyser vario ISOTOPE select (Elementar). The obtained carbon and iron mixture was then pressed into aluminum holder (Goslar and Czernik Reference Goslar and Czernik2000; Czernik and Goslar Reference Czernik and Goslar2001).
Content of 14C, 13C, and 12C in a carbon sample was measured in the spectrometer “Compact Carbon AMS” (National Electrostatics Corporation, USA) (Goslar et al. Reference Goslar, Czernik and Goslar2004). “Oxalic Acid II” and 14C-free coal were used as standards. Conventional 14C age was calculated using correction for isotopic fractionation (Stuiver and Polach Reference Stuiver and Polach1977), basing on 13C/12C and 14C/12C ratios. The 1σ uncertainty of conventional 14C age were given.
A specimen that showed the youngest 14C age was cross-checked by dating the collagen in an independent facility, the Laboratory of Ion Beam Physics, Zurich (Switzerland). The remaining portion of collagen of less than 0.1 mg, which was prepared for stable isotopes analysis at Tübingen, was analyzed using the gas ion source (Ruff et al. Reference Ruff, Fahrni, Gäggeler, Hajdas, Suter, Synal, Szidat and Wacker2010) of MICADAS (Synal et al. Reference Synal, Stocker and Suter2007). 14C age of such small sample required a correction for constant contamination (Haghipour et al. Reference Haghipour, Ausin, Usman, Ishikawa, Wacker, Welte, Ueda and Eglinton2019).
We calibrated the obtained 14C ages with the IntCal20 14C calibration curve (Reimer et al. Reference Reimer, Austin, Bard, Bayliss, Blackwell, Bronk Ramsey, Butzin, Cheng, Edwards and Friedrich2020), using OxCal ver. 4.4.4 software (Bronk Ramsey Reference Bronk Ramsey2009). For summarizing the dating results, we used sum distributions and kernel density model (KDE) in OxCal following Bronk Ramsey (Reference Bronk Ramsey2017). In KDE we used default parameters, as recommended (Bronk Ramsey Reference Bronk Ramsey2017; Carleton and Groucutt Reference Carleton and Groucutt2021).
Paleogenetic Analysis
Mitochondrial DNA (mtDNA) analyses were performed in dedicated ancient DNA facilities at the Centre of New Technology, University of Warsaw, following strict rules recommended to work with aDNA preventing any kind of contamination. The small fragment of bones has been cut off, washed with ultrapure water and 0.05% bleach, UV-irradiated (250 nm) for 10 minutes from each side and powdered in a cryogenic mill (SPEX CentriPrep, Stanmore, UK). Around 100 mg of the bone powder was used for DNA extraction, which was carried out using silica magnetic beads according to Rohland et al. (Reference Rohland, Glocke, Aximu-Petri and Meyer2018). DNA extracts were directly converted to double-indexed single-strand libraries according to Gansauge et al. (Reference Gansauge, Aximu-Petri, Nagel and Meyer2020) with prior half-UDG treatment. Target enrichment of mtDNA was performed following Horn (Reference Horn, Shapiro and Hofreiter2012). To obtain bait we amplified, sonicated, and enzymatically modified mitogenome of modern brown hyena. High-throughput sequencing was performed on Illumina NextSeq and NovaSeq platforms (paired mode, 2x75bp and 2x50bp, respectively).
Raw Illumina reads were demultiplexed using bcl2fastq v2.20 (Illumina Inc.). Adapter sequences were trimmed and paired-end collapsed with Adapter Removal v2.2.3 (Schubert et al. Reference Schubert, Lindgreen and Orlando2016). Filtered reads were mapped to mitochondrial genome of European cave hyena (GenBank accession number JF894379). Duplicates, short reads (<30) and reads with low mapping quality (Q<30) were removed using SAMtools v1.9 (Li et al. Reference Li, Handsaker, Wysoker, Fennell, Ruan, Homer, Marth, Abecasis and Durbin2009). We applied bcftools package to call consensus sequences and positions covered with less than 3 reads were masked with N. All BAM files were manually checked using Tablet v1.17 (Milne et al. Reference Milne, Bayer, Cardle, Shaw, Stephen, Wright and Marshall2010).
Authenticity of the obtained sequences was evaluated with MapDamage2.0 (Jónsson et al. Reference Jónsson, Ginolhac, Schubert, Johnson and Orlando2013). Phylogenetic analyses were performed using BEAST v.1.10.4 (Suchard et al. Reference Suchard, Lemey, Baele, Ayres, Drummond and Rambaut2018) and dataset of extant and ancient hyenas analyzed by Hu et al. (Reference Hu, Westbury, Yuan, Zhang, Chen, Xiao, Hou, Ji, Lai, Hofreiter and Sheng2021) (see Supplementary Information for details about the analysis).
Stable Isotopes Analysis
We tested the studied specimens for carbon (δ 13C), nitrogen (δ 15N) and sulfur (δ 34S) stable isotope signal in bone collagen. We did not analyze the tooth specimen due to isotopic inconsistency between bone collagen and dentine collagen ecophysiological record (Bocherens Reference Bocherens2015).
First, the fossils were cleaned as for 14C dating. Then ca. 0.5 g samples cut off using a rotary diamond-coated saw and crushed to grain size <0.7 mm. The extraction followed Bocherens et al. (Reference Bocherens, Billiou, Patou-Mathis, Bonjean, Otte and Mariotti1997). Briefly: 1M HCl treatment (room temp., 20 min); filtration and residuum collection; 0.125M NaOH treatment (room temp., 20 hr); filtration and residuum collection; pH=2 HCl gelatinization (temp. 100°C, 17 hr); filtration and supernatant collection; lyophilization. Internal standards of modern elk and seal bones underwent collagen extraction and measurements together with fossil samples, to control the process.
Quality of extracted collagen was checked by measuring the C and N content and calculating the C:N atomic ratio. The reproducibility error for the amounts of C and N was lower than 1%, and lower than 2% for S. The acceptable ranges were >5% for the N content and 2.9–3.6 for C:N atomic ratio (DeNiro Reference DeNiro1985; Ambrose Reference Ambrose1990).
Elemental analysis and isotopic measurements were performed at facilities of the Geography working group of the University of Tübingen (Germany) using a CHNOS Vario Isotope Cube elemental analyzer (Elementar) in conjunction with an IsoPrime visION isotope ratio mass spectrometer (Elementar). The international laboratory standards USGS-40 and USGS-41a and two in-house reference materials (modern collagen of camel and elk) were used to calibrate the results. An analytical error below 0.1‰, 0.2‰, and 0.4‰ respectively (1σ) was determined for δ 13C, δ 15N, and δ 34S in all the repeated analyses.
For cross-laboratory checking, one randomly selected collagen sample was measured in the Institute of Geological Sciences of the Polish Academy of Sciences (Warsaw, Poland). Isotopic measurements were performed in Flash EA 1112HT elemental analyzer (Thermo Scientific) connected to a Delta V Advantage isotope ratio mass spectrometer (Thermo Scientific). International standards USGS-40, USGS-41 and IAEA-600 were used for 3-point calibration. Mean standard errors produced by the device over a long time is <0.33‰ for δ 13C and <0.43‰ for δ 15N.
Isotopic values were expressed as δ (delta; an isotopic ratio over the ratio of an appropriate reference) in parts per mille (‰), according to the formula: δ iE = (R(iE/jE)sample – R(iE/jE)reference/R(iE/jE)reference) · 1000, where iE is 13C, 15N or 34S, and R(iE/jE) is a 13C/12C, 15N/14N or 34S/32S ratio (Coplen Reference Coplen2011). The references were V-PDB for carbon, atmospheric nitrogen (AIR N2) for nitrogen, and V-CDT for sulfur.
We reconstructed isotopic niches (an equivalent of ecological trophic niches) in the C-N, C-S and N-S isospaces, using SIBER (Jackson et al. Reference Jackson, Inger, Parnell and Bearhop2011) in R (Version 4.1.3. in RStudio 2022.12.0 Build 353). For this purpose, we constructed convex hulls (TA: Total niche), 40% (core niche), and 95% standard ellipse areas (SEA) (Layman et al. Reference Layman, Arrington, Montaña and Post2007; Jackson et al. Reference Jackson, Inger, Parnell and Bearhop2011). In the case of the core niches, we constructed two variants: corrected for small sample sizes (SEAc) and calculated using Bayesian statistics (SEAb).
RESULTS
14C Dating Results
We obtained 14C dates for 19 cave hyena remains from Perspektywiczna Cave (Table 1 and Supplementary Figure s1). Dates span from Poz-149862: 29,300 ± 350 BP, or cal BP 34,242–33,443 (1σ), to Poz-148305: 46,000 ± 3000 BP, or cal BP 52,118–46,059 (1σ). One bone gave infinite date, Poz-148266: >44,000 BP. The specimen that yielded the latest age (CRO001) was initially dated to Poz-91892: 25,900 ± 300 BP (Krajcarz et al. Reference Krajcarz, Krajcarz, Baca, Popović, Sudoł-Procyk, Sobczyk, Ratajczak-Skrzatek, Kasprzak, Kotowski, Marciszak and Stefaniak2020). However, that collagen extraction omitted the NaOH step, therefore we exclude this date as potentially compromised by humic contaminations. The same specimen was dated again twice in two independent laboratories, providing quite earlier but still relatively late ages (Table 1).
Table 1 Results of 14C dating, genetic attribution to mtDNA haplogroups and collagen stable isotope composition of hyenas from Perspektywiczna Cave (n.d. = not determined). For detailed information see the Appendix.

a Gas Ion Source AMS.
b Published in Czernielewski et al. (Reference Czernielewski, Krajcarz and Krajcarz2020).
c Published in Krajcarz et al. (Reference Krajcarz, Pacher, Krajcarz, Laughlan, Rabeder, Sabol, Wojtal and Bocherens2016a).
d Results not reliable due to weak collagen quality.
Sum of the probability distribution of all the Perspektywiczna Cave hyena calibrated dates exhibits tri-modal shape and KDE model shows more robust bi-modal distribution (Figure 2, panel a), with the last modes represented by single dates. The observed modes correspond roughly with the mtDNA variability, described below (see also Figure 2, panels b and c).

Figure 2 Summarizing of 14C dates for the Perspektywiczna Cave hyenas. Panel (a) shows the OxCal sum distribution (black field), the OxCal KDE estimated distribution (kernel density model, the black line), and the OxCal mean ±1σ for snapshots of the KDE distribution generated during the MCMC process (the dotted line and transparent gray band) for all dated Perspektywiczna Cave hyenas. Panel (b) is the same for A1 sub-haplogroup hyenas only, and panel (c) for A2 sub-haplogroup hyenas only (without KDE model due to low sample size). Panel (d) shows the distribution of calibrated date medians (black dots—A1 sub-haplogroup, open diamonds—A2 sub-haplogroup, open gray circles—dates from Europe after Stuart and Lister (Reference Stuart and Lister2014). Gaps in the European dataset are cross-hatched.
Paleogenetic Results
We obtained almost complete sequences of mitochondrial genomes for 19 specimens with mean coverage >85%. The damage pattern and read lengths corroborated the authenticity of the obtained data (Appendix). In the obtained phylogeny, five main lineages correspond well with five haplogroups defined earlier by Westbury et al. (Reference Westbury, Hartmann, Barlow, Preick, Ridush, Nagel, Rathgeber, Ziegler, Baryshnikov and Sheng2020) and Hu et al. (Reference Hu, Westbury, Yuan, Zhang, Chen, Xiao, Hou, Ji, Lai, Hofreiter and Sheng2021), i.e., A1, A2, B, C, and D. Samples from Perspektywiczna Cave cluster within a haplogroup A (sensu Westbury et al. Reference Westbury, Hartmann, Barlow, Preick, Ridush, Nagel, Rathgeber, Ziegler, Baryshnikov and Sheng2020). Most of the samples are located in lineage A1, consisting of Late Pleistocene European Crocuta. Three specimens are located in lineage A2, which up to date consisted of modern African hyenas (see Supplementary Figure s2) (Table 1).
Based on both the 14C age and the mtDNA phylogenetics, we identified three groups within the Perspektywiczna Cave hyenas:
-
1. “Main A1”, the largest group (N=13, including three juveniles), gathering all specimens of A1 sub-haplogroup, all with the ages of >37 ka cal BP (for 1σ);
-
2. “Early A2”, a single specimen (CRO016) of A2 sub-haplogroup and early 14C age of cal BP 48,269–44,055 (1σ) or >44,000 BP; and
-
3. “Late A2”, two specimens (CRO001 and CRO010) of A2 sub-haplogroup and late 14C age (the latest within the taphocenosis) of <37 ka cal BP (for 1σ).
Stable Isotope Results
The δ 13C and δ 15N data for three specimens were published before (Krajcarz et al. Reference Krajcarz, Pacher, Krajcarz, Laughlan, Rabeder, Sabol, Wojtal and Bocherens2016a) (Table 1). The isotopic measurements for other specimens and all δ 34S results are new data. The collagen quality check allowed regarding 18 collagen extracts as well-preserved and thus, stable isotope results as reliable (details are provided in the Appendix). Two other collagen extracts had high C:N atomic ratio, beyond the acceptance range (3.63 and 3.73). Both of these samples had also quite low collagen yield (<7%). A randomly selected specimen CRO015 was cross-checked in the laboratory in Warsaw. The found inter-lab difference was 0.52‰ for δ 13C and 0.03‰ for δ 15N.
Adult/subadult hyenas gave rather narrow range of δ 13C values, varying from -19.9 to -19.2 ‰V-PDB, while their δ 15N values ranged from 8.2 to 10.5 ‰AIR (Table 1). Three juveniles had similar to adults δ 13C values, from –20.0 to –19.6 ‰V-PDB, but clearly higher δ 15N values, from 10.6 to 11.8 ‰AIR. The δ 34S values are quite variable, ranging from –3.2 to 2.5 ‰ V-CDT, with the highest values recorded in the A2 sub-haplogroup specimens.
Since the studied hyenas divided into genetic-chronological groups (see the section Paleogenetic Results), they possibly represent different paleoecologies. Therefore, the calculation of isotopic niche and niche overlaps should be conducted individually for groups rather than for the entire collection. However, considering statistical representation, we could do it only for the “Main A1” group, as the two others are represented by only one and two specimens. We further excluded juveniles from ecological analyses, as their isotopic signal may likely record more physiology-related than ecology-related habits, such as milk consumption (Jenkins et al. Reference Jenkins, Partridge, Stephenson, Farley and Robbins2001; Dalerum et al. Reference Dalerum, Bennett and Clutton-Brock2007; Bocherens Reference Bocherens2015).
Specimens of the “Early A2” and “Late A2” groups are within the 95% SEA of the “Main A1” group (Figure 3). One individual of “Early A2” and one of “Late A2” are even within the 40% SEA, i.e., the core niche of the “Main A1” group. Juveniles of the “Main A1” group show significantly higher δ 15N values and are therefore outside the 95% SEAc of the “Main A1” group’s adults.

Figure 3 Isotopic values (δ 15N, δ 13C, and δ 34S) of bone collagen of the Perspektywiczna Cave hyenas plotted in (a) C-N, (b) S-N, and (c) S-C isospaces. SEA and convex hull are only shown for adult specimens of the “Main A1” group.
DISCUSSION
Chronology of the Perspektywiczna Cave hyenas
The range of the 14C age of Perspektywiczna Cave hyenas covered almost the entire MIS 3 period (sensu Lisiecki and Raymo Reference Lisiecki and Raymo2005) (Figure 2), except for its last several millennia. This may point toward a long occupation of the cave by hyenas. Analogies may be found e.g. in another Late Pleistocene hyena den in Caverne Marie-Jeanne (Belgium) that was interpreted to be regularly reused as a birth den over a long period of time, around 47.6–43 ka cal BP (Jimenez et al. Reference Jimenez, Germonpré and Boudin2022).
Our latest dates are significantly younger than previously published hyena dates from Poland (Stuart and Lister Reference Stuart and Lister2014), which were: OxA-11062: 46,100 ± 900 BP (49,770–47,466 cal BP, 1σ, may be out of the calibration range); OxA-11158: 42200 ± 800 BP (45,582–44,366 cal BP, 1σ), and OxA-11161: 41,700 ± 1100 BP (45448–43417 cal BP, 1σ), all from Komarowa Cave. The youngest one among our dates, i.e., the combined Poz-149862 and ETH-130958 obtained for one specimen CRO001: 34,355–33,725 cal BP (1σ), is later by 10 millennia and points out the latest directly dated remain of a cave hyena north to Carpathians. The taxonomic attribution of this specimen is undoubted, both from morphological point of view (it is a well preserved proximal part of ulna with typical hyenid morphology; see Supplementary Figure s3) and genetically (mtDNA proved an A2 sub-haplogroup of Crocuta crocuta; see Supplementary Figure s2). Also, the second specimen of the “Late A2” group, the CRO010, provided much younger date than known from the previous studies.
In the distribution of our 14C ages (sum of date probabilities in Figure 1, panels a and d) we can detect two gaps. The first is situated around 39–37 ka cal BP, and the second around 35 ka cal BP. Only single dates appear after these intervals, so we shall regard these gaps with caution. Noteworthy is, however, a coincidence with gaps found in the dataset of the pan-European 14C record of hyenas presented by Stuart and Lister (Reference Stuart and Lister2014). In that dataset, the most recent gaps between calibrated date medians are within 39.6–38.0 ka cal BP and 36.3–34.0 ka cal BP (Figure 1, panel d). Similarity between the gaps in the general European and in local Perspektywiczna Cave datasets may point toward a decline of hyena populations during these periods in Europe. This hypothesis finds an additional support in the mtDNA results, discussed below (see section Genetic structure of the Perspektywiczna Cave hyenas). This also suggests that the temporal distribution of hyenas in southern Poland followed the general continental pattern.
Remarks on the Chronology of Cave Hyenas in Poland
Two more hyena dens are known from Poland, both situated in the same region of Kraków-Częstochowa Upland. One is Komarowa Cave, layers C, D, and E (Wojtal Reference Wojtal2007; Nadachowski et al. Reference Nadachowski, Żarski, Urbanowski, Wojtal, Miękina, Lipecki, Ochman, Krawczyk, Jakubowski and Tomek2009; Nadachowski et al. Reference Nadachowski, Marciszak, Ridush, Stefaniak, Wilczyński, Wojtal, Łanczont and Madeyska2015), situated 46 km away; another one is Biśnik Cave, layers 7–5 (Stefaniak and Marciszak Reference Stefaniak, Marciszak, Stefaniak, Tyc and Socha2009; Marciszak et al. Reference Marciszak, Socha, Nadachowski and Stefaniak2011), situated 7 km away. Both are dated to MIS 3: Komarowa Cave den to early MIS 3 on the basis on 14C dating (Wojtal Reference Wojtal2007; Nadachowski et al. Reference Nadachowski, Żarski, Urbanowski, Wojtal, Miękina, Lipecki, Ochman, Krawczyk, Jakubowski and Tomek2009), and Biśnik Cave den broadly to MIS 4/3 and MIS 3 based on the chronology of stratigraphic units (Krajcarz et al. Reference Krajcarz, Bosák, Šlechta, Pruner, Komar, Dresler and Madeyska2014). Hyena remains of unprecise chronology are also know from other sites (Nadachowski et al. Reference Nadachowski, Marciszak, Ridush, Stefaniak, Wilczyński, Wojtal, Łanczont and Madeyska2015). All these data suggest quite intense inhabitation of the region by hyenas during MIS 3.
Remarks on the Perspektywiczna Cave Chronostratigraphy
Obtained dates allow for approximation of the chronostratigraphy of Perspektywiczna Cave sediments. Most of our dates were obtained for bones from two contexts: sandy loam with limestone debris in the upper chamber (layers C1/C2 and C1/C3) and layer 7c in the lower chamber. Date sets are consistent and point toward the mid-Upper Pleistocene (MIS 3) age of the sediments. We can regard the upper chamber sediments as a remnant of hyena den deposits likely preserved in their original context, while layer 7c as a re-deposited colluvium of these deposits. This is based on a topographic position (the upper chamber strata elevated by around 4 m above the layer 7c), sedimentological observations (lithological similarities of both units; large thickness and no sedimentary structures in the upper chamber strata; clear disconformity at the bottom of layer 7c), and stratigraphy (layer 7c situated above the Late Glacial layer 9, evidenced by the 14C dated muskox bone, see Stefaniak et al. Reference Stefaniak, Lipecki, Nadachowski, Semba, Ratajczak, Kotowski, Roblíčková, Wojtal, Shpansky and Malikov2021). The 14C ages allow the following reconstruction of sedimentological processes: (1) accumulation of hyena den deposits during early MIS 3, as evidenced by the new data presented here and by Krajcarz et al. (Reference Krajcarz, Pacher, Krajcarz, Laughlan, Rabeder, Sabol, Wojtal and Bocherens2016a); (2) post-MIS 3 erosion and removal of hyena den deposits and other sediments from the lower chamber; (3) accumulation of the lower part (below the layer 7c) of the lower chamber sequence, likely during the Late Glacial; (4) Late Glacial or post-Late Glacial colluvial re-deposition of a part of hyena den deposits from the upper to the lower chamber, resulting in formation of layer 7c; (5) accumulation of the Holocene series with a post-depositional dispersal of fossils deriving from the hyena den context.
Genetic Structure of the Perspektywiczna Cave Hyenas
Previous genetic studies of extant and Pleistocene Crocuta based on a short fragment of cytochrome b (Rohland et al. Reference Rohland, Pollack, Nagel, Beauval, Airvaux, Pääbo and Hofreiter2005) and almost complete mitochondrial genomes (Westbury et al. Reference Westbury, Hartmann, Barlow, Preick, Ridush, Nagel, Rathgeber, Ziegler, Baryshnikov and Sheng2020; Hu et al. Reference Hu, Westbury, Yuan, Zhang, Chen, Xiao, Hou, Ji, Lai, Hofreiter and Sheng2021) recognized four main mtDNA haplogroups: A, B, C, and D. Haplogroup C was found only within extant hyenas, while B and D were found only in Pleistocene hyenas. Haplogroup A was found to be the most widespread and occurred in both European cave hyenas and modern African hyenas (Westbury et al. Reference Westbury, Hartmann, Barlow, Preick, Ridush, Nagel, Rathgeber, Ziegler, Baryshnikov and Sheng2020).
All new samples from Perspektywiczna Cave cluster within haplogroup A. We recognized two sub-haplogroups: A1 and A2 (Supplementary Figure s2). Most of the Perspektywiczna Cave hyenas belong to the A1 sub-haplogroup. This sub-haplogroup was known to date from the Upper Pleistocene of western Europe (France, Germany) and eastern Europe (Ukraine) (Westbury et al. Reference Westbury, Hartmann, Barlow, Preick, Ridush, Nagel, Rathgeber, Ziegler, Baryshnikov and Sheng2020). The presence of the A1 sub-haplogroup in Perspektywiczna Cave, situated in the central part of the continent, suggests that this sub-haplogroup was likely widespread throughout Europe.
Three out of the 19 studied specimens represent the A2 sub-haplogroup. Interestingly, these three specimens were either of the latest age in our dataset or among the earliest ones. The sample CRO016 revealed 14C age close to or beyond the method limit (Poz-149863: 43,000 ± 2000 BP and Poz-148266: > 44,000 BP). Therefore, the exact chronology of this specimen cannot be established. Two others revealed unexpectedly late age (CRO001, combined dates Poz-149862 and ETH-130958: cal BP 34,355–33,725 for 1σ; and CRO010, Poz-131676: cal BP 36,804–35,494 for 1σ), which is the latest among Perspektywiczna Cave hyenas and among the latest in Europe. It is noteworthy that this sub-haplogroup appears after one of the gaps in the temporal distribution of the hyenas (see the section: Chronology of the Perspektywiczna Cave hyenas). A possible hypothesis includes the change of population genetic structure after the pan-European decline. Answering the question of possible population replacement requires further studies of well-dated specimens from nearby regions.
Noticeably, the A2 sub-haplogroup was previously found only in extant African hyenas (Westbury et al. Reference Westbury, Hartmann, Barlow, Preick, Ridush, Nagel, Rathgeber, Ziegler, Baryshnikov and Sheng2020). The Perspektywiczna Cave collection is the first known case of cave hyenas with this sub-haplogroup, as well as the first case of this sub-haplogroup out of Africa. Paleogenomic studies of modern and Pleistocene hyena genomes suggested bidirectional gene flow between African and Eurasian populations after the split of European and Chinese lineages and subsequent unidirectional gene flow from European to northern African spotted hyenas before the divergence of A1 and A2 sub-haplogroups (that happened around 570 to 388 ka BP; Westbury et al. Reference Westbury, Hartmann, Barlow, Preick, Ridush, Nagel, Rathgeber, Ziegler, Baryshnikov and Sheng2020). The latter divergence was an effect of cessation of gene flow from the European to north African populations. There are at least two alternative explanations for the presence of the A2 sub-haplogroup in the Late Pleistocene European hyenas. First, the divergence of the A1 and A2 lineages was not related to the stalling of gene flow between European and African populations, but the gene flow continues or took place after the divergence; as the consequence, the observed pattern is an effect of incomplete lineage sorting. The other explanation is that there was another, later episode of gene flow that introduced the African A2 sub-haplogroup into European populations. Westbury et al. (Reference Westbury, Hartmann, Barlow, Preick, Ridush, Nagel, Rathgeber, Ziegler, Baryshnikov and Sheng2020) suggested that admixture of African and European hyenas might have had some adaptive advantages. It is possible that the specimens that carried the A2 sub-haplogroup had a greater adaptive potential and appeared after the pan-European decline. However, further paleogenomic studies are necessary to confirm this hypothesis.
Ecological Stability of the Perspektywiczna Cave Hyenas
In terms of collagen C and N stable isotopes, the Perspektywiczna Cave hyenas are similar to other Late Pleistocene hyenas from Europe (Bocherens et al. Reference Bocherens, Fogel, Tuross and Zeder1995; Bocherens et al. Reference Bocherens, Billiou, Patou-Mathis, Bonjean, Otte and Mariotti1997; Bocherens et al. Reference Bocherens, Drucker, Billiou, Patou-Mathis and Vandermeersch2005; Bocherens et al. Reference Bocherens, Drucker, Bonjean, Bridault, Conard, Cupillard, Germonpré, Höneisen, Münzel and Napierala2011; Bocherens Reference Bocherens2015; Krajcarz et al. Reference Krajcarz, Pacher, Krajcarz, Laughlan, Rabeder, Sabol, Wojtal and Bocherens2016a; Flower et al. Reference Flower, Schreve and Lamb2021). Moreover, the collagen δ 15N and δ 13C values in Perspektywiczna Cave hyenas revealed no difference between the sub-haplogroups (Figure 3, panel a) and no change within the entire dated period (Figure 4, panels a and b). This points toward ecological stability of hyena populations through millennia. The only difference is exhibited by juveniles, who are increased in 15N and depleted in 13C in comparison to the most of adults. This complies with expected trend in juvenile carnivorans, who are known to record the non-adult-like isotopic values due to nursing effect (Jenkins et al. Reference Jenkins, Partridge, Stephenson, Farley and Robbins2001).

Figure 4 Isotopic values (δ 15N, δ 13C and δ 34S) of bone collagen of the Perspektywiczna Cave hyenas across the chronology (calibrated date medians taken for the time scale; for CRO001 the median of a combined date is taken). Black dots – “Main A1” group, adults; gray dots – “Main A1” group, juveniles; diamonds and square – “Late A2” and “Early A2” groups respectively, adults. Trend lines are calculated for all adults.
A slight diachronic change is visible in δ 34S results (Figure 4, panel c). In particular, the two latest individuals, both belonging to the “Late A2” group, show higher δ 34S values than all other specimens. The δ 34S values in ecosystems are known to be related to geologic bedrock and vary between stratigraphic units and lithologies (Richards et al. Reference Richards, Fuller and Hedges2001; Nehlich Reference Nehlich2015; Paytan et al. Reference Paytan, Yao, Faul, Gray, Gradstein, Ogg, Schmitz and Ogg2020); they also depend on soil activity (Drucker et al. Reference Drucker, Bridault, Cupillard, Hujic and Bocherens2011). Sulfur isotopes lack fractionation in trophic chain (Richards et al. Reference Richards, Fuller, Sponheimer, Robinson and Ayliffe2003; Arneson and MacAvoy Reference Arneson and MacAvoy2005; Tanz and Schmidt Reference Tanz and Schmidt2010; Webb et al. Reference Webb, Newton, Lewis, Stewart, Miller, Tarlton and Evershed2017; Krajcarz et al. Reference Krajcarz, Krajcarz, Drucker and Bocherens2019), therefore in terrestrial environments the body δ 34S signal directly reflects a local geology or soil geochemistry (Peterson and Fry Reference Peterson and Fry1987; Nehlich Reference Nehlich2015). A possible hypothesis explaining the change in δ 34S in the Perspektywiczna Cave hyenas may be, therefore, a different mobility patterns between earlier and later hyenas, i.e., exploitation of territories with different geologic backgrounds and/or soils. Also, the herbivores hunted by earlier and later hyenas could have followed different mobility patterns and migrated from regions with different δ 34S signals. This seems likely, as Perspektywiczna Cave is situated close to the boundary between the Upper Jurassic limestones and Lower Cretaceous sands and sandstones (Bukowy Reference Bukowy1968; Bednarek et al. Reference Bednarek, Kaziuk and Zapaśnik1978). However, a lack of any abrupt shift in δ 34S, but rather a gradual long-lasting change (Figure 4, panel c), suggests another explanation: a slow change of local environmental conditions. This could have happened through the climate change, e.g., the increasing aridity during the MIS 3 period (Fuhrmann et al. Reference Fuhrmann, Diensberg, Gong, Lohmann and Sirocko2020) that likely could change the soil geochemistry toward more oxidizing conditions and thus higher soil δ 34S values. Alternatively, this could have also happened through the change of geological background, which was not unlikely considering the loess accumulation that is known to be the most intense in the region during the late MIS 3 and MIS 2 (Krajcarz et al. Reference Krajcarz, Cyrek, Krajcarz, Mroczek, Sudoł, Szymanek, Tomek and Madeyska2016b). All these hypotheses are not mutually exclusive.
To consider the trophic ecology of the Perspektywiczna Cave hyenas in a broader European context, we adopted a niche overlapping approach (Baumann et al. Reference Baumann, Bocherens, Drucker and Conard2020). We calculated the core niches (40% SEA) for C and N isotopic ranges of other Late Pleistocene hyena populations taken from literature, following the same method as for the Perspektywiczna Cave hyenas. We included sites with isotopic results for at least 3 hyena specimens: Goyet and Scladina, Belgium; La Berbie and Camiac, France; Kents Cavern and Sandford, UK (Bocherens et al. Reference Bocherens, Fogel, Tuross and Zeder1995, Reference Bocherens, Billiou, Patou-Mathis, Bonjean, Otte and Mariotti1997, Reference Bocherens, Drucker, Billiou, Patou-Mathis and Vandermeersch2005, Reference Bocherens, Drucker, Bonjean, Bridault, Conard, Cupillard, Germonpré, Höneisen, Münzel and Napierala2011; Bocherens Reference Bocherens2015; Flower et al. Reference Flower, Schreve and Lamb2021). In addidtion, we plotted the single specimens from Hohlenstein-Stadel, Germany, and Peștera cu Oase, Romania (Bocherens et al. Reference Bocherens, Drucker, Bonjean, Bridault, Conard, Cupillard, Germonpré, Höneisen, Münzel and Napierala2011; Trinkaus and Richards Reference Trinkaus, Richards, Trinkaus, Constantin and Zilhão2013), without niche reconstruction. The Kents Cavern hyenas show the widest range of δ 13C and δ 15N values (Figure 5), which can be interpreted as a broad niche. The other populations, including Perspektywiczna Cave, are similar to each other in terms of isotopic variability (Figure 5). Moreover, their SEAs overlap, which point toward ecological similarities and place all the Perspektywiczna Cave hyenas well within the European ecological variability.
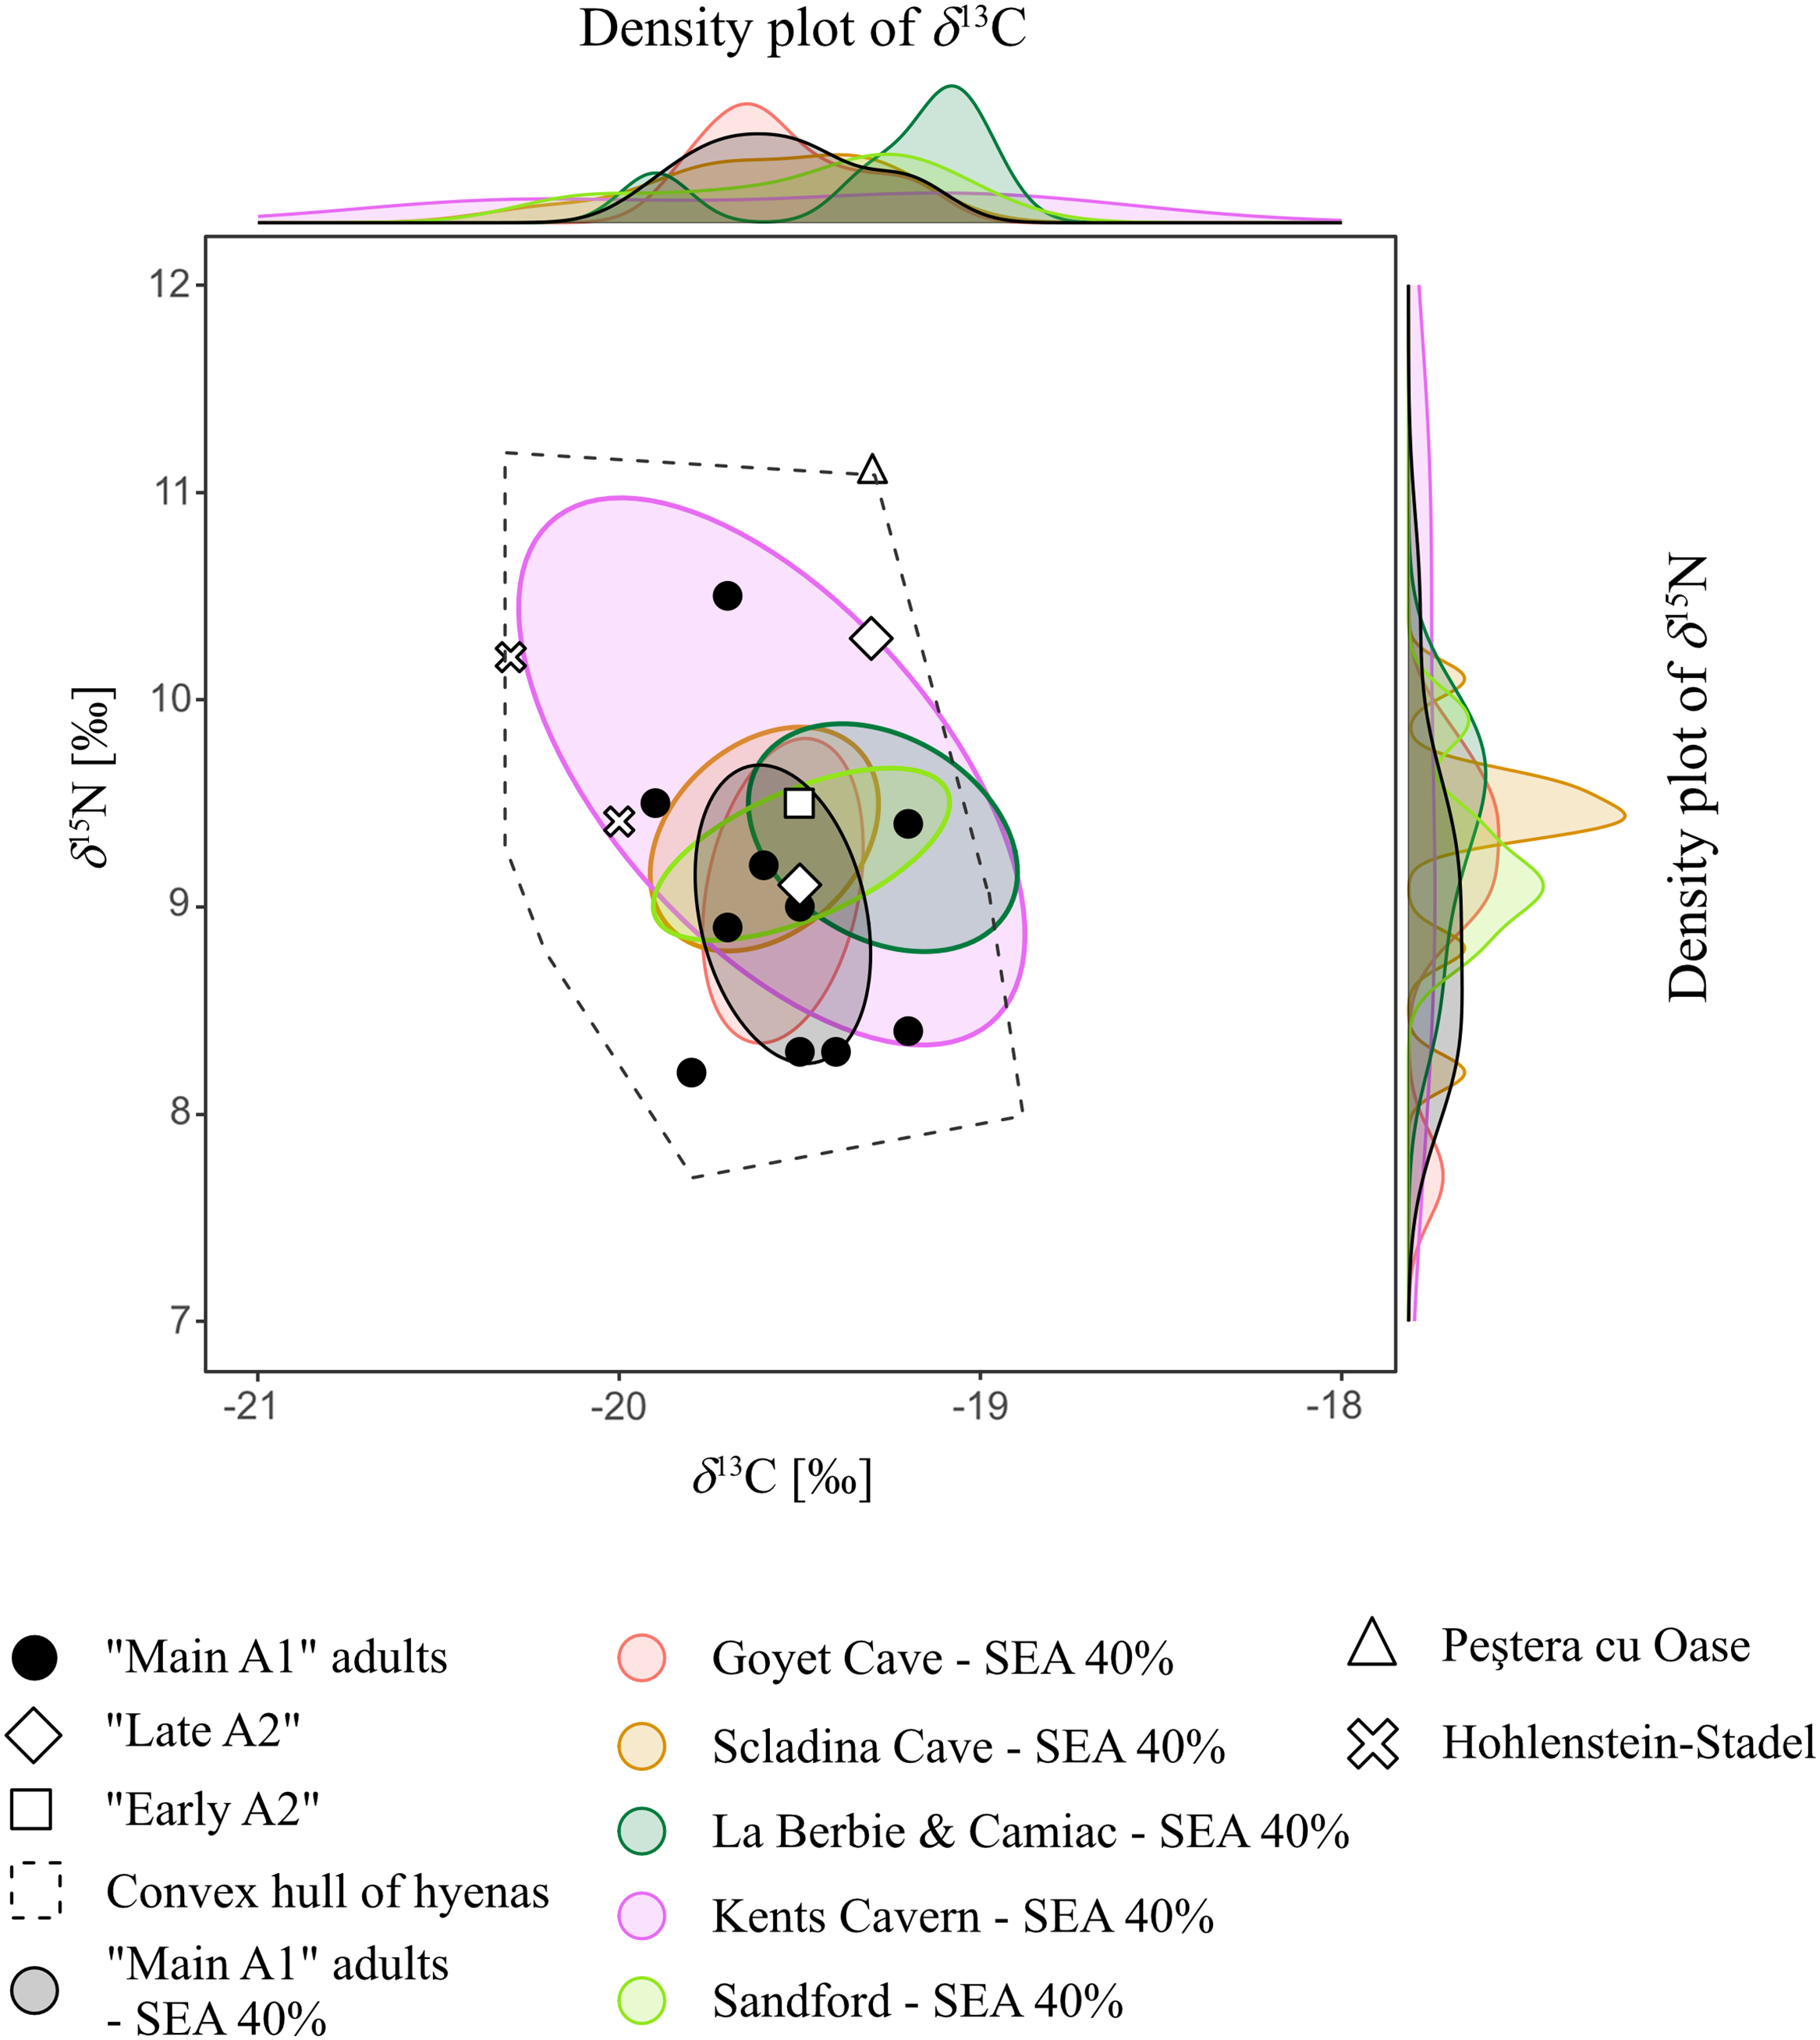
Figure 5 Isotopic values (δ 15N and δ 13C) of the Perspektywiczna Cave hyenas and other Late Pleistocene European cave hyenas (input values and references are provided in the Appendix). A convex hull covers all hyenas, while core niches (SEA 40%) and density plots are shown for sites with more than 3 specimens.
CONCLUSIONS
Our results for Perspektywiczna Cave provide a geographical complementary data for the Late Pleistocene European cave hyenas, both in terms of the chronology, genetic structure and paleoecology. The case of Perspektywiczna Cave proves that hyenas were still present north of Carpathians during the late MIS 3, as late as ∼34 ky cal BP. This information shifts forward the last confirmed appearance of hyena in this region by nearly 10 millennia and may have an important impact on the archaeological interpretations of paleoecology of the Upper Paleolithic people. Our data shows also that the genetic structure of European hyenas was more complex than previously documented. The Perspektywiczna Cave results reveal close affinity of local hyenas with the mtDNA lineage considered so far to be restricted to Africa, as well as with the one known in other Late Pleistocene European populations. Preliminary conclusions about the temporal changes in the genetic structure can also be postulated. Noticeably is an ecological stability of the Perspektywiczna Cave hyenas through the millennia and their similarity to the most of other Late Pleistocene European populations.
Even if our results are limited to one region and one site, they are of wide importance. To understand comprehensively the temporal changes in cave hyena’s distribution, genetic structure and ecology across the Eurasia, more data from other sites and other regions are needed. Nevertheless, the complex pattern of the hyena extinction in Europe has been revealed. Southern Poland is another region outside of the southern Europe, along eastern Germany, Belgium, and southern Great Britain (Stuart and Lister Reference Stuart and Lister2014; Westbury et al. Reference Westbury, Hartmann, Barlow, Preick, Ridush, Nagel, Rathgeber, Ziegler, Baryshnikov and Sheng2020), where hyenas survived at least until the late MIS 3.
SUPPLEMENTARY MATERIAL
To view supplementary material for this article, please visit https://doi.org/10.1017/RDC.2023.89
ACKNOWLEDGMENTS
The study was supported by the National Science Centre, Poland, grants No. 2011/01/N/HS3/01299, 2014/15/D/HS3/01302, and 2014/13/D/HS3/03842, and European Union’s Horizon 2020 research and innovation programme under the Marie Sklodowska-Curie grant agreement No. 101023317, project IsoTroph. We are thankful to Irena Hajdas and Negar Haghipour, ETH Zurich, for their support provided the 14C AMS analysis of a microgram-size sample. Finally we would like to thank to Silesian Zoological Garden in Chorzów (Poland) for providing access to the genetic material of modern brown hyena.
AUTHOR CONTRIBUTIONS
MTK and MK—conceptualization; MTK, MK, and MSP—excavation and archaeological context; MK—collection curation, bone identification, sampling; TG—radiocarbon dating; MB and DP—genetic analysis; MTK, MK, and HB—isotopic analysis; MTK, CB, MB, and DP – data processing, illustrations; MTK, MK, and MSP—financing; all authors—manuscript preparation and reviewing.
DATA AVAILABILITY STATEMENT
The consensus mtDNA sequences generated in this study were deposited in the GenBank under accession numbers from OQ947728 to OQ947746. The sequencing reads mapped to cave hyena mtDNA are available from the European Nucleotide Archive under accession PRJEB61948. The mtDNA alignment used for phylogenetic reconstruction is available from RepOD: https://doi.org/10.18150/VMJZNK. All isotopic and radiocarbon determination data are provided within the paper and its supplementary materials.


 Open access