


INTRODUCTION
Radiocarbon (14C) is produced in the stratosphere by cosmic rays, which consist of high-energy protons and helium nuclei (Adriani et al. Reference Adriani, Barbarin, Bazilevskaya, Bellotti, Boezio, Bogomolov, Bonechi, Bongi, Bonvicini, Borisov and Bottai2011). Cosmic rays are transformed to neutrons by interaction with gases (mostly 14N) in the atmosphere, which produces 14C on the Earth (Lal and Jull Reference Lal and Jull2001). The global production rate of 14C in the atmosphere is 1.8–2.5 atoms per second per cm2 (Mak et al. Reference Mak, Brenninkmeijer and Southon1999). The 14C is oxidized to 14CO, which is further oxidized to 14CO2 by hydroxyl radicals (Pandow et al. Reference Pandow, MacKay and Wolfgang1960; Demidov and Markelov Reference Demidov and Markelov2005; Hajdas et al. Reference Hajdas, Ascough, Garnett, Fallon, Pearson, Gianluca, Kirsty, Yamaguchi and Yoneda2021). Until 1890, the 14C content was only affected by the amount of cosmic rays from the Earth and solar cycle. However, anthropogenic activities became an influencing factor of 14C content after 1890. Changes in the 14C/12C ratio under anthropogenic influence were measured during 1890–1945 (Suess Reference Suess1955); thus, the decreasing 14C/12C in the atmosphere due to fossil fuel usage was named the Suess effect. This ratio increased from 1955 to 1965 due to nuclear weapon testing and production, with a maximum value recorded in 1963 in the Northern Hemisphere, after which it declined (Levin et al. Reference Levin, Naegler, Kromer, Diehl, Francey, Gomez-Pelaez, Steele, Wagenbach, Weller and Worthy2010). The 14C concentration has gradually decreased and now resembles that before 1955 (Levin et al. Reference Levin, Kromer and Hammer2013). In the modern age, natural events and anthropogenic influences cause 14C ratio fluctuations. At the local scale, a primary reason for fluctuations in 14C content is the consumption of fossil fuels. The 14C isotope can be used as a powerful tool for tracking fossil carbon (Zhang et al. Reference Zhang, Jin and Sikand2021). Plants capture atmospheric carbon via photosynthesis, thus extracting radiocarbon from CO2 in the atmosphere (Pazdur et al. Reference Pazdur, Nakamura, Pawelczyk, Pawlyta, Piotrowska, Rakowski, Sensula and Szczepanek2007). Similarly, tree rings have been used to interpret fossil carbon from the atmosphere at the local scale (Hou et al. Reference Hou, Zhou, Cheng, Xiong, Du, Niu, Yu, Fu and Lu2020). Additionally, deciduous trees and grasses absorb CO2 from the atmosphere; their leaves can represent the atmospheric 14C/12C ratio at the time when they were alive at sites affected by fossil fuel usage (Park et al. Reference Park, Hong, Xu, Park, Sung, Sung, Lee, Nakanishi and Park2015; Ndeye et al. Reference Ndeye, Sene, Diop and Saliege2017; Varga et al. Reference Varga, Barnucz, Major, Lisztes-Szabo, Jull, Laszlo, Penezes and Molnar2019; Sharma et al. Reference Sharma, Kunchala, Ojha, Kumar, Gargari and Chorpa2023).
In this study, variations in the 14C ratio were measured in the well-known tourist city of Gyeongju in South Korea to determine the Suess effect. The deciduous leaves were collected from rural and urban areas of the city in 2018, 2020, and 2021. The samples were prepared and measured using an accelerator mass spectrometer (AMS) at Dongguk University (Lee et al. Reference Lee, Park, Kong and Kim2020a).
MATERIALS AND METHODS
Sampling Sites and Samples
South Korea is located in northeast Asia and experiences the Asian monsoon. In winter, cold and dry winds blow from Siberia, while in summer, hot and moist winds blow from tropical areas. The average temperature is 25°C with a total annual rainfall of approximately 1500 mm, 50%–60% of which occurs in summer (Korean Meteorological Association, http://weather.go.kr [December 10, 2020]). Gyeongju has a population of approximately 240,000 and consists of a small industrial facility, vast agricultural lands, and famous tourist attractions. The residential area of Gyeongju is concentrated in a narrow zone, while the rest of the area is devoted to agriculture. Hence, we considered that most CO2 content was contributed by citizen and tourist economic activities like transportation, not industrial facilities, that consumed fossil fuels. The distance from the small industrial facility to the downtown sites were up to 3 km, 7 km to the tourist site, and 20 km to the rural site. The nuclear power plant in Gyeongju is located up to 24 km away from the sampling sites; the 14C effect from the nuclear power plant is discussed in the Results and Discussion section. To examine the fossil carbon content, five sites at rural, downtown, and tourist locations were selected, and leaves from Prunus subg. Cerasus, a local deciduous tree, were collected in 2018, 2020, and 2021. From these five sites, 25 samples were collected followed by chemical pretreatment; however, only 15 of these samples were measured considering sample condition after pretreatment. These excepted samples became very low mass less than 1 mg after pretreatment. We decided to exclude these samples for the accuracy of measurement. The sample codes are in double-digits, where the first number denotes the year of collection (0: 2018, 1: 2020, 2: 2021), while the second number denotes the site type (1: rural, 2: tourist, 3–5: downtown) (Table 1, Figure 1). The population density of the downtown area was >10,000 people/km2, while the rural site had a lower density of 1,000 people/km2. The tourist site was selected based on the number of tourists per year, which was >5,000,000.
Table 1 Sampled tree species, location, and time (year-month) of sampling in Gyeongju, South Korea.

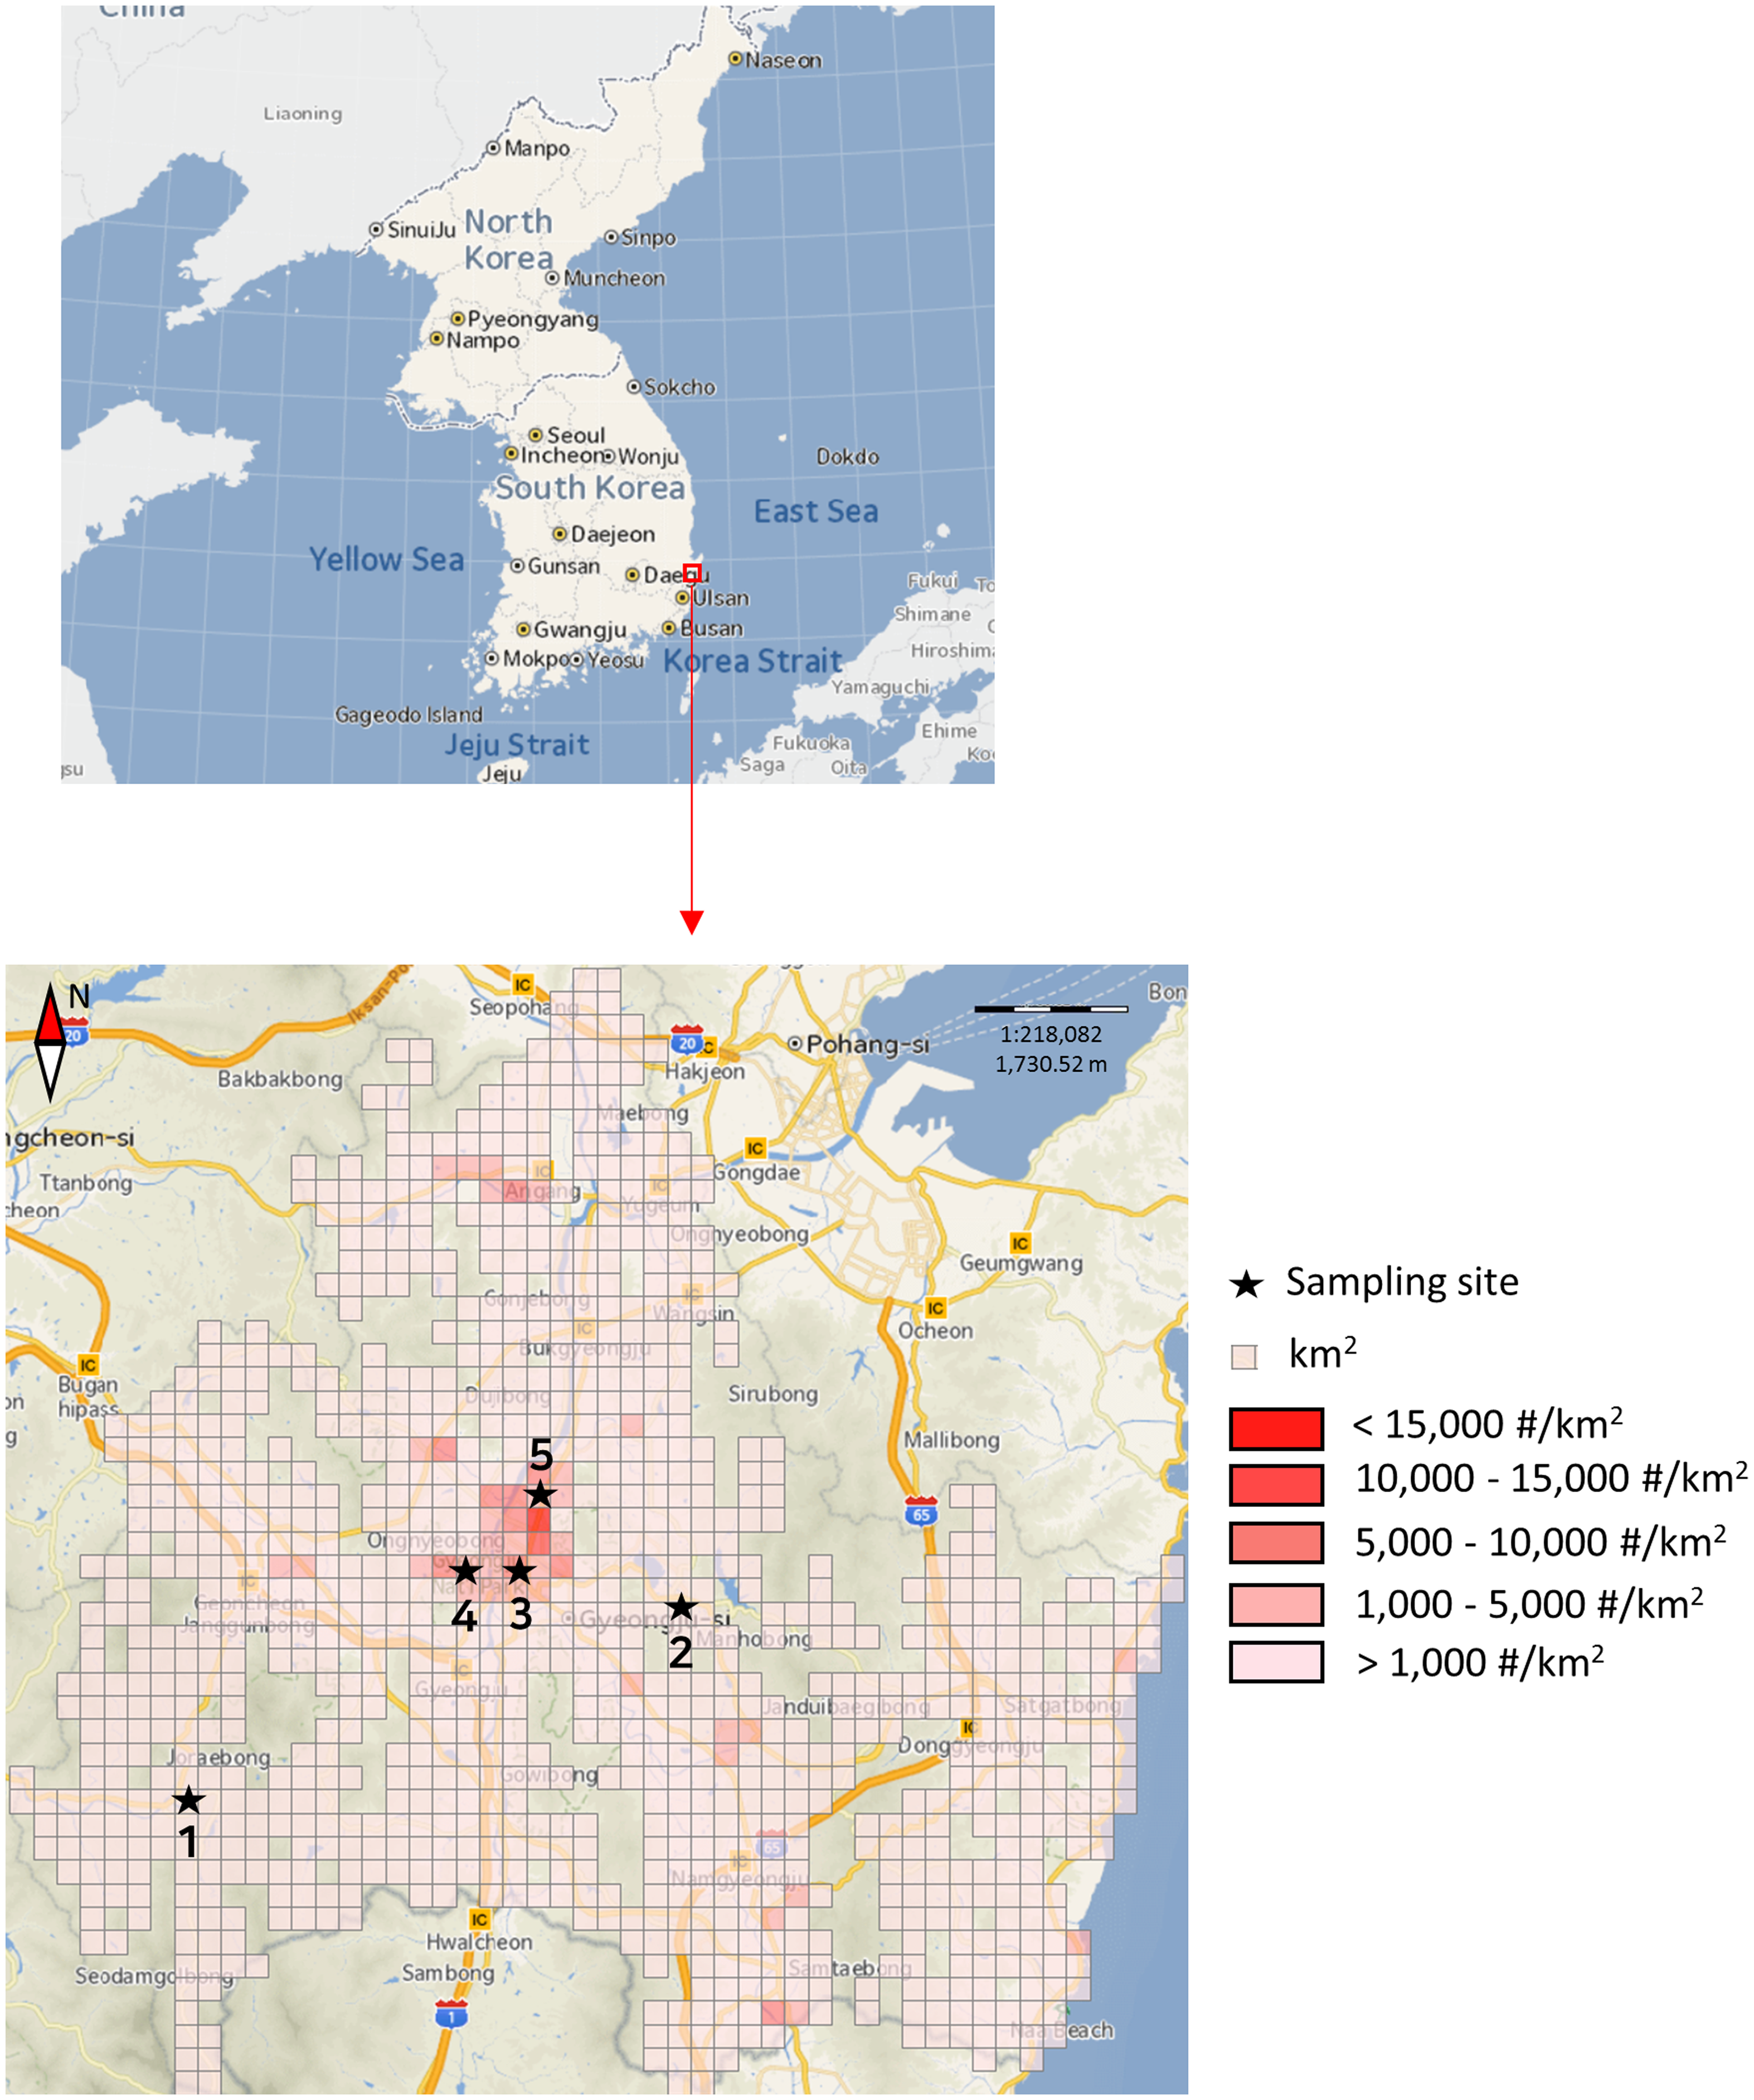
Figure 1 Sites of sampling points with their population density (as of October 2018).
Chemical Pretreatment and Graphitization
The leaves were chemically pretreated using as an acid-base-acid method to clean the surface and remove any contaminants (Brock et al. Reference Brock, Higham, Ditchfield and Ramsey2010). After pretreatment, the samples were dried at 60°C for 2 hr, followed by combustion in an Element Analyzer (FlashSmart, ThermoFisher Scientific, USA) at 1800°C to convert the carbon in the samples to CO2 (Aertz-Bijma et al. Reference Aertz-Bijma, van der Plicht and Meijer2001). The CO2 gas was trapped in the graphitization system installed at Dongguk University (Lee et al. Reference Lee, Kang, Lee, Kim, Park and Kim2020b). The gas was transferred to the reactor at −20°C through a vacuum line at low pressure (10–5 mbar), while H2O was trapped by low temperature in the CO2 trap line. Pure CO2 gas was reacted with iron powder and H2 at 550°C for approximately 3 hr, generating graphite powder along with iron. The graphite samples were pressed into an aluminum cathode using a pneumatic sample press (Ionplus AG, Switzerland) to measure the carbon isotope ratio (Lee et al. Reference Lee, Park, Kong and Kim2020a, Reference Lee, Kang, Lee, Kim, Park and Kim2020b).
Measurements and Calculations
The samples were measured using a MICADAS accelerator mass spectrometer at Dongguk University (Lee et al. Reference Lee, Park, Kong and Kim2020a). Oxalic Acid II (NIST-SRM 4990C) samples and IAEA-C1 samples were measured to normalize sample data and check the background of the AMS. The sample data were reduced using the BATS program (Wacker et al. Reference Wacker, Christl and Synal2010), which calculates the radiocarbon unit, δ13C, F14C, radiocarbon age, and calendar age, but does not calculate Δ14C. Carbon isotopes of the leaves are affected by mass fractionation and must be normalized with respect to a standard. The F14C unit is the ratio of leaf sample 14C activity and standard material (Ox-I) 14C activity, which we changed to a ratio (14C/12C). However, this unit does not represent the 14C decay of the standard sample from 1950. The Δ14C unit represents mass fractionation and radioactive decay, the following equation from Stuiver and Polach (Reference Stuiver and Polach1977) was used:
 $${\Delta ^{14}}C\;(\% ) = \left( {{{{{{}^{14}C} \over {{}^{12}C}}{]_{sample, - 25}} \times {e^{\left( {{{1950 - y} \over {8267}}} \right)}}} \over {0.7459{{\left( {{{{}^{14}C} \over {{}^{12}C}}} \right)}^2}{]_{{\rm{oxII}}, - 25}}}} - 1} \right) \times 1000\% $$
where 14C/12C]sample is the value of the measured sample and 14C/12C]oxII is the value of the standard sample (SRM 4990C). The BATS program was used to verify the precision of the measured data. Thus, the Δ14C values were calculated from the 14C/12C data.
RESULTS AND DISCUSSION
An increase in the Δ14C values from 2018 to 2021 was observed. The average Δ14C values were –25.1 ± 2.0‰ in 2018, –20.7 ± 2.0‰ in 2020, and –18.4 ± 3.0‰ in 2021, indicating an increase each year. The complete dataset for all 3 years ranged from −32.0‰ to −6.9‰. The minimum value was seen at the Downtown 1 site in 2018, while the maximum value was seen at the tourist site in 2021. Table 2 shows the overall AMS measurement results for the tree leaves.
Table 2 Annual 14C data of the leaves from Gyeongju, South Korea by year and sample site.

The sample value from the tourist site increased by 36.4% between 2018 and 2020 and 59.0% between 2020 and 2021. The rural site value increased by 27.3% between 2018 and 2020 and was stable between 2020 and 2021. The downtown 1 and downtown 2 site values were stable for 4 years, while the downtown 3 site value increased by 15.3% between 2018 and 2020 and was stable between 2020 and 2021. Next, the 14C ratio data at Gyeongju was compared with that of Jungfraujoch, Switzerland (Emmenegger et al. Reference Emmenegger, Leuenberger and Steinbacher2021). The measured 14C ratio of Jungfraujoch was greater than 0, and the values decreased between 2018 and 2019. The differences in these results indicate that the increase in the 14C ratio at Gyeongju was influenced by anthropogenic factors; the variation in the results is shown in Figure 2. The 14C ratio is indicated by the green line for the rural site, blue line for the tourist site, red line for downtown 1, black line for downtown 2, pink line for downtown 3 sites, and a yellow line for the Jungfraujoch (as background).

Figure 2 Δ14C (‰) values of all tree leaf samples and fresh air data of Jungfraujoch (as background).
A possible explanation for decreasing Δ14C values in small areas is 14C-free carbon released into the atmosphere from fossil fuel combustion (Turnbull et al. Reference Turnbull, Keller, Norris and Wiltshire2017).
The average 14C ratio in the city was increased from –28.8 ± 2.0‰ in 2018 to –25.9 ± 2.0‰ in 2020. The increase could be affected by a decrease in car mileage in the city from 38.7 km/day in 2018 to 37.5 km/day in 2020 (Korea Transportation Safety Authority. http://www.kotsa.or.kr [December 10, 2020]). With a higher population density (>10,000 /km2) than the rural and tourist sites, the downtown sites had lower Δ14C values. One explanation for the significant increase in the 14C ratio at the tourist site was the reduction in the number of tourists after 2019 due to the COVID-19 pandemic; the monthly numbers decreased by 16% in 2020 and 8% in 2021 compared to 2019 (Korea Tourism Organization. Visit Korea. https://datalab.visitkorea.or.kr [December 10, 2020]), and the total numbers decreased after 2019. The population density of the tourist site was similar to that of the rural site; however, the 14C ratio of the tourist site was lower than that of the rural site in 2018 and 2020. Nevertheless, the 14C ratio was higher at the tourist site in 2021 compared to the rural site despite a slight change in the population density. The variation in 14C content in the tourist site was mainly attributed to the decreased intensity of traffic connected to tourism. The 14C ratio of the downtown 1 and 2 sites was lower than that of the downtown 3 site because they are closer to a new tourist site called Hwang-ri-dan-gil in Gyeongju, which has been experiencing an increase in the number of visitors since 2018. In this study, samples were collected up to 24 km from the Wolsung nuclear power plant. Nearly all 14C from the power plant was deposited within a 2 km radius (Kim et al. Reference Kim, Lee, Rho and Lee2000). In addition, the distribution of 14C from nuclear power plants is influenced by geography, in combination with distance and meteorology. Tree samples were measured by Dongguk University and the 14C was blocked by To-ham Mountain (700 m height), which is located between the sampling site and the nuclear power plant (Lee et al. Reference Lee, Hwang, Jang, Choi and Kim2021). The distribution of 14C from nuclear power plants and its dependence on geography will be studied in the future. In addition, we aim to investigate the variations in 14C ratios in the study area based on tree-rings in follow-up research.
CONCLUSION
Fifteen samples from five different locations were measured in the region of Gyeongju, South Korea over 3 years (2018, 2020, and 2021), covering several industrial facilities, small residential sites, vast agricultural lands, and famous tourist sites. We studied the fossil carbon load of trees derived from three different types of areas: downtown, rural, and tourist sites. The city Δ14C average levels in the sampled tree leaves were –25.1 ± 2.0‰ in 2018, –20.7 ± 2.0‰ in 2020, and –18.4 ± 3.0‰ in 2021, showing a gradual increase each year. A possible explanation for this increase is a decrease in daily car mileage from 38.7 km in 2018 to 37.5 km in 2020. At densely populated sites, the Δ14C level was –26.4 ± 2.0 ‰, compared to the higher values from rural and tourist sites (–11.1 ± 2.0‰ and –16.6 ± 2.0‰, respectively). The Δ14C of the tourist site increased from –26.3 ± 2.0‰ in 2018 to −6.9 ± 3.0‰ in 2021. The significant increase at the tourist site may be affected by decreasing tourist numbers and reduced car mileage after 2019. In addition, we speculate that fossil carbon emissions were significantly affected by the pandemic situation after 2020. In the future, studies will be conducted on 14C in tree rings to further understand the carbon variability.
ACKNOWLEDGMENTS
This work was supported by the National Research Foundation of Korea (NRF) grant funded by the Korea government (MSIT) (No.2022R1A2C2006213).


 Open access