

Introduction
Small environmental changes during critical phases in a plant's life cycle can alter optimal timing for life-history transitions; these changes can have profound effects on plant distribution and survival by impacting on the reproductive success of individuals (Lloret et al., Reference Lloret, Peñuelas and Estiarte2004; Gworek et al., Reference Gworek, Vander Wall and Brussard2006). The high-risk, transitional germination stage of the life cycle that takes a seed to a seedling is of major importance for population persistence (Harper, Reference Harper1977; Silvertown and Charlesworth, Reference Silvertown and Charlesworth2001), in particular for obligate seeder species (i.e. those killed by fire). In fire-prone habitats this stage is often linked to the occurrence of fire (Bradstock, Reference Bradstock1991; Whelan, Reference Whelan1995).
Strong scientific evidence indicates that the environment is changing, and with these changes comes the potential for negative consequences for global biodiversity (IPPC, 2013). It appears certain that the Mediterranean-climate heathland systems of the South West Australian Floristic Region (SWAFR) sensu Hopper and Gioia (Reference Hopper and Gioia2004) will suffer a significant loss of plant diversity by the end of this century due to environmental change (www.environment.gov.au/climate-change; Malcolm et al., Reference Malcolm, Liu, Neilson, Hansen and Hannah2006; Fitzpatrick et al., Reference Fitzpatrick, Gove, Sanders and Dunn2008; Yates et al., Reference Yates, McNeill, Elith and Midgley2010). Already, these ecosystems are under stress from a history of vegetation fragmentation, changed hydrology and introduced diseases. Species distribution models are predicting high rates of extinction for the endemic species of this mega-diverse region, based on reduced rainfall (Fitzpatrick et al., Reference Fitzpatrick, Gove, Sanders and Dunn2008), rising temperatures (Pouliquen-Young and Newman, Reference Pouliquen-Young and Newman2000) and a doubling of carbon dioxide concentrations (Malcolm et al., Reference Malcolm, Liu, Neilson, Hansen and Hannah2006). Long-lived, obligate-seeding species with limited dispersal ability and those that are already at the limits of their geographic range may be highly sensitive to changes in the environment (Hughes et al., Reference Hughes, Cawsey and Westoby1996; McCarthy, Reference McCarthy2001; Parmesan and Yohe, Reference Parmesan and Yohe2003). Seeds and seedlings are expected to be particularly sensitive to climate variability and directional climate change (Hovenden et al., Reference Hovenden, Wills, Chaplin, Vander Schar, Williams, Osanai and Newton2008; Ooi et al., Reference Ooi, Auld and Denham2009; Ooi, Reference Ooi2012; Cochrane et al., Reference Cochrane, Hoyle, Yates, Wood and Nicotra2014a), but sensitivity will depend on species’ genetic and phenotypic plasticity, life-history characteristics, and ecological niche and geographic distribution (Broadhurst et al., Reference Broadhurst, North and Young2006; Nicotra et al., Reference Nicotra, Atkin, Bonser, Davidson, Finnegan, Mathesius, Poot, Purugganan, Richards, Valladares and van Kleunen2010).
In the SWAFR, temperature and precipitation gradients are strongly influenced by latitude in the relatively low-relief landscape of the region, and are highly correlated. Average annual rainfall declines and temperature increases in northward and eastward directions, as a result of the winter rainfall systems. The region, which is located at the cool, wet end of a hot, dry continent, has already experienced changes in temperature and precipitation. Observed temperatures for all of Western Australia have increased by approximately 0.8°C since 1910, with most of the increase occurring since 1950 (www.bom.gov.au; www.ioci.org.au). Total annual rainfall in the SWAFR itself has declined over the past 50 years and has been most apparent in later autumn and early winter (Bates et al., 2012). Future climate change scenarios vary but there are some common themes: there will be a continued upward change in mean annual temperature and a downward trend in patterns of precipitation. The coolest and wettest climate zones of the south-west will contract (Bates et al., Reference Bates, Hope, Ryan, Smith and Charles2008, Reference Bates, Frederiksen and Wormworth2012) with a 0.5–2°C temperature increase and a 2–20% rainfall reduction projected for the region by 2030. Species confined to the more southerly areas of the region will, by definition, be at great risk, with nowhere to go. Changes in species distributions are predicted. For example, Fitzpatrick et al. (Reference Fitzpatrick, Gove, Sanders and Dunn2008) forecast that 66% of the 100 species of Banksia (Proteaceae) they investigated would suffer declines in geographic range by 2080, based on simulated migration, with 5–25% of species predicted to become extinct. Similar range collapses were reported by Yates et al. (Reference Yates, McNeill, Elith and Midgley2010) when they combined the effects of climate change with land transformation to increase the predictive ability of the models for the future of SWAFR Banksia species. Although modelling climate scenarios, land transformation and simulating migration are useful tools, models only provide hypotheses and are limited by the complexity of demographic processes in natural systems (e.g. see Pearson and Dawson, Reference Pearson and Dawson2003). Such models typically assume that current species distributions are driven primarily by existing climates. However, the physiological thresholds for reproduction, growth and survival for many species are generally unknown and quantitative data on plant performance and climate tolerances are urgently required.
One of the most critical seed-related issues requiring investigation is how environmental variables that drive population performance will affect life-cycle events such as germination (Cochrane et al., Reference Cochrane, Yates, Hoyle and Nicotra2015). Temperature is one driver that plays a critical role in the regulation of seed germination (Probert, Reference Probert and Fenner2000). Consequently, understanding temperature requirements for germination will help alert us to likely changes to species persistence under altered climates (Cochrane et al., Reference Cochrane, Daws and Hay2011, Reference Cochrane, Hoyle, Yates, Wood and Nicotra2014b). The disruption of current germination strategies as a consequence of changes in temperature associated with predicted climate change is likely to result in alteration of demographic rates, potential mismatch in the timing and placement of germination for many species and, ultimately, changes in geographic distribution (Luna et al., Reference Luna, Pérez, Torres and Moreno2012; Mondoni et al., Reference Mondoni, Rossi, Orsenigo and Probert2012; Ooi, Reference Ooi2012). Obligate-seeding species that are killed by fire and rely solely on seeds for regeneration should make good ‘indicator species’ for tracking the impact of warming climates on germination traits.
Here, germination temperature profiles developed for both common and widespread obligate-seeder species in the genus Banksia L.f. (Banksia subg. Banksia sensu George) endemic to the cool, wet South Western Australian Botanical Province (SWAFR) are reported. The impact of altered temperatures associated with anthropogenic climate change on future germination response under forecast future climates are modelled. Two climate severity scenarios (low and high radiative forcing) for two time periods (2050 and 2070) were chosen for simulation. Two hypotheses were explored: (1) that increasing temperatures relevant to the climate scenarios would alter germination traits such as percentage and timing; and (2) that species with more restricted distributions (reflected in their listing as conservation-dependent species) would be affected disproportionately by these temperature changes.
Materials and methods
Study species and seed collection
In Western Australia, Banksia is a genus represented by 158 species, almost all endemic to the SWAFR (http://florabase.dpaw.wa.gov.au/statistics/WACensus_2013-06-01_table3.pdf). Originally comprised of 73 species (George, Reference George and Wilson1999), the genus underwent a taxonomic rearrangement to include Dryandra R.Br. (Mast and Thiele, Reference Mast and Thiele2007). Ninety-three taxa are listed as conservation-dependant (http://florabase.dpaw.wa.gov.au/). The genus is generally confined to the cooler south-western end of Western Australia by climate, being naturally restricted to areas with a >250 mm rainfall isohyet (Lamont and Connell, Reference Lamont and Connell1996). In the winter-wet, summer-dry Mediterranean-type climate of the SWAFR, germination of Banksia seeds occurs in response to the cool, wet conditions prevalent in late autumn and winter. Banksias hold their fruits in the canopy of the plant in woody cones (serotiny) with seed dispersal triggered by the heat-induced opening of cones (Lamont et al., Reference Lamont, de Maitre, Cowling and Enright1991). The degree of serotiny can vary among species and along climatic gradients (Cowling and Lamont, Reference Cowling and Lamont1985), but for most of the obligate-seeder species, recruitment is limited to the post-fire phase, with some exceptions. These non-lignotuberous obligate seeders are considered to be most vulnerable to stressors such as altered climatic conditions and too frequent fire (Lamont et al., Reference Lamont, Enright, Witkowski and Groeneveld2007), with sprouters potentially having wider environmental tolerances and greater persistence once mature (Bond and Midgley, Reference Bond and Midgley2001). In the fire-prone vegetation communities of the SWAFR some 60% of Banksia species (Banksia subg. Banksia sensu George) are obligate seeders (Lamont and Markey, Reference Lamont and Markey1995).
Fruiting cones were collected from the wild from populations of all 38 of the obligate-seeder Banksia species (including three sprouter species) from the SWAFR, between July 2008 and June 2009 (47 collections) (Fig. 1, see Table 1). Six species with restricted geographic distribution and of conservation concern were included in the experiment (see Table 1). Cones were sampled from a minimum of 20 individuals within each population and generally from the most recent cohort of mature fruit. Fruiting cones of Banksia consist of few to many hard, woody follicles containing two valves that split open to release one or two seeds and an intervening plate known as the septum. The non-endospermic seeds have a membranous terminal wing for wind dispersal.
Figure 1 The location of 47 Banksia seed source sites (▲) in the South Western Australian Floristic Region.
Table 1 Mean time to germination and the average and amplitude of temperature fluctuations at maximum germination for 41 Banksia species (47 collections) from Western Australia. All species are endemic to the SWARF and are killed by fire (obligate seeders) unless indicated by # (resprouters)
S = southern; N = northern; W = widespread; * species of conservation concern.
Seeds were extracted from woody cones using a gas flame from a blowtorch until the follicles cracked open (2–4 s), then cones were soaked in water for 6 h before being placed to dry in a warm location. Under these conditions, the time taken for seeds to extract from fruiting cones varied between species, ranging from immediately after burning to the requirement for a week of drying. After extraction, seeds were stored in a drying room at 15°C and 15% relative humidity (RH) until use. Seedlots were allowed to equilibrate to ambient laboratory conditions (c. 20°C/50% RH) prior to incubation on agar. Once released from woody fruiting cones, Banksia seeds are highly viable, show no innate dormancy and germinate freely when given sufficient moisture and an appropriate temperature. Herbarium voucher specimens were made at the time of fruit collection to vouch for the identity of the species, and were subsequently lodged with the Western Australian Herbarium, Perth, Australia (http://florabase.dpaw.wa.gov.au/).
Environmental data
Climate data (average monthly minimum and maximum temperatures and average monthly precipitation) for each seed source site were obtained from WorldClim, a set of global climate layers with a spatial resolution of approximately 1 km2 (Hijmans et al., Reference Hijmans, Cameron, Parra, Jones and Jarvis2005). The data for ‘current’ conditions were derived from 1950–2000 averages. Future projections for the same climate variables were downloaded from the downscaled Hadley Centre Global Environment Model version 2 (HADGEM2-ES http://www.metoffice.gov.uk/research/modelling-systems/unified-model/climate-models/hadgem2) using low [Representative Concentration Pathway (RCP) 2.6] and high (RCP 8.5) greenhouse gas emission scenarios for two time periods (2050 and 2070). The HADGEM2-ES model (Jones et al., Reference Jones, Hughes, Bellouin, Hardiman, Jones, Knight, Liddicoat, O'Connor, Andres, Bell, Boo, Bozzo, Butchart, Cadule, Corbin, Doutriaux-Boucher, Friedlingstein, Gornall, Gray, Halloran, Hurtt, Ingram, Lamarque, Law, Meinshausen, Osprey, Palin, Parsons Chini, Raddatz, Sanderson, Sellar, Schurer, Valdes, Wood, Woodward, Yoshioka and Zerroukat2011) was chosen because it includes dynamic vegetation, ocean biology and atmospheric chemistry, it was used in the Fifth Assessment Report of the Intergovernmental Panel on Climate Change (IPPC, 2013) and has previously been used in simulating germination response in native species (Fernández-Pascual et al., Reference Fernández-Pascual, Seal and Pritchard2015).
Experimental design
A bi-directional temperature gradient plate (TGP) (Model GRD1, Grant Instruments, Cambridge, UK) was used to provide 196 different temperature combinations that provided both constant and diurnally alternating temperatures ranging from approximately 5 to 40°C. A 12-h thermoperiod was used. When the TGP gradient ran in bi-directional mode, one-half of the cell grids received 12 h of light during the warm part of the diurnal cycle and the other half received 12 h of light during the cool part of the cycle. Four species were germinated at each run of the TGP, providing 49 temperature combinations per species with temperature amplitudes between 0 and 23°C. For each temperature combination either 5 or 10 seeds were used, depending on seed size. Because of space constraints on the TGP, no replication of temperature combinations was possible. Seeds, without wings, were sown on the surface of 1% w/v water-agar on 35-mm Petri dishes. Actual temperatures experienced by seeds were determined by five thermistors on the plate, connected to a data logger (Grant Instruments Squirrel 2020 Series, Cambridge, UK). All environments received irradiance for 12 h d− 1 (fluorescent white light ~50 μmol m− 2s− 1). Germination was scored every 2–3 d and was defined as visible radicle emergence. Each germination test ran for 6 weeks, at which time remaining seeds were subjected to a cut-test to determine viability. Percentage germination was calculated as the percentage of seeds that germinated within the incubation period. Seeds with a hard, white endosperm and embryo were scored as potentially viable; empty seeds were removed from the original count.
Data analysis
To determine the response curves for each species and identify the optimal average and diurnally alternating temperature conditions for germination (for both percentage germination and mean time to germination), regression models were fitted to the data from the TGP experiment. The proportion of seeds that germinated per dish and mean time to germination were the dependent variables in logistic and ordinary linear regression models, respectively. Each seed was treated as an independent unit in the logistic regression (i.e. each seed could either germinate or not during the experiment). Mean time to germination (MTG) was calculated for all temperatures (where germination occurred) using the equation:
 $$\begin{eqnarray} MTG = \sum ( n \times d )/ N , \end{eqnarray}$$
where n= number of seeds germinated between scoring intervals; d= the incubation period in days at that time point; and N= total number of seeds germinated. The temperature values for each cell of the gradient plate (diurnal temperatures, average of day/ night temperatures, and amplitude of temperature range) were used as the independent variables to construct four alternative models. Model 1 used the day and night temperatures within each cell as independent variables; model 2 used mean temperature in each cell as the independent variable; model 3 used the amplitude of temperature fluctuation in each cell; and model 4 used a combination of mean and amplitude of temperature. To allow for possible non-linear responses to temperature, the squares of each temperature variable were included in each model. In all models a binary variable was included denoting the timing of light during the diurnal cycle (i.e. whether light coincided with the warm or cool part of the cycle) as one-half of the cells on the temperature-gradient plate had both day and night phases when temperature was higher (the latter being less meaningful, ecologically). Once the best-fitting of the four alternative models for MTG and germination were determined (based on the lowest deviance value), the optimal temperature conditions (day/night temperature cycle) for germination for each species was estimated.
Finally, using the best-fitting models described above, the projected responses of each species under current and forecast monthly average minimum and maximum temperature conditions for two greenhouse gas emission scenarios were estimated, thus providing a germination response for each month of the year. These temperatures were derived from climate projections from the HADGEM2-ES GCM that were downscaled and calibrated using WorldClim as the baseline ‘current’ climate (1950–2000). The two greenhouse gas scenarios were low (RCP 2.6) and high emission (RCP 8.5) for 2050 (average 2041–2060) and 2070 (average (2061–2080). Statistical analysis was conducted in GENSTAT 16th edition (VSN International, Hemel Hempstead, Herts, UK); contour plots showing germination on the bi-directional temperature gradient plate were created using Origin 9.1 (Origin Lab Corporation©, Northampton, Massachusetts, USA).
Results
Observed results
Optimal temperature conditions for germination for each collection were identified by locating the grid cell or cells on the temperature gradient plate that delivered highest germination of seed in the shortest possible time (Table 1), the results thus acting as a fine-scale indicator of peak germination season for each species. Most species returned complete germination in at least one cell of the plate over the 6-week incubation period, with the exception of B. coccinea (89%), B. seminuda (60%), and B. quercifolia and B. brownii (90%). The mean and amplitude of temperature that produced highest germination in the shortest possible time varied between species: mean temperatures ranged from 10.4°C (B. dryandroides) to 25°C (B. seminuda), with an overall mean of 16.2°C; temperature amplitudes ranged from less than 1°C (temperatures virtually constant) to 22.6°C (large temperature oscillations). The estimates of the mean temperature for germination were related to latitude from where seeds were sourced (r 2= 0.4369, Fig. 2); however, the optimal temperature amplitude for germination had no relationship to latitude (r 2= 0.0491), as increasing temperature amplitudes resulted in both positive and negative germination performance and were thus meaningless in forecasting germination response. The mean time to complete germination (MTG) at the optimal temperature regime ranged from 8 d (B. leptophylla) to 26.7 d (B. coccinea), with a mean of 15.5 d across all collections (Table 1). Examples of contour plots describing germination over the range of temperatures on the gradient plate are presented in Fig. 3. The full complement of contour plots for all collections is accessible in supplementary Fig. S1.
Figure 2 Relationship between latitude and mean optimal temperature (Topt) for germination in 41 species (47 collections) of Banksia from the South Western Australian Floristic Region (r 2= 0.4369) (P < 0.0001). Note: one species was removed (B. seminuda, ●) as an outlier and was not included in the regression line.
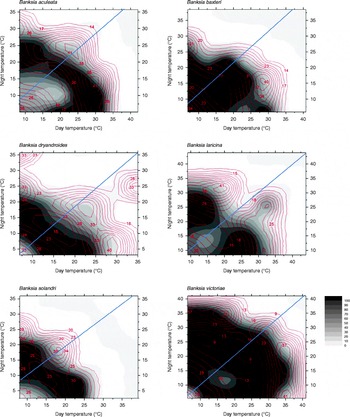
Figure 3 Six examples of contour plots for observed data for seeds of Banksia aculeata, B. baxteri, B. dryandroides, B. solandri and B. victoriae. Points of equal percentage germination are connected by germination isopleths. The gradation in colours from dark (black = 100%) to light (white = 0%) represent decreasing percentage germination. The contour lines within each plot represent mean time to germination at various levels of germination. Constant temperatures are presented on the diagonal line from the bottom-left corner of the diagrams (lowest temperature c. 5°C) to the top-right corner (maximum temperature c. 40°C). All points above and below the diagonal line represent alternating temperature regimes, with greatest amplitude at the top-left and bottom-right corners of each graph. The diagonal line from bottom left to top right corner of each plot signifies the divide between diurnal cycles that have light during the warmer day regime (bottom right section) and dark during the warmer day regime (top left section).
Model predictions
The diurnal temperature cycle (model 1) or the combined effects of mean and amplitude of the diurnal cycle (model 4) provided the most accurate predictions for germination performance under current and future temperature conditions. The goodness of fit between the actual (TGP observed data) and the predicted germination responses as returned by the model was tested for each species using the coefficient of determination. Germination responses to the temperature increases forecast for 2050 (RCP 2.6 and 8.5) and for 2070 (RCP 2.6) lay between the current (1950–2000) and predicted 2070 (RCP 8.5) response and only the latter comparisons are reported here. Across all collections, the R 2 was better at explaining variation in percentage germination (84%) than in germination timing (65%) (see supplementary Table S1); however, both were highly significant (P > 0.001). The discrepancy between observed and predicted values was low when taking into account the number of temperature samples (49 per species). Models 2 and 3 (mean of diurnal cycle and amplitude of diurnal cycle, respectively) proved less accurate as predictors of future germination, as determined by the deviance value in each model. Most species appear to have no specific light requirement during the warmer phase of the diurnal cycle, as high germination occurs both above and below the diagonal line; however, the models predicted that light during the warm phase of the thermal cycle was important for germination for nine of the southern species (B. baueri, baxteri, B. brownii, B. coccinea, B. media, B. meisneri, B. nutans, B. occidentalis and B. quercifolia) but only one of the northern species (B. benthamiana).
Overall, five distinct germination response curves were identified for the forecast conditions. The most common prediction for germination response (19 species; 20 collections) was for higher germination during the usually cooler winter months (Jun–Aug) compared to that predicted under current winter conditions (Fig. 4a). The greatest shift in percentage germination during the winter months was experienced by B. blechnifolia from the south of the SWAFR: under current temperature conditions the month of May delivers the highest germination potential (100%), with winter temperatures during July producing lower germination (67%). However, under future temperature conditions, germination is predicted to rise to 90% in that month. In the north, B. burdettii showed a similar pattern, where germination was currently optimal under conditions experienced in May and declined to 50% over the winter months; under future temperature conditions germination was predicted to increase to 74% in July. It can be seen, therefore, that these two species currently favour the warmer autumn temperature conditions for optimum germination, a period when moisture is usually available. A similar response was seen in other species (e.g. B. caleyi and B. benthamiana), but the winter increase in germination was predicted to be smaller. The pattern of germination timing was mixed: some species experienced more rapid and complete germination response in the winter months (e.g. B. attenuata: from 91% in 22 d under current conditions to 96% in 18 d under predicted conditions; B. sceptrum: 56% in 24 d compared to 71% in 19 d). For some species (e.g. B. coccinea, B. quercifolia and B. lanata) there was virtually no change in MTG in conjunction with the increase in percentage germination in the winter months, but in most cases MTG increased exponentially under future thermal conditions either side of the traditionally cooler temperatures of May to October.
Figure 4 Five examples of species germination response to modelled current and predicted (RCP 8.5 for 2070) temperature conditions. Left panels: percentage germination; right panels: mean time to germination (MTG). ●, Predicted current germination; ○, predicted future germination; ▲, predicted current MTG; Δ, predicted future MTG. (a) Maximum germination increases during winter months; (b) the window of opportunity for high germination narrows; (c) germination changes are minimal; (d) higher germination combined with lower mean time to germination; and (e) germination consistently lower all year. Solid lines represent the regression fit to current temperatures; dotted lines for predicted temperatures (RCP 8.5 for 2070).
The second example of predicted germination responses to warmer temperatures was a narrowing of the germination window (for maximum germination) over the winter months (Fig. 4b). Some 15 species (17 collections) displayed this response. In most cases, MTG response to warmer temperatures was again mixed.
A third response was provided by species that showed relatively little decline in germination under the forecast warmer temperatures. This response was seen in two critically endangered species with restricted southern distributions (B. brownii and B. verticillata) as well as in five other commonly occurring species with larger geographic distributions (8 collections: see, for an example, Fig. 4c). Mean time to germination again varied, sometimes becoming higher during the critical winter months (e.g. B. grandis and B. leptophylla) and sometimes lower (e.g. B. media and B. pilostylis). Only one species (B. seminuda) displayed a reduction in mean time to germination while increasing percentage germination in all months under forecast conditions (Fig. 4d).
A single species (B. dryandroides) responded to the predicted warmer temperatures by an increase in germination rate but lower final germination across all months, suggesting that this species is most likely to decline under future climate scenarios (Fig. 4e).
Both different and similar germination responses occurred among populations of the species that were tested across multiple populations. Three collections of Banksia baueri (SRNP, EMB and TR) displayed two different germination responses when modelled against predicted future temperature conditions: seeds from EMB and SRNP populations currently have high winter germination, which does not appear to change under future forecast conditions (Fig. 5a, b). Population TR, at slightly lower latitude, currently has lower germination during the cooler winter months than either population SRNP or EMR, but under forecast future conditions germination will increase during the winter months (Fig. 5c). All three populations exhibit a narrowing of the germination window under future conditions. Other species that were represented by two collections from different localities (B. attenuata, B. pilostylis, B. prionotes and B. violaceae) did not appear to differ from each other in their responses in any notable way (data not shown), with the exception of B. prionotes (Fig. 6a, b). The more southern collection of this species exhibited a much narrower window for germination, with germination declining steeply either side of this window. In contrast, the northern population (>300 km from the southern population) demonstrated a much wider germination window during the autumn–winter months.
Figure 5 Modelled germination for three collections of Banksia baueri under current temperature conditions and predicted conditions using the high-emission greenhouse gas scenario (RCP 8.5) for 2070. Left panels: percentage germination; right panels: mean time to germination (MTG). ●, Predicted current germination; ○, predicted future germination; ▲, predicted current MTG; Δ, predicted future MTG.
Figure 6 Differences in modelled germination of two collections of Banksia prionotes under current temperature conditions and predicted conditions using high-emission greenhouse gas scenario (RCP 8.5) for 2070. Left panels: percentage germination; right panels: mean time to germination (MTG). ●, Predicted current germination; ○, predicted future germination; ▲, predicted current MTG; Δ, predicted future MTG.
Discussion
Observed and modelled germination response
Many of the species investigated displayed a broad thermal sensitivity for germination under a range of temperature conditions, greater than expected based on their current distributions alone, and for those species represented by multiple seed lots, there was evidence of both among-population differences and similarities. The models predicted that temperatures for germination for most species are currently optimal in late autumn (May). In the SWAFR this is traditionally the timing of the ‘break’ in weather, when autumn rainfall commences and the soils are still relatively warm.
The first hypothesis, that increasing temperatures relevant to the climate scenarios would alter germination traits, proved correct, with timing of maximum germination for many species predicted to advance from late autumn into early winter, as the onset of germination was delayed by temperatures above the current temperatures generating maximum germination. Shifts in timing of emergence under global warming scenarios have been reported previously in northern hemisphere alpine and sub-arctic species (a shift from spring- to autumn-dominated emergence) (Milbau et al., Reference Milbau, Graae, Shevtsova and Nijs2009; Mondoni et al., Reference Mondoni, Rossi, Orsenigo and Probert2012, Reference Mondoni, Pedrini, Bernareggi, Rossi, Abeli, Probert, Ghitti, Bonomi and Orsenigo2015). In seasonally dry ecosystems like the SWAFR, germination timing is critical when moisture is a limiting factor, and there can be considerable fitness losses for organisms that fail to time behaviours optimally (McNamara et al., Reference McNamara, Barta, Klaassen and Bauer2011). Delayed germination may result in reduced fitness in a competitive environment, with the possibility of invasion by other quicker growing species more adept at coping with new conditions. However, slower germination may also be considered a risk-spreading strategy (see Zammit and Westoby, Reference Zammit and Westoby1987) as not all seeds commit to a single rainfall event. Those species that were found to increase the speed (and total germination) response under future scenarios may potentially reduce their ability to cope with increasingly variable rainfall, even during the wet season.
The models used in this study further predict that rising temperatures associated with anthropogenic climate warming are unlikely to adversely affect levels of seed germination in wild populations of many obligate-seeding Banksia species per se. For some species there may be a benefit from variability in environmental conditions, as it may lead to more frequent conditions for recruitment (i.e. increased germination during the cooler months of the year relative to current expectations). Actual declines in germination under the region's forecast temperature increases across all months of the year are expected in only one species (B. dryandroides). This species has no close relations with other species in the Banksia phylogeny and lies in the monophyletic series Dryandroideae (Mast and Givnish, Reference Mast and Givnish2002). The impact of climate change on the geographic distribution of B. dryandroides has been modelled by Fitzpatrick et al. (Reference Fitzpatrick, Gove, Sanders and Dunn2008) and Yates et al. (Reference Yates, McNeill, Elith and Midgley2010), and both studies predicted a severe reduction in range size for this species based on a reduction in rainfall forecast for the region. B. dryandroides is a relatively short-range endemic with a predominantly coastal, east–west geographic distribution of less than 170 km, but it is not yet considered of conservation concern, despite populations being generally small and fragmented (Sarah Barrett, pers. comm., May 2015, Department of Parks and Wildlife). A change in the number of seeds that germinate and/or the timing of that germination can result in a decline in seedling abundance with the potential for population and species extirpation, leading to a change in vegetation community dynamics. In the light of these current results, a closer look at the conservation status of this species may be required in the future.
The second hypothesis, that species with more restricted distributions would be disproportionately affected by the temperature changes forecast for the region, was not fully supported. Southern- and northern-distributed species varied little in their thermal sensitivity for germination and, contrary to expectations and previous research (e.g. see Luna et al., Reference Luna, Pérez, Torres and Moreno2012), species with more restricted distributions (i.e. the species of conservation concern) were not considered more thermally sensitive or disproportionately affected by forecast temperature change. For two geographically restricted conservation-listed species (B. brownii and B. verticillata), the models predict that germination will alter little under the forecast warmer conditions, and neither the timing nor the percentage of germination is predicted to change.
In isolation, the mean incubation temperature was shown to be inadequate for predicting future germination response, and temperature fluctuations (either as diurnal temperatures, or the amplitude of temperature fluctuations coupled with the mean) appear to be more important for predicting current and future germination performance. Changes in the means and amplitudes can result in both positive and negative germination performance, as the typical thermal performance curve is non-linear and performance can vary relative to the value predicted by a mean temperature (Vasseur et al., Reference Vasseur, DeLong, Gilbert, Greig, Harley, McCann, Savage, Tunney and O'Connor2014). The models were designed to incorporate variability in climate by considering mean monthly minimum and maximum temperatures forecast for each specific seed source site, to provide a more ‘realistic’ prediction of germination response to changing temperature conditions. However, estimates from WorldClim are for air temperatures and do not reflect the temperatures that a seed experiences at the soil surface, which can be considerably higher (Ooi, Reference Ooi2012). In the absence of soil-surface temperature data for individual sites, modelled air temperatures from WorldClim have been used. These data, though, are likely to be an underestimation of soil-surface temperatures, in particular during the summer months. In addition, the bare soils of a post-fire environment would absorb more heat than those with covering vegetation, and as most species investigated in this study require fire for serotinous seed release and dispersal, this may help to explain why seeds can germinate over a wide range of temperatures, some quite high.
These predictions are also made without considering the key limiting factor of moisture. Mediterranean-type ecosystems like the SWAFR typically experience winter-wet, summer-dry climates, and the germination of many plant species coincides with the cooler moist conditions of autumn–winter. The observed pattern of Banksia species richness is closely linked to precipitation gradients (Lamont and Connell, Reference Lamont and Connell1996) and without moisture there will be no recruitment opportunities for non-sprouting species regardless of temperature. Across the seed source sites, the bioclimatic models predict a reduction in mean annual precipitation of between 14% and 29% (RCP 2.6 for 2050 and RCP 8.5 for 2070, respectively), which will result in further declines in net accumulated rainfall available to seeds and newly emerged seedlings of between 25 and 55%. The predicted delays in germination in conjunction with these forecast declines in rainfall will place seedlings of most species closer to the forecast drier summer dry and thus more vulnerable to desiccation. Even if a species is capable of continuing to occupy a site, a changing climate could result in the organism being further from its physiological optimum and therefore closer to the edge of its range, and thus at risk of being outcompeted. Further research is urgently required to understand the interaction of temperature and moisture stress on seed germination in this genus.
Population variation and multiple drivers of environmental change
Species’ environmental limits are not necessarily stable, and the presence of intra-specific variation can lend a dynamic nature to the tolerance limits of a species, depending on the interaction of gene flow, natural selection and demography (Davis and Shaw, Reference Davis and Shaw2001). Consequently, inferring threat on the basis of results from one population should be viewed with caution, given the variation in germination patterns already observed along environmental gradients in this and other studies (e.g. Hernández-Verdugo et al., Reference Hernández-Verdugo, Oyama and Vázquez-Yanes2001; Cochrane et al., Reference Cochrane, Hoyle, Yates, Wood and Nicotra2014a, Reference Cochrane, Hoyle, Yates, Wood and Nicotrab, Reference Cochrane, Yates, Hoyle and Nicotra2015). Identifying spatial patterns in germination thresholds can help us to understand species’ range distributions, in particular under changing climates (Qiu et al., Reference Qiu, Bai, Fu and Wilmshurst2010), with failure to consider individual population responses potentially over- or underestimating the plasticity and capacity for adaptation to new conditions (Albert et al., Reference Albert, Thuiller, Yoccoz, Soudant, Boucher, Saccone and Lavorel2010, Beierkuhnlein et al., Reference Beierkuhnlein, Thiel, Jentsch, Willner and Kreyling2011).
The quantification of thermal sensitivity for a single reproductive trait also needs to be considered in the context of multiple environmental drivers, species interactions (see Berg et al., Reference Berg, Kiers, Driessen, van der Heijden, Kooi, Kuenen, Liefting, Verhoef and Ellers2010) and the dynamics of colonization. Adult mortality, coupled with declining or delayed seedling recruitment, has the ability to change species dynamics with implications for community structure and function. Changes in fire regime associated with climate change include more frequent and more intense fires (Flannigan et al., Reference Flannigan, Krawchuk, de Groot, Wotton and Gowman2009), and these changes have the potential to lead to loss of serotinous species such as Banksia. Too frequent fire may constrain maturation of the aerial seed bank, while a lengthy disturbance interval may exceed the life span of individuals. Alternatively, a favourable fire regime change may stimulate population growth if the new regime better matches the life history and reproductive timing of those species (Buma et al., Reference Buma, Brown, Donato, Fontaine and Johnstone2013). Species may persist under sub-optimal climatic conditions, or a narrowing of the germination window, but high mortality of seedlings post-fire due to reduced rainfall may gradually erode population size, in conjunction with pressure from other stressors. Post-release granivory and herbivory, as well as unsuitable germination conditions, mean that few viable seeds become seedlings after fire (Lamont and Groom, Reference Lamont and Groom1998; Lamont et al., Reference Lamont, Enright, Witkowski and Groeneveld2007). Loss of plants through disease, in particular Phytophthora cinnamomi, compounds management and conservation challenges in the SWAFR (Shearer et al., Reference Shearer, Crane and Cochrane2004, Reference Shearer, Crane, Barrett and Cochrane2007). The interaction of disease and a changing climate is predicted to exacerbate the risk of native plant extinction (Chakraborty et al., Reference Chakraborty, Murray, Magarey, Yonow, O'Brien, Croft, Barbetti, Sivasithamparam, Old, Dudzinski, Sutherst, Penrose, Archer and Emmett1998; Sutherst, Reference Sutherst, Mooney and Hobbs2000).
Conclusions
The dynamics of regeneration by seeds under changing climates is a pressing global issue for plants and is in need of further research. Details on seed performance under a range of environmental conditions will assist in understanding how climate change may affect plant regeneration. Linking observed biological data with historical and forecast diurnal seasonal temperature data from climate modelling can help set priorities for the development of more effective management strategies that may reduce the chances of climate-driven extinction. In the light of these results, future research could be aimed at screening species for their environmental thresholds, in conjunction with monitoring the effects of a warming and drying climate on recruitment in the species most temperature-limited for germination, or, in the case of seasonally dry ecosystems, where drastic reductions in rainfall are forecast. Despite the high level of uncertainty in climate projections, it is vital that we incorporate expected future climates into recovery planning and restoration practice, as the usefulness of historical ecosystem conditions is questioned (Harris et al., Reference Harris, Hobbs, Higgs and Aronson2006).
Supplementary material
To view supplementary material for this article, please visit http://dx.doi.org/10.1017/S0960258515000355.
Acknowledgements
The author thanks Susanne Schreck for technical assistance with seed collection and germination, Dr Mathew Williams for statistical advice and Dr Adrienne Nicotra for comments on a previous draft. Three anonymous reviewers are acknowledged for their comments, which greatly improved the paper.
Financial support
This research was supported by a Natural Heritage Trust grant from the Australian Government through the South Coast Natural Resource Management Inc. (Project 04SC1-13h) and the Millennium Seed Bank Project, Royal Botanic Gardens Kew, UK.
Conflicts of interest
None.


