

Introduction
Two aspects of seed lot quality are routinely conducted on commercial seed lots – standard germination and seed vigour tests. Standard germination is a required test for agricultural seed lots and reports the percentage of normal seedlings observed after germination under near-optimal environmental conditions. Standard germination conditions follow accepted rules from agencies such as the Association of Official Seed Analysts (AOSA) and the International Seed Testing Association (ISTA). Standard germination percentages provide an estimation of a seed lot's potential for germination and seedling establishment under favourable conditions. In contrast, seed vigour analysis of a seed lot is not required to be provided by the seed producer. Seed vigour consists of those attributes that determine the potential for rapid, uniform development of seedlings under variable field conditions (Marcos-Filho, Reference Marcos-Filho2015). Therefore, seed vigour is often a better indicator of stand establishment in the field (TeKrony and Egli, Reference TeKrony and Egli1977; Torres and Marcos-Filho, Reference Torres and Marcos-Filho2005; Sanches et al., Reference Sanches2014).
Seed vigour tests fall roughly into three general categories (Geneve, Reference Geneve, McDonald and Kwong2005). The first set of tests measure standard germination percentage after a pre-germination stress imposition. The second group indirectly measures germination potential utilizing an accepted physiological or biochemical aspect of germination. The third set of vigour tests utilizes visual post-germination analysis. The major stress-related vigour tests include accelerated ageing, controlled deterioration, and cold test, while the most utilized indirect method uses electrolyte leakage (Marcos-Filho, Reference Marcos-Filho2015). Post-germination visual assessment can be a qualitative determination of seedling emergence or quantitative evaluation of seedling size or the time to radicle emergence (Matthews and Powell, Reference Matthews and Powell2011). Quantitative seedling evaluation has been mechanized utilizing computer-aided image analysis to provide a vigour index calculated from seedling size and uniformity (Hoffmaster et al., Reference Hoffmaster2005; Dell'Aquila, Reference Dell'Aquila2009).
Except for electrolyte leakage, germination and vigour tests are generally destructive evaluations. There is a need in the industry for a simple, non-destructive evaluation method for seed lot germination and vigour (Rahman and Cho, Reference Rahman and Cho2016). Several biochemical and vision systems have emerged as potential candidates for routine seed analysis. Respiration following imbibition has been linked to seed quality and evaluation of early oxygen consumption by seeds has been proposed as a seed quality assessment tool (Bradford et al., Reference Bradford2013). This system uses a fluorescence technique to analyse respiration of individual seeds in enclosed microwells and provides the ability to evaluate population variation related to seed vigour on a single-seed basis.
Multispectral imaging in the visible, hyperspectral (450–950 nm) and near-infrared (NIR) (950–1650 nm) has been used successfully to non-destructively assess seed quality and sort seeds based on seed health (Olesen et al., Reference Olesen, Carstensen and Boelt2011a), seed deterioration (Dell'Aquila, Reference Dell'Aquila2006), viability (Olesen et al., Reference Olesen2015), as well as abiotic (Wang et al., Reference Wang, Ram and Dowell2002; Agelet et al., Reference Agelet2012; Jia et al., Reference Jia2016) and biotic (Pasikatan and Dowell, Reference Pasikatan and Dowell2001) seed damage.
Near-infrared spectroscopy (NIRS) provides a simple, rapid and non-destructive analytical technique with little sample preparation time and high-throughput, making it very attractive as a seed analysis tool. NIRS evaluates internal aspects of a seed important to viability and vigour including protein, starch and fatty acid composition (Pazdernik et al., Reference Pazdernik, Killam and Orf1997; Sato et al., Reference Sato1998; Velasco et al., Reference Velasco, Möllers and Becker1999). It has been shown to be fairly accurate in predicting seed viability (Olesen et al., Reference Olesen2011b; Olesen et al., Reference Olesen2015; Lee et al., Reference Lee2017; Shrestha et al., Reference Shrestha, Deleuran and Gislum2017). Few studies have tried to predict seed vigour using NIRS and these studies were limited in their scope, relying on a single seed lot that had been artificially aged to create vigour levels (Tigabu and Odén, Reference Tigabu and Odén2004; Qi et al., Reference Qi2011; Kandpal et al., Reference Kandpal2016). Therefore, the objective of the current study was to develop robust NIRS predictive models for seed germination and vigour using a large data set from 81 soybean seed lots that naturally varied in their seed quality.
Materials and methods
Seed samples
Eighty-one soybean (Glycine max, cv. ‘Essex’) seed samples were obtained from different lots produced at the University of Kentucky research farm over 8 years (2007 to 2014). The samples were stored in open plastic bags in a 10°C and 50% relative humidity room.
Standard germination
Standard germination percentages were determined according to ISTA rules (ISTA, 2018). Four replicates of 50 seeds were placed between two sheets of wetted germination paper (Stults Scientific, Mt Holly Springs, PA, USA) that were rolled and placed upright in a germination chamber. Germination was at 25°C in the dark and normal seedlings were counted after 8 days.
Accelerated ageing
Approximately 75 seeds were distributed in a single uniform layer on stainless-steel screens and placed in closed germination boxes (11 × 11 × 3.5 cm) containing 40 ml of deionized water below the screen. Seeds were placed in a water-jacketed accelerated ageing chamber and held at 41°C for 72 h. Following ageing, standard germination percentage was determined as previously described. Seed moisture content on a fresh weight basis was determined before and after accelerated ageing (AA) for 25 seeds placed in a forced-air oven at 103 ± 3°C for 48 h.
Electrolyte leakage
Fifty seeds were weighed and soaked in 75 ml of deionized water and maintained at 25°C for 24 h. After soaking, the electrical conductivity (EC) was measured with a conductivity meter and the results expressed as μS cm–1 g–1 (Colete et al., Reference Colete, Vieira and Dutra2004).
Seed lot classifications
Seed lots were placed into seed germination and vigour classification groups for model development. These classes were experimentally derived and are described in the Results section (Table 1). They included low and high germination categories as well as high, medium and low seed vigour categories. A portion of each subset class was used to develop NIRS prediction models, while a second subset was used to validate the models.
Table 1. Range of seed quality for 81 seed lots of soybean indicated by standard germination, accelerated ageing and electrolyte leakage

Instrumentation and spectral data collection and analysis
Spectral data were collected using a Perten DA7200 (Perten Instruments North America, Springfield, IL, USA) NIRS instrument designed for seed analysis for the entire 950–1650 nm NIR wavelength range at 5 nm intervals. Bulk soybean seed samples were placed in a 75 mm, white sample cup (supplied with the instrument) that holds approximately 34 g of soybean seeds and positioned in the sample presentation area for spectral data collection. Each spectrum that was saved corresponded to the average of three repack readings that provides a 95% probability for accuracy. Three spectra were obtained for each of the 81 soybean seed samples for a total of 243 spectral data.
The GRAMS/AI software (Thermo Fisher Scientific, Waltham, MA, USA) was used for model development using partial least squares (PLS) regression. For the germination study, the 243-spectral data were divided into calibration (n = 183) and validation (n = 60) samples using stratified random sampling. This involved selection of 60 validation samples from the entire sample set targeted at ensuring that there was a wide range for both low and high levels for each quality parameter.
For the standard germination percentage quantitative measurement model, the actual germination values obtained for each sample were assigned to the corresponding three spectral data for that specific sample. For the standard germination percentage qualitative discrimination model, a dummy numerical score was assigned for (a) low, <81% germination (score = 1) and (b) high, ≥81% germination (score = 2).
For soybean seed vigour, three analyses were done for the 44 high germination (≥94% germination) samples (132 spectral data): (a) quantitative, (b) 3-category qualitative and (c) 2-category qualitative. The quantitative model used the AA germination percentage values. The 3-category qualitative model assigned dummy numerical scores for: (a) low, <74% AA germination (score = 1), (b) medium, 74–89% AA germination (score = 2), and (c) high, ≥90% AA germination (score = 3) vigour levels described in the previous section. These value cut-offs for categories were based on the modified classification categories presented by Colete et al. (Reference Colete, Vieira and Dutra2004). For the 2-category qualitative model, the medium and high AA germination categories in the 3-category qualitative model were combined. Thus samples were assigned dummy numerical scores of (a) score = 1 for low, <74% AA germination and (b) score = 2 for combined medium and high, ≥74% AA germination.
The prediction models developed using the training data set for germination and vigour were used to predict the independent validation sample set using the PLS plus/IQ Predict Unknown Spectra application in GRAMS/AI software (Thermo Fisher Scientific).
Results and Discussion
Seed germination and vigour
Standard germination ranged from 0 to 100% (mean = 87.0; SD = 20.6) for the 81 seed lots evaluated in the study (Table 1). The largest number of seed lots fell within a germination range of 90–100%. Although standard germination percentages for this group of seed lots was skewed towards higher germination (>90%), vigour levels as indicated by AA tests showed a near-equal number of seed lots with medium to high vigour (40 seed lots with AA between 80 and 100%) and low vigour (41 seed lots with AA less than 74%). Vieira et al. (Reference Vieira2004) correlated EC values with field emergence and considered soybean seed lots with EC values less than 90 μS cm–1 g–1 to contain high vigour seeds and those greater than 100 μS cm–1 g–1 to be low vigour. Based on those EC values 36 seed lots in this study were high vigour, 23 intermediate and 22 low vigour (Table 1). In this study, there was not a strict one-to-one relationship for vigour determination based on AA and EC. This has been observed for other studies with soybeans (Vieira et al., Reference Vieira2001). This can be simply attributed to wider variability in EC values related to initial seed size and seed water content (Hampton et al., Reference Hampton, Johnstone and Eua-Umpon1992) or that seed vigour is a complex physiological process resulting from the combination of numerous factors related to seed production, handling and ageing (Rajjou et al., Reference Rajjou2012). Because different vigour tests can emphasize different aspects of seed vigour, it is often better to rank seed lots using multiple vigour tests, such as AA plus EC rather than relying solely on a single test (Geneve, Reference Geneve, McDonald and Kwong2005).
Based on the data in Table 1, seed lots were classified into different germination or vigour categories for NIR model development. Seed germination included a low (≤80%) and high (≥81%) germination group. Seed vigour categories included high, medium and low groups from a subset of seed lots with standard germination percentages ≥ 94%. Vigour levels were determined by ranking seed lots based on AA plus EC results. High vigour lots had AA ≥90% and EC between 74 and 88 μS cm–1 g–1; medium vigour lots had AA between 74 and 84% and EC between 75 and 95 μS cm–1 g–1; low vigour lots had AA between 20 and 62% and EC ≥95 μS cm–1 g–1.
NIR-based prediction of standard germination
Differences in spectral absorbance were observed for low and high germinating seed lots (Fig. 1). This was observed over the entire 950–1650 nm wavelength range with the more pronounced differences found beyond 1400 nm, indicating the potential to differentiate between seed lot categories using NIR spectroscopy. However, these spectral differences can only provide indications. Thus prediction models were developed and tested on independent sets of validation samples (Table 2).

Figure 1. Average absorbance spectra (log 1/reflectance) for samples differentiated into low and high germination.
Table 2. Distribution of soybean seed samples based on number of spectral data used as training and validation samples for prediction of germination and vigour

*There were three sample sets per category.
The PLS statistics for quantitative and qualitative models developed for predicting germination are summarized in Table 3. The potential for using NIR spectroscopy for quantitative measurement was relatively limited as shown by R 2 values, both for the training and validation data sets, ranging from 0.575 to 0.673 and 0.549 to 0.659, respectively.
Table 3. Statistical measures for prediction models developed for quantitative and qualitative determination of germination using training data set and the resulting classifications of validation samples

*SECV, standard error of cross-validation.
For the three prediction standard germination percentage qualitative discrimination models, the R 2 values were low (0.394–0.521), but for differentiation analysis such as the case in this study, the relevant measure is the ability to predict the correct classification (high or low), regardless of R 2 results. When the mid-predicted score of 1.5 was selected as the classification cut-off or threshold level, predictions were biased for correctly predicting high germination seed lots (97.4–100%) but were very low for low germination seed lots (28.6–47.6%). Shifting the classification threshold level to 1.7 allowed for better balance in correct classification of low and high germination seeds. The correct classification for low germination seeds improved from 81.0 to 85.7%, while the high germination soybean seeds went down to 82.1 from 89.7%. Comparison of results across the three prediction models, i.e. models developed using different sample sets, showed relatively good repeatability of results, which supports the prediction capability of NIRS for qualitative measurement of individual seed lot germinability.
NIRS studies related to germination capacity have focused on discriminating between viable (live seed) or non-viable (dead, abnormal or unfilled) seeds for various species (Lestander and Odén, Reference Lestander and Odén2002; Olesen, et al., Reference Olesen2015; Ambrose et al., Reference Ambrose2016) including soybean (Agelet et al., Reference Agelet2012). Athough most studies showed a positive relationship between NIR spectra and viability, for soybean they were unable to generate models that adequately predicted living seeds. Only a few studies have identified NIRS predictive models for seed lots with different levels of germination based on percentage (Tigabu and Odén, Reference Tigabu and Odén2004; Qi et al., Reference Qi2011). Interestingly, both studies used a single seed lot and attempted to generate multiple vigour levels by artificial AA. Rather than specifically developing seed lots varying in vigour (i.e. similar germination percentage with different vigour levels), these seed lots mainly showed changes in germination percentage. In a pine (Pinus patula) study, ageing produced seed lot fractions of 99 (non-aged), 75, 55 and 13% after ageing for 3, 7 and 9 days, respectively (Tigabu and Odén, Reference Tigabu and Odén2004). They discriminated non-aged from aged seeds (100% accuracy), and high capability for differentiating within aged samples (75–95% accuracy). In a soybean study, seeds were aged from 24 to 96 h to produce germination percentages that ranged from ~97% (non-aged) to 5% (Qi et al., Reference Qi2011). From these samples, they developed a qualitative model for predicting three levels of germination capacity in soybean. Therefore, to our knowledge, the current study is the first to provide an accurate NIRS-based model for discriminating high and low germinating seed lots on a commercial scale using over 80 seed lots that varied in germination potential without artificial ageing.
The PLS regression coefficients for the three germination prediction models (Fig. 2) indicated distinct absorption wavelength peaks corresponding to functional groups that contributed to the qualitative classification of low and high germination soybean seed lots. For example, the peaks at 1185 nm and at 1410 nm, which corresponds to O-H first overtone (Shenk et al., Reference Shenk, Workman, Westerhaus, Burns and Ciurczak2001), suggest differences in protein and oil, respectively. Tigabu and Odén (Reference Tigabu and Odén2004) also observed differences in the spectral range corresponding to protein as a major discriminating region used in their model for pine seed germination. Using Fourier transform NIRS, Lohumi et al. (Reference Lohumi2013) differentiated viable and non-viable watermelon seeds and attributed this to associated changes in seed membrane lipids and proteins that may be responsible for the germination ability. Other peak wavelengths that contributed to the ability to classify soybean germination in the current study included 1220 nm for cellulose and oil, 1480 nm for cellulose, and 1530 nm for cellulose and starch. The constituents were the same for the three prediction models (Fig. 2).
Figure 2. Regression coefficients for calibrations developed for qualitative measurement of germination at selected number of factors.
NIR-based prediction of seed vigour
Seed vigour is a more sensitive indicator of seed lot quality compared with standard germination, as it relates to field establishment (TeKrony and Egli, Reference TeKrony and Egli1977; Egli and TeKrony, Reference Egli and TeKrony1995). It is common for seed lots with the same standard germination to have different vigour levels resulting from variable seed production systems or storage conditions. Vigour is also commonly reduced in seed storage prior to any loss in standard germination (Delouche and Baskin, Reference Delouche and Baskin1973). Therefore, to genuinely identify the ability for NIRS to predict seed lot vigour without confounding the results with viability (germination %), NIRS-vigour models for this study were developed from a subset of 44 out of the original 81 seed lots that were high germinating (≥94%) and displayed a range of vigour levels based on AA values.
There were differences in spectral absorbance for the entire wavelength range for low, medium and high vigour soybean samples (Fig. 3). To develop a quantitative NIRS vigour model, AA percentages were used to represent the three vigour categories. There was a poor fit for quantitatively predicting vigour categories based on AA percentages (Table 4). The R 2 values for prediction models ranged between 0.28 and 0.44, and R 2 values for the corresponding validation set was similar. The actual versus predicted AA of the three vigour categories are shown in Fig. 4A–C for the three sets of samples. For all three sample sets, the predictions for the medium and high vigour seeds showed overlaps, but when high and medium vigour levels were pooled they were well segregated from the low vigour seeds.

Figure 3. Average absorbance spectra (log 1/reflectance) of high-germination soybean seeds differentiated into low, medium and high vigour (accelerated ageing).
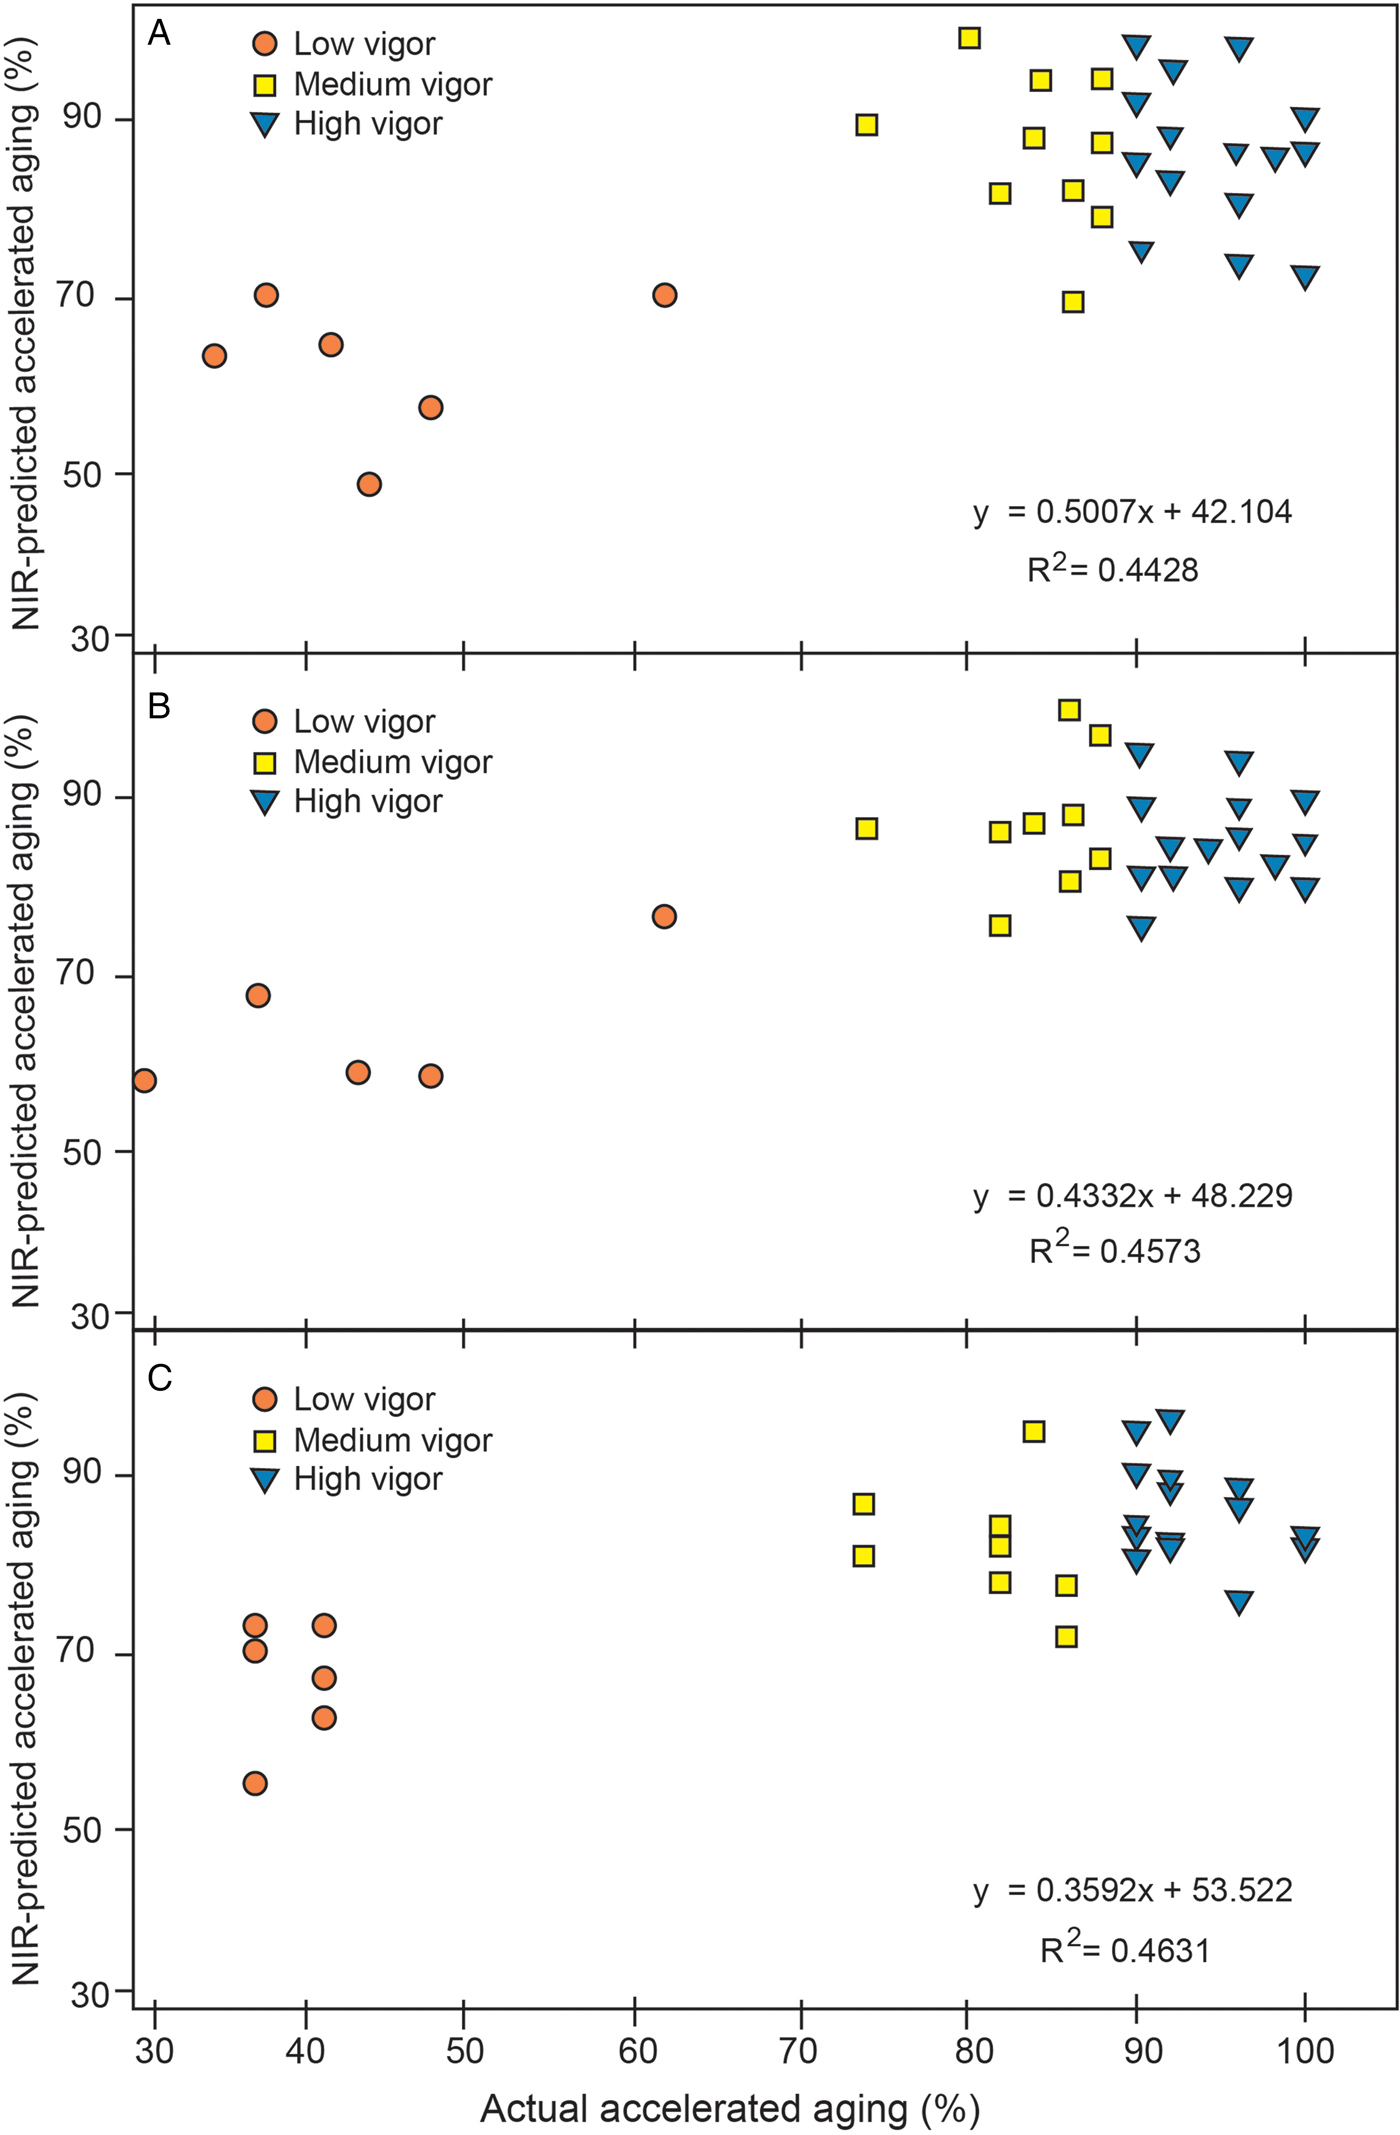
Figure 4. Actual versus NIR-predicted quantitative accelerated ageing values of validation samples for three sample sets: (A) sample set 1, (B) sample set 2, and (C) sample set 3.
Table 4. Statistical measures for prediction models developed for quantitative and qualitative determination of vigour (accelerated ageing) using training data set and the resulting classifications of validation samples

*SECV, standard error of cross-validation.
The qualitative prediction of vigour was evaluated using the 3-category and 2-category models. The 3-category model grouped samples into low, medium and high vigour and were assigned the score of ‘1’, ‘2’ and ‘3’, respectively. Discriminant analysis showed overall poor correct classifications (Table 4). This may partly be attributed to the small sample size, especially for the low vigour category, such that a single misclassified sample results in a 20% reduction in correct classification. The general trend was that misclassified low vigour seeds were classified as medium but not as high vigour; there was only one misclassified medium vigour sample for all three sample sets with misclassified samples being categorized as high vigour. The high vigour seeds were classified as medium or high vigour seeds but not as low vigour seeds.
Based on the high overlap in predicted category for medium and high vigour, these categories were combined into one category; the 2-category model had low vigour seeds given a score of ‘1’ while the combined medium and high vigour seeds were given a score of ‘2’. The percentage in correct classification was highly improved compared with the 3-category model with 80–100% correct classification of low vigour samples and 96.3–96.6% correct classification for combined medium and high vigour samples. From a practical standpoint, seed lots with 94% germination and medium to high vigour as described in this study would be commercially acceptable seed lots and the ability to predict low vigour seed lots from this pool of seed lots at greater than 80% accuracy using NIRS was a significant finding. To provide proof-of-concept that NIRS was a sensitive tool to predict vigour levels, the parameters used in this study to define vigour were very restrictive, using only seed lots with ≥94% standard germination. We would expect that increasing the sample size to include additional commercially acceptable germinating seed lots (i.e. 80–100%) might provide additional discrimination between high and medium vigour seeds.
The ability of NIRS to provide good qualitative discrimination between the two categories (low vigour versus medium + high vigour) was attributed mainly to distinct absorption peak wavelengths (Fig. 5). For example, the peak at ~1410 nm corresponds to OH first overtone and at ~1510 nm corresponds to the NH stretch first overtone (Shenk et al., Reference Shenk, Workman, Westerhaus, Burns and Ciurczak2001) indicating that differences in oil and protein constituents, respectively, contributed to the ability of NIRS to classify soybean seeds into two vigour categories. Other peak wavelengths were ~1195 nm for starch structure and ~1100 and 1185 nm for protein structure. Other constituents that were found to contribute to the ability to classify seeds were starch (~1060, 1200, 1350 nm), protein (1140, 1280 and 1350 nm), oil (1390 nm), and water (~ 1410 nm). The constituents were similar across the three prediction models.

Figure 5. Regression coefficients for calibrations developed for 2-category (low and high AA) qualitative measurement of soybean vigour at selected number of factors.
Conclusions
NIRS-based prediction models were developed for standard germination and vigour for soybean seed lots. In both cases, qualitative models provided better discrimination of high and low performing seed lots compared with quantitative models. These models were developed from a large sample of seed lots produced and stored under commercial conditions. Therefore, we feel that we have provided strong evidence that NIRS-based models can be used to characterize commercial seed lots for both germination capacity and seed vigour. The major advantage to including NIRS in seed testing is that it provides a non-destructive evaluation of seed lots with high-through put. The current study used bulk seed samples that were appropriate for seed lot evaluation, but NIRS can also be performed at the single-seed level (Armstrong et al., Reference Armstrong2011). This would provide a very useful tool for breeders interested in vigour genetics and to germplasm preservation programmes where high germination/vigour of individual seeds could be identified in ageing seed lots.
Acknowledgements
This is publication No. 17-11-117 of the Kentucky Agricultural Experiment Station and is published with the approval of the Director. Mention of company or trade names is for description only and does not imply endorsement by the USDA. The USDA is an equal opportunity provider and employer.
Financial support
This project was supported by the USDA National Institute of Food and Agriculture, hatch project numbers KY011042 and KY006062.
Conflicts of interest
None.


 Open access