


In the past 60 years, great emphasis has been placed on the deinstitutionalisation of the care of people with mental disorders in England with the intent to reduce stigma and improve the living conditions for those affected.Reference Thornicroft and Tansella1, Reference Thornicroft, Alem, Dos Santos, Barley, Drake and Gregorio2 Community mental health services have developed beyond recognition in the UK, including the establishment of crisis home treatment teams available 24 h a day and early intervention in psychosis teams as an alternative to hospital admission.3 More recently street triage teams have been introduced with mental health professionals working alongside police officers to provide a crisis response.Reference Dyer, Steer and Biddle4
The 1959 followed by the 1983 Mental Health Acts were part of the process of changing the delivery of psychiatric services increasing the focus on treatment as opposed to containment. In a further attempt to focus on community treatment, the 1983 Mental Health Act was amended in 1995 to introduce supervised discharge orders (SDOs) which provided supervised treatment in the community following a period of involuntary detention in hospital. These did not gain widespread use in clinical practice perhaps because of their impracticality in real-life clinical environments and excessive, complex paperwork.Reference Deahl and Turner5 In 2007, the 1983 Mental Health Act underwent major revisions, including the introduction of community treatment orders (CTOs, which replaced SDOs), and provide the power of recall to hospital.6 However, unlike SDOs, revocation of the CTO results in the patient being detained again under the original section. These have been used more widely than SDOs by clinicians, even with a lack of evidence regarding their effectiveness.Reference Burns, Rugkåsa, Molodynski, Dawson, Yeeles and Vazquez-Montes7
Despite the move to community care and a large reduction in National Health Service (NHS) mental illness and intellectual disability (also known as learning disability in UK health services) in-patient beds, the number of detentions under the Mental Health Act 1983 has continued to rise. These increased rates of detention have affected certain groups disproportionately, such as Black and minority ethnic groups,Reference Audini and Lelliott8 and in 2017 the UK government announced an independent review of the Mental Health Act for 2018.9 This review has recently published an interim report.10 In this paper we describe changes in detentions in hospital since the introduction of the 1983 Mental Health Act. There are four aims: (a) to quantify the increase in detentions between 1984 and 2016; (b) to compare changes between different parts of the Mental Health Act, namely Part II (civil) and Part III (forensic); (c) to explore differences within Part III sections comparing court orders with transfers from prison; and (d) to measure the proportion of detained patients who are being treated in private hospitals.
Method
The detentions data for all providers (NHS facilities and private hospitals) were collated from the publicly available annual publication ‘Inpatients Formally Detained in Hospital under the Mental Health Act 1983’, obtained via the National Archives11 and NHS Digital.12 Data regarding detentions on admission to hospital were available from 1984. Data regarding detentions subsequent to voluntary admission were available from 1988 for NHS hospitals, and from 2000 for private hospitals. Detention in hospital following section 4 or police holding powers (Section 136) data were available for the NHS from 1988, and from 2006 for private hospitals. The number of detained inpatients on the 31 March of each year was available from 1997.
Only detentions in hospital under longer-term sections (permitting detention for up to 28 days or longer) were included. All such detentions were included irrespective of how long the detention lasted. Short-term detentions lasting between a few hours and maximum of 3 days were not included, unless they resulted in a longer-term detention. Detentions were divided into two groups: Part II (civil) detentions from the community or hospitals; and Part III (forensic) detentions from courts or prisons. The Part II detentions were further divided into two groups: involuntary detention on admission; and subsequent detention of patients who were admitted on a voluntary basis. Involuntary detentions on admission included revocations of CTOs but not recalls. Section 136 was only included if it resulted in detention under Section 2 or 3.
Rates per 100 000 population were calculated using the total population in England and percentage changes calculated. The odds of being formally admitted to an NHS hospital compared with a private hospital were calculated for each year. This was done separately for Part II and Part III formal admissions. The odds ratios and 95% CI were calculated to investigate whether these odds changed during the study period. Ethical approval was not required for this analysis of routinely collected data.
Results
Changes in the rate of detentions
Using the data on involuntary admissions that are available from 1984, the rate of detention rose from 21.5 per 100 000 to 85.0 per 100 000 in 2015/16. This is nearly a fourfold increase (295%) over 32 years (Table 1). This rate increased on 25 out of the 32 years and the mean increase in rate was two additional detentions per 100 000 per year.
Table 1 Rates per 100 000 of detention under the Mental Health Act 1983 in England according to the year that data was available from
NHS, National Health Service.
a. Data on subsequent detentions in private hospitals were available from 2000/01.
The rate of subsequent detentions following voluntary admission increased from 17.5 in 1988 to 30.7 in 2015/6, a 75% increase. The overall rate of detention (involuntary admissions plus subsequent detentions) rose from 50.0 in 1988 to 115.7 in 2015/16, a more than twofold increase (131%) over 28 years. Figure 1 shows that the greatest rate of increase occurred in the 1980s and 1990s, with a further acceleration in rates from 2008.
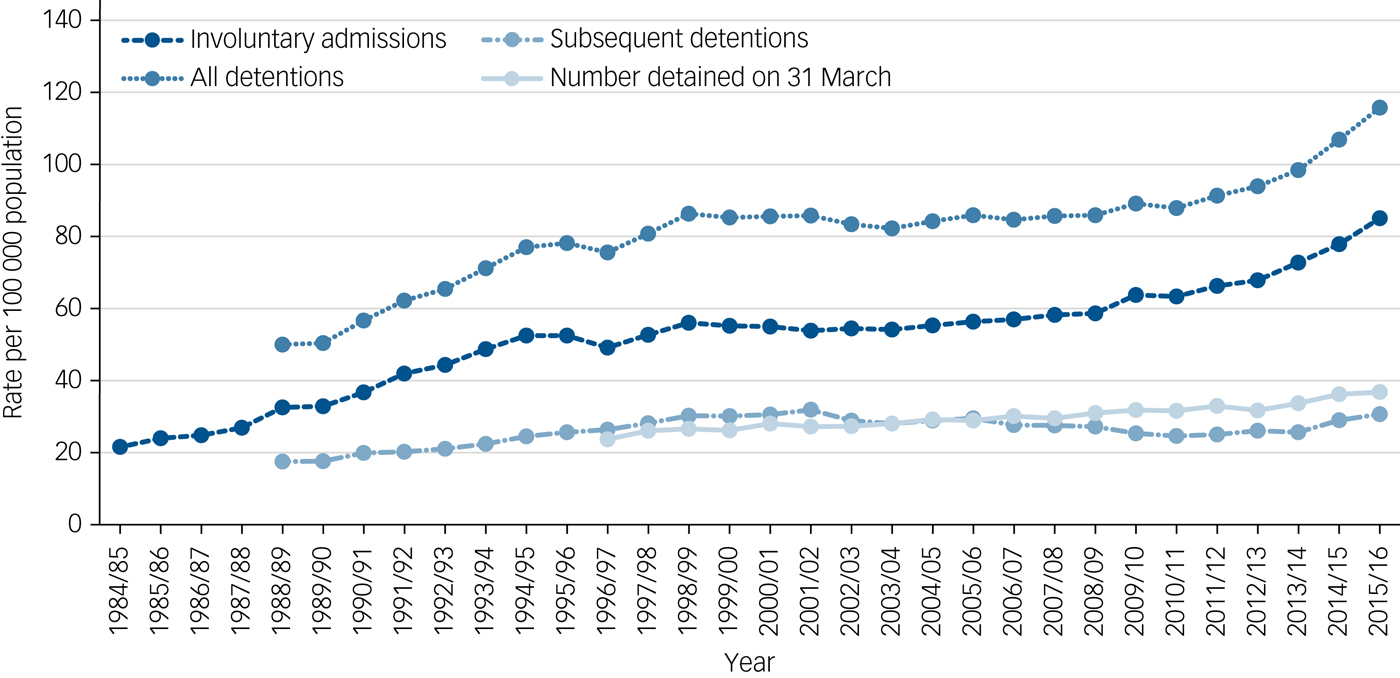
Fig. 1 Involuntary admissions, subsequent detentions and numbers detained on 31 March for National Health Service and private hospitals, per 100 000 population in England.
The number of individuals detained in either an NHS or private hospital on the 31 March of each year also increased from 11 500 (23.7 per 100 000) in 1997 to 20 151 (36.8 per 100 000) in 2016. This was an absolute increase of 75% and a 55% increase in the rate.
Changes in the rate of Part II (civil) and Part III (forensic) detentions
The rate of Part II (civil) involuntary admissions increased from 19.0 per 100 000 in 1984 to 81.9 per 100 000 in 2015/16. The rate of Part III (forensic) involuntary admissions was 2.5 in 1984, peaking at a rate of 4.7 in 1993/94. The rate then fluctuated with a slow overall decline to a rate of 3.1 per 100 000 in 2015/16. Therefore, the rate of Part II involuntary admissions increased by 331% whereas the rate of Part III (forensic) involuntary admissions increased overall by 21%.
Court orders and transfers from prison
Part III (forensic) detentions are broadly comprised of two distinct components: court orders and transfers from prison. The rate of court orders showed fluctuations but overall fell from 2.4 per 100 000 to 1.5 per 100 000, a 37% fall in the rate. In contrast, transfers from prison showed a 717% increase in rate from 1984/85 to 2015/16. The lowest figure was in 1985/86 (n = 84, rate = 0.2), and the highest was in 2014/15 (n = 932, rate = 1.7). In 1984, the rate of court orders was almost 12 times higher than the rate of transfer from prison. By 2015/16, they were nearly equal with a slightly higher rate of transfers from prison (Fig. 2).
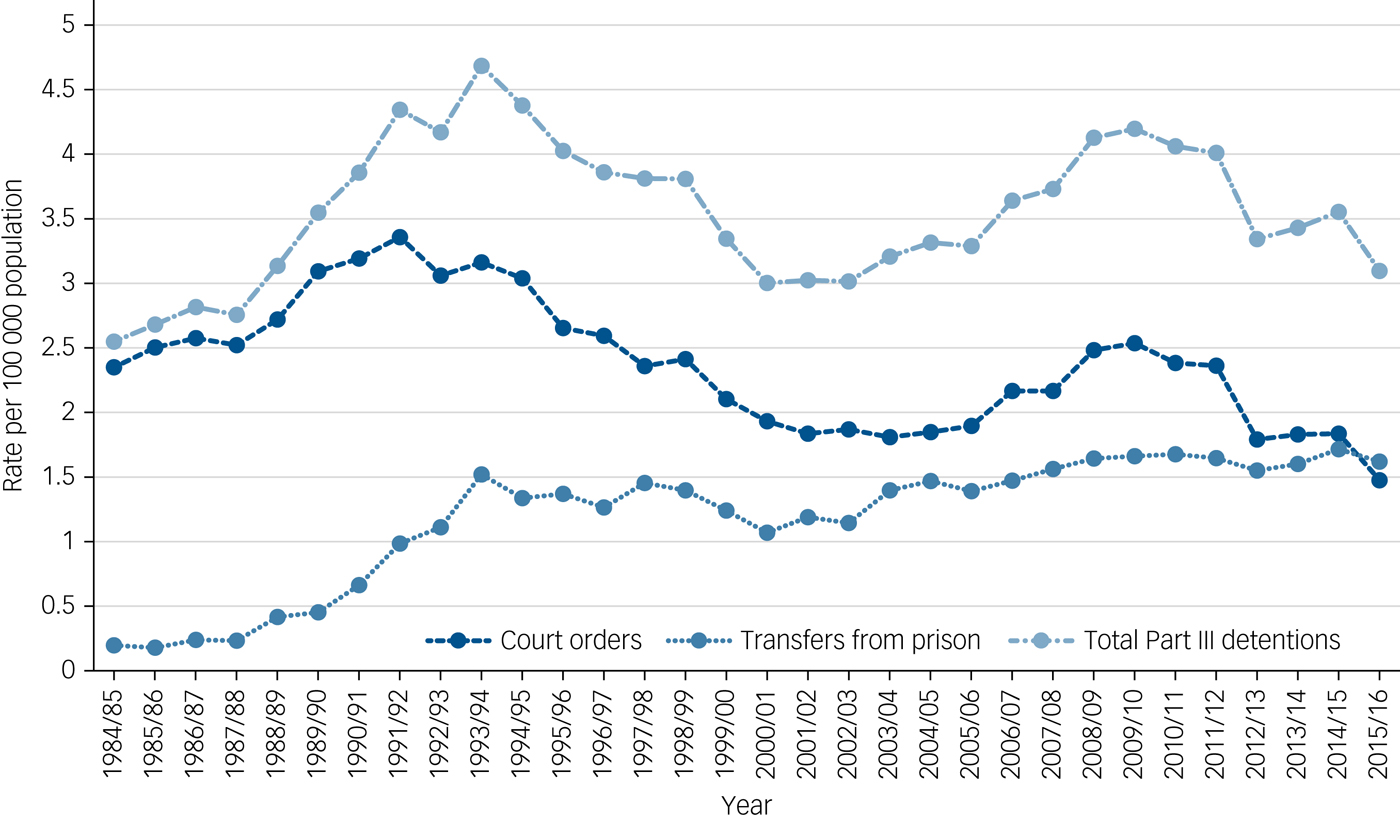
Fig. 2 Detentions under Part III (forensic) of the Mental Health Act 1983, divided into court orders and transfers from prison per 100 000 population from 1984/85 to 2015/16 in National Health Service and private facilities in England.
NHS versus private sector hospitals
In 1984, 3% of all involuntary admissions were to private hospitals with the remainder to NHS hospitals. By the end of the study period in 2015/16 this had risen to 15% involuntary admissions going to private hospitals (odds ratio (OR) = 5.20, 95% CI 5.18–5.22). Although the picture for Part II (civil) detentions also showed an increase (OR = 4.93, 95% CI 4.91–4.95), the shift to private hospitals was more pronounced for Part III (forensic) detentions: in 1984, 2% were to private hospital; in 2015/16 20% of detentions were to private hospitals; OR = 11.58, (95% CI = 11.48–11.72).
Discussion
Main findings
Following the introduction of the 1983 Mental Health Act, the rate of detention in England has tripled or quadrupled over the subsequent 30 years depending on the measure used. This increase started as soon as the 1983 Act was introduced and continued throughout the subsequent 30 years. There were two periods when the rate rose particularly quickly: an early phase in the 1980s and early 1990s; and a later phase from 2008. The increase in detentions was not solely because of the same number of individuals being detained more often within a year: rather our results demonstrate that the number of individuals detained in hospital on a specified date also increased.
Another important finding is that the increase in the rate of detention in England has been because of a dramatic increase in the use of Part II (civil) detentions. In contrast, Part III (forensic) detentions varied from year to year but did not show a sustained increase over the study period. The increase in civil detentions was particularly evident for involuntary admission from the community, and to a lesser extent subsequent detentions following voluntary admissions.
Although there was no sustained increase in Part III (forensic) detentions, there were important differences within these sections: court orders declined overall, whereas transfers from prison rose eightfold, with the majority of the increase taking place in the first 10 years of the 1983 Act. Further research is required to understand this pattern, for example by calculating rates of transfer from prison, while controlling for the size of the prison population which has grown substantially.
There has been a large shift toward privately provided care. It is worth noting that the vast majority of these involuntary detentions, both in the NHS and private hospitals, are paid for by the government and detained patients do not choose where they receive care. The increase in the rate of detention occurred at the same time as when NHS in-patient mental illness and intellectual disability services were drastically reduced. The same policy of NHS bed reductions has not applied to the private sector. Although the NHS continues to deliver the majority of this care, the chances of being detained (on admission) in a private hospital have increased fivefold since 1984. It has been speculated that the reliance on private hospitals may be the result of the reduction of some NHS inpatient facilities.Reference Keown, Mercer and Scott13
However, this cannot be the full explanation, as a number of the detentions are to private forensic/secure units, and there has been an increase in NHS forensic/secure beds over the past 30 years. The fact that forensic/secure beds have increased both in the NHS and private sectors, and at the same time forensic detentions have not shown a sustained increase, is worthy of further research. In contrast, the majority of non-secure mental illness and intellectual disability beds in the NHS have been closed, and a simultaneous increase in civil detentions has occurred.
Interpretation of our findings
It is surprising that rates of detentions have risen at the same time that the range and accessibility of services in the community have increased beyond recognition. However, this association with increasing rates of detentions has been noted before;Reference Keown, Weich, Bhui and Scott14 some have cautioned ‘one is not a substitute for the other’,Reference Deahl and Turner5 i.e. there is a clear requirement for in-patient treatment and this should not be lost in the drive to increase community treatment. It is likely that there is no singular explanation as to why rates of detention have increased. The closure of in-patient beds means more patients with enduring conditions are in the community and require readmission when they experience relapse, and this often necessitates detention at the point of readmission. This may account for the substantial increase in involuntary detentions between 1984 and 1994, which was a period of rapid bed closures. However, it is interesting to note that the inverse relationship between number of beds and rate of detention is not found within all European literature. Previous studies have found stability in compulsory detentions as a proportion of total admissions, despite dwindling bed numbers in GermanyReference Salize, Rössler and Becker15 and Italy,Reference de Girolamo, Bassi, Neri, Ruggeri, Santone and Picardi16 although in the latter example there was a wide geographical variation in bed availability.
We propose six additional explanations for the increase in rates of detention: increased case finding; more assertive follow-up; benefits of in-patient treatment; management of risk; legislative changes and the development of teams whose focus is assessment under the Mental Health Act. The association between the reduction in beds and the increase in detentions may work in both directions. The improvement in community services has resulted in more robust follow-up arrangements. Furthermore, accepting more referrals from primary care, thus increasing the accessibility of service, may have resulted in better case identification. Clinicians may be detaining patients in hospital under the Act to improve treatment outcomes, by initiating treatments that they cannot safely or effectively initiate in the community, particularly for individuals with limited social support. Clinicians may also be using the Mental Health Act to manage risks, particularly when community-based treatment is difficult to deliver safely. Indeed, fragmentation of services might lead to a lower tolerance of risk with less established therapeutic relationships making clinicians less able to encourage voluntary admissions.
Legislative changes, particularly the introduction of the Mental Capacity Act in 2005,17 and amendments to the Mental Health Act in 2007, have resulted in patients who are not objecting but who lack capacity being detained under the Mental Health Act, where previously they would have been treated in hospital on a voluntary basis in their best interests. These changes are likely to be part of the reason for the second rapid period of increased rates of detentions since 2008. Furthermore, teams have been developed by many Social Services departments, whose sole purpose is assessing, and if appropriate, detaining patients under the Mental Health Act. These are staffed by social workers, who previously would have had case-loads, and have engaged in preventative work in addition to their role in detaining patients. New guidance will be implemented soon on time limits for Mental Health Act assessments to be completed, and this will likely result in more of the limited resources being spent on Mental Health Act-related work.
Limitations
A limitation of this research is that the data used are routinely collected data. Some parts of the data-set were not reported from the introduction of the 1983 Act, and are only available for later years. This includes data on ‘subsequent detentions’ in NHS hospitals and private hospitals, making the overall detentions figures incomplete for some earlier years, therefore one should be cautious when interpreting these routinely collected data. There was a change to the reporting of data in 1996/7 and Fig. 1 shows that there was a slight dip in the numbers in this year, with the previous trend of increasing numbers of detentions resuming the following year.
We do not think that the results presented here are due to improved data collection during the study period. This is for two reasons. First, NHS organisations have a statutory requirement to collect and report these data, and are regularly subject to scrutiny in this area. Second, improved data collection and recording would not explain why civil detentions increased, whereas forensic detentions fluctuated but did not show a sustained increase. Despite the limitations, there remains an extensive collection of data across all years obtained for detentions on admission, so one can be reasonably confident the trends observed for this category in the use of the Mental Health Act reflect a real increase in detentions under the Mental Health Act in clinical practice.
Human rights considerations
The Mental Health Act has been criticised from a human rights perspective, considering that the Mental Health Act and Human Rights Act should in theory complement each other. One example is the detention of those diagnosed with an intellectual or developmental disability.18 However, excluding intellectual disability from the definition of mental disorder, as seen following the introduction of the Mental Health (Compulsory Assessment and Treatment) Act 1992 in New Zealand could have unintended consequences.Reference Soosay and Kydd19 Following this, vulnerable offenders with intellectual disability were being imprisoned as they could no longer be detained in hospital for treatment. This required new primary legislation (the Intellectual Disability (Rehabilitation and Compulsory Care) Act 2003)20 but it was a decade until this was eventually introduced.Reference Smith21
Comparison with findings from other countries
The proportions of involuntary detentions (of all admissions) in several countries have increased including France (from 1992 to 1998) and Austria (1992 to 1999).Reference Salize, Dressing and Peitz22 Similarly, the number of involuntary detentions in the Netherlands has almost doubled between 1979 and 2004.Reference de Stefano and Ducci23 Also, the rates in Scotland (2007–2016),24 and especially in England have increased – as demonstrated in this study. However, the reporting of data from these different countries varies so caution must be exercised when making international comparisons. It is hoped that the current study will aid future international comparisons of detention rates, by highlighting the interesting patterns that are currently occurring in England. Certainly, there have been difficulties experienced in making these international comparisons, because of varying legislative frameworks for the treatment of mental health between different countries. It is therefore difficult to establish whether the overrepresentation of certain groups is a consistent theme across different countries.
Implications
Indeed, with the current review of the Mental Health Act, our results raise some important questions. Why were there such marked differences in the change in rates between civil and forensic detentions? Do rates of civil detentions have an impact on forensic detentions? If there is no relationship between the two, this would support the idea that forensic services are quite different from other mental health services, and may be aligned more closely with the criminal justice system, and in providing services for people with mental disorders convicted of an offence. An alternative hypothesis is that there may be a link between the increase in Part II (civil) sections and the fall in Part III court orders, suggesting more frequent and perhaps earlier detention under a civil section may prevent court orders at a later date. Further research is required to investigate the relationship between the two. It is also worth noting that since 2008, there has been a sustained fall in court orders.
The results of this paper suggest that further legislative reform is as likely to lead to more detentions as it is to lead to fewer. The experience since 2008 in England is that any legislation that is driven by capacity possesses the risk of increasing rates of detention, particularly among those with dementia. This has consequences for those individuals and families, and is also likely to put further financial strains on local authorities and health economies if the current arrangements for Section 117 aftercare are retained. This needs urgent review, particularly in light of the ongoing austerity within services.
The government is reviewing the 1983 Mental Health Act, and this is partly because of concerns regarding the overrepresentation of certain groups, particularly young men from Black, Asian and minority ethnic groups, among those detained. We would sound two notes of caution regarding this. The first is that the overrepresentation of young men from these ethnic groups is most marked in Part III (forensic) sections and these are now falling. Second, there is evidence from clinical services that the more recent increase in detentions has applied to a different clinical group, particularly those with dementia who are more likely to be older, women and less likely to be from Black, Asian and minority ethnic groups. This suggests that the demographic characteristics of those detained are often determined by the epidemiology of the mental disorders, rather than the legislation itself.
A new Mental Health Act that focuses on facilitating the delivery of treatment and recovery and minimises bureaucracy will be a positive outcome. A review that focuses on the legal framework alone, without reference to the issue of reductions in the budgets for mental health services, and adds to the bureaucratic burden, is likely to further stigmatise mental health services and runs the risk of further distancing psychiatry from other fields of medicine.


eLetters
No eLetters have been published for this article.