


As recognised in DSM-5, negative symptoms are one of the core symptoms of schizophrenia.Reference Bleuler1,Reference Malaspina, Walsh-Messinger, Gaebel, Smith, Gorun and Prudent2 Despite the clinical relevance of these symptoms, their psychopathological dimensions in people with first-episode psychosis (FEP) have not been adequately identified.Reference Carpenter3 This is important, because negative symptoms have been shown to better predict psychosocial functioning.Reference Rekhi, Ang, Chan, Fernandez-Egea, Kirkpatrick and Lee4
A few studies have explored potential trajectories of negative symptoms in people with FEP by combining data covering extensive follow-up periods with statistical approaches capable of coping with unobserved trajectories, such as the latent growth mixture modelling (LGMM). LGMM has been a progress in trajectory analysis since this approach allows identification of classes of individuals characterised by different multivariate normal distribution. Moreover, LGMM uses robust maximum likelihood estimation, which can accommodate missing data.Reference Jung and Wickrama5 The identification of these trajectories as well as the development of potential predictors of poor prognosis could contribute to the implementation of therapeutic policies for reducing the burden of psychosis on quality of life.Reference Chang, Ho, Tang, Wong, Hui and Chan6
The identification of potential structural brain abnormalities associated with different trajectories of negative symptoms could complementarily contribute to the discovery of predisposing factors, which may improve prediction accuracy. An extensive literature has described a relationship between negative symptoms and decreased grey matter in people at clinical high risk for psychosis.Reference Metzak, Devoe, Iwaschuk, Braun and Addington7 Small sample sizes and, more importantly, the lack of long-term follow-up of clinical assessments and neuroimaging data have limited the potential of neuroimaging biomarkers in supporting therapeutic interventions that can minimise the side-effects of negative symptoms.
The molecular mechanisms driving cortical abnormalities in psychiatric conditions are still poorly understood. In this line, recent studies reveal that micro-architectural markers related to metabolism, cellular components and neurotransmitter receptors/transporters are associated with abnormalities in brain structure across disorders,Reference Hansen, Shafiei, Vogel, Smart, Bearden and Hoogman8 suggesting that molecular vulnerability drives cortical disorder profiles.Reference Romero-Garcia, Warrier, Bullmore, Baron-Cohen and Bethlehem9–Reference Romero-Garcia, Mandal, Bethlehem, Crespo-Facorro, Hart and Suckling11 Nevertheless, the associations of these markers with long-term/longitudinal brain changes in psychosis remains unexplored.
The main aim of the present study was to explore potential brain abnormalities related to different trajectories of negative symptom evolution in FEP over a 10-year follow-up period. Secondarily, we aimed to analyse potential associations between resulting cortical thickness profiles and the spatial map of six molecular predictors (gene expression gradient, receptor density, excitatory/inhibitory ratio, glycolytic index, glucose metabolism, synapse density).
Method
Participants
Data for the current study were obtained from a large cohort of patients representative of the general population of individuals experiencing an FEP in the epidemiological catchment area comprising the autonomous community of Cantabria, located on the northern coast of Spain.Reference Pelayo-Terán, Pérez-Iglesias, Ramírez-Bonilla, González-Blanch, Martínez-García and Pardo-García12 The patients were being treated in a longitudinal intervention programme (Programa de Atención a Fases Iniciales de Psicosis [Early Intervention Programme for First Episode Psychosis] (PAFIP)) conducted at the University Hospital Marqués de Valdecilla, Santander, Spain.Reference Pelayo-Terán, Pérez-Iglesias, Ramírez-Bonilla, González-Blanch, Martínez-García and Pardo-García12–Reference Crespo-Facorro, Pérez-Iglesias, Ramirez-Bonilla, Martínez-García, Llorca and Vázquez-Barquero14 A total of 357 individuals with FEP were recruited for this study (see Supplementary Material, available at https://dx.doi.org/10.1192/bjp.2022.192).
Ethics
The authors assert that all procedures contributing to this work comply with the ethical standards of the relevant national and institutional committees on human experimentation and with the Helsinki Declaration of 1975, as revised in 2008. The study was approved by the ethics committee for clinical research, CEIC Cantabria, in accordance with international standards for research ethics (clinical trial numbers NCT0235832 and NCT02534363). Patients who met the criteria and provided written informed consent, along with their families, were entered into PAFIP and PAFIP-10 for reassessment. This study followed the Strengthening the Reporting of Observational Studies in Epidemiology (STROBE) reporting guideline for cohort studies.Reference von Elm, Altman, Egger, Pocock, Gøtzsche and Vandenbroucke15
Demographic and clinical assessments
Sociodemographic information was recorded from interviews with patients, their relatives and from medical records on admission. This included information regarding years of education, socioeconomic status derived from the parents’ occupation (‘low qualification worker’ versus ‘other’), relationship status (‘married/cohabiting’ versus ‘single/divorced/separate or widowed’), employment status (‘employed’ versus ‘unemployed’) and first-degree family history of psychosis, which was based on participant and family reports (‘yes’ versus ‘no’).
Age at psychosis onset, duration of untreated illness (DUI) and duration of untreated psychosis (DUP) were obtained. Social functioning was assessed at baseline using the Disability Assessment Schedule Spanish version.Reference Mañá, Ivorra and Girón16 Depression was assessed by the Calgary Depression Scale for Schizophrenia (the higher the score, the more depressive symptoms).Reference Addington, Addington and Maticka-Tyndale17 The Simpson–Angus Scale was used to assess Parkinsonian movement disorder.Reference Simpson, B, B, Angus, P and M18 Mean antipsychotic doses, expressed as chlorpromazine equivalents (CPZeq),Reference Woods19 were as follows: olanzapine 5–20 mg/day (100–400 CPZeq), risperidone 3–6 mg/day (150–300 CPZeq), haloperidol 3–9 mg/day (150–450 CPZeq), quetiapine 100–600 mg/day (133.33–800 CPZeq), ziprasidone 40–160 mg/day (66.67–266.67 CPZeq) and aripiprazole 5–30 mg/day (66.67–400 CPZeq).
The neuropsychological battery was administered by trained neuropsychologists. A subset of measures was selected to assess eight cognitive areas. In addition, a composite metric known as global cognitive functioning (GCF) was obtained using seven cognitive domains evaluated (verbal memory, visual memory, executive functioning, working memory, processing speed, motor dexterity and attention). Further details are given in the Supplementary Material.
Clinical negative symptoms of psychosis were assessed using the Scale for the Assessment of Negative Symptoms (SANS).Reference Andreasen20 An experienced psychiatrist (B.C.-F.) carried out all negative symptom assessments using the SANS throughout the follow-up period.
Clinical follow-up assessments were obtained at six different time points: baseline, understood as the point at which participants were included in the PAFIP programme, and at 6 weeks, 3 months, 1 year, 3 years and 10 year after programme entry. Change scores for negative symptoms, depressive symptoms, Simpson–Angus Scale, GCF and chlorpromazine equivalent doses, as well as changes in the dimensions obtained in the factor analyses of SANS, were calculated. Change scores were calculated as the score at baseline minus the score at 10-year follow-up (Table 1).
Table 1 Sociodemographic and clinical characteristics

DUI, duration of untreated illness; DUP, duration of untreated psychosis; SANS, Scale for the Assessment of Negative Symptoms; DAS, Disability Assessment Schedule; CDS, Calgary Depression Scale for Schizophrenia; CPZeq, chlorpromazine equivalents; GCF, global cognitive functioning.
Statistical factor analyses
Statistical analyses were conducted using the Statistical Package for the Social Sciences (SPSS), version 25 for Windows.21 RStudio version 1.4.110622 for Windows was also used for structural equation modelling analyses using the lavaan packageReference Rosseel23 and growth mixture modelling using the Latent Class Mixed Models package.Reference Proust-Lima, Philipps and Liquet24 Exploratory and confirmatory factor analyses are detailed in the Supplementary Material.
Latent growth mixture modelling analyses
LGMM was used to determine the number of latent classes in each of the SANS dimensions identified by factor analyses. GMM is a classification technique in which each participant is included in only one class (latent class), and each class is characterised by a specific trajectory over time. Membership of a participant was determined by calculating the posterior probability of belonging to one class and assigning the patient to the class with the highest probability. Latent classes were formed based on scores on each of the SANS dimensions evaluated at the six time points over the 10-year follow-up period (baseline, 6 weeks, 3 months, 1 year, 3 years and 10 years). Missing data were omitted by default. The best-fitting model according to the goodness-of-fit indices of Akaike's information criterion (AIC), Bayesian information criterion (BIC), sample-size-adjusted BIC (aBIC) and entropy was used to determine the optimal number of trajectory classes, from a total of 4 possible trajectories. Lower AIC, BIC and aBIC values suggest a more parsimonious model, and higher entropy indicates a better model fit. Entropy ranges from 0 to 1; values approaching 1 indicate a clear delineation of classes. Aside from fit statistics, interpretability and parsimony of the model were also taken into consideration in model selection.
Neuroimaging acquisition and pre-processing
Participants underwent magnetic resonance imaging (MRI) of the brain at baseline and at the 2-year, 3-year, 5-year and 10-year follow-up periods. All images were acquired using the same 3 T Philips Medical Systems MRI scanner (Achieva, Best, The Netherlands) using an 8-channel head coil at the Hospital Marques of Valdecilla. A 3D T 1-weighted sequence was acquired with the following parameters: repetition time TR = 8.2 ms, echo time TE = 3.7 ms, flip angle 8°, acquisition matrix 256 × 256, voxel size 0.94 × 0.94 × 1 mm and 160 contiguous slices. Images were first visually inspected for artefacts and gross anatomical abnormalities. Pre-processing of MRI data was undertaken using Freesurfer pipelines, version 6.0. In brief, each image was subjected to skull stripping, segmentation and surface reconstruction.Reference Desikan, Ségonne, Fischl, Quinn, Dickerson and Blacker25,Reference Dale, Fischl and Sereno26 Cortical thickness measurements were estimated by reconstructing the pial surface and the boundary between grey matter and white matter and measuring the distance between these surfaces. Cortical thickness values were averaged across all vertices included in each of the 68 cortical parcels defined in the Desikan–Killiany atlas.Reference Desikan, Ségonne, Fischl, Quinn, Dickerson and Blacker25 Regional cortical thickness values were collapsed across hemispheres by computing the mean cortical thickness for left and right regional values, resulting in 34 cortical regions. Hemispheric-averaged regional values were (arbitrarily) plotted over the representation of the left hemisphere. The Euler index was computed for each individual as a proxy of image quality, which has shown a similar degree of accuracy to that of human raters.Reference Rosen, Roalf, Ruparel, Blake, Seelaus and Villa27
Molecular cortical maps
Similarly to the methodology proposed by Hansen et al,Reference Hansen, Shafiei, Vogel, Smart, Bearden and Hoogman28 we tested potential associations between resulting cortical thickness cortical profiles and the spatial map of the following six biological predictors derived elsewhere.
Gene expression gradient
The first principal component of gene expression data from the whole genome was used to represent the variation in expression levels across the left cortex. Data were collected by the Allen Human Brain Atlas.Reference Hawrylycz, Lein, Guillozet-Bongaarts, Shen, Ng and Miller29 A detailed account of the specific processing choices made can be found in Hansen et al.Reference Hansen, Markello, Vogel, Seidlitz, Bzdok and Misic30
Receptor density
The first principal component of receptor density was used to represent the variation in receptor densities across the cortex. The marker included positron emission tomography (PET) tracer studies for a total of 18 receptors and transporters, across 9 neurotransmitter systems (dopamine, noradrenaline, serotonin, acetylcholine, glutamate, gamma-aminobutyric acid (GABA), histamine, cannabinoid and opioid). Parcellated PET maps were then z-scored before compiling all receptors/transporters into a region × receptor matrix of relative densities. The data were originally presented as an atlas in Hansen et al.Reference Hansen, Shafiei, Markello, Smart, Cox and Nørgaard31
Excitatory/inhibitory ratio
The excitatory/inhibitory ratio was computed as the ratio of z-scored PET-derived excitatory (5-HT2A, 5-HT4, 5-HT6, D1, mGluR5, α4β2 and M1) to inhibitory (5-HT1A, 5-HT1B, CB1, D2, GABAA, H3 and μ-opioid) neurotransmitter receptor densities in the cortex, using the same data-set that was used to compute the receptor density.Reference Hansen, Shafiei, Vogel, Smart, Bearden and Hoogman28
Glycolytic index
This index was calculated as the residual after linearly fitting glucose metabolism to oxygen metabolism, as described by Vaishnavi et al.Reference Vaishnavi, Vlassenko, Rundle, Snyder, Mintun and Raichle32 Larger values indicate more aerobic glycolysis.
Glucose metabolism
Glucose metabolism in the cortex was measured in 33 healthy adults by administering 18F-labelled fluorodeoxyglucose (FDG) for a PET scan.Reference Vaishnavi, Vlassenko, Rundle, Snyder, Mintun and Raichle32
Synapse density
Synapse density in the cortex was measured in 76 healthy adults by administering 11C-UCB-J, a PET tracer that binds to the synaptic vesicle glycoprotein 2A (SV2A).Reference Bini, Holden, Fontaine, Mulnix, Lu and Matuskey33
Statistical analyses of imaging data
Prior to statistical assessment, we removed 19 participants with all their regions identified as outliers (defined as cortical thickness exceeding five standard deviations from the mean) and 13 regional outliers from 13 different individuals. Age, gender and total intracranial volume were regressed out from cortical thickness estimates using multiple regression and the residuals were added to the group mean to allow for easier interpretation. Traditional analysis of covariance (ANCOVA) using cortical thickness as the dependent variable and time (and SANS dimensions) as independent variables could not be conducted because the data violate the assumption of homoscedasticity (i.e. cortical thickness variance increases across follow-up time, Levene's test, P = 0.001). For this reason, longitudinal changes in cortical thickness were evaluated by subtracting long-term (at 10 years) from short-term (at 1, 2 and 3 years) cortical thickness.
Analysis of variance (ANOVA) implemented in MATLAB 2022a (MathWorks) was used to test for group effects (stable, decreasing and increasing) on cortical thickness changes for each of the SANS factors. The resulting F-statistic maps were associated with each of the seven molecular maps described above. The false discovery rate (FDR) was used to correct P-values (P FDR) for regional-based analyses and factors (i.e. 34 regions × 2 factors gives 64 statistical tests when testing across regions and 6 statistical tests when testing across molecular profiles).
Results
Sample characteristics
We included 357 participants with FEP in this study. Different manifestations of negative symptoms were evaluated at six different times over a 10-year follow-up period. Information about sociodemographic, clinical and neuropsychological characteristics of the sample is shown in Table 1. Exploratory and confirmatory factor results are detailed in Supplementary Figs 1 and 2.
A total of 260 (72.8%) and 119 participants (33.3%) completed a negative symptoms evaluation using the SANS at 3-year and 10-year follow-up respectively. A more parsimonious analysis including the six follow-up periods revealed that 11 participants (3.1%) were not evaluated at any of the follow-up periods included in the study and 249 (69.7%) were tested at at least one of the follow-ups. T-test analysis showed no significant differences in cortical thickness at baseline between those who completed the evaluation at 10-year follow-up and those who did not (P = 0.78).
Evolution of SANS dimensions
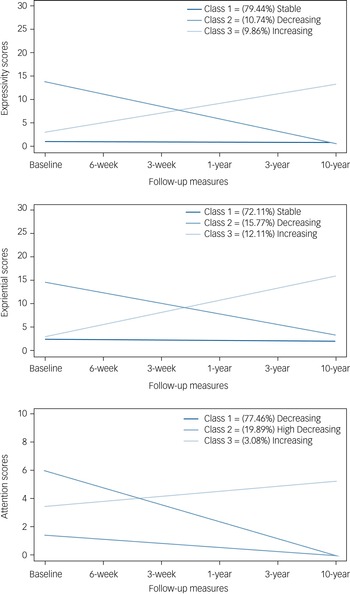
The three-class GMM model was selected for each of the SANS dimensions identified after examining fit indices, entropy and parsimony (Table 2). The three mean trajectories estimated by the three-class model for each of the SANS dimensions (expressivity, experiential and attention) are depicted in Fig. 1.

Fig. 1 Trajectories (stable, decreasing and increasing) of the three negative symptom dimensions as grouped by the latent class mixed model.
Table 2 Latent class mixed model fit of the three SANS dimension trajectories

SANS, Scale for the Assessment of Negative Symptoms; AIC, Akaike information criterion; BIC, Bayesian information criterion; aBIC, sample size-adjusted Bayesian information criterion.
a.The preferred model.
Most of the sample was included in a trajectory characterised by the presence of stable pattern during the follow-up period. The number of participants belonging to each trajectory identified for the expressivity factor were: 282 (79.44%) participants belonging to class 1 (‘stable’), 38 (10.74%) to class 2 (‘decreasing’) and 35 (9.86%) to class 3 (‘increasing’). For the second SANS dimension (experiential), 256 (72.11%) belonged to the ‘stable’ trajectory, 56 (15.77%) were included in the second class (‘decreasing’) and 43 (12.11%) in the third class (‘increasing’). Finally, the attention dimension was also formed of three trajectories, whose distribution was as follows: 275 (77.46%) in class 1 (‘decreasing’), 71 (19.89%) in class 2 (‘high decreasing’) and 11 (3.08%) in class 3 (‘increasing’).
SANS factor associations with whole-brain cortical thickness
The attention factor was excluded from the neuroimaging analyses since the National Institute of Mental Health (NIMH) Measurement and Treatment Research to Improve Cognition in Schizophrenia (MATRICS) initiative has recently recommended that attention should not be included as negative symptom. On the other hand, the attention dimension was formed from the items that evaluate inattention in the original scale, and we agree with NIMH MATRICS that this dimension corresponds more to cognitive function than to negative symptoms.
The average Euler index of our cohort, a proxy of MRI quality, was −99.4 (s.d. = 89), similar to what has been reported in other cohorts.Reference Morgan, Seidlitz, Whitaker, Romero-Garcia, Clifton and Scarpazza34 Age-, gender- and intracranial volume-corrected cortical thickness was longitudinally assessed at whole-brain level across SANS factors. Cortical thickness was similar across trajectories (stable, decreasing, increasing) during the first 3 years after FEP symptoms manifested (Fig. 2). However, the ANOVA analysis revealed a significant group effect when comparing long-term cortical thickness changes (calculated as long-term cortical thickness (at 10 years) minus short-term cortical thickness (at 1, 2 and 3 years)) for expressivity (P = 0.005) but not experiential (P = 0.13) factors. Post hoc analyses revealed a significant difference between the stable and increasing groups (P = 0.0018) but not between the stable and decreasing (P = 0.25) or decreasing and increasing (P = 0.20) groups. The impact of clinical covariates on longitudinal changes in cortical thickness was also tested. We found no significant association between cortical thickness changes and global cognitive functioning, positive symptoms, disorganised symptoms or attrition (Supplementary Fig. 3). However, chlorpromazine-equivalent doses were significantly associated with cortical thickness changes (P < 10−4). Consequently, the main analyses were repeated after correcting for medication (Supplementary Fig. 4).
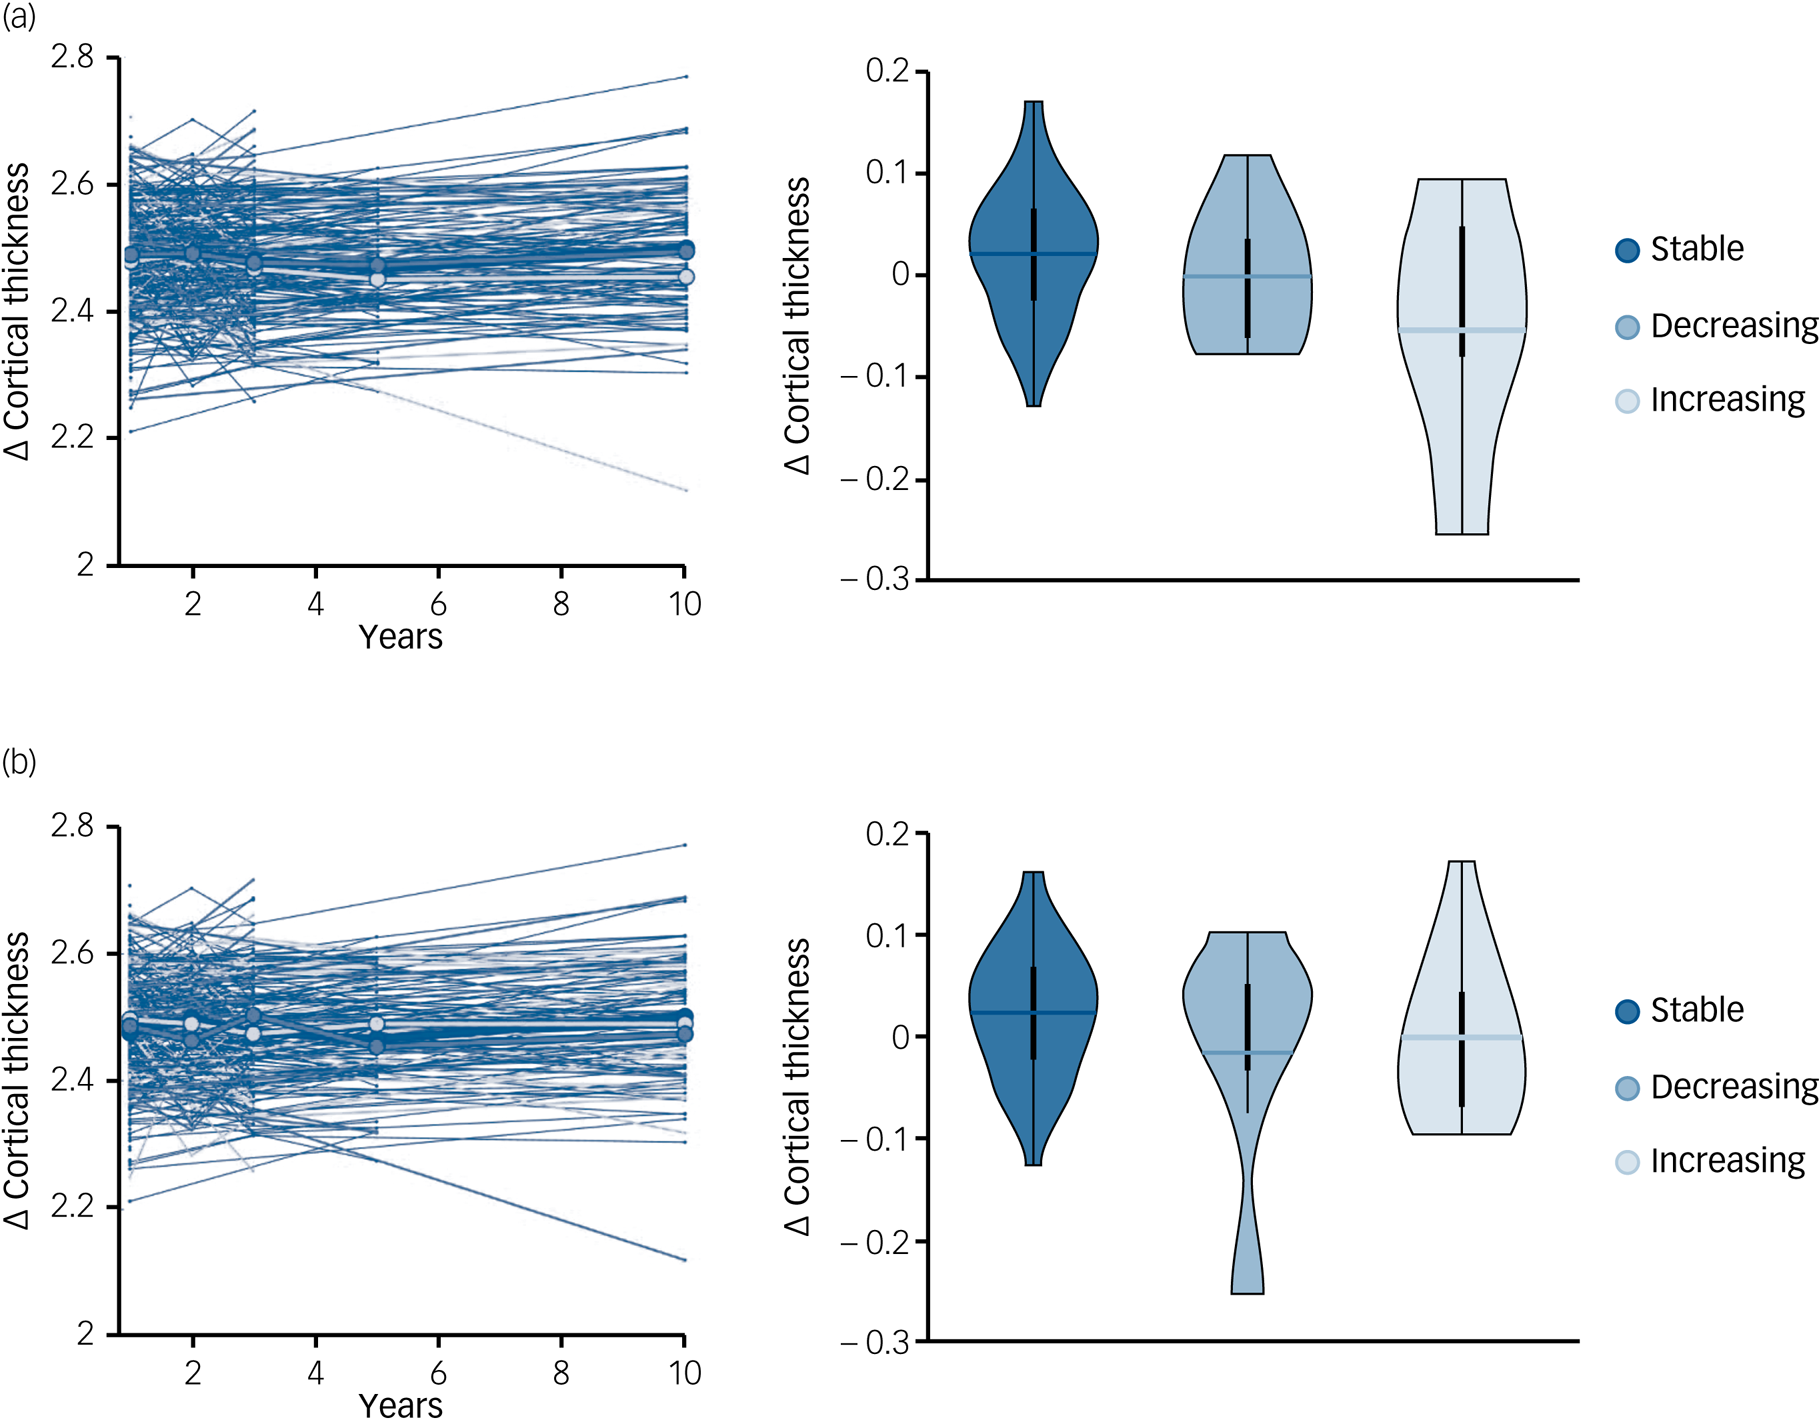
Fig. 2 Whole-brain cortical thickness changes for experiential and expressivity factors on the Scale for the Assessment of Negative Symptoms (SANS). Longitudinal cortical thickness changes across time for expressivity (a) and experiential (b) factors, with box plots showing the long-term cortical thickness changes across factors.
Regional cortical thickness associations with SANS factors
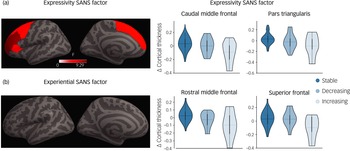
Long-term changes in cortical thickness were assessed across dimensions at regional level. Four regions (caudal middle frontal, pars triangularis, rostral middle frontal and superior frontal) showed a significant group effect in cortical thickness across the stable, decreasing and increasing trajectories for the expressivity factors (P FDR < 0.05; Fig. 3(a)). These four regions showed similar short-term cortical thickness values, but they diverge at 10 years after FEP diagnosis (Fig. 3(b)). These results were replicated after correcting for medication (Supplementary Fig. 5). On the contrary, experiential dimensions did not show significant differences on cortical thickness that survived FDR correction (Fig. 3(a)).

Fig. 3 Regional long-term cortical thickness changes for expressivity and experiential factors on the Scale for the Assessment of Negative Symptoms (SANS). Regions showing significant group effects (stable, decreasing, increasing trajectories) in long-term cortical thickness changes for expressivity (a) and experiential (b) factors. The scatter plots of longitudinal cortical thickness changes by region show a significant group effect for expressivity.
Expressivity group-effect on cortical thickness is associated with receptors density
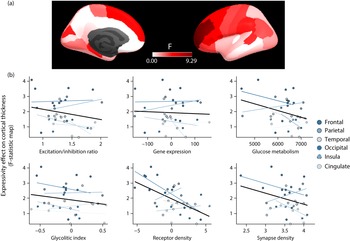
We tested whether the (unthresholded) F-statistic map of differential cortical thickness trajectories across the three expressivity trajectories described above was associated with a wide set of molecular cortical profiles (Fig. 4). None of the six maps considered showed a significant association except for the receptor density (P FDR = 0.03). Thus, regions showing stronger group effect of expressivity on cortical thickness (i.e. higher F-values) had lower receptor density scores on the cortical map constructed by performing a principal component analysis of PET-derived maps for dopamine, noradrenaline, serotonin, acetylcholine, glutamate, GABA, histamine, cannabinoid and opioid receptors.

Fig. 4 Association between differential cortical thickness trajectories across expressivity dimensions and molecular cortical profiles. (a) Cortical map showing the statistic (F-value) associated with the differential cortical thickness trajectories across the three expressivity dimensions. (b) Associations between differential cortical thickness trajectories across expressivity and each of the six molecular cortical maps considered here.
Discussion
Here we present the first study using mixed model regression analysis to investigate 10 years of developmental trajectories of cortical thickness in relation to SANS dimensions in people with FEP. The main findings derived from our work were: (a) trajectory analyses displayed three different patterns in the psychopathological SANS dimensions differentiated by factor analyses, (b) participants who were characterised by an increasing trajectory in the expressivity dimension showed cortical thinning in caudal middle frontal, pars triangularis, rostral middle frontal and superior frontal regions from the third year to the tenth year after FEP onset and (c) the areas with less density of receptors (dopamine, noradrenaline, serotonin, acetylcholine, glutamate, GABA, histamine, cannabinoid and opioid) spatially overlap brain areas that discriminate the trajectories of the expressivity dimension.
Our results reflected three different dimensions on the SANS (i.e. expressivity, experiential and attention). Previous factor analyses of negative symptoms in people with FEP have not included attentional items, which would explain the absence of the attentional dimension in these studies.Reference Galderisi, Mucci, Dollfus, Nordentoft, Falkai and Kaiser35 The attentional dimension reported in our study reflects the inclusion of those items contained in the original version of the scale. Our results highlight that the dimension of inattention is independent of the expressivity and experiential dimensions and is formed from the items originally designed to assess inattention in the original SANS. Excluding attention, our data align with those of Kirkpatrick et al, who suggested that negative symptoms can be grouped into two domains: avolition/apathy and diminished expression.Reference Brian Kirkpatrick36
Trajectory analyses have been proposed as a fundamental tool not only for understanding the longitudinal course patterns of negative symptoms but also for implementing early intervention programmes that facilitate patients’ recovery from FEP.Reference Chang, Ho, Tang, Wong, Hui and Chan6 Previous studies that have considered the same follow-up period have also reported the same three trajectories (i.e. stable, decreasing and increasing).Reference Chan, Chan, Pang, Hui, Suen and Chang37,Reference Austin, Mors, Budtz-Jørgensen, Secher, Hjorthøj and Bertelsen38 Most of our participants showed stable evolution of negative symptoms or decreasing response, consistent with previous studies using similar follow-up periods.Reference Chan, Chan, Pang, Hui, Suen and Chang37 It is worth noticing that Austin et al reported a fourth trajectory, identified as no response, which was formed by 27% of their sample.Reference Austin, Mors, Budtz-Jørgensen, Secher, Hjorthøj and Bertelsen38 As pointed out by the authors, those who received standard treatment presented worse negative course than those included in assertive treatment. Following this reasoning, the lack of a non-responder group in our data-set may be due to the interventions carried out in the PAFIP programme. PAFIP is a multidisciplinary programme combining a set of pharmaceutical, psychological and community interventions with the aim of improving patients’ functionality. Thus, our findings would indicate that the implementation of specific early intervention programmes may have an important effect on the evolution of negative symptoms. As recently argued by Chang et al, assessing symptoms in drug-naive patients and performing early follow-up evaluation may contribute to the identification of responders.Reference Chang, Ho, Tang, Wong, Hui and Chan6 Baseline assessments dominated by acute phases rather than first episodes may be the reason why some findings diverge across studies.Reference Austin, Mors, Budtz-Jørgensen, Secher, Hjorthøj and Bertelsen38
In our study, we observed significant differences in longitudinal cortical thickness changes across recovery groups (stable, decreasing and increasing) for the expressivity but not for the experiential dimension. Participants with increasing expressivity showed greater cortical thinning between 3 and 10 years after the onset of the psychotic disorder in four particular regions (i.e. caudal middle frontal, pars triangularis, rostral middle frontal and superior frontal).
Prefrontal thinning and negative symptoms have been closely related.Reference Walton, Hibar, van Erp, Potkin, Roiz-Santiañez and Crespo-Facorro39 As mentioned above, expressivity was formed mainly by items evaluating blunted affect. Blunted affect has been defined as difficulty in expressing emotions, characterised by diminished facial expression, expressive gestures and vocal expressions in reaction to emotion-provoking stimuli. The pars triangularis is involved in semantic processing of language as well as in non-verbal communication such as gesticulation, facial expression and modulation of timing and intonation of speech, which would explain deficits in blunted affect.Reference Shivakumar, Sreeraj, Kalmady, Gangadhar and Venkatasubramanian40 Other regions, such as the caudal and rostral middle frontal gyrus and superior frontal gyrus, have also shown increasing reduction from 3 to 10 years after FEP onset. Middle frontal gyrus and superior frontal gyrus regions have been closely related to higher cognitive functions, executive function deficit and difficulties in the regulation of emotions.Reference Gallardo-Ruiz, Crespo-Facorro, Setién-Suero and Tordesillas-Gutierrez41 Greater thinning in these areas may explain deficits in motivation and goal-directed behaviour shown by the ‘decreasing’ group over the follow-up period.Reference Bègue, Kaiser and Kirschner42 In contradiction to previous studies, we have failed to find brain alteration in the experiential dimension. This may be explained by differences in study design from previous literature (longitudinal versus cross-sectional).
An intriguing result from our study is that differences in cortical thickness started at the third year after FEP onset but not previously. This could be interpreted as a potential biomarker of persistence of negative symptoms in the expressivity dimension. This result highlights the importance of monitoring potential brain abnormalities over time to identify individuals at risk of worsening negative symptoms or even persistent symptoms in the expressivity dimension. Further studies are required to determine whether cortical thinning is linked to individual risks of negative symptoms or whether it is a side-effect of medication.
Kraepelin and Bleuler described the negative symptoms of schizophrenia as the absence or diminution of normal behaviours and functions. In particular, Kraepelin coined the term ‘avolitional syndrome’, which is understood as the foundation for the concept of the deficit syndrome in schizophrenia.Reference Buchanan43 Carpenter et al defined deficit syndrome as the presence of primary negative symptoms that are characterised by enduring traits and are also present between episodes of exacerbation of positive symptoms.Reference Carpenter, Heinrichs and Wagman44 In our study, we identified a group of individuals with FEP who are characterised by a progressive increase in the expressivity and experiential dimensions who could represent a pool of FEP patients with deficit syndrome or persistent negative symptoms. The identification of this group of patients and the analyses of potential predictors of poor negative symptom prognosis seems to be of vital importance for the implementation of therapeutic interventions for prevention and functionality improvements.
Bearing in mind that the dopamine hypothesis proposes that the negative symptoms are related to a dopaminergic hypofunction in the frontal lobe,Reference Correll and Schooler45 it is interesting to note that we found that the areas with lower density of receptors (dopamine, noradrenaline, serotonin, acetylcholine, glutamate, GABA, histamine, cannabinoid and opioid) detected in controlsReference Hansen, Shafiei, Vogel, Smart, Bearden and Hoogman28 coincide with the brain areas that discriminate the trajectories of the expressivity dimension. Based on the regional vulnerability hypothesis described in recent studies, this may suggest that disruption of frontal regions may be important for the onset of negative symptoms.
Limitations and strengths
Some limitations must be considered. First, attrition may have biased the proportions in the ‘stable’, ‘decreasing’ and ‘increasing’ groups of participants. However, LGMM is a statistical tool robust to missing data. Second, six differentially spaced follow-up measurements of SANS were carried out over the follow-up period (baseline, 6 weeks, 3 months, 1 year, 3 years and 10 years), which would make it difficult to capture the dynamism of negative symptoms. A strength of the study was that factor analyses were conducted for different time points, improving the reliability of the results.
Implications
Our finding that the SANS can be reduced to three factors (expressivity, experiential and attention) opens the possibility of developing predictive models that can anticipate poor outcomes. The identification of these factors could facilitate the implementation of therapeutic interventions for mitigating the progression of negative symptoms, including cognitive–behavioural therapy and cognitive remediation, which have been demonstrated to improve symptoms.Reference Eack, Mesholam-Gately, Greenwald, Hogarty and Keshavan46,Reference Cella, Preti, Edwards, Dow and Wykes47 Finally, cortical thickness abnormalities found at relatively late stages of FEP onset could be interpreted as specific biomarkers of poor evolution or persistent symptoms in the expressivity dimension that are linked to receptor density. Further analyses are required to confirm these results.
Supplementary material
Supplementary material is available at https://doi.org/10.1192/bjp.2022.192.
Data availability
Data are available from the corresponding author on request.
Acknowledgement
We thank Diana Tordesillas-Gutierrez for the neuroimaging acquisition and pre-processing.
Author contributions
M.C.-R. and R.R.-G.: conception of the study, study design, analysis, drafting and revising the manuscript. M.R.-V.: conception of the study, study design, analysis and revising the manuscript. V.O.-G.d.l.F.: analyses. A.L.-D., N.G.-T., R.A.-A., J.V.-B., J.M.v.S., P.B. and T.K.: revising of the manuscript. B.C.-F.: conception of the study, study design, collecting data, analysis and revising the manuscript. All authors contributed to and have approved of the final version of the manuscript.
Funding
This work was supported by the Instituto de Salud Carlos III (PI14/00639 and PI14/00918) and Fundación Instituto de Investigación Marqués de Valdecilla (NCT0235832 and NCT02534363). M.C.-R. acknowledges funding support from the Consejería de Salud y Familias (Junta de Andalucía) 2020 grant, which covers his salary (RH-0081-2020). R.R.-G. is funded by the EMERGIA Junta de Andalucía programme (EMERGIA20_00139) and the Plan Propio of the University of Seville.
Declaration of interest
None.


 Open access
eLetters
No eLetters have been published for this article.