


Depressive symptoms and cognitive impairment are two of the most prevalent psychiatric conditions strongly associated with poor quality of later life and a high social burden.Reference Byers, Yaffe, Covinsky, Friedman and Bruce1–Reference Macdonald4 Because of its significant clinical and public health importance, the relationship between late-life depressive symptoms and subsequent cognitive decline indicative of dementia has become an increasing focus of contemporary research. A series of cohort studies have suggested that depressive symptoms are associated with cognitive decline or dementia,Reference Geda, Roberts, Mielke, Knopman, Christianson and Pankratz5–Reference Li, Wang, Shofer, Thompson, Peskind and McCormick13 whereas several other studies reported inconsistent findings.Reference Vinkers, Gussekloo, Stek, Westendorp and van der Mast14–Reference Comijs, van Tilburg, Geerlings, Jonker, Deeg and van Tilburg17 Studies reporting these inconsistent findings have largely focused on the association between a single-time (mostly baseline) assessment of depressive symptoms and cognitive decline.Reference Geda, Roberts, Mielke, Knopman, Christianson and Pankratz5–Reference Wilson, Barnes, Mendes de Leon, Aggarwal, Schneider and Bach8, Reference Saczynski, Beiser, Seshadri, Auerbach, Wolf and Au12–Reference Richard, Reitz, Honig, Schupf, Tang and Manly16 However, as depressive symptoms tend to fluctuate over time,Reference Judd, Akiskal, Maser, Zeller, Endicott and Coryell18, Reference Judd and Akiskal19 it is likely that these studies may not have fully captured the persistent effect of these symptoms on cognitive decline, affecting our understanding of this relationship. Only a small number of longitudinal studies using repeated assessments of depressive symptoms have been conducted to date, and these studies have typically used small sample sizes over a short time period,Reference Paterniti, Verdier-Taillefer, Dufouil and Alperovitch10, Reference Geda, Knopman, Mrazek, Jicha, Smith and Negash11 or in a particular subpopulation, such as women,Reference Zeki Al Hazzouri, Vittinghoff, Byers, Covinsky, Blazer and Diem9 which may limit the generalisability of the results. Moreover, most prior studies have explored the association between baseline depressive symptoms and incident cognitive impairment,Reference Geda, Roberts, Mielke, Knopman, Christianson and Pankratz5–Reference Bassuk, Berkman and Wypij7, Reference Paterniti, Verdier-Taillefer, Dufouil and Alperovitch10–Reference Li, Wang, Shofer, Thompson, Peskind and McCormick13, Reference Richard, Reitz, Honig, Schupf, Tang and Manly16 rather than the association between depressive symptoms and the trajectory of cognitive decline. The trajectory of cognitive decline, which consists of several assessments of cognitive function, is of great importance for evaluating and monitoring the progression of cognitive deterioration and could therefore be more informative for early intervention.
The English Longitudinal Study of Ageing (ELSA) has involved multiple phases of data collection, representing a golden opportunity for exploring the association between late-life depressive symptoms and the trajectory of subsequent cognitive decline. The objectives of the present study were (a) to determine whether depressive symptoms predict cognitive decline in an elderly population at baseline, and (b) to examine whether people reporting episodic or persistent depressive symptoms show a similar or different association with subsequent cognitive decline.
Method
Study population
This study used data from wave 1 (2002–2003) to wave 7 (2014–2015) of the ELSA study, which is a prospective and nationally representative cohort of men and women living in England aged 50 years and over.Reference Marmot, Oldfield, Clemens, Blake, Phelps and Nazroo20 A detailed description of the goals, design and methods of the ELSA has been published elsewhere.Reference Steptoe, Breeze, Banks and Nazroo21 A flowchart of the cohort is shown in Supplementary Figure 1 available at https://doi.org/10.1192/bjp.2018.155. A total of 12 099 participants took part in the wave 1 survey of the ELSA. Of these, 3226 participants were excluded from this study because they did not attend the wave 2 survey (n = 2706), did not complete the cognitive tests at wave 1 or wave 2 (n = 502) or had self-reported doctor-diagnosed dementia at wave 1 or wave 2 (n = 18). An additional 1263 individuals were excluded because of loss to follow-up from wave 3 to wave 7. The remaining 7610 participants (3272 men and 4338 women) with complete baseline data (wave 2) and at least one reassessment of cognitive function (wave 3 to wave 7) were included in the analyses reported here.
The ELSA study was approved by the London Multicentre Research Ethics Committee (MREC/01/2/91) and informed consent was obtained from all participants.
Cognitive assessments
The cognitive assessments were conducted as described previously.Reference Zheng and Xie22, Reference Zheng, Yan, Yang, Zhong and Xie23 The memory function of each participant was measured with immediate and delayed recall of ten unrelated words. Both immediate and delayed recall scores ranged from 0 to 10, with higher scores indicating better memory performance. Immediate and delayed recall tests have been shown to have good construct validity and consistency.Reference Baars, van Boxtel, Dijkstra, Visser, van den Akker and Verhey24 A composite memory score was created by summing the scores of the individual memory tests. Executive function was assessed with a verbal fluency task, in which individuals were required to verbally name as many animals as they could in 60 s. Because of the well-documented reliability and validity of this task, it has already been utilised as a solid indicator of executive function within the ELSA population.Reference Dregan, Stewart and Gulliford25 The total score on the animal-naming test was the total number of words produced, excluding repetitive words and words outside the animal category. Orientation to time was assessed by asking four questions (one point each for day of month, month, year and day of week). A global cognitive score was created by summing the individual scores on the memory, executive function and orientation assessments. Generally, higher scores indicate better cognitive function.
Depressive symptoms
Depressive symptoms were measured with the eight-item version of the Center for Epidemiologic Studies Depression Scale (CES-D), a widely used self-report measure of depressive symptoms, used to identify people at risk of depression in population-based studies.Reference Zheng and Xie22 Participants were asked to think about the past week and the feelings they experienced and to indicate whether each of the following statements was true for them much of the time during the past week: you felt depressed; you felt that everything was an effort; your sleep was restless; you were happy; you felt lonely; you enjoyed life; you felt sad; you could not get going. There were two response options: yes or no. This version of the CES-D has an internal consistency and factor structure that are comparable with longer versions of the scale.Reference Turvey, Wallace and Herzog26 As in previous studies, we used a score of ≥4 to define participants with elevated depressive symptoms.Reference Hamer, Batty and Kivimaki27 To derive a duration of depressive symptoms score, we totalled the number of occasions an individual was recorded as being a case at each wave, resulting in a score range from 0 (never a case) to 2 (a case at both wave 1 and wave 2). The sum of CES-D scores at wave 1 and wave 2, ranging from 0 to 16, was used when modelled as a continuous measure. Participants reporting depressive symptoms at wave 1 or wave 2 were classified as having episodic depressive symptoms, and those reporting depressive symptoms at both waves were classified as having persistent depressive symptoms.
Covariates
According to previous studies, covariates known to be associated with both depression and cognitive function were selected in our analyses.Reference Zeki Al Hazzouri, Vittinghoff, Byers, Covinsky, Blazer and Diem9, Reference Richard, Reitz, Honig, Schupf, Tang and Manly16, Reference Katon, Pedersen, Ribe, Fenger-Gron, Davydow and Waldorff28 Blood pressure was measured by the nurse in the right arm of each participant while they were in a sitting position, using the Omron HEM-907.Reference Graig, Deverill, Pickering, Spronston and Mindell29 Five minutes elapsed before the first reading was taken. The mean value of three consecutive blood pressure readings was used in our analyses. Hypertension was determined as systolic blood pressure of ≥140 mm Hg and/or diastolic blood pressure of ≥90 mm Hg, or if the participant was currently using anti-hypertensive drugs. Education level was classified as no qualification, level 1 National Vocational Qualification (NVQ1) or certificate of secondary education, NVQ2 or O-level, NVQ3 or A-level, higher qualification but below degree, and degree level or higher or NVQ4/5. Marital status was classified as single (never married), married, remarried, legally separated, divorced or widowed. We defined cohabitation status as currently living alone or not. Participants were split into two groups: non-smokers (never smoked or ex-smokers) and smokers (current smokers). Alcohol intake was calculated from participant-reported drinking frequency over the previous year (weekly drinking versus occasional or never). Standing height was measured with a portable stadiometer, with participants standing in the centre of the base plate looking straight ahead, and weight was measured by portable electronic scales.Reference Graig, Deverill, Pickering, Spronston and Mindell29 Body mass index was calculated with the following formula: weight (kg)/height2 (m2). Diabetes was defined as haemoglobin A1c ≥6.5%, fasting blood glucose ≥7.00 mmol/L or current use of anti-diabetic therapy. Measures of chronic disease included lifetime self-reported physician diagnoses of coronary heart disease (angina and heart attack), stroke, chronic lung disease and cancer. The use of antidepressants was measured by asking the participants whether antidepressant medication was recommended by their doctor at wave 2.
Statistical analysis
The results are presented as percentages for categorical variables or mean ± s.d. for continuous variables. The cross-sectional associations between baseline depressive symptoms and cognitive scores at baseline were tested by multiple linear regression models and analyses of covariance. Linear mixed models were used to evaluate the longitudinal associations. Linear mixed models were used to evaluate the longitudinal associations between the sum of CES-D scores (wave 1 and wave 2, range 0–16) and cognitive scores over time. We also ran longitudinal analyses with the duration score of depressive symptoms, with 0 (never a case) as the referent. Linear mixed models use all available data over the follow-up period, take into account the fact that repeated measures on the same participant are correlated with each other and can handle missing data. In these models, both the intercept and the slope were fitted as random effects to account for inter-individual differences at baseline and different rates of change of cognitive function over the follow-up period. The first model included the duration of depressive symptoms (0, 1 or 2), time (years since baseline), time × depressive symptoms interaction, age (years) and gender (male or female). The time × depressive symptoms interaction term indicated differential change of cognitive function by the duration of depressive symptoms from baseline to the end of the study (wave 2 to wave 7). The second model additionally adjusted for baseline body mass index (kg/m2), education (<NVQ3/GCE A level or ≥NVQ3/GCE A level), marital status (currently living alone or not), current smoking (yes or no), alcoholic drink (less than once per week or once or more per week), antidepressant medication (yes or no), hypertension (yes or no), diabetes (yes or no), depressive symptoms × diabetes interaction, coronary heart disease (yes or no), stroke (yes or no), chronic lung disease (yes or no) and cancer (yes or no). Because Katon et al found that the co-occurrence of depression and diabetes was associated with a higher rate of subsequent dementia,Reference Katon, Pedersen, Ribe, Fenger-Gron, Davydow and Waldorff28 we included the depressive symptoms × diabetes interaction in the second model.
To enhance the utility of the findings for clinicians, mild cognitive impairment (MCI) was also considered in our analyses. We defined MCI as a global cognitive score <20 (1.5 s.d. below its mean, as proposed by Petersen et al Reference Petersen, Smith, Waring, Ivnik, Tangalos and Kokmen30). The status of MCI (yes or no) was allowed to vary over the follow-up period. Poisson regression with PROC GENMOD (DIST = Poisson and LINK = log) was performed to assess the strength of associations (relative risk) between depressive symptoms and MCI, and generalised estimating equations were used to analyse binary repeated measures data.
We used a multiple imputation, chained-equations method to replace missing data for cognitive assessments during follow-up (wave 3 to wave 7), and used all available data from 8873 participants in the sensitivity analyses. Variables used to impute the missing values of cognitive scores included participants' baseline information (age, gender, education, marital status, body mass index, current smoking, alcoholic drink, diabetes and stroke) and baseline cognitive scores. For each longitudinal analysis, we created 20 imputed data-sets and combined the results with the MIANALYZE procedure.
Statistical analyses were performed with SAS software, version 9.4 (SAS Institute Inc., North Carolina, USA; see https://www.sas.com/en_gb/software/sas9.html). All analyses were two-sided, with an alpha value of 0.05 considered as the threshold for statistical significance.
Results
Baseline characteristics and sample size
The mean age of the 7610 participants was 65.2 ± 10.1 years, and 57.0% of participants were female. Of these, 1157 (15.2%) participants were classified as experiencing episodic depressive symptoms and 525 participants (6.9%) were classified as experiencing persistent depressive symptoms. Table 1 shows the baseline characteristics of participants according to the number of waves with depressive symptoms. In general, compared with those without depressive symptoms, participants who reported a longer duration of depressive symptoms had significantly less favourable characteristics. Study participants reporting a longer duration were older; had higher body mass index; were more likely to be female; had higher percentages of living alone, smoking, diabetes, coronary heart disease, stroke; and chronic lung disease; had lower percentages of higher education and drinking and had worse cognitive function.
Table 1 Characteristics of the study participants at baseline (wave 2), according to the number of occasions (wave 1 to wave 2) with depressive symptoms

The results are presented as mean ± s.d., or n (%).
CES-D, Center for Epidemiologic Studies Depression; NVQ, National Vocational Qualification.
a. Calculated by linear regression analysis or χ 2-test for trend.
Cognitive function was assessed at baseline (wave 2) and reassessed biennially at wave 3 to wave 7. The cohort size was 7610 (wave 2), 7221 (wave 3), 6225 (wave 4), 5763 (wave 5), 5267 (wave 6) and 4573 (wave 7). The mean follow-up duration was 7.9 ± 2.9 years and the mean number of cognitive assessments was 4.8 ± 1.5.
Depressive symptoms and cognitive scores (cross-sectional analyses)
Supplementary Figure 2 shows the multivariable-adjusted cognitive scores according to the number of waves with depressive symptoms. All of the cognitive scores decreased linearly with increasing duration of depressive symptoms (all P for trend < 0.001). As seen in Supplementary Table 1, when modelled as a continuous measure, a one-unit change in the sum of CES-D scores was also associated with the four cognitive scores after adjustment for age and gender (all P < 0.001), and these associations were still significant after multivariable adjustment.
Depressive symptoms and cognitive decline (longitudinal analyses)
Table 2 shows the longitudinal associations between the sum of CES-D and rate of change in cognitive scores. After multivariable adjustment, a one-unit increment in the sum of CES-D scores was associated with faster declines in global cognitive scores (–0.012 points/year, 95% CI –0.019 to –0.005, P = 0.001), memory scores (–0.004 points/year, 95% CI –0.007 to –0.002, P = 0.002), executive function scores (–0.005 points/year, 95% CI –0.011 to –0.001, P = 0.015) and orientation scores (–0.001 points/year, 95% CI –0.002 to –0.001, P < 0.001).
Table 2 Association between sum of CES-D scores (wave 1 and wave 2, range 0–16) and rate of change in cognitive scores (points/year): longitudinal analyses with linear mixed models

CES-D, Center for Epidemiologic Studies Depression.
a. Adjusted for baseline age, gender, body mass index, education, marital status, current smoking, alcoholic drink, antidepressant medication, hypertension, diabetes, depressive symptoms × diabetes interaction, coronary heart disease, stroke, chronic lung disease and cancer.
As shown in Fig. 1, cognitive scores of participants with persistent depressive symptoms significantly deteriorated over time compared with participants without depressive symptoms at wave 1 and wave 2. The multivariable-adjusted rates of global cognitive decline associated with episodic depressive symptoms and persistent depressive symptoms were faster by –0.065 points/year (95% CI –0.129 to –0.000) and –0.141 points/year (95% CI –0.236 to –0.046), respectively, compared with participants without depressive symptoms (P for trend < 0.001; Table 3). Similarly, memory, executive and orientation function also declined faster with increasing duration of depressive symptoms (all P for trend < 0.05; Table 3). Compared with the reference category, the multivariable-adjusted rate of memory decline associated with persistent depressive symptoms was faster by –0.048 points/year (95% CI –0.084 to –0.013), and the rates of executive and orientation function decline were faster by –0.074 points/year (95% CI –0.146 to –0.002) and –0.014 points/year (95% CI –0.023 to –0.006), respectively (Table 3).
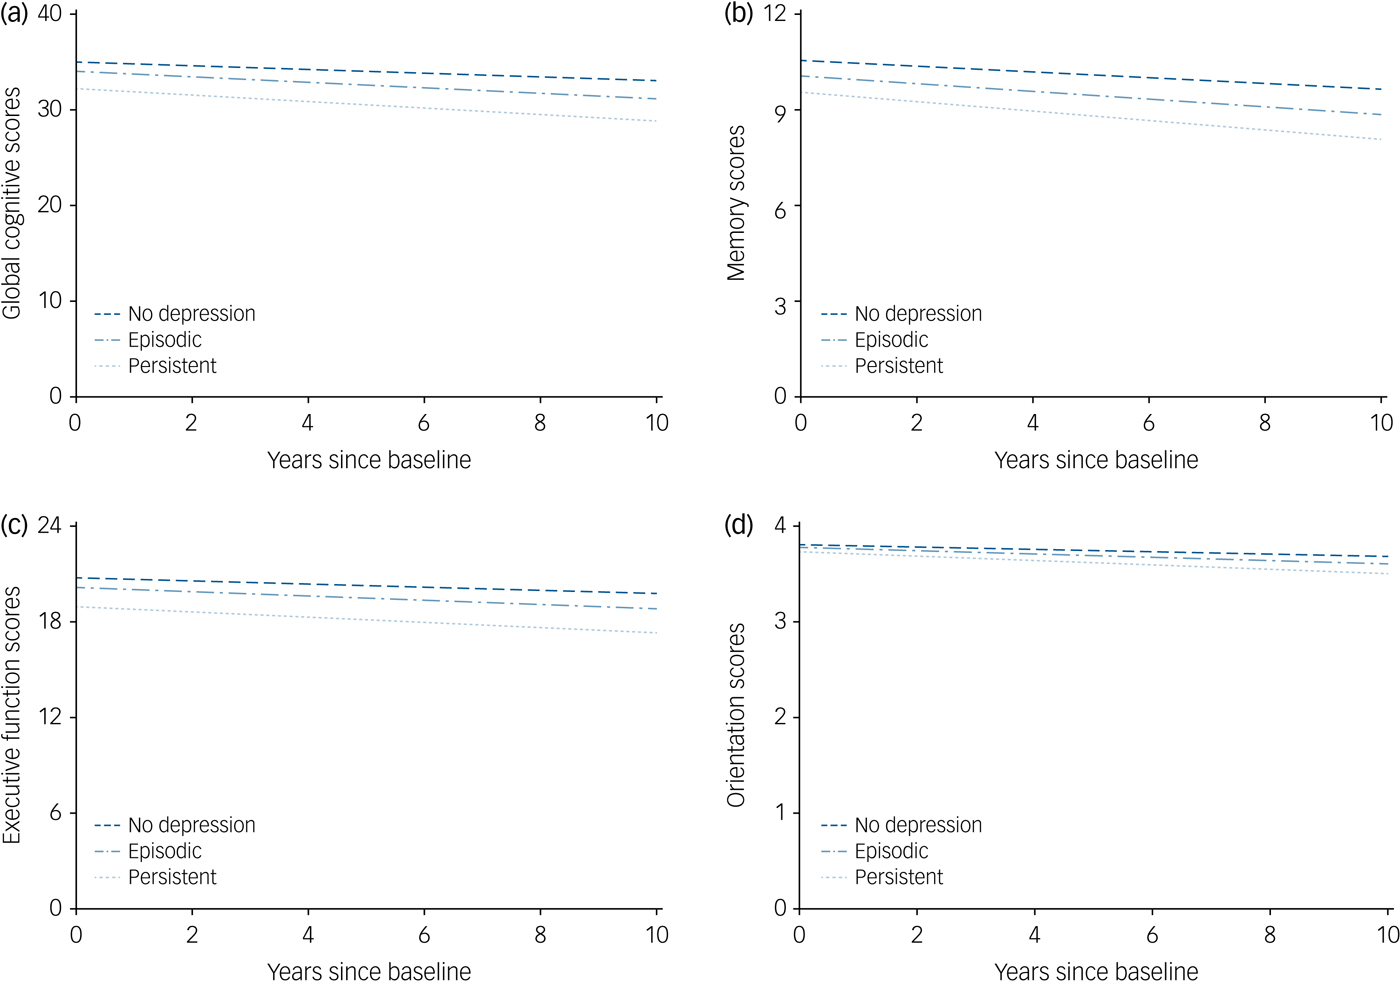
Fig. 1 The trajectories of cognitive scores by the number of waves with depressive symptoms (wave 1 to wave 2), adjusted for baseline age, gender, body mass index, education, marital status, current smoking, alcoholic drink, antidepressant medication, hypertension, diabetes, depressive symptoms × diabetes interaction, coronary heart disease, stroke, chronic lung disease and cancer.
Table 3 Mean difference in the rate of change in cognitive scores (points/year) comparing the number of waves with depressive symptoms (wave 1 to wave 2): longitudinal analyses with linear mixed models

ref, reference value.
a. Model 1: adjusted for baseline age and gender.
b. Model 2: further adjusted for baseline body mass index, education, marital status, current smoking, alcoholic drink, antidepressant medication, hypertension, diabetes, depressive symptoms × diabetes interaction, coronary heart disease, stroke, chronic lung disease and cancer.
Depressive symptoms and MCI (longitudinal analyses)
As shown in Supplementary Table 2, compared with participants without depressive symptoms, episodic and persistent depressive symptoms were associated with a 13 and 28% greater risk of MCI, respectively, after multivariable adjustment.
Non-response analyses
A total of 1263 participants (14.2%) with complete baseline data were excluded from the study because they were lost to follow-up. This group of excluded participants were older; had higher levels of systolic blood pressure; higher percentages of living alone, current smoking, diabetes, coronary heart disease, stroke, chronic lung disease, cancer and depressive symptoms; had lower percentages of higher education and drinking and had worse cognitive function (see Supplementary Table 3).
Sensitivity analyses
Longitudinal results with imputed data (n = 8873) were similar to those from the main analyses (see Supplementary Tables 4 and 5). Thus, the effect of missing data was likely to be small.
Discussion
In this large ongoing cohort study of an elderly British population, depressive symptoms were associated with baseline cognitive function in a cross-sectional analysis. Moreover, depressive symptoms were associated with subsequent cognitive decline over a 10-year follow-up period in a longitudinal analysis. In addition to this association, we found that the cumulative depressive symptom burden was independently and strongly associated with poorer cognitive performance and could, in a dose-response pattern, predict accelerated subsequent cognitive decline.
This study used previous assessments of depressive symptoms as a baseline to investigate the temporal association between persistent depressive symptoms and the trajectory of subsequent cognitive decline in a large general population, using depressive symptom data collected at wave 1 and wave 2 and cognitive decline data from wave 2 to wave 7. Several cohort studies have been conducted to explore the association between cumulative depressive symptoms and cognitive decline.Reference Zeki Al Hazzouri, Vittinghoff, Byers, Covinsky, Blazer and Diem9, Reference Kohler, van Boxtel, van Os, Thomas, O'Brien and Jolles31, Reference van den Kommer, Comijs, Aartsen, Huisman, Deeg and Beekman32 However, these studies were unable to confirm the temporal relations involved because it could not be determined with certainty whether a change in mood status preceded the development of cognitive decline based on data collected simultaneously during the same follow-up period. Although a small number of studies have examined the fluctuating nature of depressive symptoms over time, using multiple depressive assessments for statistical analysis, they have typically used incident cognitive decline as the main outcome measure and failed to show an effect on subsequent cognitive trajectory.Reference Paterniti, Verdier-Taillefer, Dufouil and Alperovitch10, Reference Geda, Knopman, Mrazek, Jicha, Smith and Negash11 Apart from the methodological differences mentioned above, our results were largely compatible with previous findings,Reference Zeki Al Hazzouri, Vittinghoff, Byers, Covinsky, Blazer and Diem9–Reference Geda, Knopman, Mrazek, Jicha, Smith and Negash11 demonstrating not only a significant association of depressive symptoms with cognitive decline, but also a greater effect of persistent depressive symptoms on subsequent cognitive deterioration. Importantly, our results are also supported by a recent study with a clinically depressed sample.Reference Riddle, Potter, McQuoid, Steffens, Beyer and Taylor33 Nevertheless, it should be noted that only a weak association between depressive symptoms and cognitive decline was observed, in accordance with previous studies.Reference Wilson, Barnes, Mendes de Leon, Aggarwal, Schneider and Bach8, Reference van den Kommer, Comijs, Aartsen, Huisman, Deeg and Beekman32 Although depressive symptoms may have caused only miniscule annual changes in cognitive function, the phenomenon could play an important role in cognitive decline. As reported in a previous study, even minor differences in cognition can lead to a substantially increased risk of dementia over several years.Reference Bozoki, Giordani, Heidebrink, Berent and Foster34 Because there is currently no cure for dementia, early detection and intervention based on modifiable predictors, such as depressive symptoms, may offer an effective approach for the prevention of cognitive decline, delaying the progression to dementia and reducing its prevalence and associated public health burden.
Depression and cognitive impairment can have severe consequences, including reduced quality of life, elevated needs of social services and increased mortality, and are among the most important mental health problems among elderly people.Reference Byers, Yaffe, Covinsky, Friedman and Bruce1–Reference Macdonald4 Late-onset depression and MCI occur together at a rate of up to 63%, suggesting a close association between the two disorders.Reference Panza, Frisardi, Capurso, D'Introno, Colacicco and Imbimbo35 Increasing research attention has focused on elucidating the relationship between depression and subsequent cognitive decline in recent decades, but this research has yielded mixed findings. One possible explanation for the discrepancy in previous findings might be related to the fluctuating nature of depressive symptoms over time. As mentioned above, most previous studies have been limited by their use of a single assessment of depressive symptoms, potentially resulting in underestimation of the association. As such, our study adds more evidence to previous research by exploring the influence of the cumulative burden of repeated measures of depressive symptoms on subsequent cognitive outcomes. In addition, previous studies assessing the association between depressive symptoms and cognitive decline have been heterogeneous in terms of study population, symptom measurement, cognitive assessment, follow-up periods, outcome ascertainment and the reporting of results, which may have contributed to the discrepancies in findings. Furthermore, the magnitude of the dose-response association between the duration of depressive symptoms and faster subsequent cognitive decline was not attenuated by adjusting for these covariates in our linear mixed models, suggesting that depressive symptoms is strongly linked to cognitive decline independently of other social factors and comorbidities. These findings suggest that multiple assessments of depressive symptoms should be taken into account to detect depression and improve prognosis.
Importantly, although our results reveal a significant association of persistent depressive symptoms at wave 1 and wave 2, with subsequent cognitive decline from wave 2 to wave 7, the presence of depressive symptoms at subsequent waves and their potential effect on cognitive function should be considered. The observed cognitive decline was related not only to depressive symptoms at wave 1 and wave 2, but also to depressive symptoms in later waves. However, because individuals from the persistent depressive symptoms group would be expected to have a higher risk of depressive symptoms in later waves (see Supplementary Table 6), the persistent depressive symptoms at wave 1 and wave 2 could, to some extent, predict accelerated subsequent cognitive decline.
The mechanisms underlying the association between depressive symptoms and cognitive decline remain under debate, and several different mechanisms have been proposed. Accordingly, depressive symptoms could be a risk factor for subsequent cognitive decline, an early manifestation of cognitive deterioration, a reaction to perceived cognitive decline and functional disability or even a symptom of a related risk factor, such as cerebrovascular disease or neurodegenerative changes.Reference Geda, Knopman, Mrazek, Jicha, Smith and Negash11, Reference Li, Wang, Shofer, Thompson, Peskind and McCormick13, Reference Richard, Reitz, Honig, Schupf, Tang and Manly16 As summarised by Byers and Yaffe, predominant pathways linking depressive symptoms to cognitive decline include vascular disease, proinflammatory changes and hippocampal atrophy, and those pathways are likely to be multifactorial and not sequential.Reference Byers and Yaffe36 It should be noted that, because it is not possible to conduct a randomised trial to test the relationship between depressive symptoms and subsequent cognitive decline, conclusions must be based on observational studies, from which causality cannot be established. However, with the current temporal design, we were able to conclude with confidence that, although a causal relationship remains to be determined, depressive symptoms exhibited years before could predict subsequent cognitive decline, and hence could serve as an indicator for early intervention to prevent further exacerbation of cognitive decline.
To our knowledge, the present study is the largest general population-based study exploring the relationship between depressive symptoms and cognitive decline with a long-term follow-up of 10 years. Moreover, cognitive function was repeatedly measured over a long period, providing a more robust measurement of cognitive deterioration. Our study design enabled us to better measure the cumulative burden of depressive symptoms and to estimate the long-term trajectories of cognitive decline. Nevertheless, our findings should be interpreted cautiously in the context of several potential limitations. First, because our study lacked the clinical diagnosis of dementia during follow-up, we could not analyse the temporal relationship between depressive symptoms and dementia. Second, although we adjusted for a number of potential confounders, we could not rule out the possibility of residual confounding factors, such as anxiety, chronic pain, sleep-related issues and prescribed agents that may affect anxiety and cognition. Genetic susceptibility factors, such as the APOE genotype, are also potential confounders. Currently, the moderating effect of the APOE genotype on the association between depressive symptoms and cognitive outcome remains equivocal, with some studies suggesting a synergistic interaction between APOE genotype and depressive symptoms in elevating the risk of further cognitive decline,Reference Pink, Stokin, Bartley, Roberts, Sochor and Machulda6, Reference Geda, Knopman, Mrazek, Jicha, Smith and Negash11 whereas others have not supported the existence of such an effect.Reference Kohler, van Boxtel, van Os, Thomas, O'Brien and Jolles31, Reference Jackson, Rajah, Morris, Ballard, Thomas and O'Brien37, Reference Butters, Sweet, Mulsant, Ilyas Kamboh, Pollock and Begley38 Unfortunately, genetic data are not available in ELSA, so we cannot adjust for the APOE genotype. Third, although we adjusted for the use of antidepressant, it should be noted that the data we used might not represent actual antidepressant use. Fourth, 1263 participants (14.2%) with complete baseline data were excluded from the study because they were lost to follow-up, potentially causing selection bias. Fifth, the study population was healthier than the original ELSA population, which may threaten the internal validity of estimates, potentially limiting the generalisability of our findings to the English population. However, sensitivity analyses with multiple imputation methods revealed similar results, indicating that the effect of attrition was minimal. In addition, cognition was assessed by isolated tasks in this study. Broader assessment of neuropsychological cognitive domain performance may have produced different results. Besides, individuals with depressive symptoms were not identified by a clinical diagnosis of depression made by a psychiatrist according to symptom criteria. The CES-D mainly assesses the depressive symptoms in the past week, which might lead to underestimation of the presence of depressive symptoms. Finally, although we identified the detection of depressive symptoms at both wave 1 and wave 2 as persistent depressive symptoms, it is still possible that what we captured are actually two separate episodes of depressive symptoms. In this case, the effect of persistent depressive symptoms on subsequent cognitive trajectory might represent the cumulative burden of recurrent depressive symptoms.
In conclusion, this study demonstrated that depressive symptoms were significantly associated with both baseline cognitive function and subsequent cognitive decline over a 10-year follow-up period. Cumulative exposure of long-term depressive symptoms in elderly individuals could predict accelerated subsequent cognitive decline in a dose-response pattern. Careful monitoring of depressive symptoms in older adults may benefit early intervention and treatment of those symptoms, delaying the progression of cognitive impairment and the development of late-onset dementia.
Supplementary material
Supplementary material is available online at https://doi.org/10.1192/bjp.2018.155.
Funding
This study was funded by the National Natural Science Foundation of China (project no. 81601176), the Beijing Natural Science Foundation (project no. 7182108) and the Newton International Fellowship from the Academy of Medical Sciences (project no. NIF001-1005-P56804). The funding source had no role in the design and conduct of the study; collection, management, analysis and interpretation of the data; preparation, review or approval of the manuscript and decision to submit the manuscript for publication.
Acknowledgments
We thank the original data creators, depositors, copyright holders, the funders of the Data Collections and the UK Data Archive for the use of data from English Longitudinal Study of Ageing: waves 0–7, 1998–2015. The original data creators, depositors or copyright holders bear no responsibility for the current analysis or interpretation.


eLetters
No eLetters have been published for this article.