


Schizophrenia spectrum disorders are severe mental health conditions that may profoundly disrupt daily life and cause intense suffering for those affected and their families. Their course typically spans a wide spectrum of symptom and functional trajectories, ranging from complete recovery to occasional relapses with sustained functionality and symptom-free periods, or to persistent symptoms leading to significant psychological, social and occupational impairment. Reference Lally, Ajnakina, Stubbs, Cullinane, Murphy and Gaughran1–Reference Canal-Rivero, Ruiz-Veguilla, Ortiz-García de la Foz, López-Díaz, Garrido-Torres and Ayesa-Arriola6
Normative brain charts
Research on first-episode psychosis (FEP) has extensively utilised magnetic resonance imaging (MRI) to investigate brain morphological alterations as potential predictors of symptom and functional outcomes. Reference Dazzan, Arango, Fleischacker, Galderisi, Glenthoj and Leucht7 Although significant clinical associations of brain imaging-derived phenotypes have been identified, the observed results have proven to be subtle and heterogeneous, which has hindered their translation into clinical practice. Reference Segal, Parkes, Aquino, Kia, Wolfers and Franke8 A potential key limitation is that most studies have employed case-control approaches, which overlook potentially diverse biological and clinical profiles by considering within-group variations as noise, thereby ignoring individual differences and undermining the replicability of the results. Reference Remiszewski, Bryant, Rutherford, Marquand, Nelson and Askar9 To address these limitations, normative brain charts derived from large MRI datasets spanning the human lifespan have recently emerged as a biologically driven solution, Reference Bethlehem, Seidlitz, White, Vogel, Anderson and Adamson10 enabling the assessment of individual brain morphology deviations in the psychosis spectrum against normative neurodevelopmental ranges for sex and age. Reference García-San-Martín, Bethlehem, Mihalik, Seidlitz, Sebenius and Alemán-Morillo11 Recent longitudinal studies using normative modelling have shown significant associations between normative cortical and subcortical deviations at FEP and symptom progression over time. Reference Remiszewski, Bryant, Rutherford, Marquand, Nelson and Askar9,Reference Worker, Berthert, Lawrence, Kia, Arango and Dinga12–Reference Wolfers, Doan, Kaufmann, Alnæs, Moberget and Agartz14 However, studies using these approaches remain scarce, and relevant aspects such as functioning and specific symptoms remain unexplored. Further research is needed to identify reliable biological predictors that can determine, from the early stages of psychosis, which patients are at risk for poor or favourable long-term symptom and functional trajectories. Reference Dazzan15,Reference Jollans and Whelan16 Such advances would enhance early clinical decision-making, optimise therapeutic resources and promote preventive, personalised and comprehensive mental health care aimed at maximising treatment outcomes and quality of life for this population. Within this framework, the current study investigates potential predictors of clinical and functional trajectories, focusing on the relationship between cortical and subcortical grey matter volume (GMV) deviations at first break of the illness, and on long-term symptom and functional trajectories. We hypothesise that deviations in cortical and subcortical regions at baseline will predict long-term clinical and functioning trajectories.
Method
Participants
Participants were drug-naïve patients experiencing a FEP and recruited through an epidemiological Early Intervention Programme for Initial Phases of Psychoses (PAFIP) at the University Hospital Marqués de Valdecilla, Santander, Spain. Reference Pelayo‐Terán, Pérez‐Iglesias, Ramírez‐Bonilla, González‐Blanch, Martínez‐García and Pardo‐García17 This cohort comprised a total of 352 FEP patients (138 females, mean age 29.71 ± 8.77 years) who provided written consent to participate in a longitudinal study. The study was approved by the ethical committee of the University of Seville (reference no. 2024-2534). Patients were treated with the minimum effective antipsychotic dosage, in accordance with clinical standards.
Patients were eligible for the study if they: (a) were aged 15–60 years; (b) met DSM-IV criteria within the Schizophrenia Spectrum and Other Psychotic Disorders (schizophrenia, schizophreniform disorder, schizoaffective disorder, brief psychotic disorder, schizotypal personality disorder or psychosis not otherwise specified), as assessed by the Structured Clinical Interview for DSM Disorders; and (c) had no prior treatment with antipsychotic medication or, if previously treated, had a total lifetime of adequate antipsychotic treatment of <6 weeks. Exclusion criteria were: (a) meeting DSM-IV criteria for drug dependence (excluding nicotine dependence); (b) meeting DSM-IV criteria for intellectual disability; and (c) having a history of neurological disease or head injury. The initial diagnosis was reviewed after a 6-month period and updated, if necessary, at that time or during follow-up.
MRI acquisition and volume extraction at FEP
Brain structural MRI scans were conducted at FEP baseline using a 1.5-T General Electric SIGNA System (GE Medical Systems, Milwaukee, WI, USA) and a 3T Philips Medical Systems MRI scanner (Achieva, Best, The Netherlands) equipped with an eight-channel head coil. A three-dimensional T1-weighted sequence was employed. The parameters for 1.5 T were: echo time 5 ms, repetition time 24 ms, number of excitations 2, rotation angle 45°, field of view 26 × 19.5 cm, slice thickness 1.5 mm and a matrix of 256 × 192; and for 3T, echo time 3.7 ms, repetition time 8.2 ms, flip angle 8°, acquisition matrix 256 × 256, voxel size 0.94 × 0.94 × 1 mm and 160 contiguous slices. Prior to analysis, all images underwent visual inspection for detection of potential motion artefacts and gross anatomical abnormalities. FreeSurfer 6.0.0 recon-all was used to extract regional volumes for each of the 68 cortical regions and 14 subcortical regions of the Desikan–Killiany parcellation (http://surfer.nmr.mgh.harvard.edu). None of the participants had a total GMV more than five standard deviations above or below the mean, so none was identified as an outlier.
GMV centile estimation
To benchmark the GMVs of our cohort, we employed prior normative trajectories across the lifespan GMV development from over 100 000 neurotypical individuals, which were estimated using a generalised additive model for location, scale and shape (GAMLSS; Reference Bethlehem, Seidlitz, White, Vogel, Anderson and Adamson10 code and normative trajectories available at https://github.com/brainchart/Lifespan). This method allows the estimation of centiles (ranging from 0 to 1), indicating participants’ deviations from the median normative trajectory after adjusting for age, sex and scanning site. Additionally, we assessed that centile estimation in our sample would not vary between scanners (see Supplementary Materials available at https://doi.org/10.1192/bjp.2025.105, Supplementary Fig. 1). Centiles below 0.5 indicate a GMV reduction compared with the normative value, while those above 0.5 reveal volume increase (Fig. 1a). Thus, centiles of 352 FEP participants at baseline (centilesBL) were computed for each cortical and subcortical region (Fig. 1b). All brain figures were generated using the ENIGMA toolbox. Reference Larivière, Paquola, Park, Royer, Wang and Benkarim18
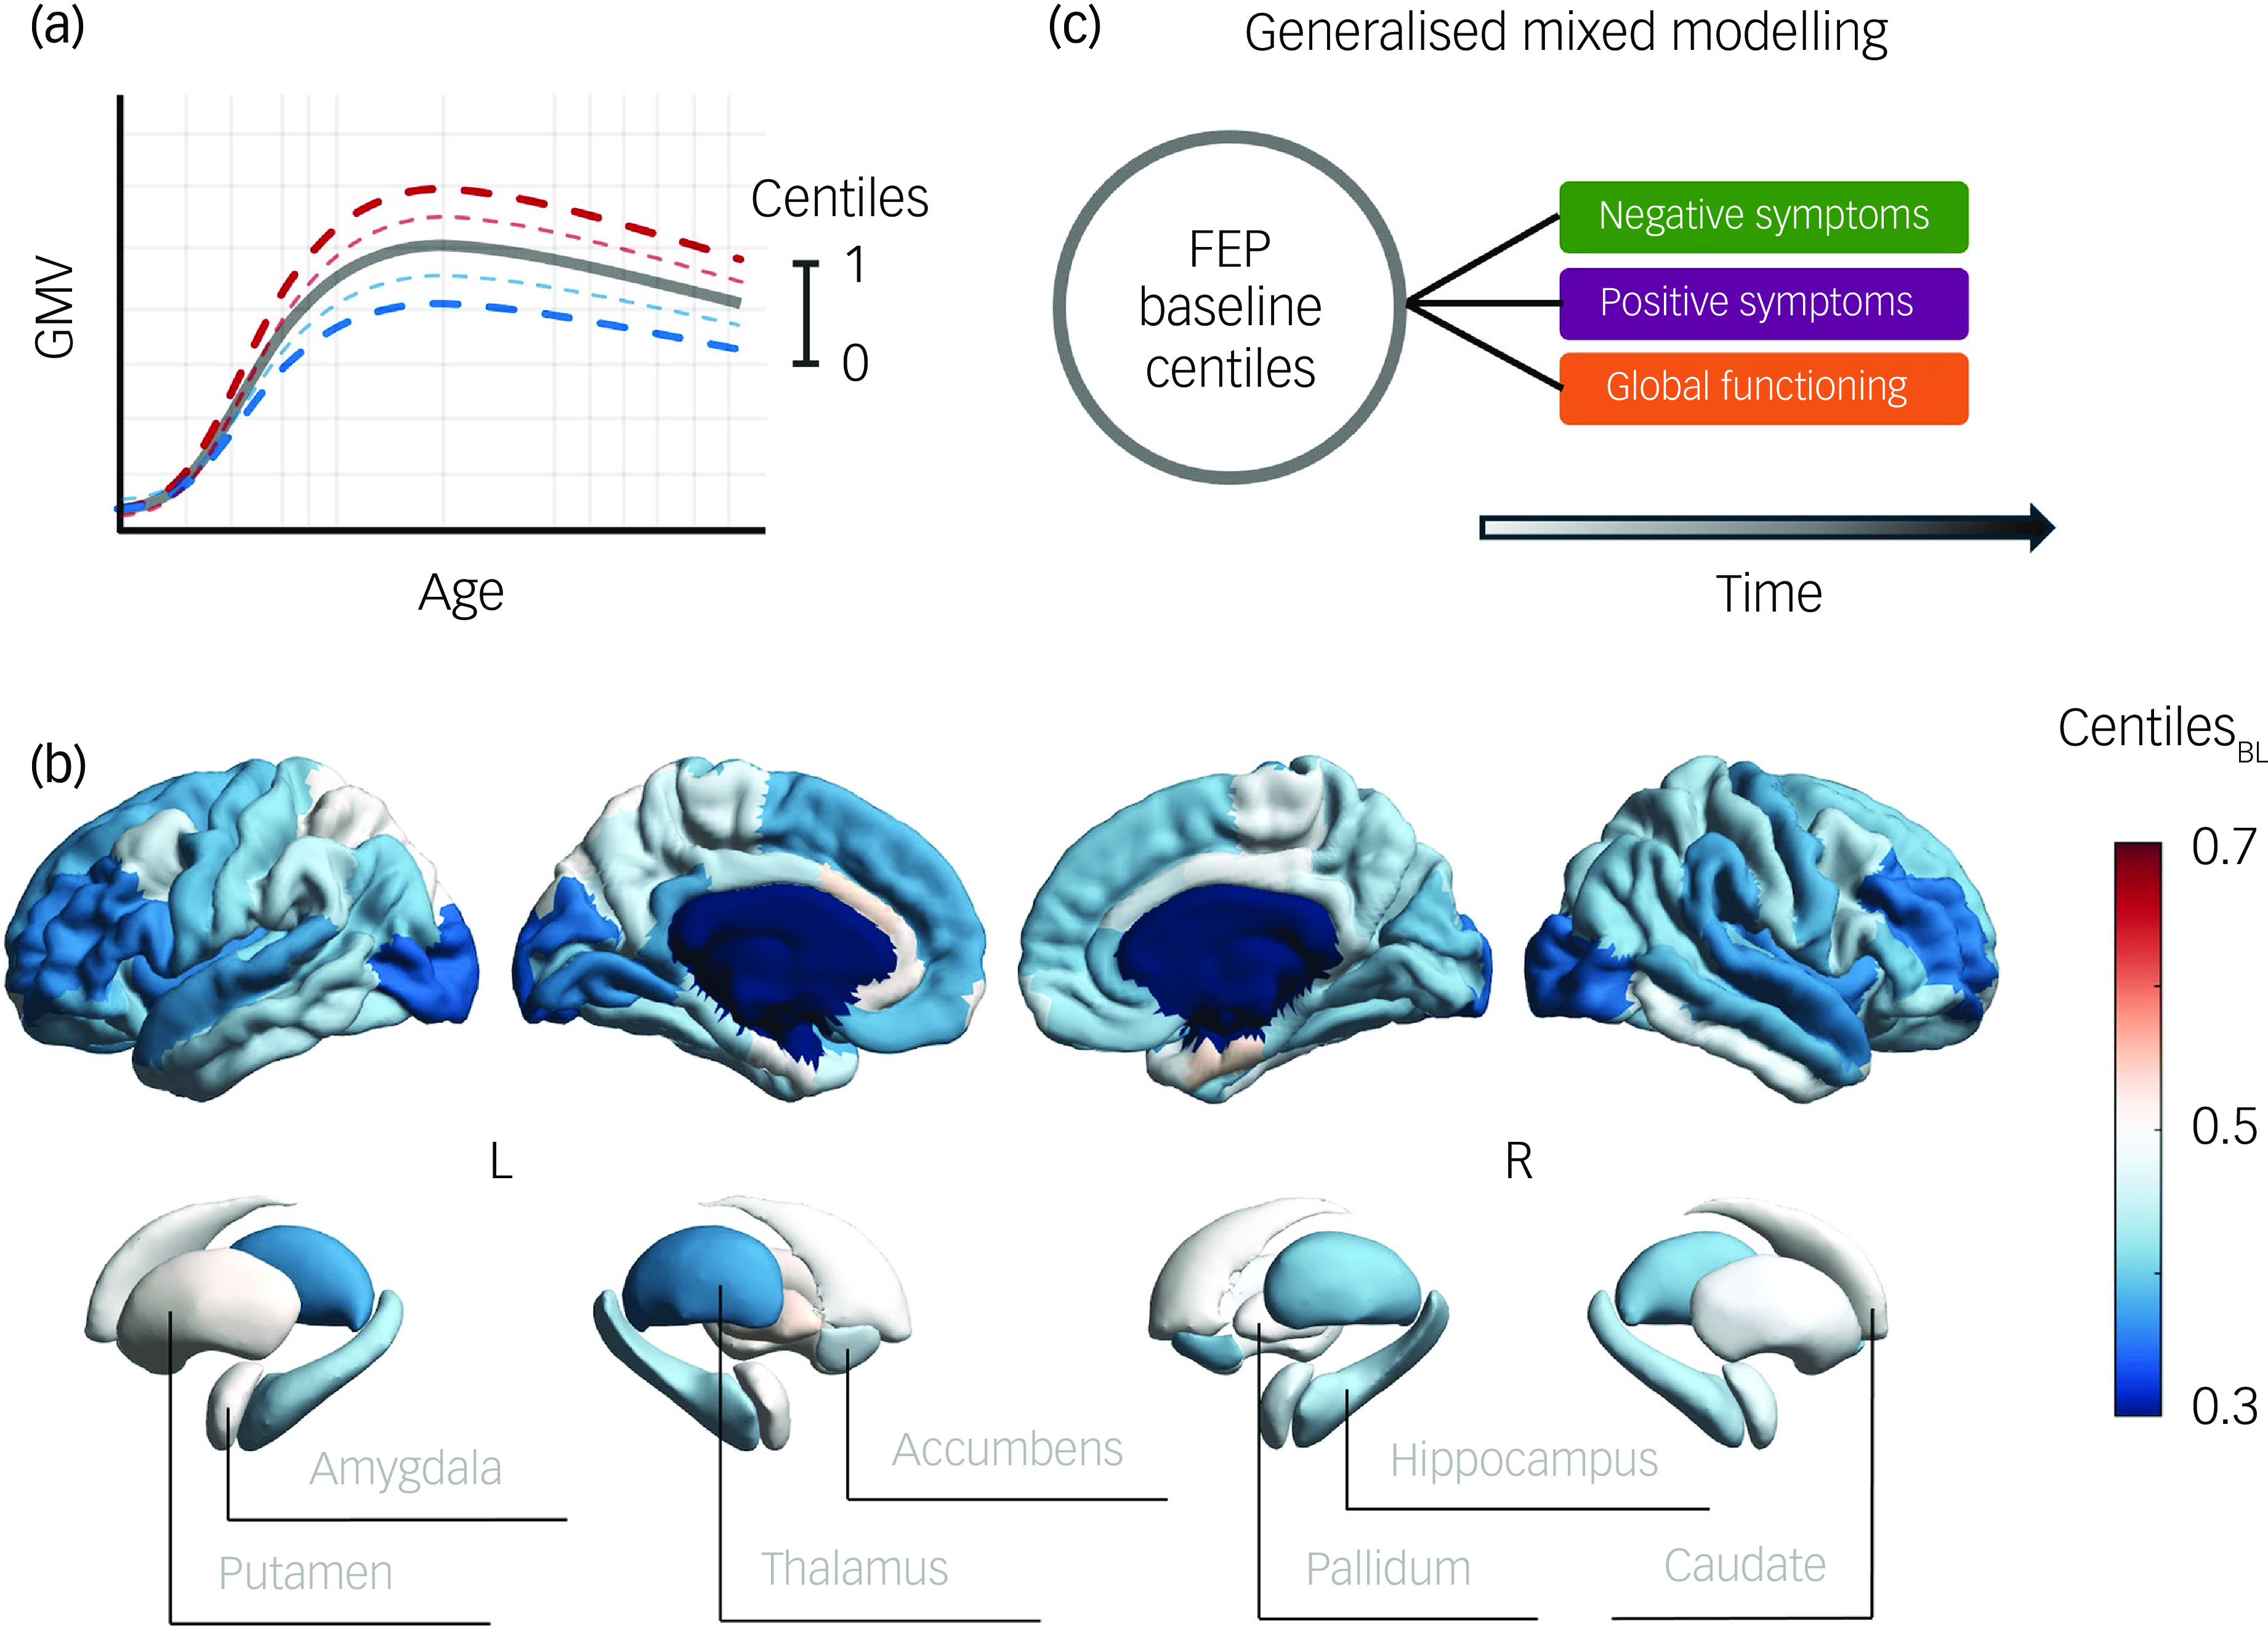
Fig. 1 (a) Illustration of centile-based normative modelling, showing the ranges that define neurotypical brain grey matter volume (GMV) progression with age. Reference Bethlehem, Seidlitz, White, Vogel, Anderson and Adamson10 (b) GMV centiles averaged across participants at baseline (BL). (c) Schematic representation of the study pipeline exploring the associations between baseline first-episode psychosis (FEP) centiles and symptom and functional outcomes over time.
Longitudinal assessment of symptom severity and functioning
Assessments of symptom and functional outcomes were conducted over time by experienced clinicians at four time points (baseline, 1 year, 3 years and 8–15 years), with final assessment extending up to 15 years. Symptom severity was assessed using the Scale for the Assessment of Negative Symptoms (SANS) and the Scale for the Assessment of Positive Symptoms (SAPS). Reference Andreasen19,Reference Andreasen20 Functioning was assessed using the Global Assessment of Functioning (GAF) scale (Axis V of DSM-IV), a 0–100 rating system that evaluates overall psychological, social and occupational functioning.
Statistical analyses
We used mixed modelling to evaluate the impact of cortical and subcortical baseline centiles on symptom and functional trajectories over time (Fig. 1c). We opted for a generalised mixed model with a Poisson distribution rather than a linear mixed model (LMM) for two main reasons: (a) the dependent variables (symptoms and functioning) exhibited exponential distributions (see Supplementary Materials, Supplementary Fig. 2); and (b) symptom and functioning scores are discrete or count data, which are more accurately modelled using a Poisson distribution. To ensure uniformity, all independent variables were z-scored prior to regression analysis. Only participants with at least two assessments of SAPS, SANS and GAF during the follow-up were included in the mixed modelling analyses.
The first model considered separately the 82 regional GMV centiles at FEP baseline (68 cortical regions and 14 subcortical regions), which were specified as follows:
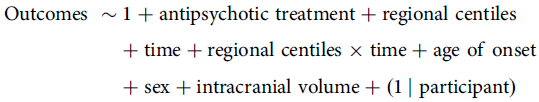 \[\begin{gathered}{\text{Outcomes}}\;\sim1 + {\text{antipsychotic}}\;{\text{treatment}} + {\text{regional}}\;{\text{centiles}} \hfill \\ \,\,\,\,\,\,\,\,\,\,\,\,\,\,\,\,\,\,\,\,\,\,\,\,\,\,\,\,\,\,\,\,\,\,\,\,+ {\text{time}} + {\text{regional}}\;{\text{centiles}} \times {\text{time}} + {\text{age}}\;{\text{of}}\;{\text{onset}} \hfill \\\,\,\,\,\,\,\,\,\,\,\,\,\,\,\,\,\,\,\,\,\,\,\,\,\,\,\,\,\,\,\,\,\,+ {\text{sex}} + {\text{intracranial}}\;{\text{volume}} + (1{\mkern 1mu} \;|{\text{participant}}) \hfill \\
\end{gathered} \]
\[\begin{gathered}{\text{Outcomes}}\;\sim1 + {\text{antipsychotic}}\;{\text{treatment}} + {\text{regional}}\;{\text{centiles}} \hfill \\ \,\,\,\,\,\,\,\,\,\,\,\,\,\,\,\,\,\,\,\,\,\,\,\,\,\,\,\,\,\,\,\,\,\,\,\,+ {\text{time}} + {\text{regional}}\;{\text{centiles}} \times {\text{time}} + {\text{age}}\;{\text{of}}\;{\text{onset}} \hfill \\\,\,\,\,\,\,\,\,\,\,\,\,\,\,\,\,\,\,\,\,\,\,\,\,\,\,\,\,\,\,\,\,\,+ {\text{sex}} + {\text{intracranial}}\;{\text{volume}} + (1{\mkern 1mu} \;|{\text{participant}}) \hfill \\
\end{gathered} \]
The second model considered the total cortical and subcortical GMV centiles at FEP baseline, which were specified as follows:
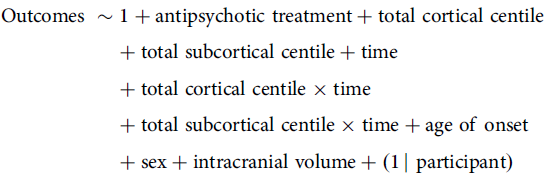 \[\begin{gathered}{\text{Outcomes}}\;\sim1 + {\text{antipsychotic}}\;{\text{treatment}} + {\text{total}}\;{\text{cortical}}\;{\text{centile}} \hfill \\\!\!\!+ {\text{total}}\;{\text{subcortical}}\;{\text{centile}} + {\text{time}} \hfill \\\!\!\!\!\!\!\!\!\!\!\!\!+ {\text{total}}\;{\text{cortical}}\;{\text{centile}} \times {\text{time}} \hfill \\\,\,\,\,\,\,\,\,\,\,\,\,\,\,\,\,\,\,\,\,\,\,\,\,\,\,\,\,\,\,\,\,\,\,\,+ {\text{total}}\;{\text{subcortical}}\;{\text{centile}} \times {\text{time}} + {\text{age}}\;{\text{of}}\;{\text{onset}} \hfill \\
\,\,\,\,\,\,\,\,\,\,\,\,\,\,\,\,\,\,\,\,\,\,\,\,\,\,\,\,\,\,\,\,+ {\text{sex}} + {\text{intracranial}}\;{\text{volume}} + (1\;{\mkern 1mu} |\;{\text{participant}}) \hfill \\\end{gathered} \]
\[\begin{gathered}{\text{Outcomes}}\;\sim1 + {\text{antipsychotic}}\;{\text{treatment}} + {\text{total}}\;{\text{cortical}}\;{\text{centile}} \hfill \\\!\!\!+ {\text{total}}\;{\text{subcortical}}\;{\text{centile}} + {\text{time}} \hfill \\\!\!\!\!\!\!\!\!\!\!\!\!+ {\text{total}}\;{\text{cortical}}\;{\text{centile}} \times {\text{time}} \hfill \\\,\,\,\,\,\,\,\,\,\,\,\,\,\,\,\,\,\,\,\,\,\,\,\,\,\,\,\,\,\,\,\,\,\,\,+ {\text{total}}\;{\text{subcortical}}\;{\text{centile}} \times {\text{time}} + {\text{age}}\;{\text{of}}\;{\text{onset}} \hfill \\
\,\,\,\,\,\,\,\,\,\,\,\,\,\,\,\,\,\,\,\,\,\,\,\,\,\,\,\,\,\,\,\,+ {\text{sex}} + {\text{intracranial}}\;{\text{volume}} + (1\;{\mkern 1mu} |\;{\text{participant}}) \hfill \\\end{gathered} \]
In both models, Outcomes encompasses separate dependent variables for total scores on SANS and SAPS, their specific symptoms and the GAF. Antipsychotic treatment refers to medication levels expressed in chlorpromazine (CPZ) equivalents. Reference Woods21 Time measures the duration since the first contact with Mental Health Services following FEP. Age of onset refers to the participant’s age at the time of first contact with Mental Health Services following FEP. Sex is treated as a binary variable (male 1). Intracranial volume (Etiv) represents the residual values of the estimated total intracranial volume after adjusting for age and sex effects. Finally, the term 1 | participant denotes a random intercept for each participant.
To test for the potential impact of non-random attrition on our findings, we applied t-tests (or a non-parametric equivalent test when appropriate) to assess differences in total GMV baseline centiles, symptoms and functioning. Differences were computed between patients who completed at least two symptom and functional assessments and those who dropped out after the initial baseline assessment.
In all instances where multiple comparison correction was required, false discovery rate (FDR) was controlled using the Benjamini–Hochberg procedure.
Results
Of the initial 352 FEP patients included, only those with at least two outcome assessments during the follow-up were analysed. This resulted in a final sample of 241 patients for clinical assessment (SANS and SAPS) and 244 for functioning assessment (GAF). Detailed information about sociodemographic, clinical and functional characteristics of the final sample is shown in Supplementary Material, Supplementary Table 1. There were no significant differences in GMV centiles, clinical or sociodemographic measures at baseline between the final sample (patients with ≥2 assessments) and those who dropped out after the initial assessment (all P-values > 0.146; see Supplementary Material, Supplementary Table 2). Similarly, no significant differences in GMV centiles were found at baseline between patients diagnosed with schizophrenia and those diagnosed with other schizophrenia spectrum disorders (see Supplementary Material, Supplementary Fig. 3).
Regional baseline centiles and outcome trajectories
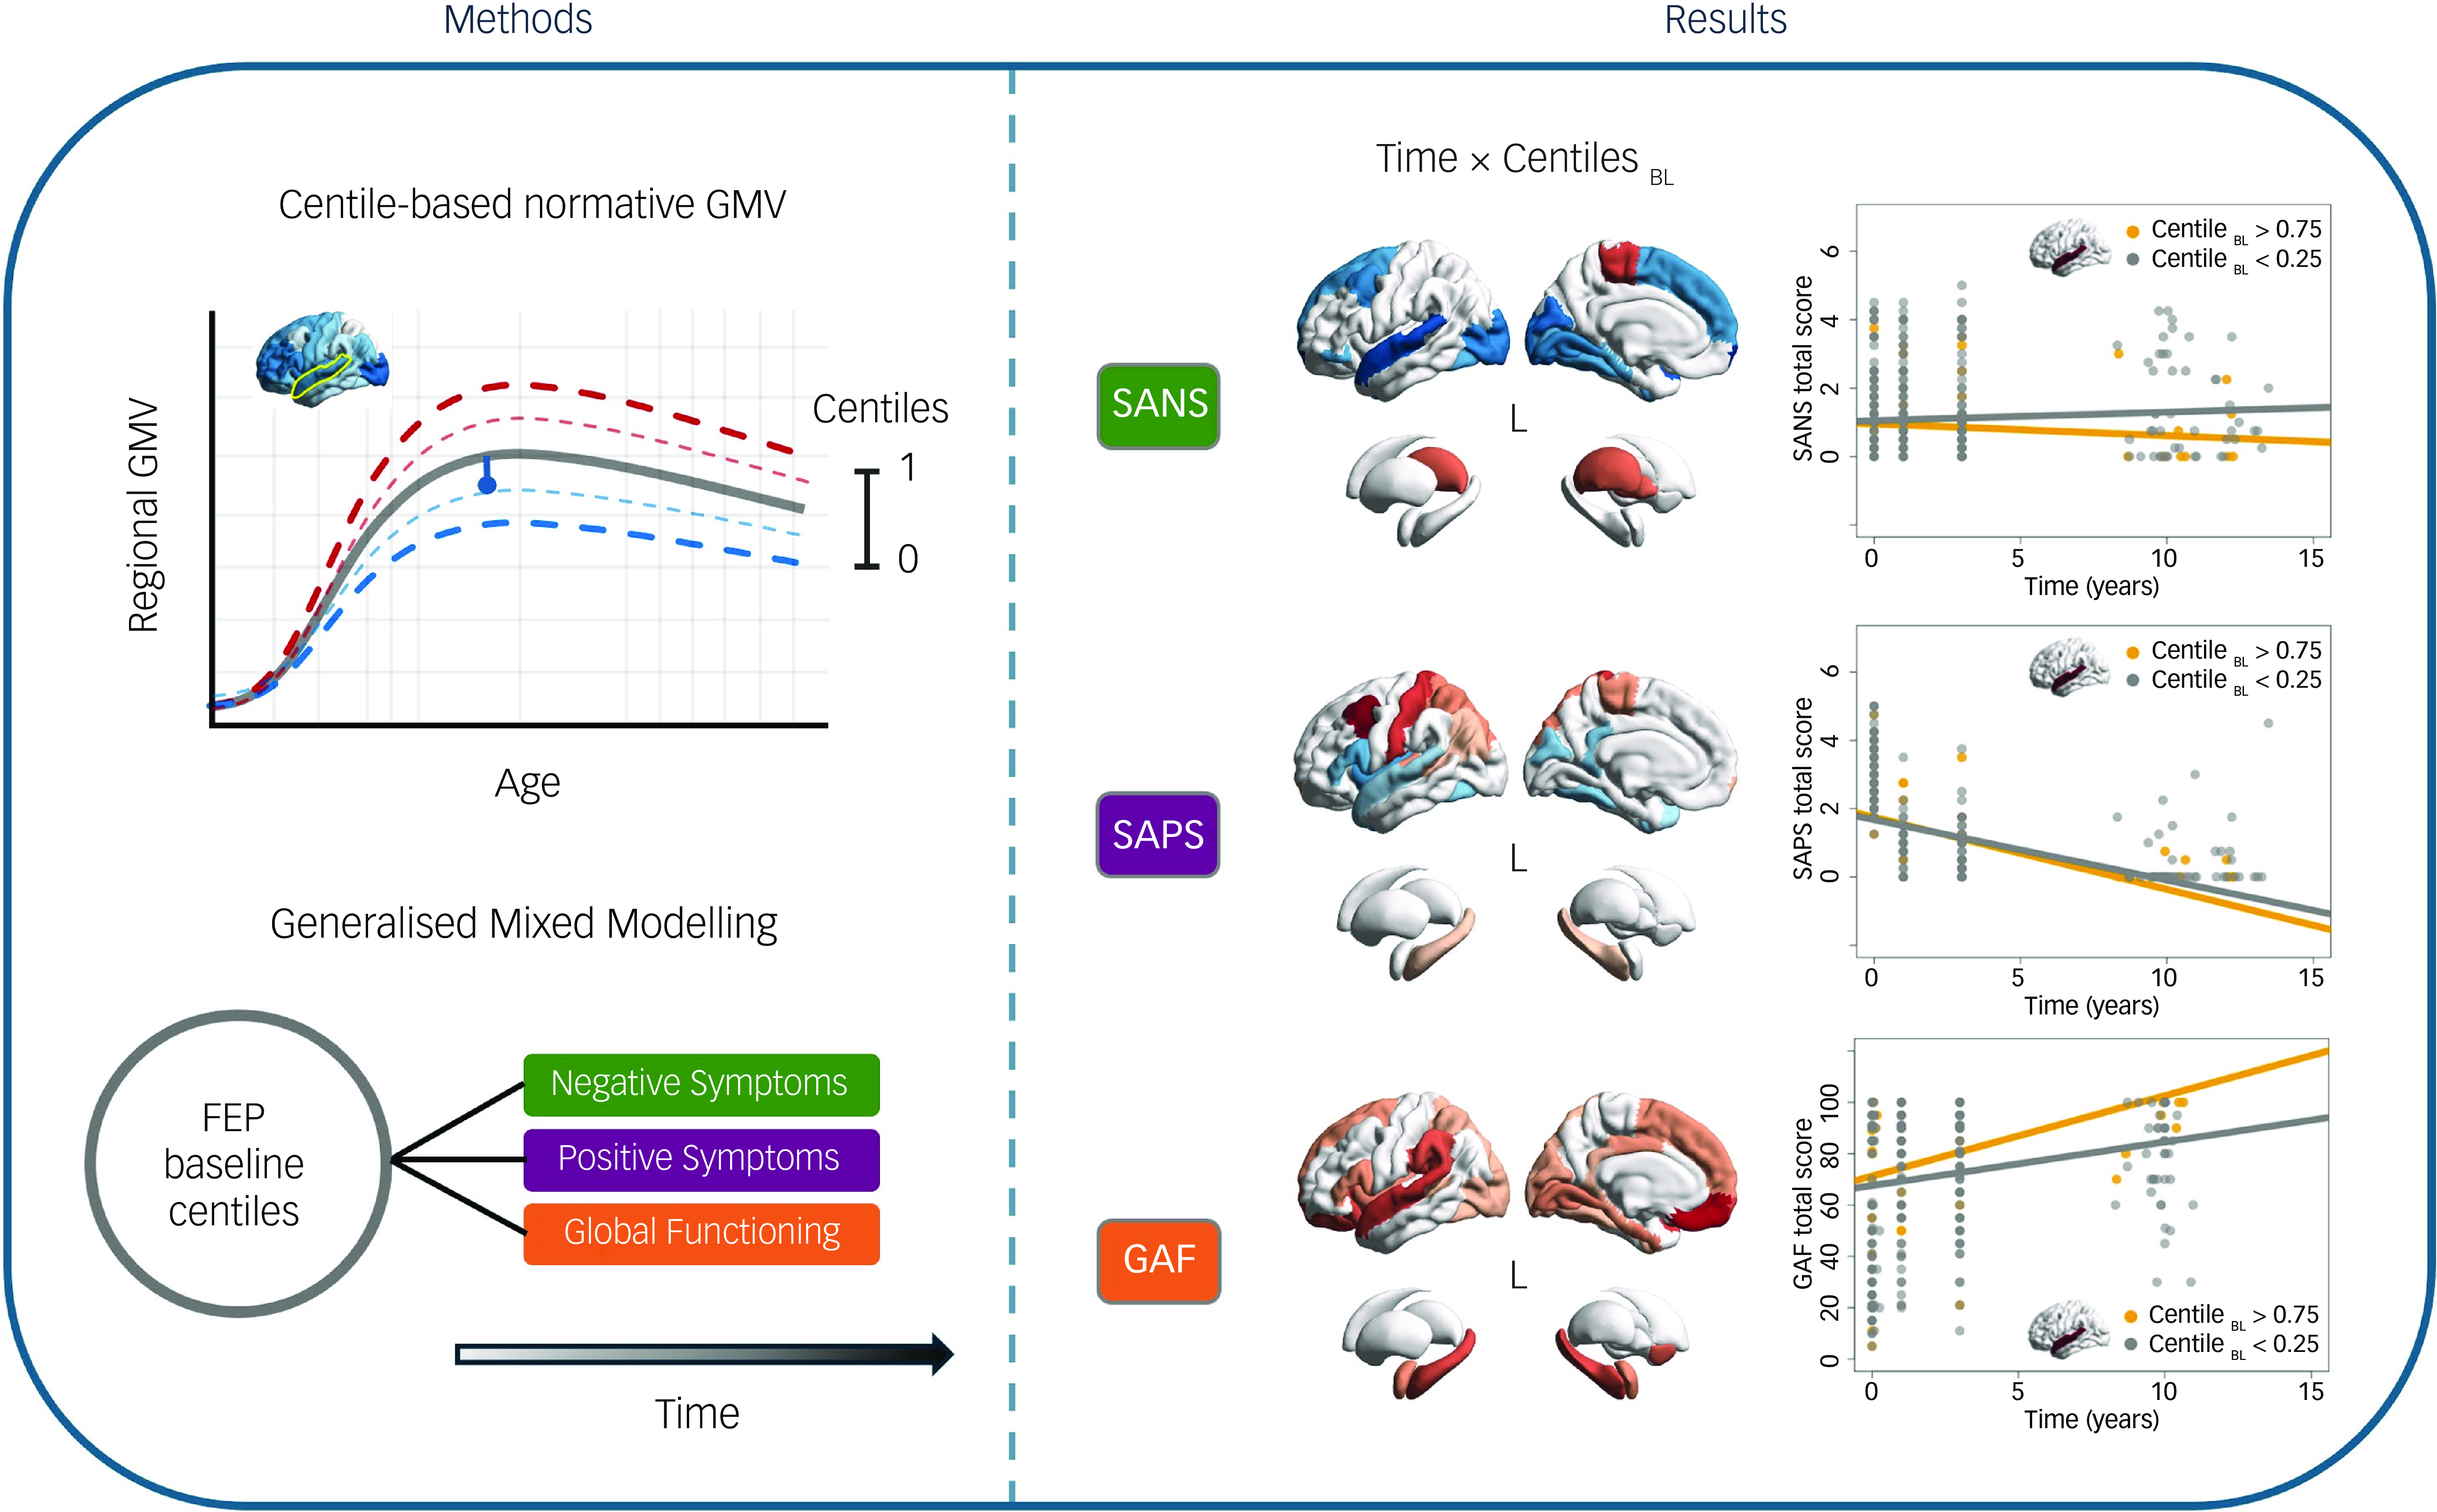
Our first generalised mixed model analysis examined the interaction effects between regional centiles at FEP and time on SANS, SAPS and GAF total scores (Fig. 2a), while accounting for the contribution of clinical and sociodemographic covariates. For information on the effects of regional centiles alone, please refer to Supplementary Materials, Supplementary Fig. 4.
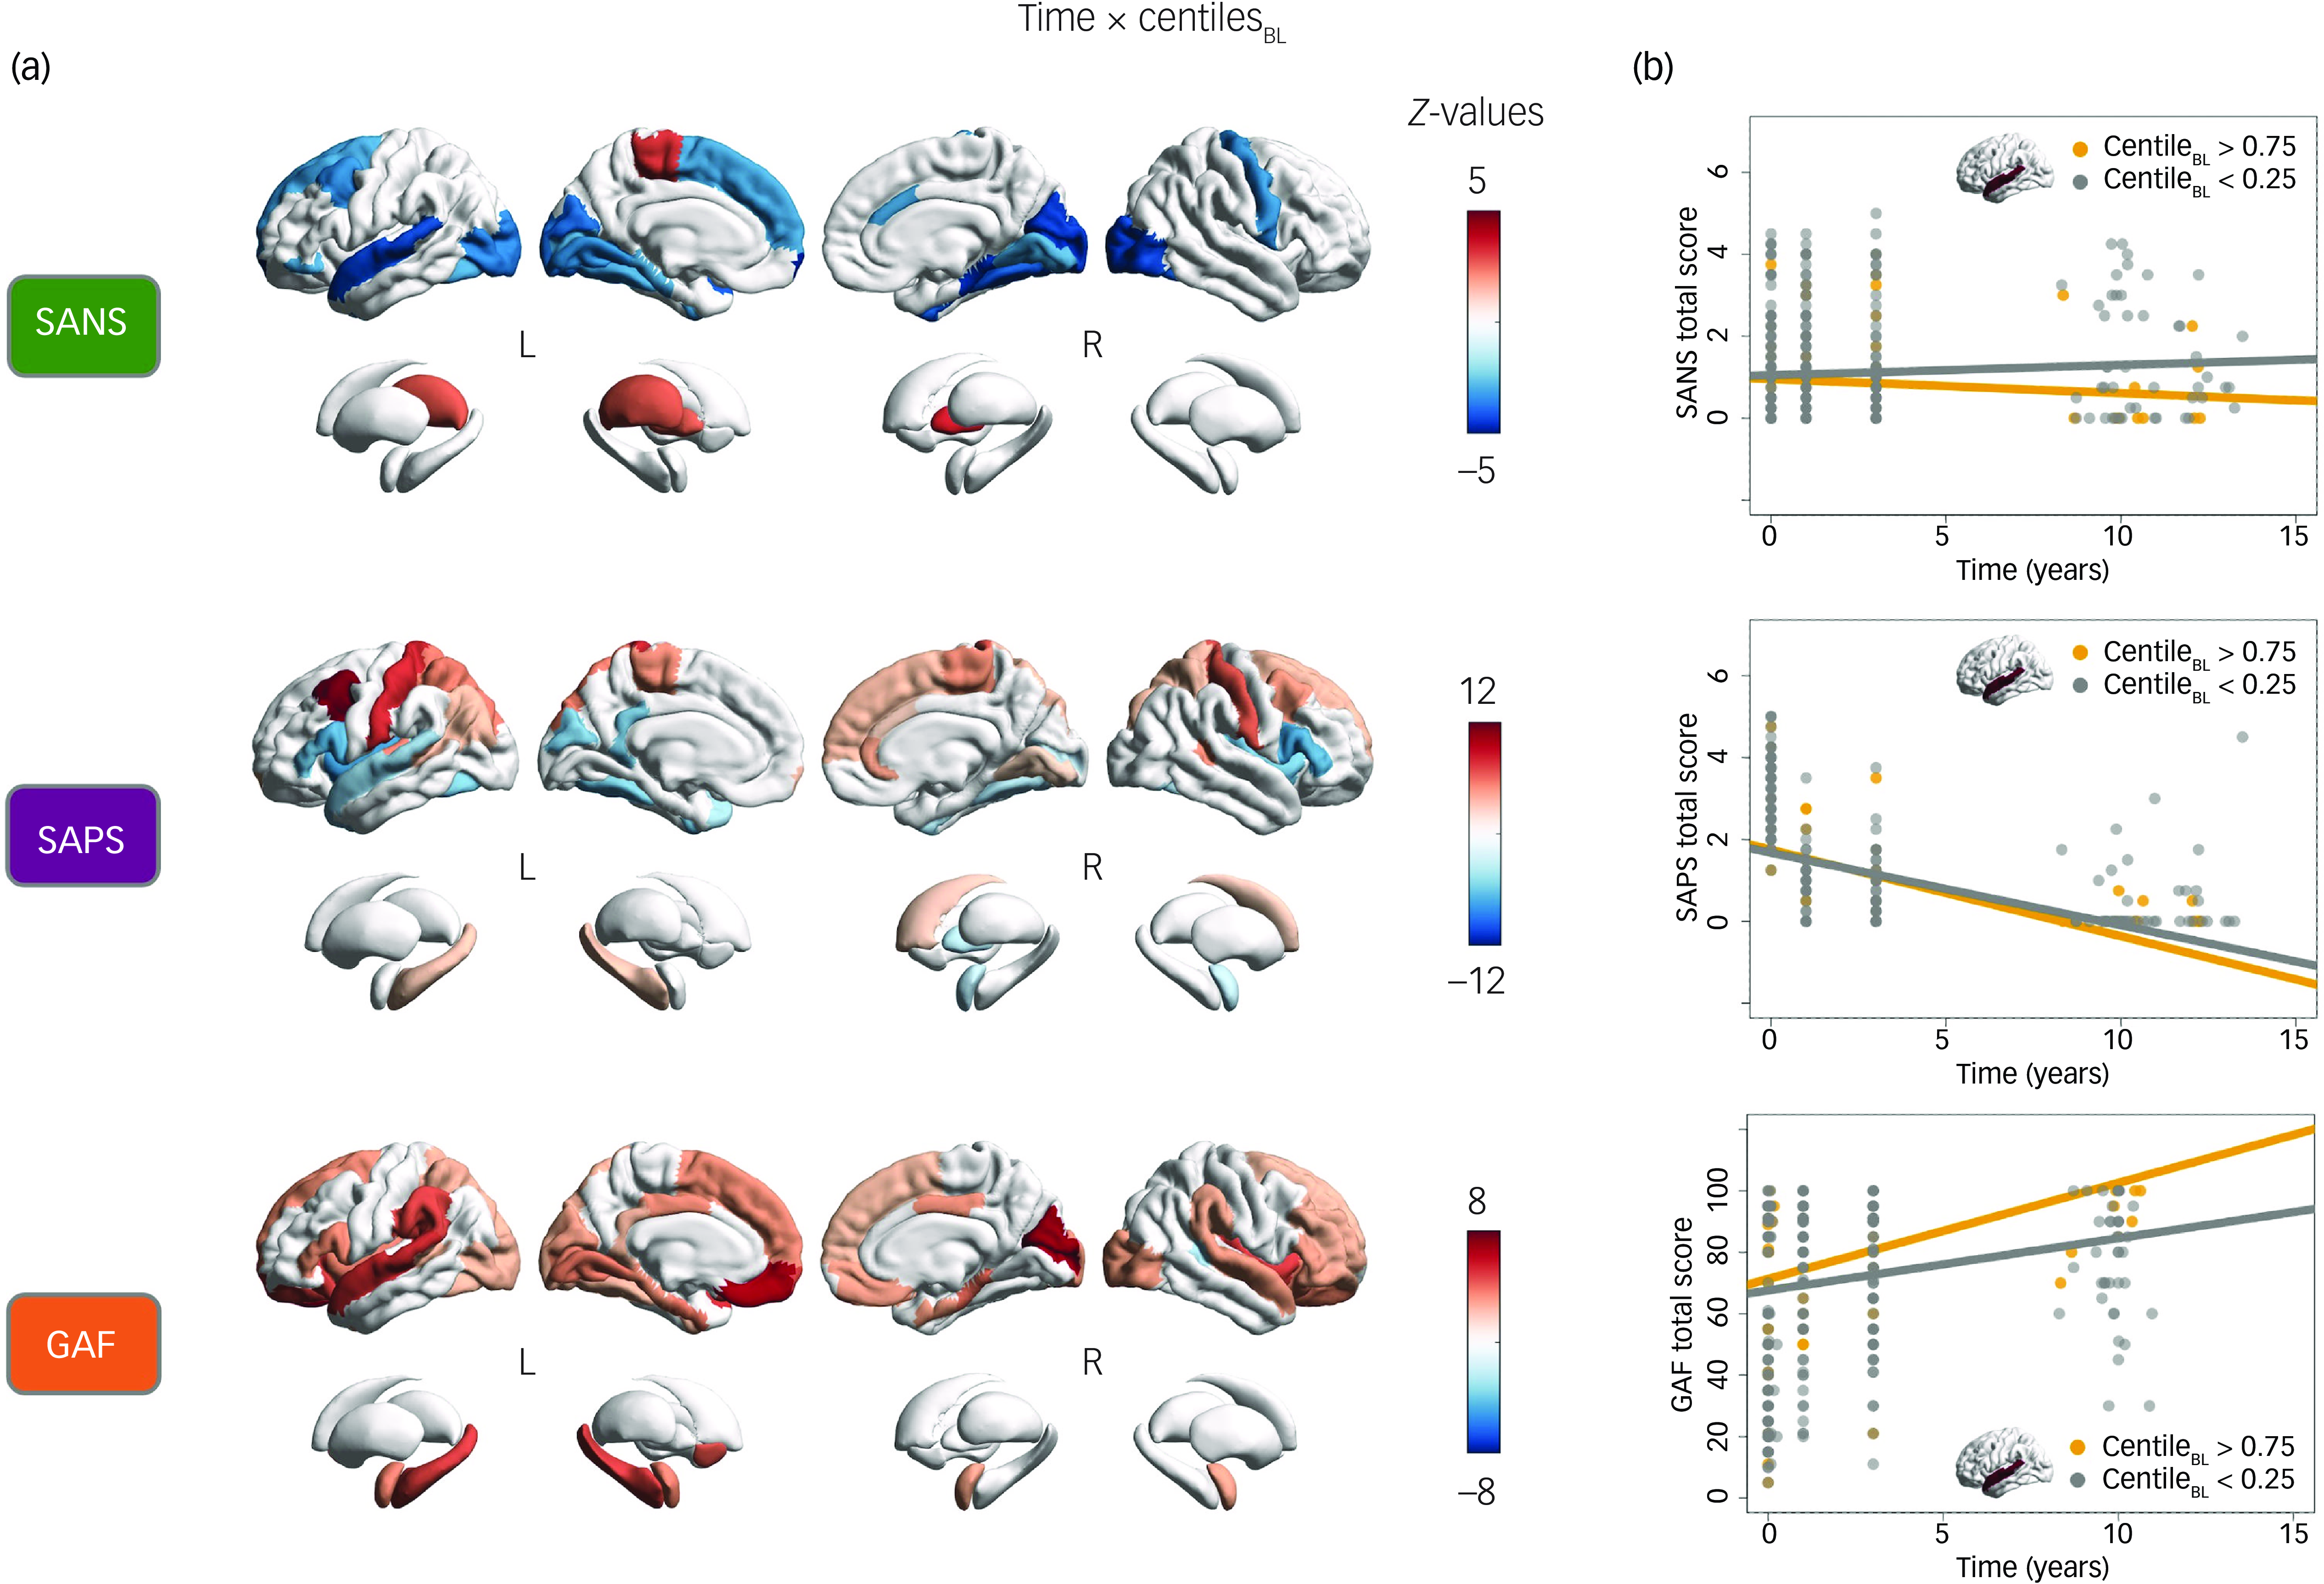
Fig. 2 (a) Cortical and subcortical regional interactions between time and baseline (BL) centiles at FEP for SANS, SAPS and GAF total scores. Statistically significant values (P < 0.05, false discovery rate-corrected) are represented by coloured regions, while non-significant regions are shown in white. (b) Graphical representation of interaction effects between time and SANS, SAPS and GAF total scores, using the left superior temporal cortex centile to divide the sample into two groups: high centile (>0.75, yellow) and low centile (<0.25, grey). The graphs show the evolution of SANS, SAPS and GAF scores over the years, with regression lines for each group. FEP, first-line psychosis; SANS, Scale for the Assessment of Negative Symptoms; SAPS, Scale for the Assessment of Positive Symptoms; GAF, Global Assessment of Functioning scale.
The regional analysis of SANS total scores revealed significant negative interactions between time and centiles across various cortical regions that were particularly prominent in the left superior temporal cortex (z = −4.10, P < 0.001), frontal pole (z = −4.74, P < 0.001), right cuneus (z = −4.34, P < 0.001), lateral occipital (z = −4.19, P < 0.001), parahippocampal (z = −4.47, P < 0.001) and pericalcarine (z = −4.51, P < 0.001). This indicates that higher centiles in these regions at FEP are associated with a more favourable progression of negative symptoms over the long term. In contrast, positive interactions were observed in subcortical regions including the bilateral pallidum (left, z = 2.65, P = 0.045; right, z = 3.45, P = 0.006) and left thalamus (z = 2.71, P = 0.040), revealing that higher centiles in these regions at FEP are linked to a worsening progression of negative symptoms over time.
The regional analysis of SAPS total scores showed significant interactions between time and centiles in various cortical regions that were both positive: left caudal middle frontal (z = 11.23, P < 0.001), superior parietal (z = 5.40, P < 0.001), hippocampus (z = 3.05, P = 0.018), bilateral postcentral (left, z = 7.86; right, z = 6.55, P < 0.001), paracentral (left, z = 4.81; right, z = 4.89, P < 0.001) and right caudate (z = 2.77, P = 0.035); and negative: left superior temporal (z = −4.12, P < 0.001), bilateral insula (left, z = −6.97; right, z = −5.52, P < 0.001), pars triangularis (left, z = −5.30; right, z = −6.10, P < 0.001) and pars opercularis (left, z = −6.24; right, z = −6.65, P < 0.001).
The regional analysis of functioning (GAF total score) revealed positive interactions between time and centiles across widespread cortical and subcortical regions, with notable impacts on the left superior temporal (z = 5.12, P < 0.001), supramarginal (z = 4.63, P < 0.001), medial orbitofrontal (z = 6.53, P < 0.001), hippocampus (z = 4.74, P < 0.001), right cuneus (z = 6.98, P < 0.001) and pericalcarine regions (z = 6.61, P < 0.001). This indicates that higher centiles in these regions at FEP are associated with greater improvement in functioning over time.
Graphical representations of these time–outcome interactions are depicted in Fig. 2b. These illustrate how having a high (>0.75) or low (<0.25) regional centile in a representative region, such as the left superior temporal cortex, at FEP impacts the temporal progression of the clinical variables (SANS, SAPS, GAF). For a complete description of model outcomes, please refer to Supplementary Data 1.
Regional baseline centiles and outcomes trajectories across specific symptoms
As a subsequent exploration, we analysed the interaction effects between time and regional baseline centiles on specific positive and negative symptoms, as depicted in Fig. 3. Regarding the interaction results for specific negative symptoms, significant negative effects were observed in temporal, inferior frontal, precentral and occipital cortical regions for alogia, inattention and avolition severity, but not for anhedonia or affective flattening. In contrast, the subcortical results revealed a positive interaction for anhedonia in the left pallidum and for avolition in the right pallidum, while a negative interaction was found for inattention in the right amygdala (all |z| > 2.70, all P < 0.041). This suggests that higher centiles at FEP in specific cortical regions are associated with a more favourable progression of negative symptoms, whereas higher centiles in the pallidum generally lead to a worsening progression of negative symptoms over time.
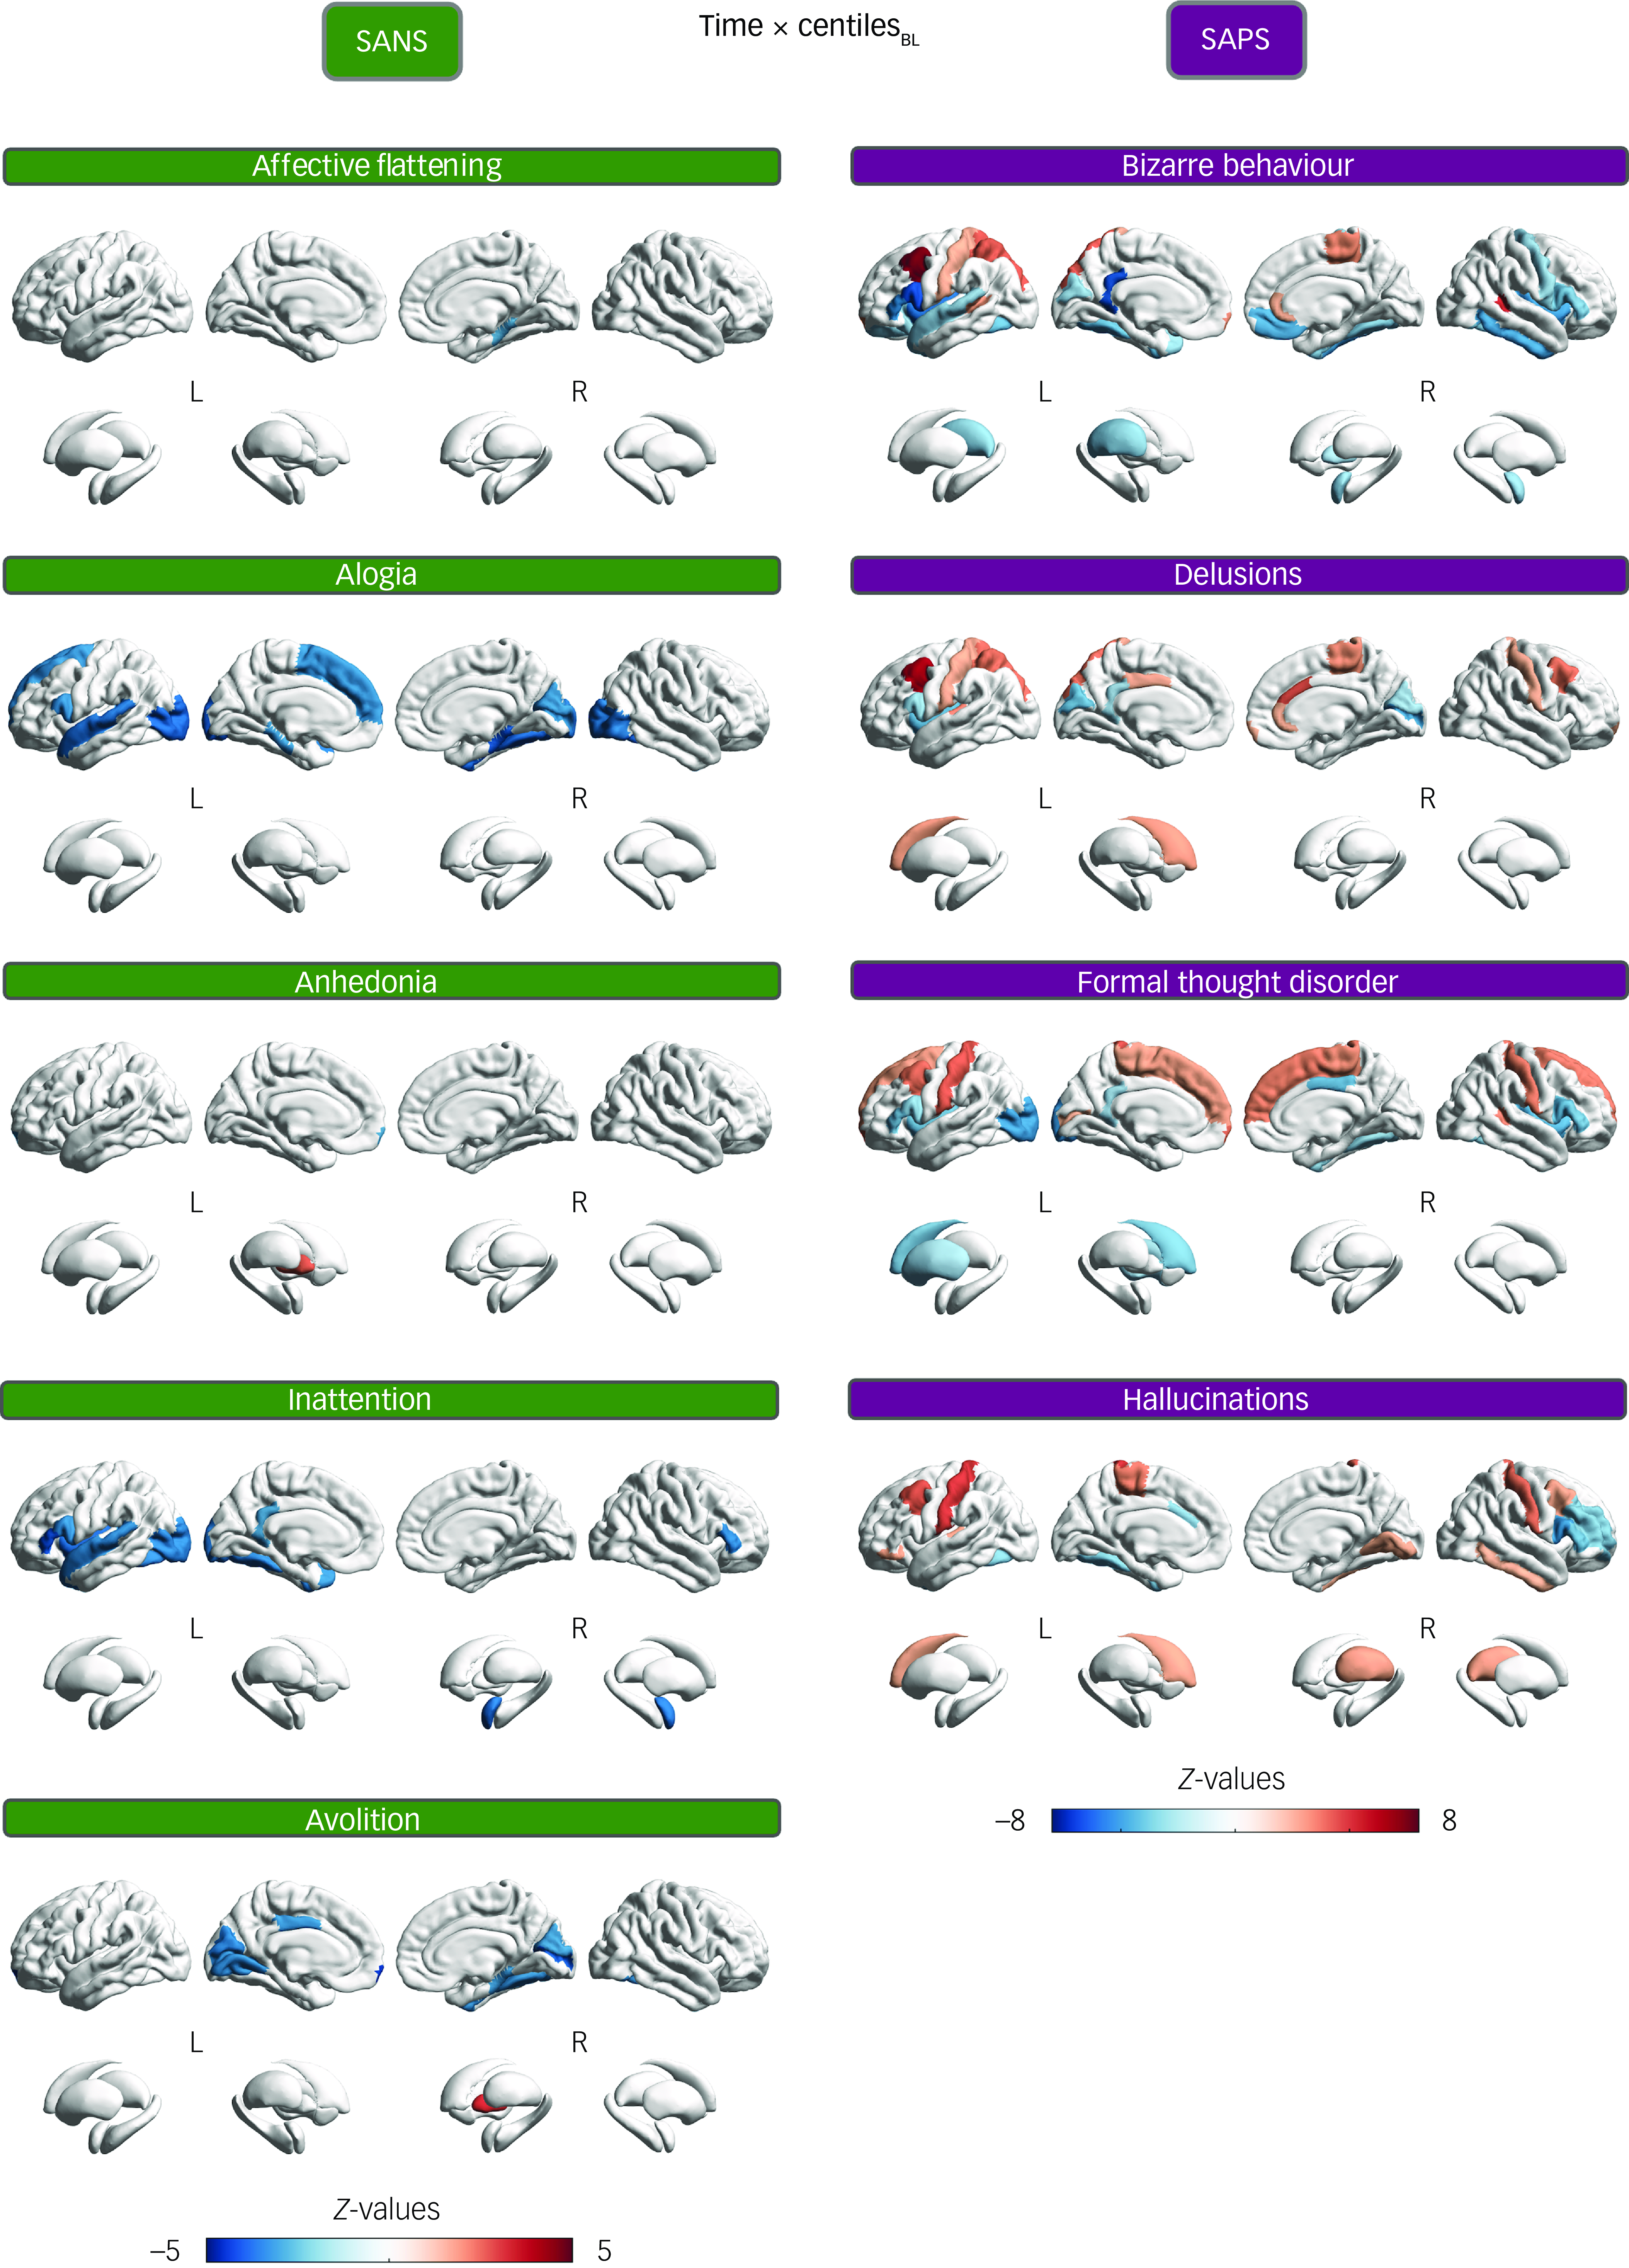
Fig. 3 Cortical and subcortical regional interaction effects between time and baseline (BL) centiles at first-episode psychosis on specific negative (SANS) and positive (SAPS) symptoms. Statistically significant values (P < 0.05, false discovery rate-corrected) are represented by coloured regions, while non-significant regions are in white. SANS, Scale for the Assessment of Negative Symptoms; SAPS, Scale for the Assessment of Positive Symptoms.
Concerning the interaction results for specific positive symptoms, significant positive effects were observed in various cortical regions, particularly the left caudal middle frontal region and, to a lesser extent, the bilateral postcentral and paracentral regions, for all positive symptoms (bizarre behaviour, delusions, formal thought disorder and hallucinations). Negative interaction effects, however, were found mainly in the insula, pars opercularis, pars triangularis and occipital regions. On the other hand, the subcortical results revealed positive interactions for delusions and hallucinations, and negative interactions for formal thought disorder and bizarre behaviour (all |z| > 2.60, all P < 0.049; for complete model results, please refer to Supplementary Data 2).
Sociodemographic and clinical predictors of symptom and functional outcomes
In our final exploration, we analysed the contribution of sociodemographic and clinical factors to the severity of symptoms and functional outcomes over time in the study sample, as well as the impact of total cortical and subcortical centiles at baseline and their interaction with time (Fig. 4).
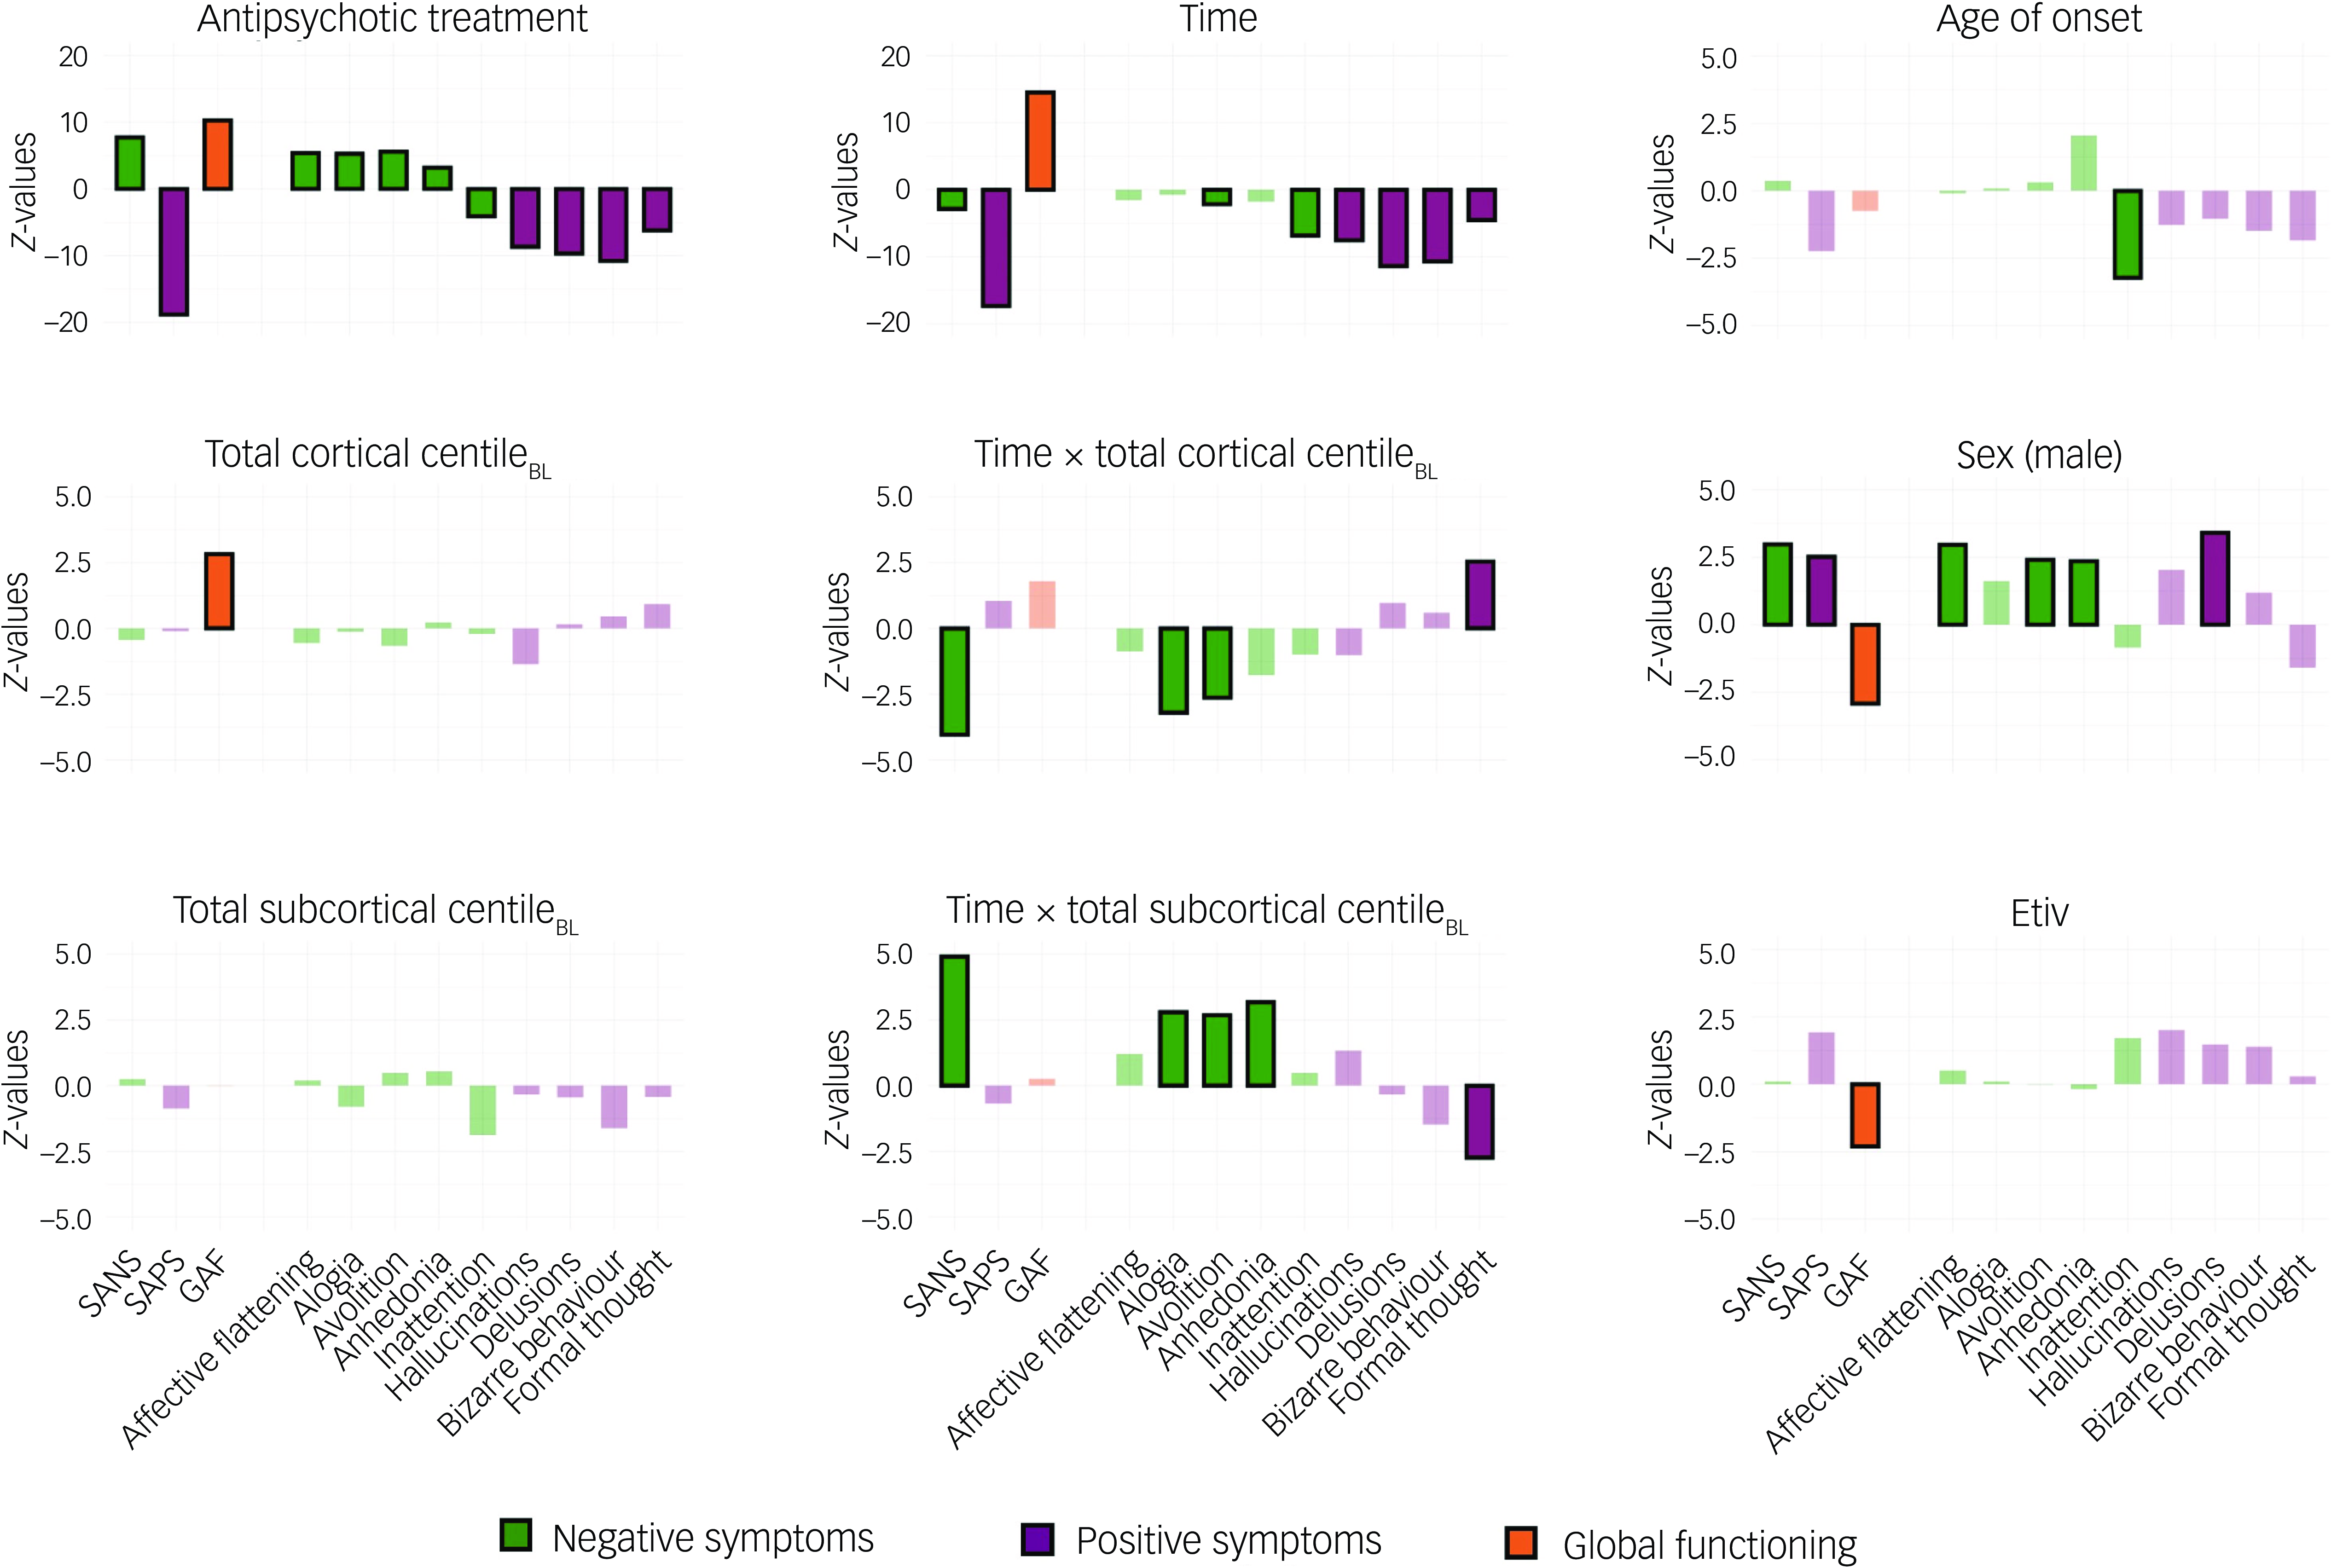
Fig. 4 Z-values of the generalised mixed model for SANS, SAPS and GAF total scores, as well as for SANS and SAPS specific symptoms across the variables of interest. Statistically significant values (P < 0.05, FDR-corrected) are represented by solid-coloured bars, while non-significant values are shown with faded colouring. BL, baseline; SANS, Scale for the Assessment of Negative Symptoms; SAPS, Scale for the Assessment of Positive Symptoms; GAF, Global Assessment of Functioning scale; FDR, false discovery rate.
Age of onset showed a negative association with inattention, indicating that later FEP onset is associated with less attentional impairment. Sex was associated with outcomes, where being male was linked to worse scores on SANS, SAPS and GAF total scores, as well as on affective flattening, avolition, anhedonia and delusions. Antipsychotic treatment, expressed in CPZ equivalents, Reference Woods21 influenced SANS, SAPS and GAF total scores, as well as their specific symptoms. Specifically, it was associated with more severe negative symptoms (except for inattention) but reduced positive symptoms and improved functioning as CPZ equivalents increased. Time was positively associated with GAF and negatively associated with SAPS total score, all positive symptoms and, to a lesser extent, SANS total score, avolition and inattention, demonstrating a generalised improvement over time following a FEP. Total cortical centile at FEP baseline showed a positive association with GAF, indicating that higher total cortical centiles at FEP were linked to better functioning outcomes. In contrast, total subcortical centile at FEP baseline did not show any significant associations with the measured variables. The interaction between time and total cortical centile at baseline showed a negative association with SANS total score, alogia and avolition, as well as a positive association with formal thought disorder. This indicates that higher total cortical centiles at FEP are linked to greater long-term improvement in most negative symptoms and lower long-term improvement in formal thought disorder. Conversely, the interaction between time and total subcortical centile at baseline exhibited the opposite trend, showing a positive association with SANS total score, alogia, avolition and anhedonia, along with a negative association with formal thought disorder (all |z| > 2.17, all P < 0.041; for complete model results, please refer to Supplementary Data 3).
Discussion
In this study, we investigated potential predictors of long-term symptom and functional outcomes in schizophrenia spectrum disorders through brain normative models, along with sociodemographic variables and clinical factors. We found that (a) cortical and subcortical GMV normative deviations at the onset of psychosis modulated the effect of time on both symptom and functional outcomes, and (b) antipsychotic treatment, time and sex were significantly associated with symptom and functional outcomes over time.
The interaction effects between time and centiles suggest that different brain regions contribute distinctively to positive symptoms, negative symptoms and functioning trajectories, underscoring the complexity of the brain macrostructural substrates underlying each of these clinical manifestations. An exception was observed in the left superior temporal region, where lower cortical volume was associated with more severe trajectories across all measured outcomes, extending recent findings relating lower normative volumes in this region with greater negative symptoms. Reference Worker, Berthert, Lawrence, Kia, Arango and Dinga12 The negative association between superior temporal gyrus and positive symptoms, along with the negative associations between certain prefrontal cortex (PFC) regions (e.g. frontal pole, pars orbitalis) and negative symptoms, align with findings from ENIGMA studies. Reference Thompson, Jahanshad, Ching, Salminen, Thomopoulos and Bright22 Additionally, lower volume in Broca’s area (Desikan–Killiany: pars opercularis, pars triangularis), recently proposed as a potential neuropathological origin of schizophrenia, Reference Jiang, Palaniyappan, Luo, Chang, Zhang and Tang23,Reference Jiang, Wang, Zhou, Palaniyappan, Luo and Ji24 was linked to worsening progression in both positive symptoms and functioning, as well as some negative symptoms, further supporting the potential role of brain regions involved in language circuitry in the prognosis of psychosis. Reference Jiang, Wang, Zhou, Palaniyappan, Luo and Ji24
Notably, a significant positive interaction effect for total positive symptoms was observed in the left caudal middle frontal region, also known as the dorsolateral PFC (DLPFC), suggesting that higher cortical volume in this region at the onset of psychosis might be associated with a less favourable progression of positive symptoms over time. This finding contrasts with the thinner volume typically reported among schizophrenia patients in this region, Reference Shepherd, Laurens, Matheson, Carr and Green25 and its association with cognitive dysfunction Reference Smucny, Dienel, Lewis and Carter26 and poorer symptomatic and functional outcomes. Reference Dazzan, Arango, Fleischacker, Galderisi, Glenthoj and Leucht7 However, considering that similar findings have previously been reported, Reference Volpe, Mucci, Quarantelli, Galderisi and Maj27 and that one of the most observed effects of antipsychotic treatment is the normalisation of prefrontal activation, Reference Kani, Shinn, Lewandowski and Öngür28 this result may suggest that patients with lower volume in the DLPFC might benefit to a greater extent from antipsychotic treatments that ameliorate DLPFC hypofunctionality associated with positive symptomatology. Further research is needed to elucidate this question.
Regarding the impact of normative subcortical volumetric deviations on outcomes, recent studies in psychosis have found that smaller limbic volumes and larger basal ganglia are related to worse outcomes. Reference Remiszewski, Bryant, Rutherford, Marquand, Nelson and Askar9,Reference Okada, Fukunaga, Miura, Nemoto, Matsumoto and Hashimoto29 Although the interaction effects in our subcortical results were highly heterogeneous, they still aligned with some of these findings. Specifically, a higher volumetric centile in the caudate region was linked to worse progression of positive symptoms, while a lower centile in the amygdala was associated with less favourable trajectories for positive symptoms and functioning.
A detailed analysis of regional interaction effects between centiles and time for specific positive and negative symptoms allowed for a more nuanced clinical characterisation of the observed regional effects. Specifically, the association between lower centiles in the left superior temporal region and worsening trajectories of negative symptoms over time appeared to be primarily linked to alogia and inattention, two symptoms closely related to language function. These findings, along with consistent results in Broca’s area for the same symptoms, extend previous research reporting dysfunction in cortical language regions as a potential predictor of outcomes in clinical high-risk youths. Reference Sabb, van Erp, Hardt, Dapretto, Caplan and Cannon30 Delusions and hallucinations exhibited a shared positive interaction effect in the left caudate, while interaction effects spanning most positive symptoms were identified in the postcentral gyrus, Broca’s area, fronto-insular region and DLPFC, albeit with distinct signs. These findings suggest that common neurobiological pathways may underlie most positive symptoms at the cortical level, whereas greater neurobiological heterogeneity could characterise different negative symptoms and subcortical regions. Together, these results provide insights into potential neuroanatomical signatures of specific symptom progression, which might contribute to more accurate prognostic assessments and inform targeted preventive interventions.
The observed favourable effect of antipsychotic treatment on positive symptoms and functioning indicates the effectiveness of current treatments. However, this contrasts with their detrimental impact on negative symptomatology, indicating that, while antipsychotic treatment may reduce acute psychotic states and functional impairment, it might also contribute to the intensification of negative symptoms. Whether this symptom accentuation is a primary manifestation of the disorder (primary negative symptom) or a secondary adverse effect of the medication, medical comorbidities or environmental factors (secondary negative symptom) remains a long-standing and elusive discussion in psychiatry, Reference Kirschner, Aleman and Kaiser31,Reference Fervaha, Takeuchi, Lee, Foussias, Fletcher and Agid32 which is beyond the scope of this study. An exception was observed with inattention which, unlike other negative symptoms, showed clinical improvement with antipsychotic treatment. This finding aligns with current consensus statements on negative symptoms, Reference Kirkpatrick, Fenton, Carpenter and Marder33,Reference Marder and Galderisi34 which classify inattention as a cognitive rather than a negative symptom.
The general beneficial impact of time under treatment on positive symptoms and daily functioning following FEP aligns with clinical observations and existing research, Reference Ayesa-Arriola, Ortíz-García de la Foz, Martínez-García, Setién-Suero, Ramírez and Suárez-Pinilla3,Reference Austin, Mors, Budtz-Jørgensen, Secher, Hjorthøj and Bertelsen4,Reference Berthet, Haatveit, Kjelkenes, Worker, Kia and Wolfers13,Reference Zipursky, Reilly and Murray35 challenging the Kraepelinian notion of schizophrenia spectrum disorders as inevitably deteriorating conditions. This view is further contested by recent longitudinal studies on normative brain morphology development, which have found that morphological deviations present at FEP tend to normalise over the long term. Reference Berthet, Haatveit, Kjelkenes, Worker, Kia and Wolfers13 This suggests that, with adequate treatment, the functional prognosis can be favourable in most cases. However, as highlighted by previous research, Reference Catalan, Richter, Salazar de Pablo, Vaquerizo-Serrano, Mancebo and Pedruzo2 a significant proportion of FEP patients still experience incomplete recovery and unfavourable trajectories, underscoring the need to identify clinically relevant predictors to better characterise this heterogeneity. On the other hand, the modest effect of time under treatment on negative symptoms indicates that these symptoms may follow a more stable course than positive symptoms, with minimal improvements over time, which is consistent with previous findings Reference Austin, Mors, Budtz-Jørgensen, Secher, Hjorthøj and Bertelsen4,Reference Correll and Schooler36 and emphasises the pressing need for more targeted pharmacological and psychosocial interventions in this area.
Being male was associated with worse symptom and functional outcomes following a FEP, replicating well-stablished sociodemographic findings. Reference Lang, Kösters, Lang, Becker and Jäger37–Reference Häfner39 Additionally, the subsequent analysis revealed that males had higher rates of delusions, affective flattening, avolition and anhedonia, which may provide valuable information for targeting specific symptoms in this subgroup of patients. However, although younger age at FEP has typically been found to predict poorer outcomes, Reference Lang, Kösters, Lang, Becker and Jäger37,Reference Tandon, Nasrallah, Akbarian, Carpenter, DeLisi and Gaebel38 age of onset did not show a significant association with symptom or functional outcomes in our sample, except for inattention.
While a higher total cortical volumetric centile at FEP was found to predict better overall functioning over several years, no association was observed with negative or positive symptoms, nor between total subcortical centile and functioning. This isolated effect is unexpected given the traditional relationship between functioning and symptomatology, particularly negative symptoms, Reference Best, Law, Pyle and Morrison40 and thus warrants careful consideration. Previous longitudinal research using normative models found that negative deviations in mean cortical thickness were associated with more severe negative symptoms, Reference Worker, Berthert, Lawrence, Kia, Arango and Dinga12 while negative deviations in the volume of various subcortical regions were linked to lower positive symptoms. Reference Remiszewski, Bryant, Rutherford, Marquand, Nelson and Askar9 Although we did not find such direct associations in our sample, we did find interaction effects between time and total centiles, indicating that higher total subcortical centile and lower total cortical centile at FEP promoted a more favourable trajectory of negative symptoms over time. This suggests that total GMV deviations might be a useful general measure for prediction of negative symptoms progression over time.
Strengths and limitations
To our knowledge, this study includes the largest brain normative modelling data-set to date, with over 100 000 participants, alongside a significant final sample size (over 240 patients) and a long follow-up period (over 10 years), conferring both statistical power and clinical relevance to our results. The study extends recent longitudinal research using brain normative modelling in psychosis Reference Remiszewski, Bryant, Rutherford, Marquand, Nelson and Askar9,Reference Worker, Berthert, Lawrence, Kia, Arango and Dinga12–Reference Wolfers, Doan, Kaufmann, Alnæs, Moberget and Agartz14 by investigating previously unexplored factors, including overall functioning and specific positive and negative symptoms. Additionally, a key strength of this study is its focus on outcome trajectories, which have received little attention in longitudinal approaches to neuroimaging predictors compared with overall outcomes (i.e. across all time points). Although the distinction between these two approaches is subtle, it is also of major relevance: the first measures the extent to which the predictor is associated with outcomes across all assessed timepoints, while the second reflects how the predictor modulates the effect of time under treatment on outcomes. We believe this latter approach may be even more clinically informative, as it reveals the expected rate of change over time, rather than the overall outcomes, based on different neuromorphological profiles, which could enable more accurate predictions of treatment efficacy for individual patients.
Some limitations need to be considered. First, the significant drop-out rate at year 10 further increases the risk of attrition bias, which may have affected the reliability of our findings. Second, symptom and functional outcomes were modelled using a limited set of variables, to prevent model overfitting and to facilitate interpretation according to the study’s objectives. However, this approach may have overlooked other variables that could also have influenced the outcomes, such as the duration of untreated psychosis, cognitive functioning, comorbid substance use and premorbid adjustment, among others, which may limit the ability to fully explain outcome trajectories. Third, since all patients were medicated and there was no untreated comparison group due to ethical considerations, we cannot disentangle the effects of medication from the natural course of the disorder. Fourth, antipsychotic treatment was calculated as CPZ equivalent, a method that reduces the number of variables related to medication and the risk of model overfitting but overlooks the individualised impact of specific medications. Fifth, functioning was assessed using a generic scoring system (GAF) that lacks specificity. Future research could benefit from more comprehensive instruments to assess social and occupational functioning. Finally, there is a need for replication in independent samples from diverse populations to enhance generalisability.
Implications
Our findings suggest that deviations from normative GMV maturation at the onset of psychosis may influence long-term clinical and functional trajectories, highlighting the potential of brain developmental normative approaches for early prediction of disorder progression. Additionally, the associations with specific symptoms provide valuable insights that could guide the development of preventive interventions, potentially enabling personalised therapeutic strategies and more efficient use of resources.
Supplementary material
The supplementary material is available online at https://doi.org/10.1192/bjp.2025.105
Data availability
All code and non-clinical data used to perform the analyses can be found at https://github.com/RafaelRomeroGarcia/CentilesPredictorsSCZOutcomes. Data from patients are available upon request.
Acknowledgements
We thank Victor Ortiz for his contribution. Members of the Lifespan Brain Chart Consortium: C. Adamson, S. Adler, A.F. Alexander-Bloch, E. Anagnostou, K.M. Anderson, A. Areces-Gonzalez, D.E. Astle, B. Auyeung, M. Ayub, J.B. Bae, G. Ball, S. Baron-Cohen, R. Beare, S.A. Bedford, V. Benegal, R.A.I. Bethlehem, F. Beyer, J. Blangero, M. Blesa Cábez, J.P. Boardman, M. Borzage, J.F. Bosch-Bayard, N. Bourke, E.T. Bullmore, V.D. Calhoun, M.M. Chakravarty, C. Chen, C. Chertavian, G. Chetelat, Y.S. Chong, A. Corvin, M. Costantino, E. Courchesne, F. Crivello, V.L. Cropley, J. Crosbie, N. Crossley, M. Delarue, R. Delorme, S. Desrivieres, G. Devenyi, M.A. Di Biase, R. Dolan, K.A. Donald, G. Donohoe, L. Dorfschmidt, K. Dunlop, A.D. Edwards, J.T. Elison, C.T. Ellis, J.A. Elman, L. Eyler, D.A. Fair, P.C. Fletcher, P. Fonagy, C.E. Franz, L. Galan-Garcia, A. Gholipour, J. Giedd, J.H. Gilmore, D. C. Glahn, I.M. Goodyer, P.E. Grant, N.A. Groenewold, S. Gudapati, F.M. Gunning, R.C. Gur, R.E. Gur, C.F. Hammill, O. Hansson, T. Hedden, A. Heinz, R.N. Henson, K. Heuer, J. Hoare, B. Holla, A.J. Holmes, H. Huang, J. Ipser, C.R. Jack Jr, A.P. Jackowski, T. Jia, D.T. Jones, P.B. Jones, R.S. Kahn, H. Karlsson, L. Karlsson, R. Kawashima, E.A. Kelley, S. Kern, K. Kim, M.G. Kitzbichler, W.S. Kremen, F. Lalonde, B. Landeau, J. Lerch, J.D. Lewis, J. Li, W. Liao, C. Liston, M.V. Lombardo, J. Lv, T.T. Mallard, M. Marcelis, S.R. Mathias, B. Mazoyer, P. McGuire, M.J. Meaney, A. Mechelli, B. Misic, S.E. Morgan, D. Mothersill, C. Ortinau, R. Ossenkoppele, M. Ouyang, L. Palaniyappan, L. Paly, P.M. Pan, C. Pantelis, M.T.M. Park, T. Paus, Z. Pausova, D. Paz-Linares, A. Pichet Binette, K. Pierce, X. Qian, A. Qiu, A. Raznahan, T. Rittman, A. Rodrigue, C.K. Rollins, R. Romero-Garcia, L. Ronan, M.D. Rosenberg, D.H. Rowitch, G.A. Salum, T.D. Satterthwaite, H.L. Schaare, J. Schabdach, R.J. Schachar, M. Schöll, A.P. Schultz, J. Seidlitz, D. Sharp, R.T. Shinohara, I. Skoog, C.D. Smyser, R.A. Sperling, D.J. Stein, A. Stolicyn, J. Suckling, G. Sullivan, B. Thyreau, R. Toro, N. Traut, K.A. Tsvetanov, N.B. Turk-Browne, J.J. Tuulari, C. Tzourio, É. Vachon-Presseau, M.J. Valdes-Sosa, P.A. Valdes-Sosa, S.L. Valk, T. van Amelsvoort, S.N. Vandekar, L. Vasung, P.E. Vértes, L.W. Victoria, S. Villeneuve, A. Villringer, J.W. Vogel, K. Wagstyl, Y.S.S. Wang, S.K. Warfield, V. Warrier, E. Westman, M.L. Westwater, H.C. Whalley, S.R. White, A.V. Witte, N. Yang, B.T.T. Yeo, H.J. Yun, A. Zalesky, H.J. Zar, A. Zettergren, J.H. Zhou, H. Ziauddeen, D. Zimmerman, A. Zugman, X.N.N. Zuo.
Author contributions
M.M.-C. performed data curation, methodological design, data analysis and drafted the manuscript. C.A.-M., N.G.-S.-M., N.G.-T., M.A.-N., R.A.I.B., L.D., J.S., R.A.-A., J.V.-B., M.R.-V., LBCC, B.C.-F. and R.R.-G. contributed to data acquisition, provided advice on data analysis and participated in writing and editing the manuscript. R.R.-G. and B.C.-F. also contributed to conceptualisation and supervision of the work.
Funding
M.M.-C. is funded by Instituto de Salud Carlos III (no. CM23/00263), Acción Estratégica en Salud, Spanish Government. R.R.-G. is funded by the EMERGIA Junta de Andalucía programme (no. EMERGIA20_00139), Plan Propio of the University of Seville and Plan de Consolidación (no. CNS2023-143647). Both R.R.-G. and C.A.-M. are funded by Plan de Generación de Conocimiento from Agencia Estatal de Investigación (no. PID2021-122853OA-I00).
Declaration of interest
R.A.I.B. and J.S. hold equity in, and are directors of, Centile Bioscience. All authors declare no other conflicts of interest.


 Open access
eLetters
No eLetters have been published for this article.