

Mental health practice is increasingly driven by national policy initiatives which stipulate care structures in considerable detail (Department of Health, 1999, 2001). These prescribed service models draw on international examples of best practice (Reference Stein and TestStein & Test, 1980; Reference Edwards, McGorry, Pennell, Birchwood, Fowler and JacksonEdwards et al, 2000) which have generally been associated with a range of desirable outcomes such as reduced in-patient care, reduced loss to follow-up and increased engagement. Reduced hospitalisation is the most commonly quoted outcome and the one most used for comparison of models (Reference Marshall and LockwoodMarshall & Lockwood, 1998). There is a growing dissatisfaction, however, with the use of purely administrative or symptomatic outcome, particularly in long-term and disabling mental illnesses such as psychoses where there is a drive for a broader range of outcome dimensions incorporating social functioning, quality of life and satisfaction with services (Reference Attkisson, Cook and KarnoAttkisson et al, 1992). This more comprehensive or ‘holistic’ approach to assessing outcomes has paralleled a call for an equally comprehensive approach to treatment, with an emphasis on the provision of a range of psychosocial interventions in addition to pharmacological treatment (National Institute for Clinical Excellence, 2002). Smaller case-loads are proposed as the foundation of this more holistic approach.
Small case-loads (e.g. 1:10, 1:12) are a feature of most current service prescriptions such as assertive outreach, crisis resolution teams and early intervention teams (Department of Health, 2001). The success of some of these service models in reducing the need for hospital care in several influential trials (Reference Stein and TestStein & Test, 1980; Reference Hoult, Reynolds and Charbonneau-PowisHoult et al, 1983) has led to their extensive replication (Reference Marshall and LockwoodMarshall & Lockwood, 1998) although not always with the same success (Reference Thornicroft, Strathdee and PhelanThornicroft et al, 1998; Reference Burns, Creed and FahyBurns et al, 1999; Reference Catty, Burns and KnappCatty et al, 2002). Despite the absence of any evidence that very small case-load sizes themselves are closely associated with improved outcomes (as distinct from the comprehensive approach embodied in such model teams) (Reference Wright, Catty and WattWright et al, 2004), they are still strongly endorsed and precisely stipulated (Reference Stein and SantosStein & Santos, 1998).
First attempts to explain the variation in outcome in these studies of ostensibly similar interventions explored the impact of varying model fidelity (Reference McHugo, Drake and TeagueMcHugo et al, 1999; Reference Fiander, Burns and McHugoFiander et al, 2003) and yielded mixed results. One criticism of the model-fidelity approach is that it focuses predominantly on structural and organisational aspects of the services and less so on day-to-day practice. Assessments of model fidelity are also generally based on self-report rather than direct measurement. The one published study using prospectively collected data (Reference Fiander, Burns and McHugoFiander et al, 2003) did not find a strong association with improved outcome. A criticism of this prospective study, which had drawn its UK data from the UK700 study (Reference Burns, Creed and FahyBurns et al, 1999), is that its negative result could indicate either that there was no association between the factors examined, or simply that the levels of case-loads tested were badly chosen.
The UK700 trial was the first in this field to test the impact of varying only one feature between experimental and control conditions – in this instance a comparison of case-load sizes of 1:12–15 and 1:30–35. The trial was a large multisite randomised controlled trial of case management in psychosis and failed to find any impact of case-load size on hospitalisation or clinical outcomes. It has been proposed (Reference Gournay and ThornicroftGournay & Thornicroft, 2000) that the experimental case-load sizes were too high and had they been smaller, as in the original study (Reference Stein and TestStein & Test, 1980), a positive outcome would have been found.
This issue is of fundamental importance. In the absence of major differences in hospitalisation rates, case-load size is the major cost driver in such services. However, a series of adequately powered trials using differing case-load thresholds is hardly feasible. Alternative methods of identifying a critical case-load size need to be considered, either to inform service provision or as the basis for a definitive trial.
Data collected in the UK700 trial have previously been used to explore the effects of case-load size on process of care of patients with severe psychotic illness (Reference Burns, Fiander and KentBurns et al, 2000), with the balance of medical to non-medical interventions as a proxy indicator for holistic care. The proportion of non-medical contacts was only increased when rates of contact were above about one per week and medical contacts comprised the majority when frequency was less than this. As with the original UK700 trial this process of care study was limited to two pre-set case-load levels.
In the current study we test for a relationship between the balance of medical and non-medical contacts and contact frequency to explore the impact of varying case-load sizes in the community care of individuals with severe mental illness.
METHOD
We constructed ‘virtual’ case-load sizes for each patient based on actual contact frequency and compared this level with the proportion of contacts devoted to non-medical activities (taken to indicate that some of the goals of the new intensive service to provide more comprehensive care were being achieved).
Constructing ‘virtual’ case-loads from service data
The UK700 study collected detailed, prospective data on staff activity and this confirmed that the two treatment arms did provide different patterns of care despite the absence of an outcome difference (Reference Burns, Fiander and KentBurns et al, 2000). There were a total of 39 025 recordings for 545 patients over 2 years. However, the data indicated a wide variation in the levels of activity between individual patients within each treatment group. There were some patients within the group with standard case management (case-load 1:30–35) who had more frequent contact than some patients in the intensive case management group (case-load 1:12–15). Using individual patient-level data it is possible to derive a ‘virtual case-load’ size for each patient by dividing their mean contacts per month over the 2 years of follow-up by the mean monthly contacts achieved by the average case manager.
Choice of service measure
The prospective service recording in the UK700 study included five categories (face-to-face contacts, telephone contacts, carer contacts, failed contacts, care coordination). The content of face-to-face contacts was classified into 11 event types based on the focus of therapeutic activity (housing, occupation and leisure, finance, daily living skills, criminal justice system, carer issues, engagement, physical health, specific medical intervention/assessment, medication, case conference). These were derived using a modified Delphi approach to achieving consensus with clinicians (Reference Burns, Fiander and KentBurns et al, 2000). Activity rates for each category were calculated per patient per 30 days for the 2 years of the study.
We chose face-to-face contact as the service measure to construct ‘virtual’ case-loads. This measure was responsible for over 80% of all recorded activities and was the most consistently recorded across the sites. Face-to-face contacts were also the only service category where the focus of the event was recorded.
Calculation of case manager activity
Not all case managers were full-time and some also dedicated time to patients not in the study. In order to calculate the ‘virtual’ case-load it is necessary first to decide the routine number of contacts per week or month made by an average full-time member of staff. Information on this fundamental aspect of community mental healthcare is surprisingly hard to obtain. Two local surveys of contact frequency yielded levels that were considerably lower than expected (Reference Greenwood, Chisholm and BurnsGreenwood et al, 2000; Reference Kent, Fiander and BurnsKent et al, 2003). Table 1 shows the recorded contacts in the two arms of the UK700 trial. There is considerable variation in the calculated mean contacts per patient in each 30-day period (from 35 to 60), with more variation in the group with intensive case management. In both groups there was about one missed contact for every four to five contacts. The mean number of contacts and attempted contacts recorded per case manager per 30 days was 49.7 (49.2 and 50.9 in the intensive and standard case management groups respectively). We have taken 50 contacts per 30 days as the level for a full-time case manager for our calculations.
Table 1 Contact frequencies for patients in the intensive and standard case management groups of the UK700 trial
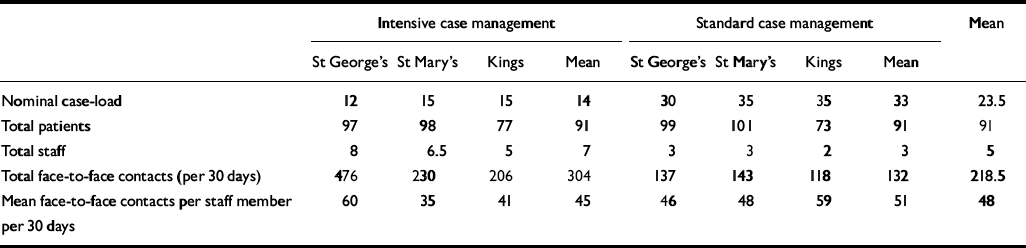
| Intensive case management | Standard case management | Mean | |||||||||||||
|---|---|---|---|---|---|---|---|---|---|---|---|---|---|---|---|
| St George's | St Mary's | Kings | Mean | St George's | St Mary's | Kings | Mean | ||||||||
| Nominal case-load | 12 | 15 | 15 | 14 | 30 | 35 | 35 | 33 | 23.5 | ||||||
| Total patients | 97 | 98 | 77 | 91 | 99 | 101 | 73 | 91 | 91 | ||||||
| Total staff | 8 | 6.5 | 5 | 7 | 3 | 3 | 2 | 3 | 5 | ||||||
| Total face-to-face contacts (per 30 days) | 476 | 230 | 206 | 304 | 137 | 143 | 118 | 132 | 218.5 | ||||||
| Mean face-to-face contacts per staff member per 30 days | 60 | 35 | 41 | 45 | 46 | 48 | 59 | 51 | 48 | ||||||
Development of a proxy for change in clinical practice
In the previous study (Reference Burns, Fiander and KentBurns et al, 2000) the proportion of ‘medical’ contacts (where the focus was either ‘medication’ or ‘specific medical intervention/assessment’) to ‘non-medical’ contacts (the focus was any of the other nine categories listed previously). We have used the same proxy measure in this study.
Statistical analyses
To generate graphical representations patients were categorised according to their notional allocation to intensive case or standard case management as determined by study design. Calculated (‘virtual’) case-loads were categorised by dividing consecutive values into 13 samples of equal sizes that reflected differing case-load ranges. Proportions of patients in various categories were compared using χ2 tests.
Correlations were assessed using Spearman's method owing to non-normality of the distributions. Stepwise linear regression was used to assess relationships between model of care, calculated case-loads and proportion of non-medical contacts. The proportion of non-medical contacts was the dependent factor, with care model (intensive or standard management) and calculated case-load entered as fixed factors. Stepwise linear regression was used to assess the affect of the calculated case-load size on primary and secondary outcomes, controlling for baseline variables (as specified in the original UK700 report) and baseline levels of the tested outcome variable.
RESULTS
Virtual case-load size
Figure 1 shows the distribution of patients according to their notional allocation (either intensive or standard case management) and their calculated (‘virtual’) case-loads. Based on recorded activity the average case-loads were 14 and 33 for intensive and standard case management respectively.

Fig. 1 ‘Virtual' case-load distribution for patients with standard
(![]() )
and intensive (□) case management. Trendlines with moving averages
of 2 were calculated and superimposed to demonstrate overall
patterns more clearly.
)
and intensive (□) case management. Trendlines with moving averages
of 2 were calculated and superimposed to demonstrate overall
patterns more clearly.
Most patients in the standard group were receiving the levels of care that would be predicted, with only 2% (6 of 267) receiving care equivalent to a case-load of 15 or under. However, only 40% of patients in the intensive management group were receiving care equivalent to a case-load of 15 and under, and 21% (57 of 272) were receiving care equivalent to a case-load size of 30 and above. The difference in the distribution is highly statistically significant (χ2=113, P<0.0001), suggesting that patients in the two treatment groups really did receive distinctly different services.
‘Virtual' case-load size and non-medical contacts
Figure 2a–c shows scatterplots of ‘virtual’ case-load in relation to proportion of non-medical contacts. Estimated case-load sizes are limited to 1:100 (because some patients could only be contacted once or twice during the 2 years they generate spuriously high virtual case-load sizes). Spearman's correlation demonstrates a small but statistically significant negative relationship between virtual case-load size and the proportion of non-medical contacts (r=–0.138, P<0.005, two-tailed). Separate analyses showed a significant relationship for the group with intensive case management (r=–0.231, P<0.001) but not for the standard management group (r=0.108, P<0.1). However, linear regression analysis with the proportion of non-medical contacts as the dependent variable and care model and grouped virtual case-load size as fixed factors revealed no significant interaction term (care model × virtual case-load size, F<1).
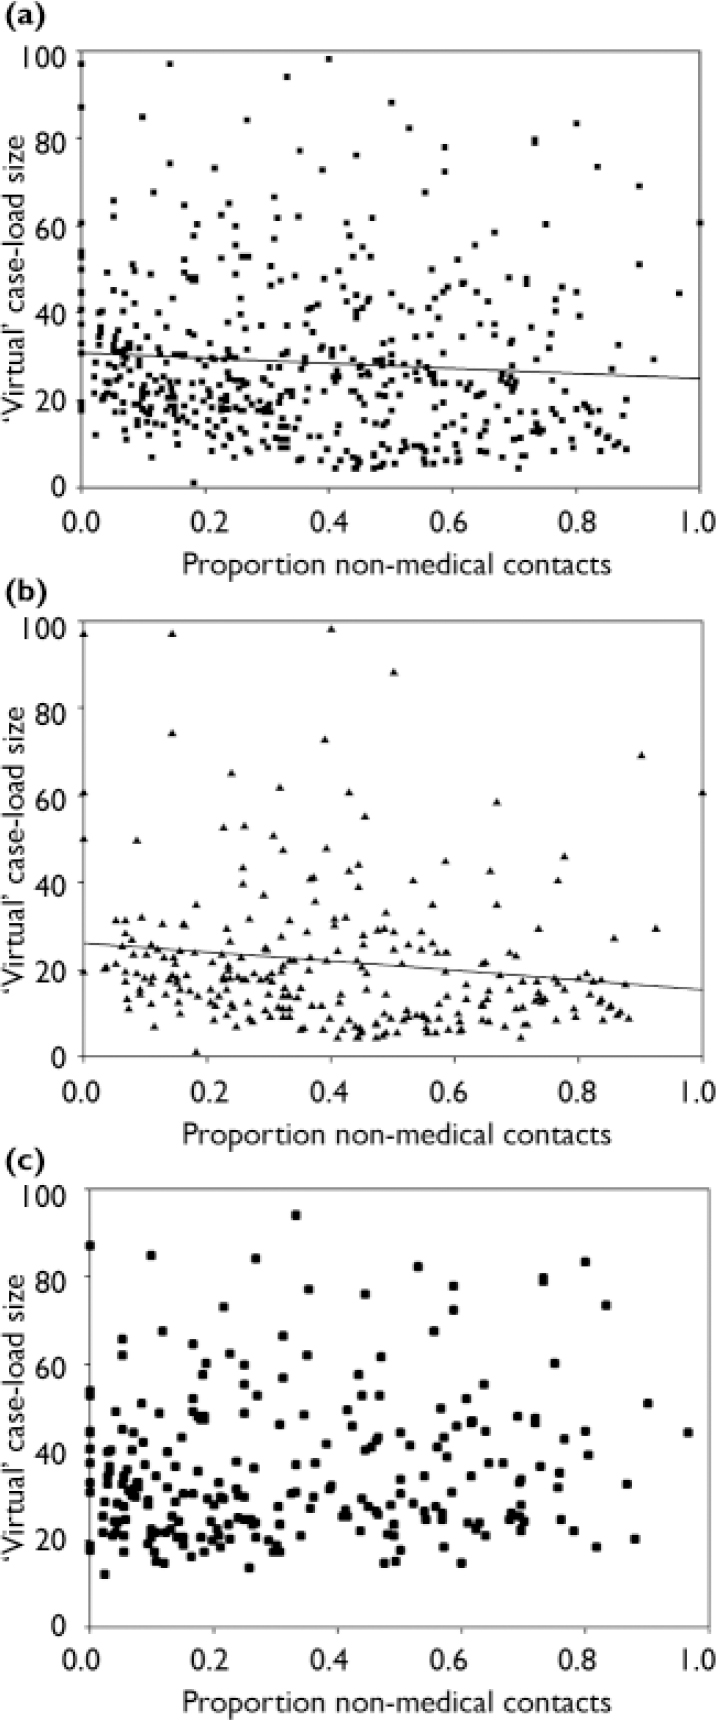
Fig. 2 ‘Virtual' case-load distribution for (a) all patients, (b) patients with intensive case management and (c) patients with standard case management.
Figure 3 presents the mean proportion of non-medical contacts according to ‘virtual’ case-load size. The range of these steps is unequal as comparative numbers of results in each bin are required for analysis. Analysis by each individual case-load size (e.g. 10, 11, 12) was not possible because of empty cells. There was a steady increase in the proportion of non-medical contacts as case-load sizes fell from 1:19–21 to 1:9–11. The proportion of non-medical contacts was around 50% for case-load sizes below 9. The proportion of non-medical contacts varied in a rather irregular manner for case-load sizes between 1:22 and 1:34 and for sizes of 1:35 and above the proportion remained essentially stable.
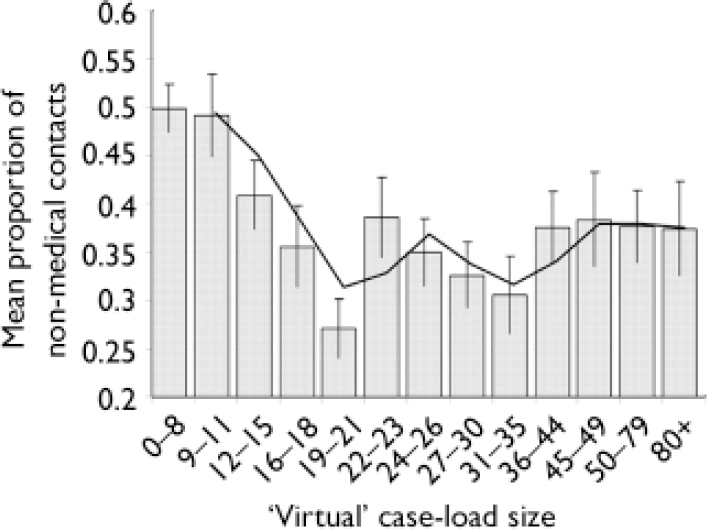
Fig. 3 Mean proportion of non-medical contacts according to ‘virtual’ case-load size. The trendline represents a moving average across the two previous bars.
Case-load size and patient outcomes
The outcomes tested were the same as in the original UK700 study – days in hospital (primary outcome) and psychiatric symptoms (Comprehensive Psychiatric Rating Scale (CPRS; Reference Asberg, Montgomery and PerrisAsberg et al, 1978); an adapted form of the Disability Assessment Schedule (DAS; World Health Organization, 1998)); quality of life (Lancashire Quality of Life Profile; Reference Oliver, Huxley and PriebeOliver et al, 1997); and patients' satisfaction (Camberwell Assessment of Need; Reference Phelan, Slade and ThornicroftPhelan et al, 1995) (secondary outcomes). Analyses were adjusted for baseline levels of the corresponding outcome variable and for other baseline variables (e.g. age, months since onset) as in the original report (Reference Burns, Creed and FahyBurns et al, 1999). Results showed no significant relationship between ‘virtual’ case-load size and primary outcome. One secondary outcome, DAS score, was significantly predicted by ‘virtual’ case-load size (β=–0.086, P<0.005). Larger case-loads predicted an average decrease in social disability.
DISCUSSION
Given the controversy that the UK700 study generated (Reference Gournay and ThornicroftGournay & Thornicroft, 2000; Reference Smyth and HoultSmyth & Hoult, 2000) and the emphasis placed on case-load sizes by commissioners and policy makers it is remarkable how little research has been conducted into the effects of varying case-load size. In the UK case-load sizes have been explicitly prescribed and linked to funding for all the new teams recommended in the NHS Plan (assertive outreach, crisis resolution/home treatment, first-onset) (Department of Health, 2000, 2002). Similarly in the USA, Canada, several European countries and Australia adherence to case-load sizes is a requirement for the funding of specialised mental health teams. For commissioners the issue is decisive as case-load size, after duration of in-patient stay, is the major determinant of the cost of mental healthcare.
Assertive community treatment
The insistence on an absolute threshold for case-loads reflects a consistently expressed belief that there is a qualitative shift in practice – that the assertive community treatment model is ‘all or nothing’ (Reference Allness and KnoedlerAllness & Knoedler, 1998). This insistence drew its legitimacy from the series of studies indicating that assertive community treatment teams were routinely associated with a reduction in bed usage (Reference Marshall and LockwoodMarshall & Lockwood, 1998). However there have been important service changes in mental healthcare in the USA over the past two decades which have involved more actively managed in-patient care and the development of a clearer community focus. These have led to a marked decrease in the potential for reduction in bed usage as a consequence of assertive community treatment and few modern studies can hope to achieve the dramatic reductions found by Stein & Test (Reference Stein and Test1980) or Rosenheck et al (Reference Rosenheck, Neale and Leaf1995). Essock and colleagues (Reference Essock, Mueser and Drake2006) recently failed to demonstrate a significant overall reduction in hospitalisation when comparing assertive community treatment with standard case management in two urban populations of American patients with mental illness complicated by unstable housing and substance misuse. Overall, patients in both groups improved but a relative reduction in hospitalisation was only achieved in the urban centre with higher rates of institutionalisation, reflecting the European experience (Reference Burns, Catty and WattBurns et al, 2002).
Models of care
However, there is evidence that resource enhancement alone may fail to change practice without an explicit change in model of care. Kent et al (Reference Kent, Fiander and Burns2003) found no increase in psychosocial interventions used by community mental health teams who had expressed a wish to do so despite the provision of substantial extra clinical time. The impact of these findings is limited, however, by the absence of evidence for an optimal, or critical, case-load size. It could be argued that the teams studied by Kent et al (Reference Kent, Fiander and Burns2003) were so underresourced that their enhancement only permitted adequate medical-model care to all patients or, conversely, that they were already sufficiently resourced, the extra clinical time was not needed and the level of non-medical care had been clinically appropriate. This is similar to the criticism of the UK700 trial – that both arms of the trial lay on one side of this crucial threshold.
Main results
The contact frequencies reported in this trial are lower than many clinicians would have expected or wished and there is a clear difference in frequency between sites. However, there is no published evidence that they are lower overall than frequencies in previously reported studies and there is some evidence that they broadly reflect clinical practice in these teams (Reference Fiander, Burns and McHugoFiander et al, 2003). Why there is such a range of contact frequency in similarly staffed teams is an interesting question and one for which carefully targeted studies will be needed (Reference Weaver, Tyrer and RitchieWeaver et al, 2003). It is, however, beyond the scope of this paper.
Our results give little support for the importance of a clear-cut and crucial case-load threshold to dismiss the findings of the UK700 study. Figure 3 does not demonstrate a step-wise change in practice at any case-load size, but rather a dose–response curve between case-load sizes of 1:10 and 1:20. Thus the patients in these ‘virtual’ case-loads appeared to receive steadily increasing non-medical (taken here to indicate comprehensive) care as the case-load fell. This would support the value of small case-loads (i.e. below 1:20) for the community care of individuals with severe psychotic illnesses. The ‘dose–response' character indicates how clinicians may be able to use extra contact time creatively. However, the argument for smaller case-loads must rest on what is going to be delivered in terms of treatments – there is no support for the idea that a certain case-load threshold triggers a quite different way of working.
Interpreting the results for case-loads above 1:21 or below 1:9 is difficult. Above 1:35 the curve is essentially flat and there is no identifiable influence of case-load size, with two-thirds of contacts being explicitly medical. However, these larger ‘virtual’ case-loads reflect increased difficulties in maintaining contact with patients rather than planned clinical activity – what contact could be achieved, not what was considered appropriate. Limitations of the data and statistical methodology prevent us from further testing of case-loads below 1:9.
The range of case-load sizes between 1:21 and 1:35 contains an uncertain mixture of patients receiving intensive and standard case management and shows no simple consistent trend. It is difficult, and probably unwise, to try to draw conclusions from these results. Our scatterplots further support this interpretation that it is only with small case-loads that this shift in the balance of activity is demonstrated. The weak association found in the scatterplot for all patients is entirely accounted for by patients receiving intensive case management.
Case-load threshold
Burns et al (Reference Burns, Fiander and Kent2000) found no difference in the mean number of medical contacts per patient per 30 days between teams with case-load sizes of 1:12 and 1:15. The difference between the teams was that the team with a case-load of 1:12 was using most of their ‘extra’ contacts for non-medical activity. Burns et al speculated that teams might be prioritising medical contacts, that there could be a clinically determined ‘ceiling’ for such contacts in this patient group and that once this level (approximating to 1 visit per 3 weeks) was reached all further activity would be devoted to a broader range of non-medical interventions.
Our current findings do not support such a ‘ceiling’ effect for medical contacts. When the proportions of medical contacts at the different ‘virtual’ case-load sizes were translated into absolute frequencies they rose steadily across the range. At case-load sizes of 36–44 a mean of 0.78 medical contacts were made per patient per 30 days; case-loads of 30–35 yielded 1.1 medical contacts, at 19–21 the frequency was 1.85 and by 9–11 it had risen to 2.6 per 30 days.
However, our findings should not be taken as a rejection of the importance of a fixed case-load. The emphasis placed on case-load size by assertive teams may be more related to the need for greater autonomy and an internal locus of control for the team than for perceived fidelity to the assertive approach. One of the attractions of working in an assertive outreach team is the guarantee of a limited case-load. Control over case-load size has been associated with less burnout in personnel compared with equivalent staff in community mental health teams where case-load sizes are bigger (Reference Billings, Johnson and BebbingtonBillings et al, 2003). Greater latitude in decision-making and lower job demands have also been associated with higher levels of job satisfaction and performance (Reference Evans, Huxley and GatelyEvans et al, 2006). By setting a limit to case-load size this control can be exercised unambiguously and transparently. What that limit needs to be remains, however, open to local consideration based on the clinical goals of the team and local needs and services.
Limitations
There are a number of obvious limitations to this exploratory study. We report here analyses of data collected from a study designed to answer a different question. The most severe limitation is that this study is built on two artificially constructed proxies – a ‘virtual’ case-load derived from contact frequency and a rough measure of comprehensive care based on the proportion of ‘medical’ and ‘non-medical’ activities. The problem for the ‘virtual’ case-loads is that they were not predetermined and reflect clinical need. Any conclusions about causality (i.e. that small case-loads are responsible for, rather than associated with, a more comprehensive approach) can only be speculative.
Both of these measures are based on self-report by case managers. Although extensive verifications of contact frequency were conducted in the original study (Reference Burns, Fiander and KentBurns et al, 2000), no audits of activity or reliability exercises were conducted into the allocation of contacts to medical and non-medical categories other than to check that visits at which depot medication was administered were classified as medical.
Conclusions
Our study does not support a threshold effect for a case-load size which significantly alters clinical practice but confirms that distinctions between types of community services for this patient group (e.g. assertive community treatment, intensive case management, ‘standard’ case management) are more likely to be differences of degree than of fundamentally different practices (Reference Catty, Burns and KnappCatty et al, 2002). Case-load sizes vary but generally sizes of 1:20 and below seem to be characteristic of sustained intensive care in this patient group (Reference Wright, Catty and WattWright et al, 2004). Our study indicates a ‘dose response’ within this range.
The UK700 study concluded with a request for less attention to precise definitions of care structures and more focus on the content of care (Reference Burns, Creed and FahyBurns et al, 1999). There has, however, been very little empirical investigation of what a smaller case-load would permit that a larger one would not. Presumably this is because it is considered self-evident – more care, higher quality care, a broader range of care. Weaver's qualitative approach to understanding the possible mechanisms of the impact of smaller case-loads on the process of care is a notable exception (Reference Weaver, Tyrer and RitchieWeaver et al, 2003). Our findings should alert researchers, clinicians and policy makers to the need for a careful critical approach to interpreting health service trials of complex mental health interventions. How extra resource is used is more important than how it is organised.


eLetters
No eLetters have been published for this article.