


1 Introduction
With the advance of Answer Set Programming (ASP; Lifschitz Reference Lifschitz2019) into more and more complex application domains, also the need for inspecting problems as well as their solution increases significantly. The intrinsic difficulty lies in the fact that ASP constitutes a general problem solving paradigm, whereas the wide spectrum of applications rather calls for customized presentations.
We address this by taking up the basic idea of aspviz (Cliffe et al. Reference Cliffe, de Vos, Brain and Padget2008), to visualize ASP by means of ASP itself, and extend it in the context of modern ASP systems. The resulting system is called clingraph (v1.1.0). Footnote 1 , Footnote 2 The common idea is to specify a visualization in terms of a logic program that defines special atoms capturing graphic elements. This allows us to customize the presentation of an application domain by means of ASP and thus to easily connect with the problem specification and its solutions.
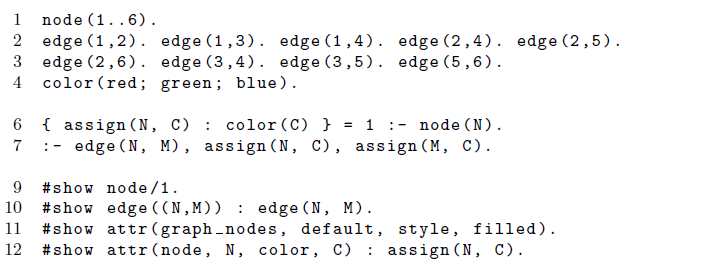
Graph coloring instance, encoding, and display (color.lp).
The visualization in clingraph rests upon graph structures that are passed on to the graph layout system graphviz. Footnote 3 Graphviz layout programs process graph descriptions written in a simple text language. We employ their python application programming interface (API) to generate this description from an ASP representation. To this end, clingraph takes – in its basic setting – a set of facts over predicates graph, node, edge, and attr as input and produces an output visualizing the induced graph structure.
As a simple example, consider the graph coloring problem in Listing 1. Footnote 4 The actual problem instance and encoding are given in Lines 1–4 and 6–7, respectively. However, of particular interest are Lines 9–12 that use #show directives to translate the resulting graph colorings into clingraph’s input format. While Lines 9 and 10 account for the underlying graph, the two remaining lines comprise instructions to graphviz. Line 11 fixes the layout of graph nodes. More interestingly, Line 12 translates the obtained graph coloring to layout instructions for graphviz. Here, all entities are grouped under a default graph labeled default (which can be changed via an option; similarly, graphs are taken to be undirected unless changed by option --type).
Launching clingo so that only the resulting stable model is obtained as a set of facts allows us to visualize the result via clingraph:
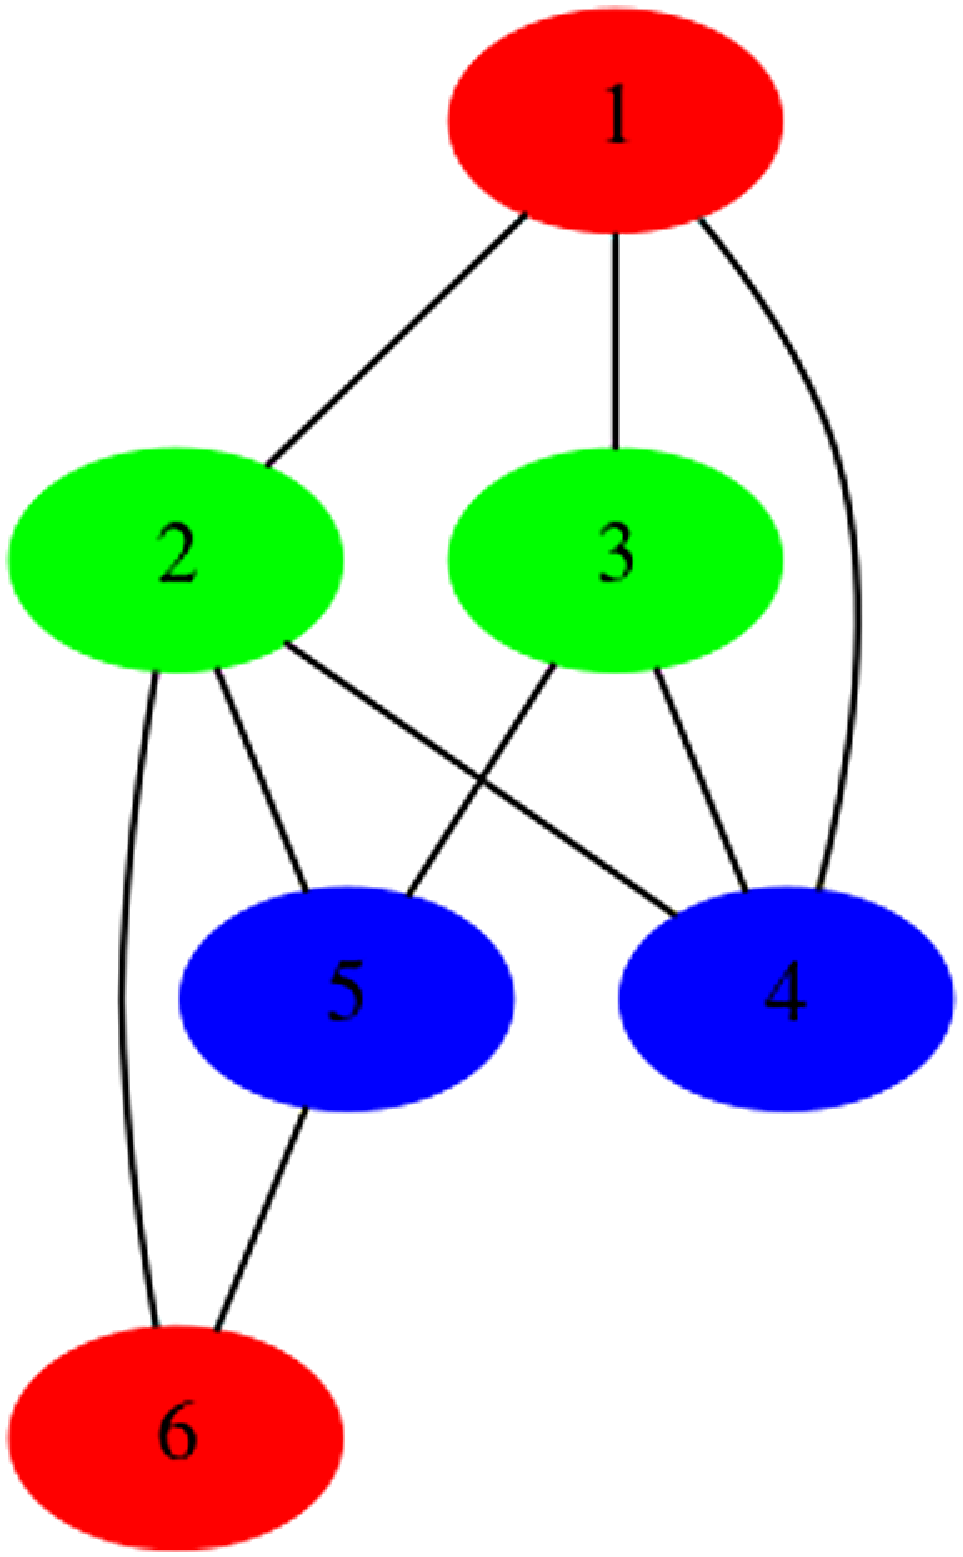
The used options suppress clingo output and transform atoms into facts; the intermediate UNIX command extracts the line comprising the stable model. Note that one can also use a solver other than clingo to generate the stable model in the expected form. The final call to clingraph produces a file in PNG format, shown in Figure 1.
Visualization of the (first) stable model of the logic program in Listing 1.
Obviously, the above proceeding only reflects the very basic functionality of clingraph. We elaborate upon its extended functionality in the next section and present a series of illustrative cases studies in Section 3. They range from the visualization of stable models, including animated dynamic solutions as well as interactive ones, over visualizing the actual solving process, to the visual inspection of the structure of logic programs. Finally, we present in Section 4 some support for generating strings by using a template engine. We relate our approach to others’ and summarize it in Sections 5 and 6, respectively.
2 Clingraph
In its most basic setting, clingraph can be regarded as a front-end to graphviz that relies on the fact format sketched above. In fact, the full-fledged version of the fact format allows for specifying multiple graphs as well as subgraphs. The former is done by supplying several instances of predicate graph/1 whose only argument provides an identifier for regrouping all elements belonging to the graph at hand. To that effect, there are also binary versions of predicates node and edge, whose second argument refers to the encompassing graph. For example, the following facts describe n graphs, each with one edge connecting two nodes.
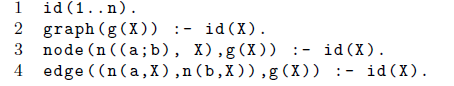
Multiple graphs are of particular interest when visualizing dynamic domains, as in planning, where each graph may represent a state of the world. We illustrate this in Section 3 and show how the solution to a planning problem can be turned into an animation.
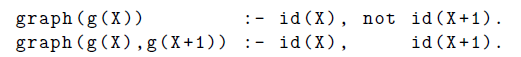
Subgraphs Footnote 5 are specified by the binary version of predicate graph, whose second argument indicates the super-ordinate graph. For instance, replacing Line 2 above by the following two rules makes g(X) a subgraph of g(X+1) for X=1.n-1.
Clingraph allows for selecting designated graphs by supplying their identifier to option --select-graph; several ones are selected by repeating the option with the respective identifiers on the command line.
As exemplified in Listing 1, the quaternary predicate attr/4 describes properties of graph elements; this includes all attributes of graphviz. The first argument fixes the type of the element, namely, graph, node, and edge, along with keywords graph_nodes and graph_edges to refer to all nodes and edges of a graph, respectively. The second argument gives the identifier of the element, and the last two provide the name and value of the graphviz attribute. Some attributes, mainly labels, are often constructed by concatenating multiple values. We simplify this burden by providing an integration with a template engine to allow string formatting. In Section 4, we describe this extension in detail.
In order to avoid name clashes, clingraph offers the option --prefix to change all graph-oriented predicates by prepending a common prefix. For instance, --prefix=’viz-’ changes the dedicated predicate names to viz-graph, viz-node, viz-edge, and viz-attr while maintaining their arities.
The more interesting use cases emerge by using visualization encodings. While in our introductory example the latter was mimicked by #show statements, in general, a visualization encoding can be an arbitrary logic program producing atoms over the four graph-oriented predicates. Obviously, when it comes to visualization, a given problem encoding can then be supplemented with a dedicated visualization encoding, whose output is then visualized by clingraph as shown in the introductory section.
In practice, however, it turns out that this joint approach tends to slow down the solving process significantly. Rather, it is often advantageous to resort to a sequential approach, in which the stable models of the problem encoding are passed to a visualization encoding. This use case is supported by clingraph with extra functionality when using the ASP system clingo. More precisely, this functionality relies upon the clingo feature to combine the output of a run, possibly comprising various stable models, in a single json object. Footnote 6 To this end, clingraph offers the option --select-model to select one or multiple stable models from the json object. Multiple models are selected by repeating the option with the respective number.
To illustrate this, let us replace Line 1 above by
to produce n stable models with one graph each, rather than a single model with n graphs as above. The handover of all stable models of the resulting logic program in multiple.lp to clingraph can then be done by the following command:
The option --outf=2 instructs clingo to produce a single json object as output. We request all 10 stable models via “-c n=10 0.” Then, clingraph produces a ![]() file depicting the graphs described in the first and tenth stable model.
file depicting the graphs described in the first and tenth stable model.
In the quite frequent case that the stable models are produced exclusively by the problem encoding, an explicit visualization encoding can be supplied via option --viz-encoding to make clingraph internally produce the graphic representation from the given stable models employing the clingo API. To ease the development of visualization encodings, clingraph also provides a set of external Python functions (see Section 3 for an example).
Just like clingraph’s input, also its output may consist of one or several graph representations. The specific representation is controlled by option --out that can take the following values:
-
facts produces the facts obtained after preprocessing (default)
-
dot produces graph representations in the language DOT
-
render generates images with the rendering method of graphviz
-
animate generates a GIF after rendering
-
tex produces a
 file
file
The default option facts allows us to inspect the processed input to clingraph in fact format. This involves the elimination of atoms irrelevant to clingraph as well as the normalization of the graph representation (e.g., turning unary predicates node and edge into binary ones, etc.). Options dot and tex result in text-based descriptions of graphs in the languages DOT and ![]() . These formats allows for further postprocessing and editing upon document integration. The
. These formats allows for further postprocessing and editing upon document integration. The ![]() file is produced with dot2tex.
Footnote 7
Arguments to dot2tex can be passed through clingraph via --tex-param. At long last, the options render and animate synthesize images for the graphs at hand. While the former aims at generating one image per graph, the latter allows us to combine several graphs in an animation. The format of a rendered graph is determined by option --format. The option defaults to PDF and alternative formats include PNG and SVG (cf. Section 3.3). Animation results in a GIF file. It is supported by options --fps to fix the number of frames per second and --sort to fix the order of the graphs’ images in the resulting animation. The latter provides a handful of alternatives to describe the order in terms of the graph identifiers.
file is produced with dot2tex.
Footnote 7
Arguments to dot2tex can be passed through clingraph via --tex-param. At long last, the options render and animate synthesize images for the graphs at hand. While the former aims at generating one image per graph, the latter allows us to combine several graphs in an animation. The format of a rendered graph is determined by option --format. The option defaults to PDF and alternative formats include PNG and SVG (cf. Section 3.3). Animation results in a GIF file. It is supported by options --fps to fix the number of frames per second and --sort to fix the order of the graphs’ images in the resulting animation. The latter provides a handful of alternatives to describe the order in terms of the graph identifiers.
Also, it is worth mentioning that clingraph’s option --engine allows us to choose among the eight layout engines of graphviz; Footnote 8 it defaults to dot which is optimized for drawing directed graphs.
Last but not least, clingraph also offers an API for Python. Besides graphviz, it heavily relies on clorm, Footnote 9 a Python library providing an Object Relational Mapping (ORM) interface to clingo. Accordingly, the major components of clingraph’s API are its Factbase class, providing functionality for manipulating sets of facts via clorm, and the graphviz package, gathering functionality for interfacing to graphviz. We refer the interested reader to the API documentation for further details. Footnote 10 In conjunction with clingo, the API can be used for visualizing the solving process. Two natural interfaces for this are provided by the on_model callback of clingo’s solve method as well clingo’s Propagator class. For example, the former would allow for visualizing the intermediate stable models obtained when converging to an optimal model during optimization. The latter provides an even more fine-grained approach that allows for monitoring the search process by visualizing partial assignments (cf. Section 3.4).
3 Case studies
In this section, we list several case studies as examples that showcase various features of clingraph. Our first example, in Section 3.1, visualizes a solution of the well-known Queens puzzle. The next one, in Section 3.2, aims at visualizing a dynamic problem of a robotic intra-logistics scenario where the resulting animation points out temporal aspects of the problem. Then, in Section 3.3, we explore interactivity in visualizations via clingraph’s SVG extension. Finally, the last two case studies concentrate on visualizing aspects other than solutions of a problem. To that end, these approaches visualize the solving process of the solver (Section 3.4) and the structure of the input program (Section 3.5).
Queens puzzle (queens.lp)
Many of these case studies need complex attributes, mainly labels, which are composed of various values. Thanks to the template engine integrated in clingraph, one can specify such an attribute conveniently by a template string having variables. Then, separate rules may set values of these variables in a modular way. Note that details on the usage of templates can be found in Section 4.
The interested reader is referred for further details on these examples and many others to clingraph’s distribution. Footnote 11
3.1 Visualizing a solution of the Queens puzzle
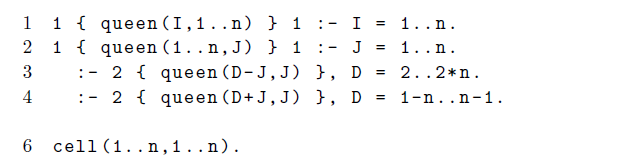
As a first example, consider the encoding of the Queens puzzle in Listing 2.
Footnote 12
The idea is to place n queens on an $n\times n$
chessboard so that no two queens attack one another.
$n\times n$
chessboard so that no two queens attack one another.
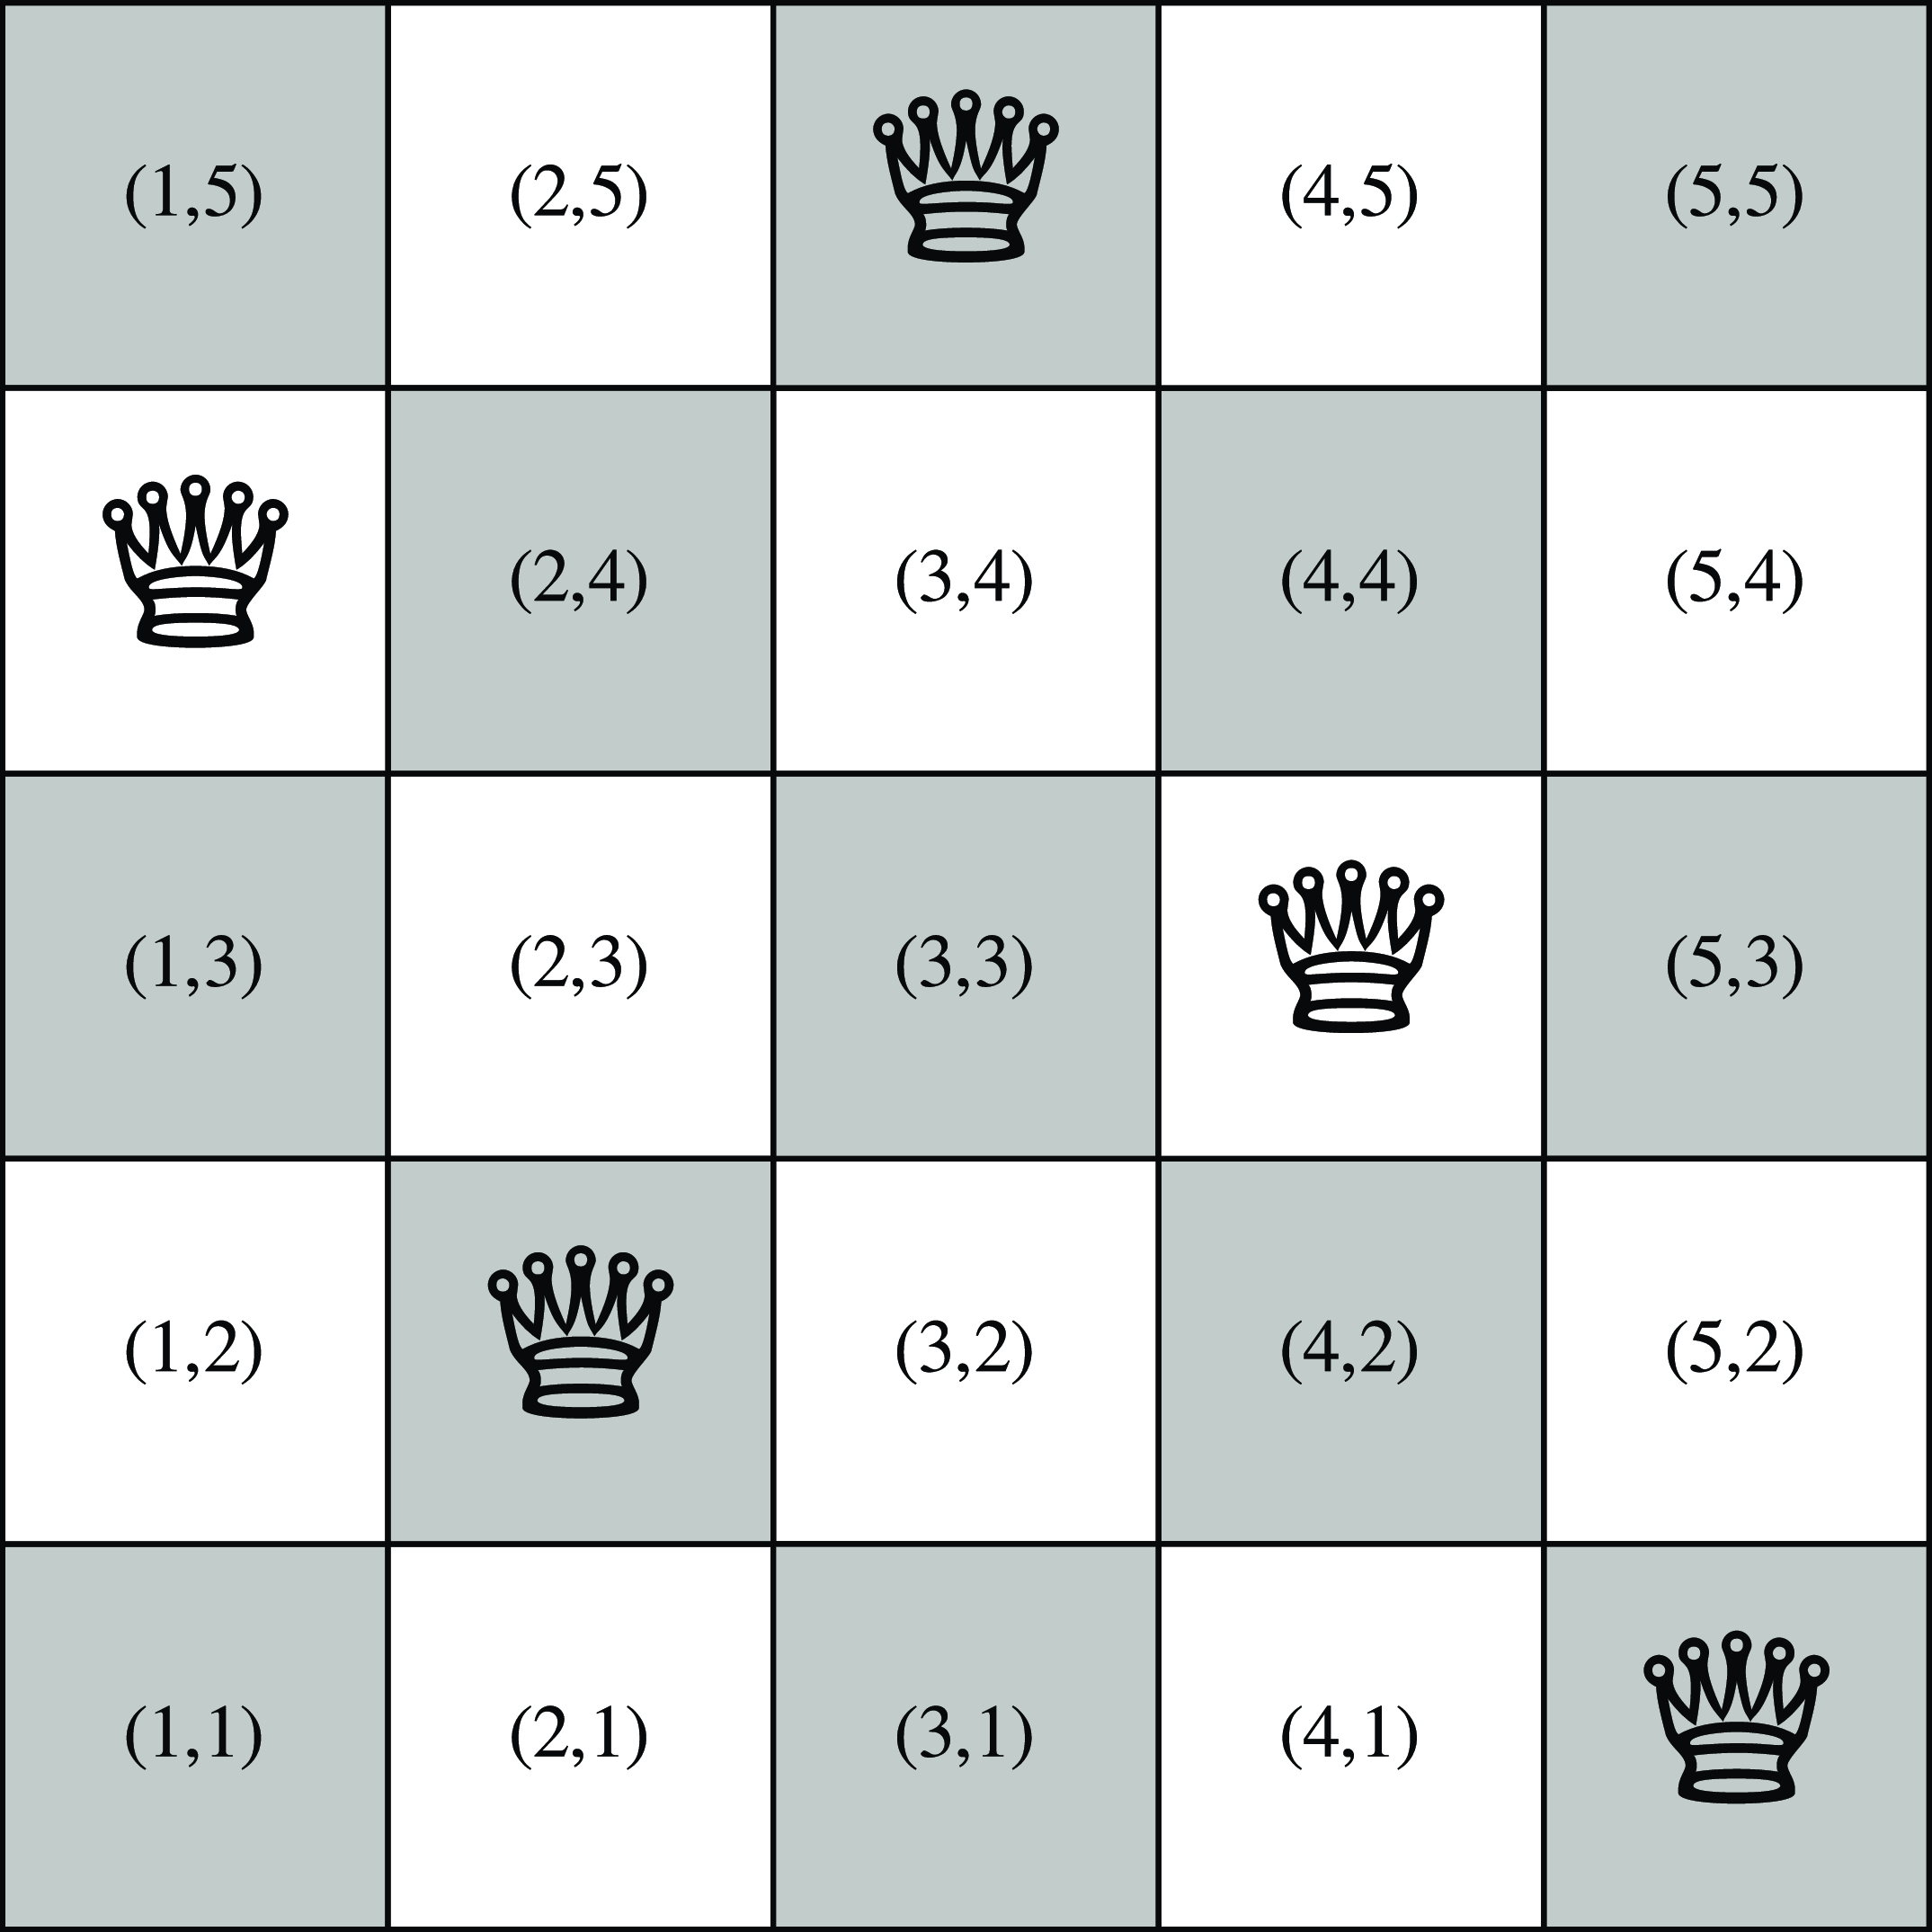
A solution is captured by atoms over predicate queen/2. The one comprised in the first stable model of queens.lp for n=5 is depicted in Figure 2. First of all, we note that the actual graph is laid out as a $5\times 5$
grid of white and gray squares. Each atom queen(x,y) is then represented by putting the symbol
$5\times 5$
grid of white and gray squares. Each atom queen(x,y) is then represented by putting the symbol
Visualization of (first) stable model of the logic program in Listing 2.
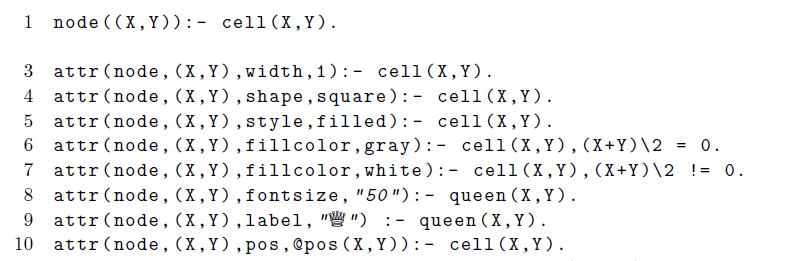
The visualization encoding producing the chessboard in Figure 2 is given in Listing 3; it is used to generate the PDF in Figure 2 in the following way.
To better understand the visualization encoding, it is important to realize that we use neato as layout engine, since it is better-suited for dealing with coordinates than the default engine dot.
Let us now have a closer look at the encoding in Listing 3. Interestingly, our graph consists of nodes only; no edges are provided. This is because nodes are explicitly positioned, and no edges are needed to connect them. More precisely, one node is introduced in Line 1 for each cell of the chessboard. Footnote 13 The remainder of the encoding is concerned with the layout and positioning of each individual node, as reflected by the first and second argument of all remaining atoms over attr/4. This is done in a straightforward way in Lines 3–5 to fix the width, shape, and style of each node. Lines 6 and 7 care about the alternating coloration of nodes, depending on whether the sum of their coordinates is even or odd. The next two lines deal with cells occupied by queens. Unlike the previous rules that only refer to the problem instance, here the derived attributes depend on the obtained solution. That is, for each atom queen(x,y), Line 8 fixes the fontsize of the label
attributed to node (x,y) in Line 9. Whenever no label is given to a node, its name is used instead, as witnessed by Figure 2. Finally, Line 10 handles the positioning of nodes. In neato, positions are formatted by two comma-separated numbers and entered in a node’s pos attribute. If an exclamation mark “!’’ is given as a suffix, the node is also pinned down. The necessary transformation from pairs of terms is implemented by the external Python function pos(x,y) provided by clingraph. This function turns a node identifier (x,y) into a string of form "x,y!". For each node, the result is then inserted as the fourth argument of predicate attr/4 in Line 10.Visualization encoding for Queens puzzle (viz.lp)
3.2 Visualizing dynamic problems
As a second example, let us look at a dynamic problem whose solutions can be visualized in terms of animations. To this end, we have chosen a robotic intra-logistics scenario from the asprilo framework (Gebser et al. Reference Gebser, Obermeier, Otto, Schaub, Sabuncu, Nguyen and Son2018). This scenario amounts to an extended multi-agent pathfinding problem having robots transport shelves to picking stations and back somewhere. The goal is to satisfy a batch of orders by transporting shelves covering all requested products to the picking station. For brevity, we do not reproduce the actual problem encoding Footnote 14 here and rather restrict our attention to the input to the visualization encoding. The input consists of action and fluent atoms accounting for a solution and how it progresses the problem scenario over time, namely,
-
move(robot(r),(
$d_x$
,
$d_y$
),
t)
Footnote 15
and -
position(o,(x,y),t) for o among robot(r), shelf(s), and station(p).


A move atom indicates that a robot r moves in the cardinal direction ( $d_x$
,
$d_x$
, $d_y$
) at time step t (for
$d_y$
) at time step t (for $d_x,d_y\in\{-1,0,1\}$
such that
$d_x,d_y\in\{-1,0,1\}$
such that $|d_x+d_y|=1$
). A position atom tells us that object o is at position (x,y) at time step t. All atoms sharing a common time step capture a state induced by the resulting plan.
$|d_x+d_y|=1$
). A position atom tells us that object o is at position (x,y) at time step t. All atoms sharing a common time step capture a state induced by the resulting plan.
The idea of the visualization encoding is now to depict a sequence of such states by combining the visualizations of individual states in an animation. Each state is represented by a graph that lays out the grid structure of a warehouse. We use consecutive time steps to identify and to order these graphs. This results in an atom graph(t) for each time step t. Similarly, we identify nodes with their coordinate along with a timestamp. This is necessary because nodes require a unique identifier across all (sub)graphs. As well, we use edges indexed by time steps to trace (the last) movements:
-
node(((x,y),t),t)
-
edge((((x’,y’),t),((
$x'+d_x$
,
$y'+d_y$
),
t)),t)


The first atom expresses that node ((x,y),t) belongs to graph t. Similarly, the second one tells us that the edge from node ((x′,y′),t) to node (( $x'+d_x$
,
$x'+d_x$
, $y'+d_y$
),
t) belongs to graph t. It is induced by an action move(robot(r),(
$y'+d_y$
),
t) belongs to graph t. It is induced by an action move(robot(r),( $d_x$
,
$d_x$
, $d_y$
),
t) and its precondition position(robot(r),(x′,y′),
$d_y$
),
t) and its precondition position(robot(r),(x′,y′), $t-1$
).
$t-1$
).
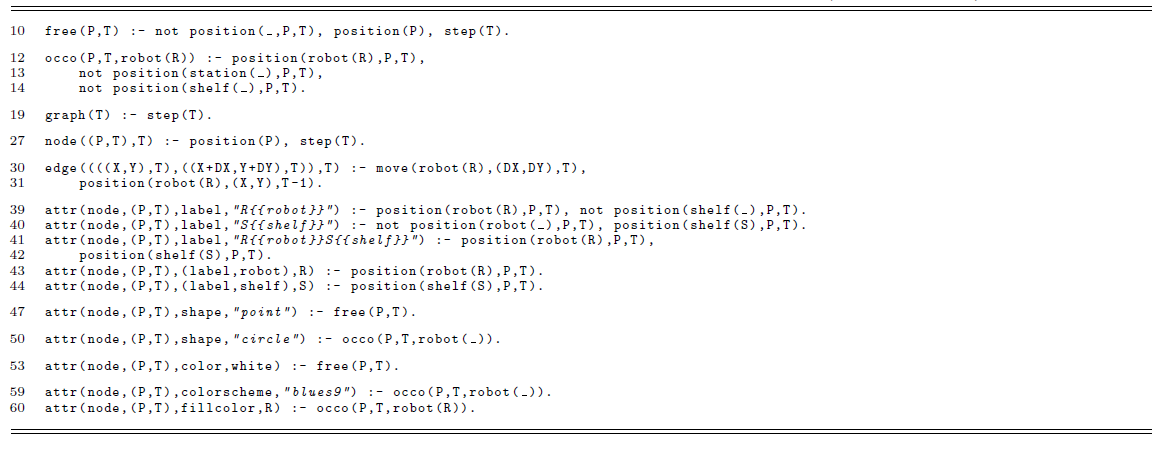
Having settled the representation of graphs along with their nodes and edges, the rest of the visualization encoding mainly deals with setting their attributes.
To see this, consider Table 1, giving excerpts of the actual visualization encoding (using line numbers in the full encoding; lines in between have been dropped for brevity). Footnote 16 The definition of graphs, nodes, and edges is given in Lines 19, 27, and 30–31. Let us discuss the remaining lines of interest of viz-asprilo.lp by inspecting some features of a visualization, produced as follows.
Selected lines from the visualization encoding for an asprilo scenario (viz-asprilo.lp).
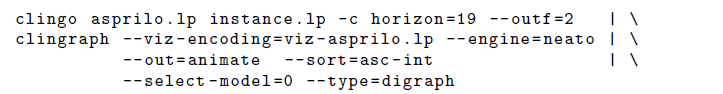
The initial call to clingo takes the problem encoding and instance and yields a plan of length 19, executed on a $7\times 7$
grid with three robots, three shelves, and one picking station. The individual 20 images underlying the resulting animation are given in Figure 3. In these images, robots are represented by solid blue circles, shelves by solid orange squares, and the only picking station by a solid green circle. The initial frame of the animation shows all three robots positioned in the lower left corner. Subsequent images depict the robots’ movements, indicated by black arrows, as they approach their respective shelves. In the fifth image, robot 3 reaches shelf 1, prompting an update of the labels to signify their shared location. The act of picking up the shelf is visually represented in the sixth image by a thicker border added around the shelf. Succeeding steps will show how both robot and shelf move together until they reach the picking station. The movements of the remaining robots unfold in a similar fashion.
$7\times 7$
grid with three robots, three shelves, and one picking station. The individual 20 images underlying the resulting animation are given in Figure 3. In these images, robots are represented by solid blue circles, shelves by solid orange squares, and the only picking station by a solid green circle. The initial frame of the animation shows all three robots positioned in the lower left corner. Subsequent images depict the robots’ movements, indicated by black arrows, as they approach their respective shelves. In the fifth image, robot 3 reaches shelf 1, prompting an update of the labels to signify their shared location. The act of picking up the shelf is visually represented in the sixth image by a thicker border added around the shelf. Succeeding steps will show how both robot and shelf move together until they reach the picking station. The movements of the remaining robots unfold in a similar fashion.
Individual graph representations making up an animated plan.
Let us explain how this works in the visualization encoding by focusing on unoccupied nodes and robots; shelves and picking stations are treated analogously. An unoccupied position p at a time step t is captured by free(p,t) in Line 10. Similarly, occo(p,t,robot(r)) tells us that robot r is the only object on position p at a time step t. This is thus neither derivable when a robot is under a shelf, carrying one, or at a picking station. With this in mind, we see that Lines 47 and 53 depict a position as a circle on a white node (plus omitted details) whenever the position is free. And, analogously Lines 50, 59, and 60 represent solitary robots by solid blue circles. Here, robots are differentiated using multiple shades of blue via the graphviz attribute colorscheme, where each robot selects one color option using an integer in attribute fillcolor. Once a robot shares a position with a shelf or picking station, the graphical representation changes (and instead the robot adopts the one of the shelf or picking station).
Moreover, a robot’s label changes whenever it is under a shelf or carries one. This is handled in Lines 39–44. A template (cf. Section 4) is selected depending on whether there is a robot, a shelf, or both in the corresponding position (Lines 39, 40, and 41 to 42, respectively). The variables robot and shelf, used in the templates, are defined in Lines 43 and 44, respectively.
3.3 Scalable Vector Graphics and interactivity
An image format of particular interest is the Scalable Vector Graphics (SVG) Footnote 17 format as it supports interactivity. More precisely, SVG is a text-based web standard for describing images in XML format integrated with Cascading Style Sheets (CSS) and JavaScript. In order to allow for interactive actions on graphic elements, we extend the SVG capabilities supported by graphviz. Our extension is implemented in JavaScript; it listens to events being performed on an element and reacts by changing a CSS style property on another element. To this end, the class attribute assigned to an element defines how the element changes on a given event: click, mouseenter, mouseleave, and contextmenu (right click). Notably, all interaction is single-shot. That is, the resulting SVG file is generated once by a single call to clingo and no further interplay with the solver is possible. Therefore, all information for interactivity needs to be rendered in the same SVG file and no information of what actions are taken can be returned to the solver.
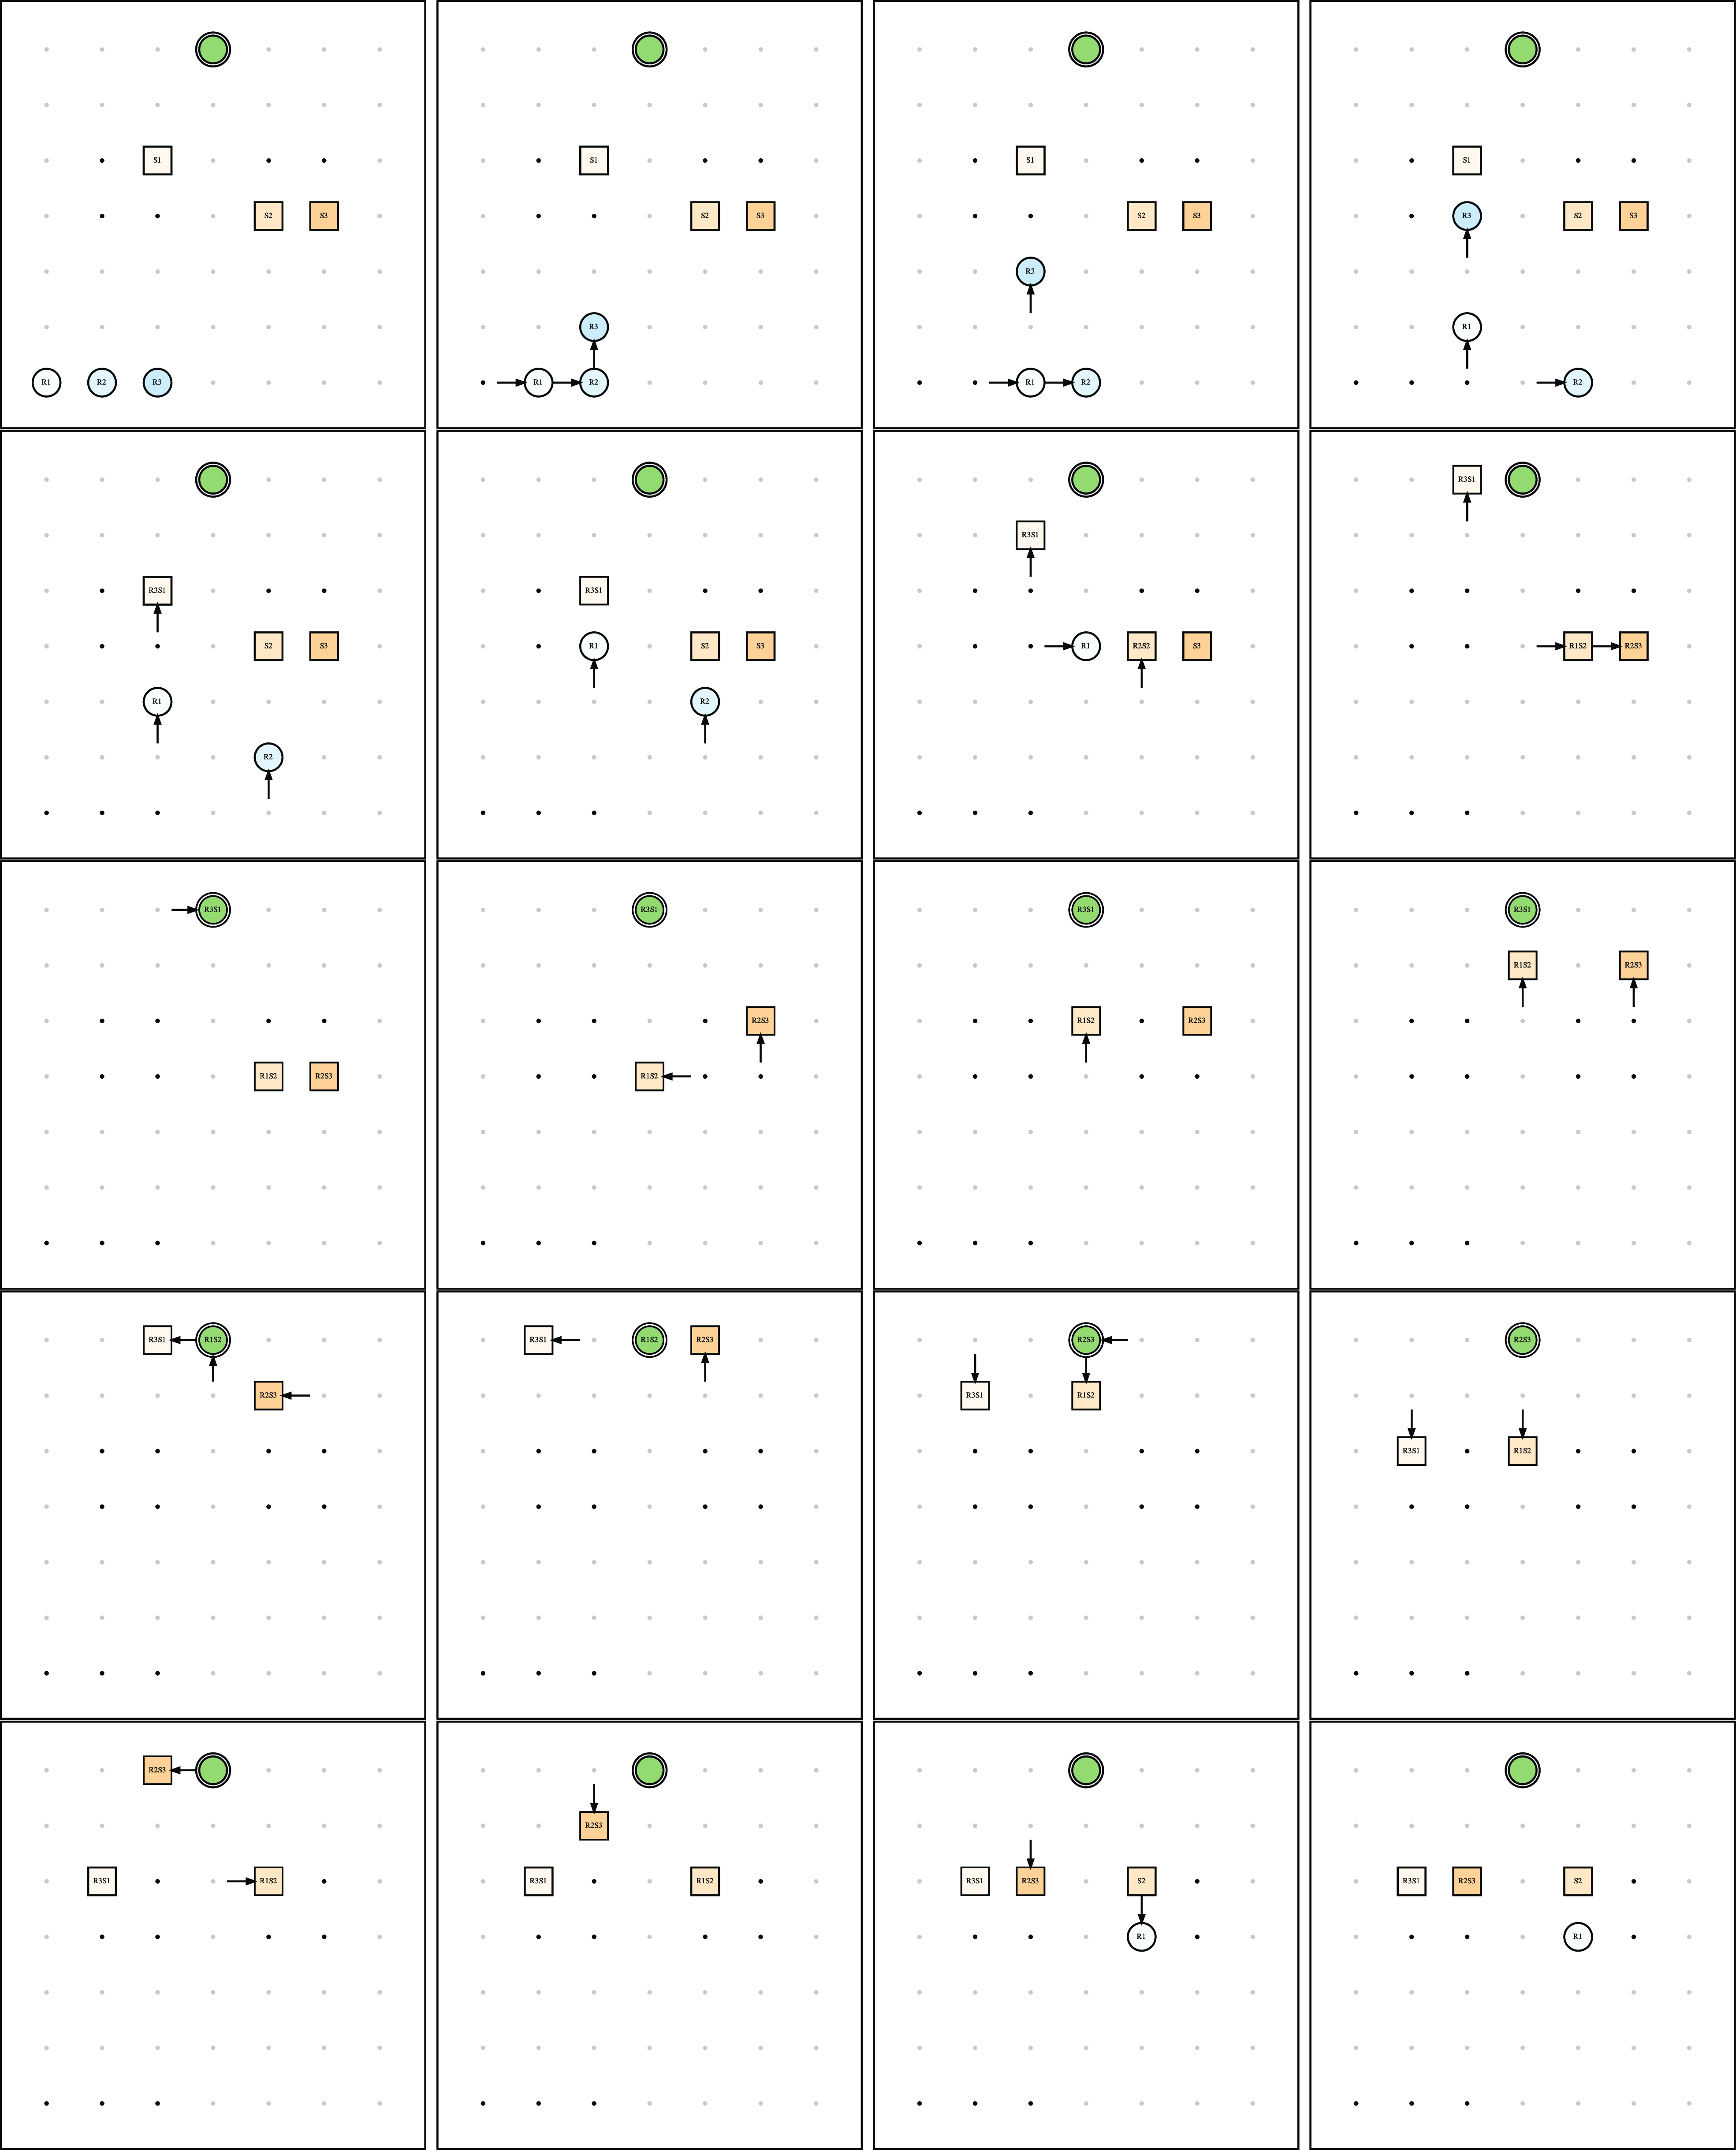
For illustration, we visualize the mouse-driven expansion of simple trees, defined by predicates node/1, parent/2, and root/1 (see Listing 5 for an example). The corresponding visualization encoding is given in Listing 4. Line 1 adds a filled style to the nodes and Line 2 generates an edge for each instance of predicate parent/2. Lines 4–6 assign the reactions based on the underlying graph element using atoms of form react(t
, $e_1$
,
$e_1$
, $e_2$
) that are read as: “element
$e_2$
) that are read as: “element $e_1$
of type t reacts to actions on element
$e_1$
of type t reacts to actions on element $e_2$
”. These atoms affect the visibility and opacity of nodes. For instance, Line 5 tells us that if there is an edge from X to Y then node Y reacts to actions on X. Lines 8–12 define the interactivity of the elements by assigning their class attribute to a formatted string. This string is handled by our extension, while the formatting of the strings is done by functions @svg_init(property,value) and @svg(event,element,property,value). For instance, in Lines 8 and 9, function @svg_init is used to express that node X and edge E have the initial value hidden for property visibility. Line 10 states that an element E changes the value of the CSS property visibility to visible when X is clicked. The function @svg generates the string
$e_2$
”. These atoms affect the visibility and opacity of nodes. For instance, Line 5 tells us that if there is an edge from X to Y then node Y reacts to actions on X. Lines 8–12 define the interactivity of the elements by assigning their class attribute to a formatted string. This string is handled by our extension, while the formatting of the strings is done by functions @svg_init(property,value) and @svg(event,element,property,value). For instance, in Lines 8 and 9, function @svg_init is used to express that node X and edge E have the initial value hidden for property visibility. Line 10 states that an element E changes the value of the CSS property visibility to visible when X is clicked. The function @svg generates the string ![]() which is assigned as a class of E in the SVG file. The string is then parsed by our extension and mapped into the JavaScript method addEventListener to react when X is clicked. Similarly, Lines 11 and 12 define that an element E changes the value of opacity to 1 or 0.2, whenever the mouse enters or leaves element X, respectively.
which is assigned as a class of E in the SVG file. The string is then parsed by our extension and mapped into the JavaScript method addEventListener to react when X is clicked. Similarly, Lines 11 and 12 define that an element E changes the value of opacity to 1 or 0.2, whenever the mouse enters or leaves element X, respectively.
Specification of interaction on trees based on clingraph’s SVG capabilities (tree-viz.lp)
Facts representing a simple tree (mytree.lp)

As an example, consider the simple tree represented as facts in Listing 5. Together with the visualization encoding in Listing 4, it can be turned into an interactive image in SVG format by means of the following command:
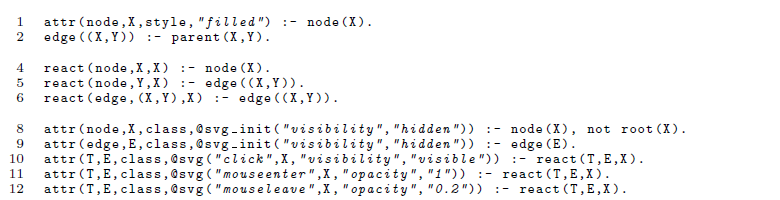
A possible user interaction via mouse actions is indicated in Figure 4 via a series of snapshots.
Example user interaction via mouse actions expanding the tree.
While the simple black pointer highlights positions of interest, the one with surrounded by lines indicates a previous click. Each such click leads to the expansion of the tree by the succeeding nodes. Note how the opacity of a node and its subnodes changes whenever the pointer hovers over and away from it, respectively.
The transformation of graphviz into SVG uses the group element <g> to group all elements related to a node or edge. Since only these group elements can be indexed in JavaScript, the CSS style properties are set on the SVG group. This results in the limitation that CSS style properties are not overwritten on the elements contained in the group. Thus, many property changes have no impact. In particular, this issue leads to problems when changing the color of elements. To address this issue, we offer a workaround for changing colors dynamically. That is, we provide the function @svg_color to represent the CSS value currentcolor. This can be used with any graphviz color attribute, such as color, fillcolor, and fontcolor, and serves as a placeholder for the color set using the SVG class.
For illustrating this functionality, Listing 6 extends the queens example with interactive elements for visualizing all cells attacked by a queen once it is hovered over by the mouse pointer.
SVG interactive queens (svg-queens.lp)
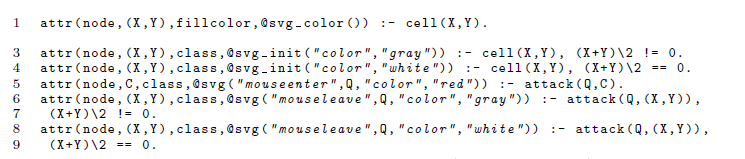
To this end, we replace Lines 6 and 7 in the visualization encoding in Listing 2 by Line 1 in Listing 5 to use the color set by the interactions specified in the following lines. Lines 3 and 4 set the initial color of the nodes to gray and white, respectively. Line 5 adds functionality to a node C attacked by queen Q so that the color is set to red when the mouse enters Q. When the mouse leaves Q, Lines 7 and 9 set the color back to the original value. We illustrate this by means of three snapshots in Figure 5. In the one on the left, the mouse pointer hovers over position (2,2). Accordingly, all cells on the same row, column, and diagonals are colored in red. The same happens in the two other scenarios, though initiated from position (5,1) and (1,4), respectively.
Three snapshots of the user hovering the mouse pointer over specific cells on the board.
The approach has further limitations. For example, labels are independent of a CSS style and thus cannot be changed interactively. A way around this is to create multiple layers of nodes with the same position and change their visibility. Footnote 18 However, we have no control over which elements appear on top and which on the bottom. Rather this must be handled manually by assuring that only a single element is visible in each position at each time. Another issue is that the position of all elements is fixed; therefore, expanding the size of the image on demand is impossible, only its visibility can be changed.
3.4 Visualizing the solving process of a Sudoku puzzle
Up to now, all case studies take answer sets as input for visualization. For the next example, however, we visualize partial assignments appearing during the search process of clingo. Specifically, we discuss a visualization of the solving process of a Sudoku puzzle. To this end, we rely on clingo’s capability of integrating user-defined propagators Footnote 19 into the solving process and use clingraph’s API for streamlining the declarative visualization of partial assignments.
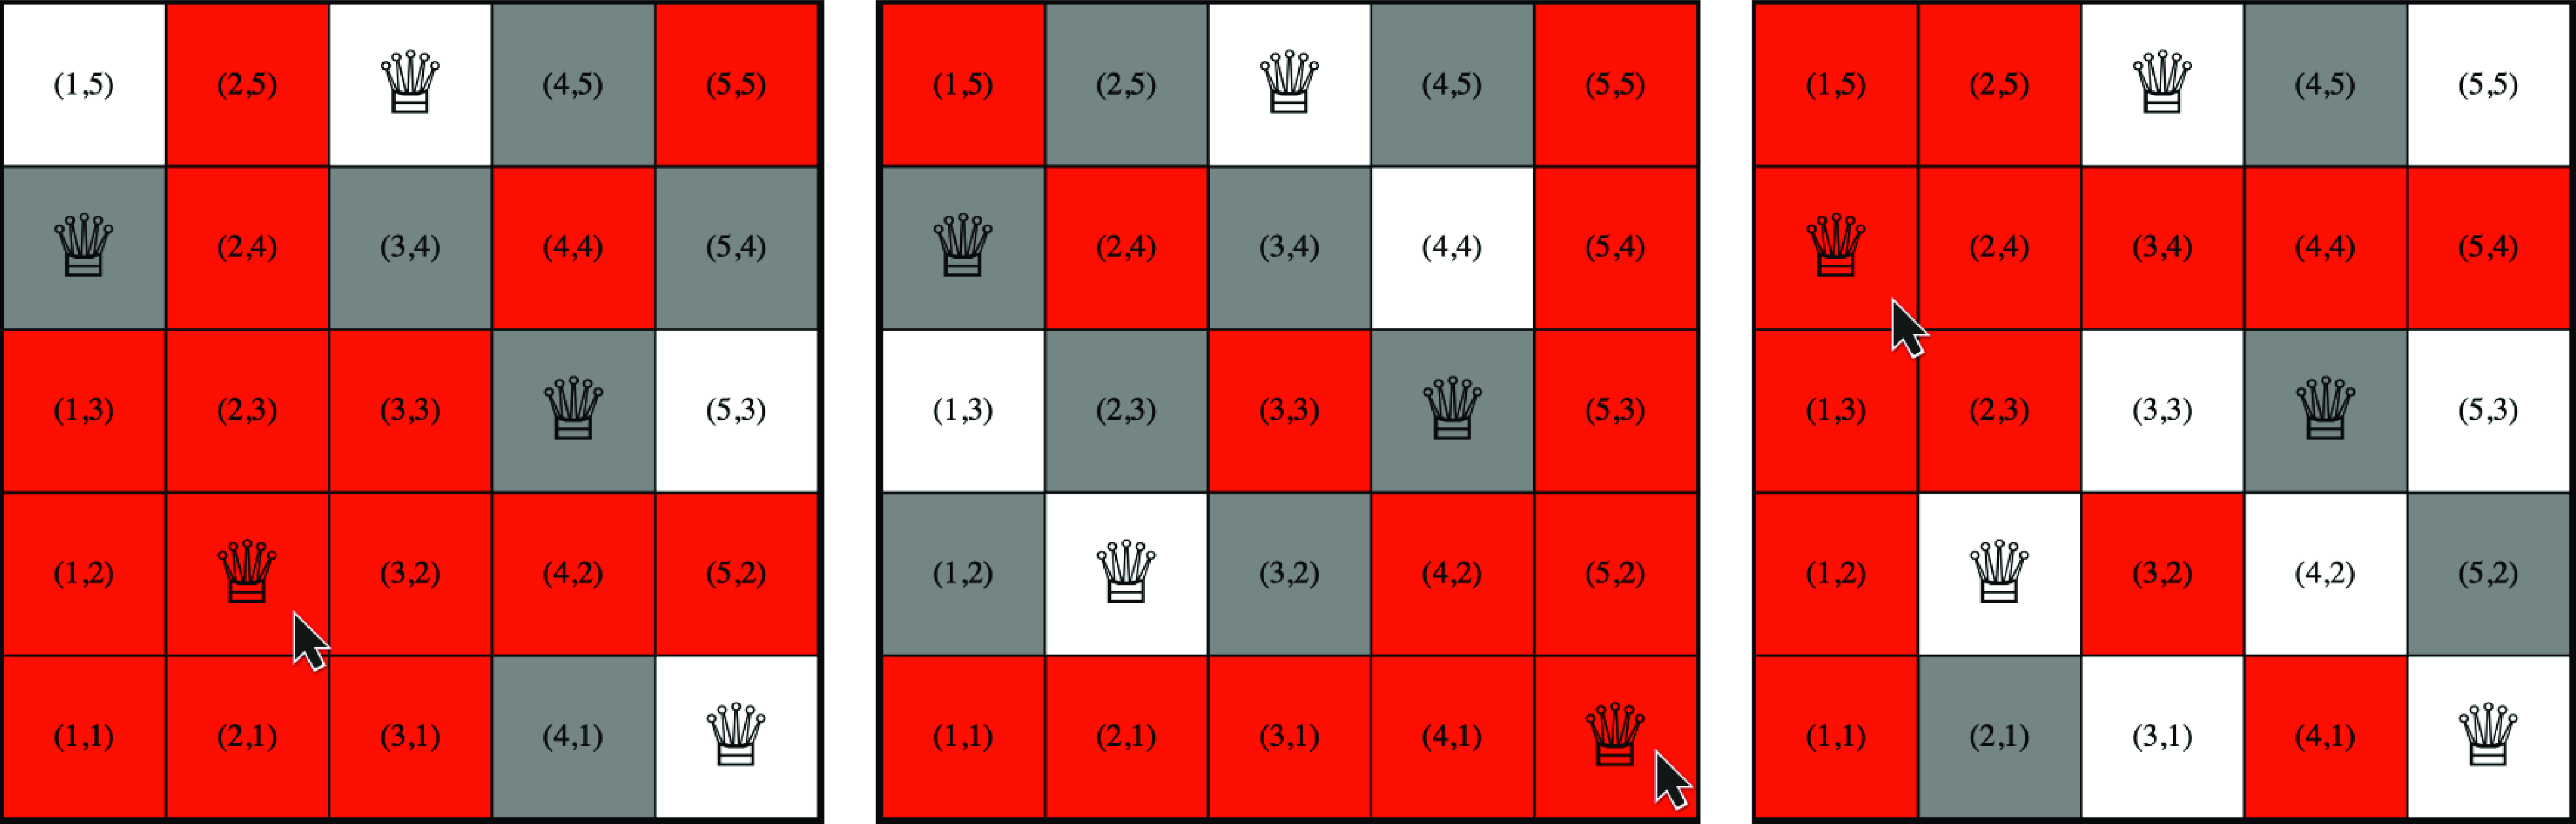
In Table 2, we provide a generic propagator that can be used directly to monitor solving or as a template to create a domain-specific propagator. Basically, ClingraphPropagator class implements the user-defined propagator interface expected by clingo’s Python API. Its instance variables are initialized in Lines 10–12. The viz_encoding variable holds the path of the visualization encoding specific to the problem domain. The propagator uses this encoding to generate the facts defining the graph to visualize each partial assignment, which are stored in the factbases list. Additionally, the instance variable l2s maps each literal used internally by clingo to the corresponding list of atomic symbols from the problem encoding. Specifically, this mapping is formed in Line 17, just before solving process starts, when clingo calls the init function (Line 14) of ClingraphPropagator. Note that in Line 18 the propagator requests the solver to be notified when the truth value of these internal literals changes. Hence, with the help of l2s, the propagator functions can find the corresponding atoms of a solver literal whose truth value has changed during solving.
The propagator class for visualizing solving
The main functionality of the propagator is to compile and prepare partial assignments appearing during various stages of the search process as reified atoms, which are passed to the visualization encoding. Such facts are of the form _true(a), _false(a) and _undefined(a) for each atom a if it is assigned to true, false or neither in the current partial assignment, respectively. The key stages account for times when clingo reaches a fixpoint during unit propagation; decides on a literal; or faces a conflict and is about to backtrack. In each situation, clingo calls the corresponding propagator function propagate (Line 20), decide (Line 51) or undo (Line 35), respectively, and makes the partial assignment accessible to them. Hence, these functions are suitable for preparing the reified atoms of the partial assignment at the time of the call. In the propagate function, for instance, these facts are generated in Lines 23–27 and functions decide and undo have the same corresponding statements. Note that for each solver literal, corresponding atoms are found via the mapping l2s and truth values of such atoms are queried in the current partial assignment in Line 24. Additionally, in each stage we generate the fact _step_type(t,i) where t is either propagate, decide or undo, and i is a natural number identifying the solving step (in Lines 22, 37, and 53). Such facts are required not only to designate the type of the current stage but also to order the visualization of each generated partial assignment. This ordering allows us to represent clingo’s solving process by combining individual graphs as an animation. The functions propagate and undo generate additional facts of the form _change(a), where the truth value assignment to atom a has changed during the propagation (Lines 28–31) or will be undone during backtracking (Lines 44–47), respectively. Similarly, the function decide generates a reified fact of the form _decide(a,p) in Lines 60–63 to represent clingo chooses atom a to have a truth value of true or false depending on p being pos or neg, at a decision point, respectively.
For each solving stage, we process the reified atoms of the active partial assignment with the problem domain’s visualization encoding to generate the facts defining the graph. This is achieved by calling the add_factbase function defined in Lines 68–75 at the end of each solving stage. Each resulting graph facts gets stored in a Factbase object of clingraph’s API in Line 75. Once clingo’s solving is done, we process all Factbase objects accumulated in the propagator using clingraph to generate individual graphs for each of the partial assignments. Finally, we combine these graphs to generate an animation of clingo’s solving process. Unlike the previous examples, we rely on clingraph’s API functions (eg., compute_graphs and save_gif) to carry out these tasks.
To illustrate the process described above, we use the Sudoku puzzle from clingraph’s examples folder.
Footnote 20
In this encoding, we use predicate sudoku(x,y,v) to represent a cell with coordinates (x,y) in a $9\times 9$
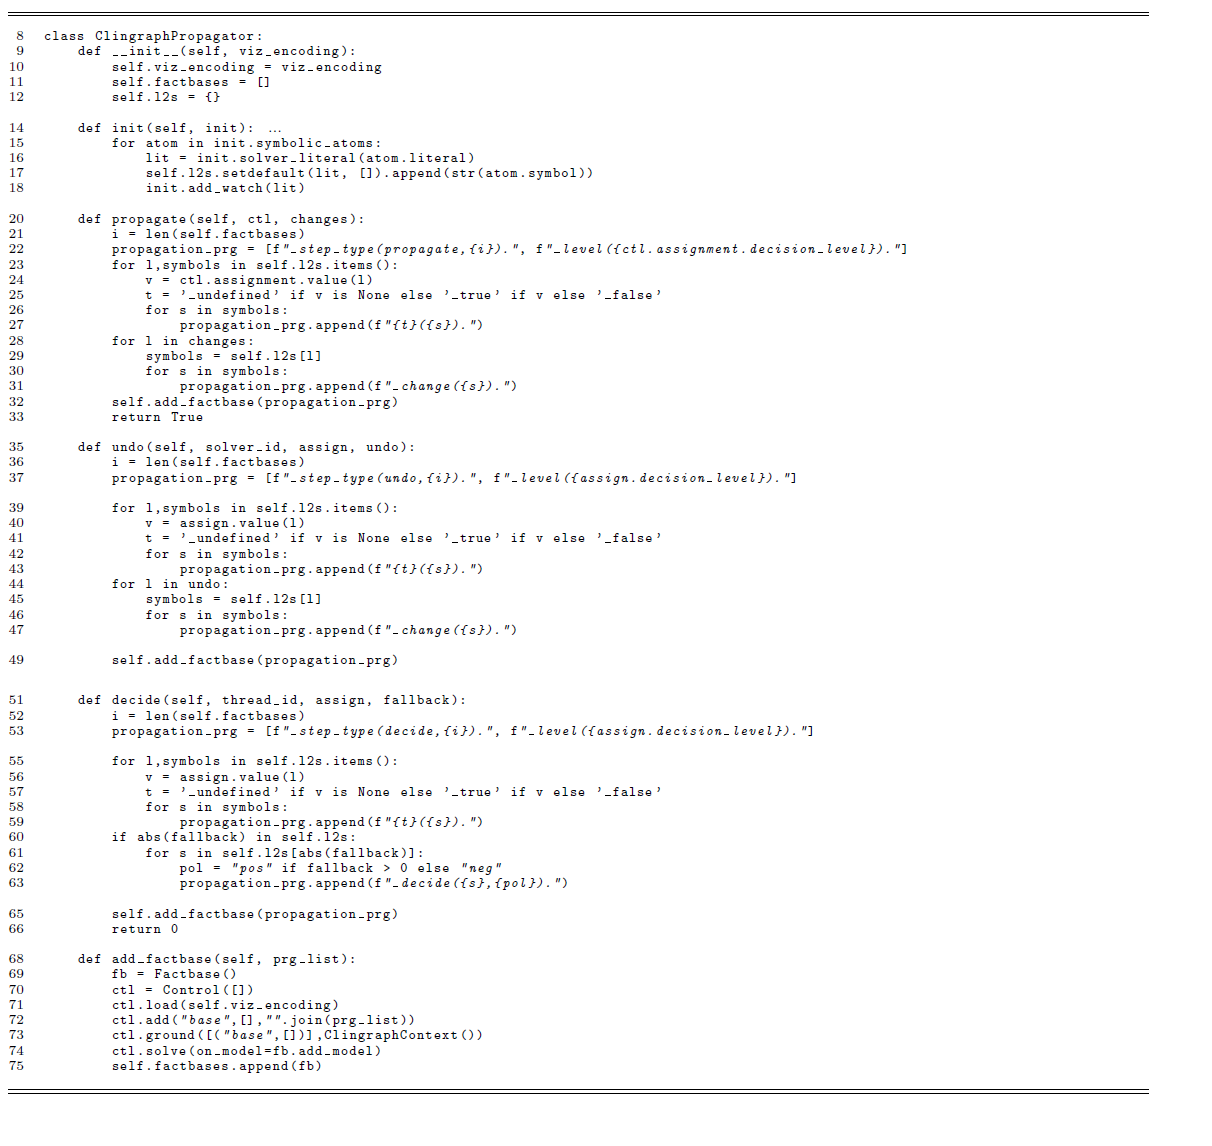
grid with an assigned digit v from 1 to 9. A cell can have an initial value defined in the instance by predicate initial(x,y,v) or it can be empty if no such predicate appears. Then, the problem encoding and instance are handed to clingo’s solving process which is observed by our propagator. Partial assignments accumulated by the propagator are passed to the visualization encoding, which is shown in Table 3. Additionally, Figure 6 depicts the resulting animation’s key frames visualizing the partial assignments reached during solving.
$9\times 9$
grid with an assigned digit v from 1 to 9. A cell can have an initial value defined in the instance by predicate initial(x,y,v) or it can be empty if no such predicate appears. Then, the problem encoding and instance are handed to clingo’s solving process which is observed by our propagator. Partial assignments accumulated by the propagator are passed to the visualization encoding, which is shown in Table 3. Additionally, Figure 6 depicts the resulting animation’s key frames visualizing the partial assignments reached during solving.
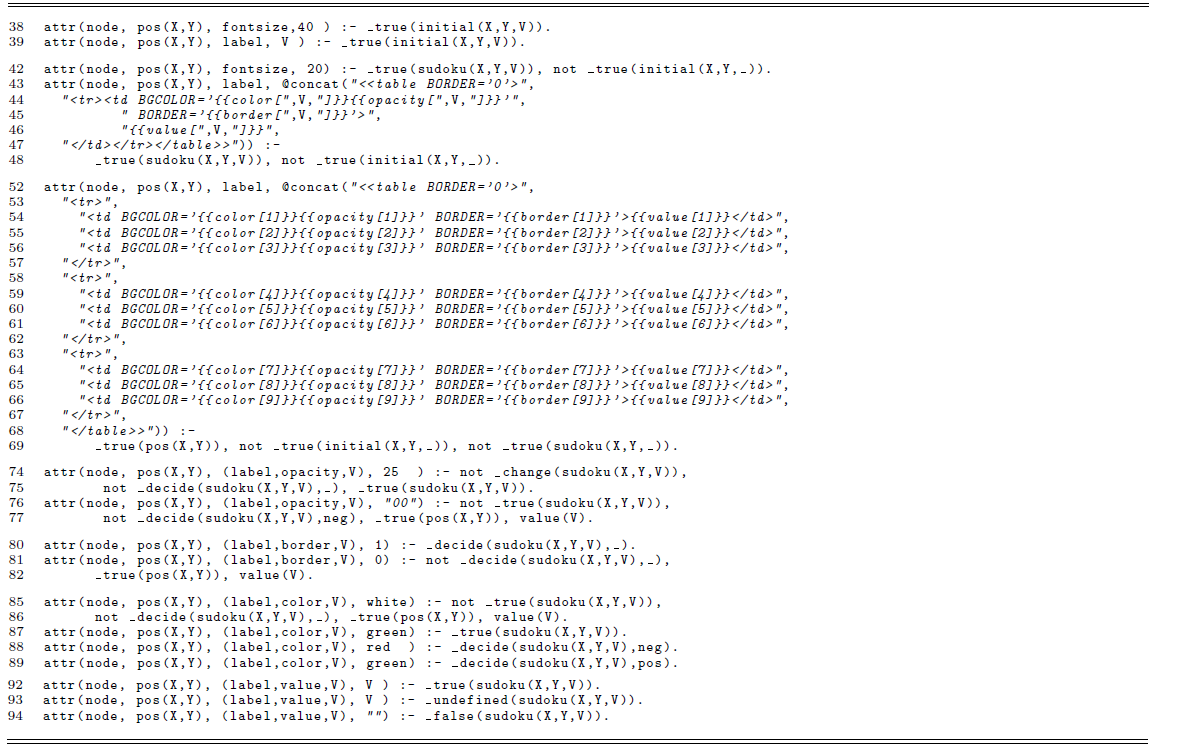
Selected lines from the encoding visualizing Sudoku solving (viz-sudoku-solving.lp)
Visualizations of the stages while solving a Sudoku puzzle.
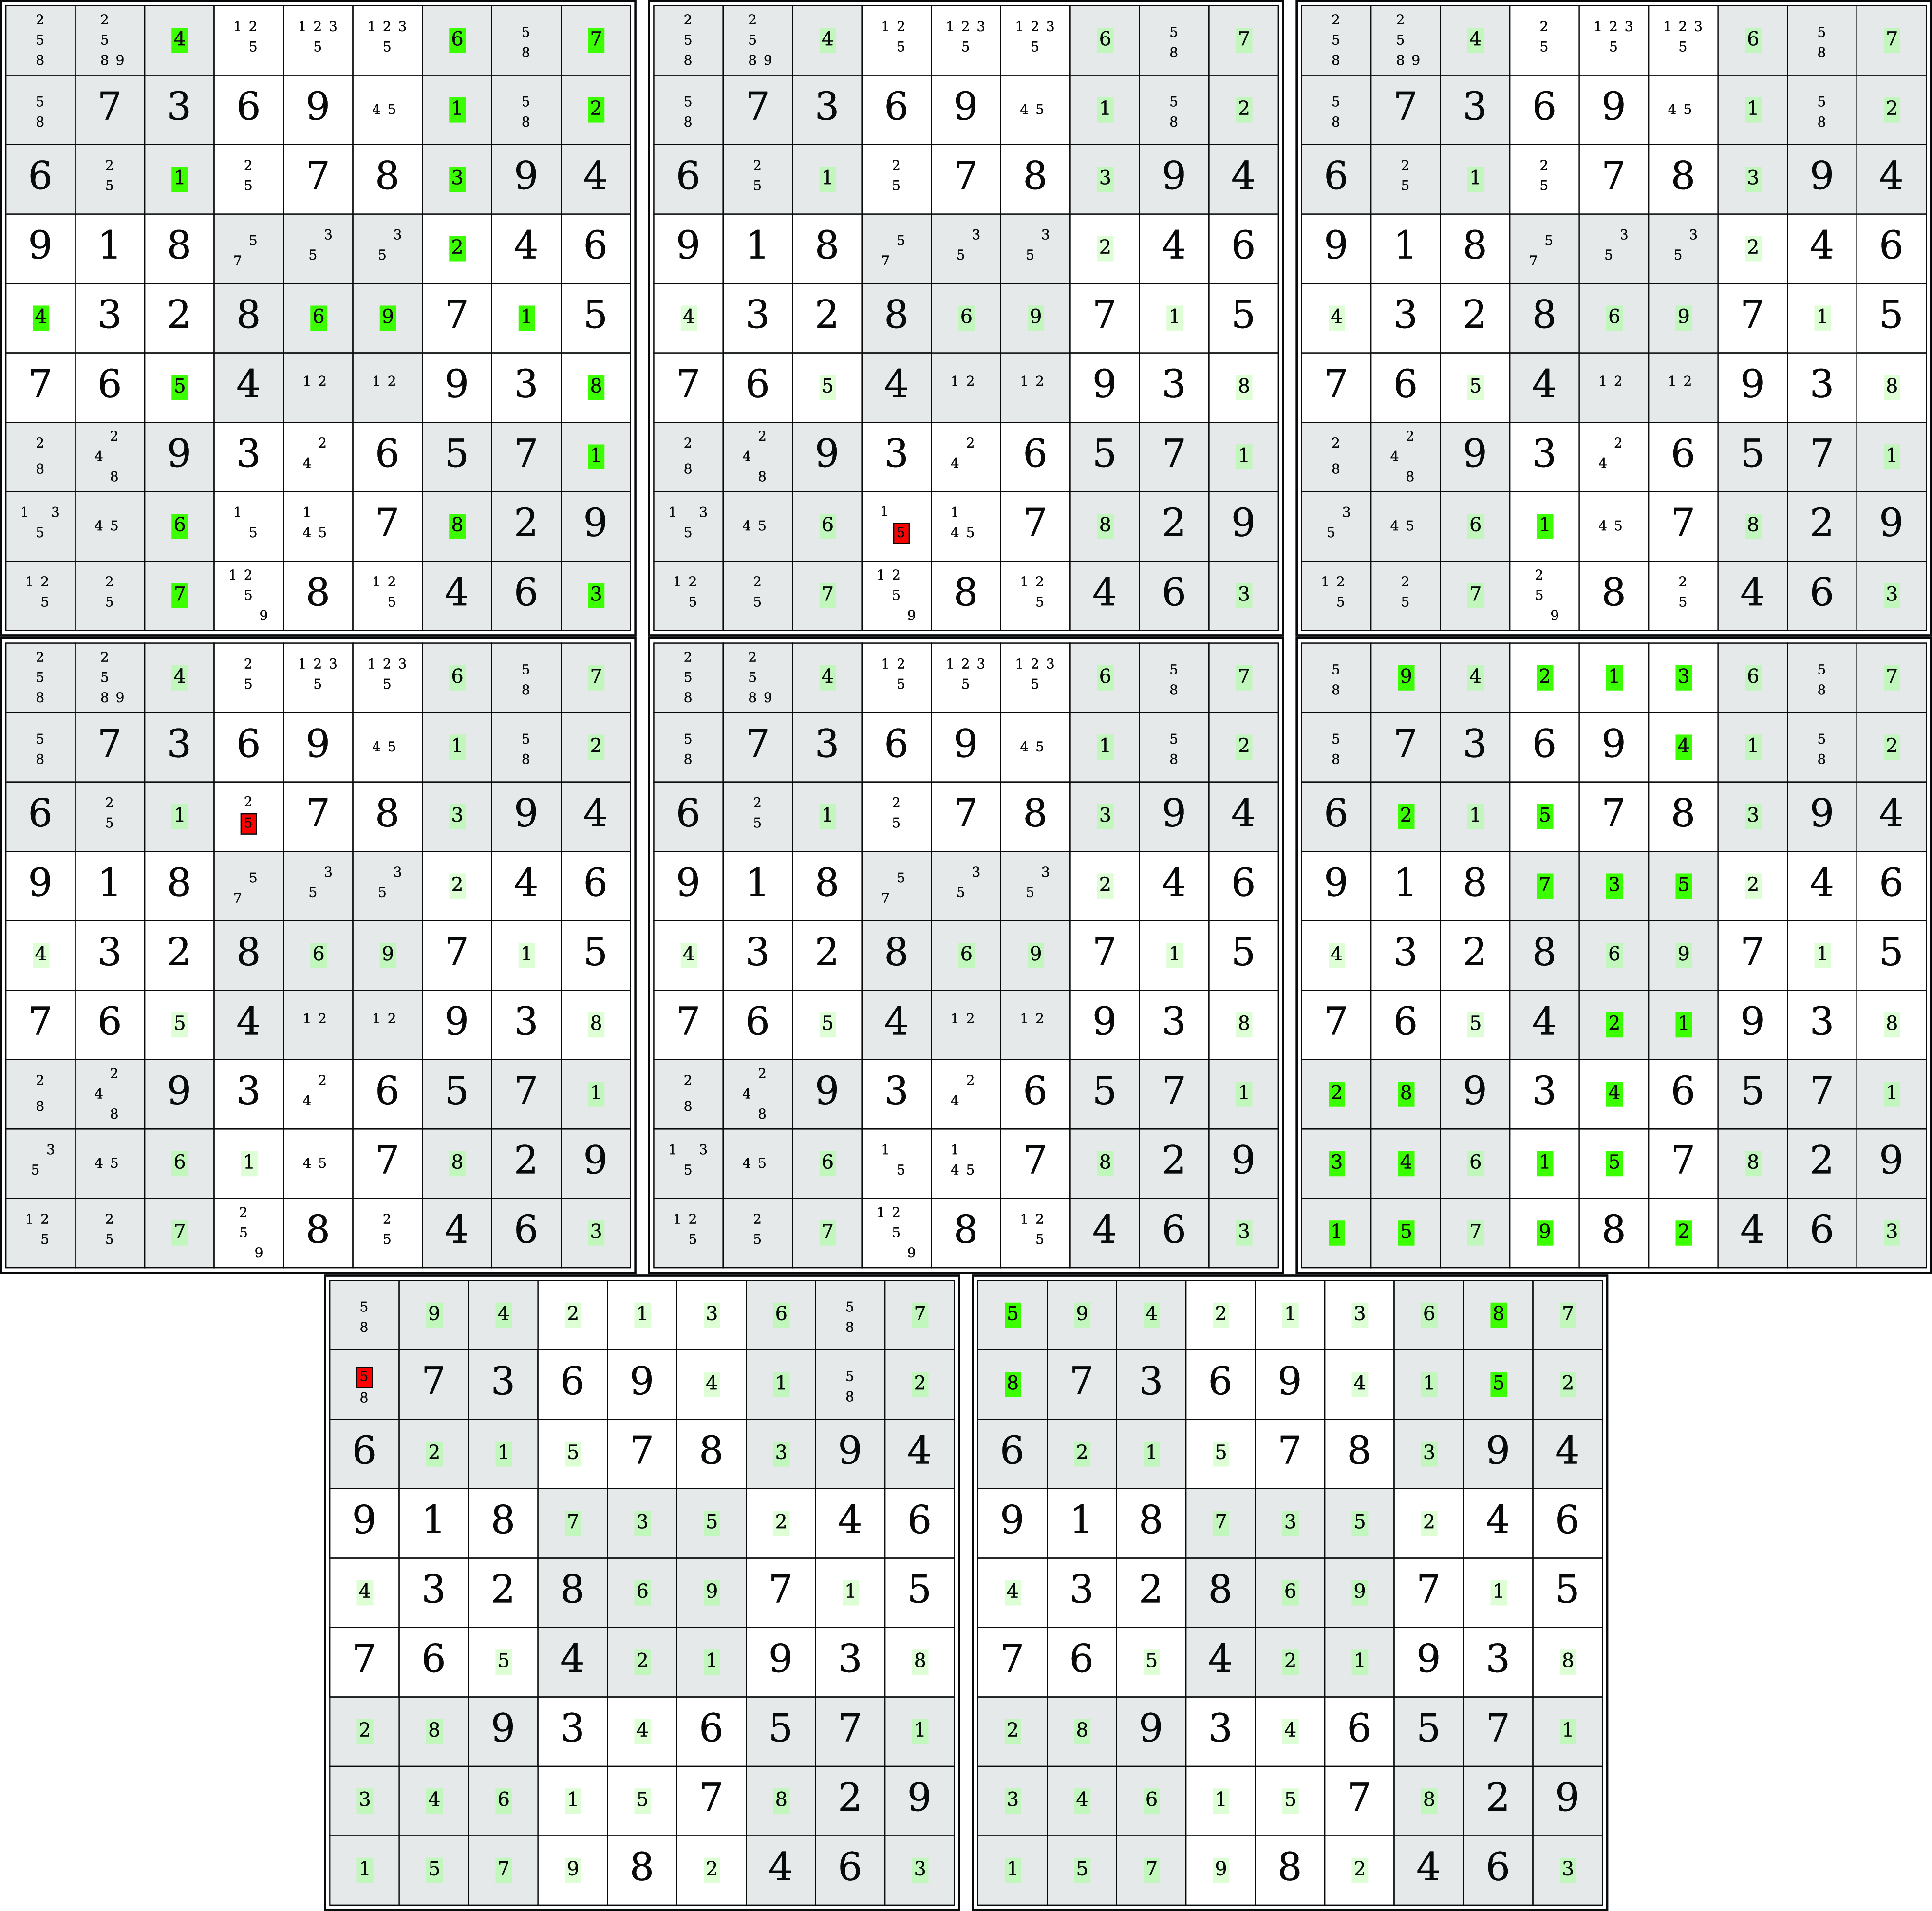
Let us now examine how the frames from Figure 6 are constructed. Each cell with an initial value is visualized by setting the corresponding digit as the label of its node (rule in Line 39 from Table 3) and using a relatively larger font size (rule in Line 38). These rules have the reified literal _true(initial(X,Y,V)) in the body to represent cells with initial values. Notice that facts appearing in the problem input, such as initial(X,Y,V), will always have their truth value set to true. For each node of an empty cell, we construct an HTML-like label that allows us to use rich visual elements like tables with different borders and background colors. In order to ease constructing long HTML-like labels, we rely on template strings (see Section 4). Let us first cover empty cells that must be filled with one specific digit. The HTML-like label for such a cell represents a table having only one slot for the respective digit. The rule in Lines 43–48 generates such a label as a template string by concatenating the constituent strings using the concat external function provided by clingraph. Note that the rule body designates an initially empty cell (captured by the body literal not _true(initial(X,Y,_))) that must be filled with a specific digit (_true(sudoku(X,Y,V))). We set the font size of these cells via the rule in Line 42. An example of this can be found on the third cell in the topmost row of the top leftmost graph in Figure 6, where this initially empty cell is now filled with digit 4 with dark green background. For adding style to such cells, the label template uses variables to represent the color, opacity, border, and value. The values for these variables are obtained through different rules that generate atoms over attr/4. For this specific cell, the RGB code of dark green as the value of variable color[V] is set via the rule in Line 87. Furthermore, the rule in Lines 81–82 assigns value 0 to variable border[V] to avoid setting borders and the rule in Line 92 assigns 4 to value[V]. We also add opacity to the background color codes to highlight changes in the current partial assignment from the ones propagated in previous assignments by reducing the opacity of older ones. In this specific cell, since variable opacity[V] gets empty string as a default value due to absence of any rule generating a specific value for the variable, the opacity of the background color is not modified. The same cell but in the following graph, has a light green background color, which designates that clingo filled it in an earlier propagation step. In order to generate the light green color, in that step variable opacity[V] gets its value 25 via the rule in Lines 74–75. Note that its body literal not _change(sudoku(X,Y,V)) captures the respective cell is not filled in the current partial assignment. These rules generating variable values are also used for the Sudoku cells that have multiple options. We describe such cells below.
The remaining type of cells are those initially empty cells in which more than one digit may appear in a partial assignment. Their HTML-like label represents a 3 $\times$
3 table allowing a slot for each digit from 1 to 9. Our aim is to visualize digits that can possibly appear in such a cell in this tabular form. For instance, the top leftmost graph shows that either 2, 5 or 8 can be placed in the first cell. The rule in Lines 52–69 constructs the label as a template string representing the 3
$\times$
3 table allowing a slot for each digit from 1 to 9. Our aim is to visualize digits that can possibly appear in such a cell in this tabular form. For instance, the top leftmost graph shows that either 2, 5 or 8 can be placed in the first cell. The rule in Lines 52–69 constructs the label as a template string representing the 3 $\times$
3 table. The body literal not _true(sudoku(X,Y,_)) captures these initially empty cells with multiple options. Consider clingo has reasoned that digit d from 1 to 9 cannot appear in an empty cell (x,y) in a partial assignment, which is represented by the reified fact _false(sudoku(x,y,d)) generated by the propagator (e.g., _false(sudoku(1,9,1)) for the cell mentioned above). We do not show d in its respective slot. To this end, template variable value[d] is assigned to empty string via the rule in Line 94. Additionally, its transparent background color is controlled via rules in Lines 85–86 and in Lines 76–77 by setting white to variable color[d] and "00" to variable opacity[d], respectively. Also consider clingo may be undecided on whether digit d is the value of the empty cell or not (e.g., digits 2, 5, and 8 for the cell mentioned above). This is reflected by the fact _undefined(sudoku(x,y,d)) generated by the propagator for a partial assignment. We show d in its respective slot by setting variable value[d] to d this time via the rule in Line 93. Its transparent background is set via the same rules in Lines 85–86 and Lines 76–77. We can also visualize whenever the propagation during solving reaches a fixpoint, and clingo may decide on a truth value of an undefined atom to continue search. For instance, the second graph in the first row of Figure 6 shows such a decision point as digit 5 in red background with a border where clingo selects the atom sudoku(4,2,5) to be false. Its background color and border are set via rules in Lines 88 and 80, respectively. Whenever clingo selects an atom to be true at a decision point, we visualize it as green (rule in Line 89).
$\times$
3 table. The body literal not _true(sudoku(X,Y,_)) captures these initially empty cells with multiple options. Consider clingo has reasoned that digit d from 1 to 9 cannot appear in an empty cell (x,y) in a partial assignment, which is represented by the reified fact _false(sudoku(x,y,d)) generated by the propagator (e.g., _false(sudoku(1,9,1)) for the cell mentioned above). We do not show d in its respective slot. To this end, template variable value[d] is assigned to empty string via the rule in Line 94. Additionally, its transparent background color is controlled via rules in Lines 85–86 and in Lines 76–77 by setting white to variable color[d] and "00" to variable opacity[d], respectively. Also consider clingo may be undecided on whether digit d is the value of the empty cell or not (e.g., digits 2, 5, and 8 for the cell mentioned above). This is reflected by the fact _undefined(sudoku(x,y,d)) generated by the propagator for a partial assignment. We show d in its respective slot by setting variable value[d] to d this time via the rule in Line 93. Its transparent background is set via the same rules in Lines 85–86 and Lines 76–77. We can also visualize whenever the propagation during solving reaches a fixpoint, and clingo may decide on a truth value of an undefined atom to continue search. For instance, the second graph in the first row of Figure 6 shows such a decision point as digit 5 in red background with a border where clingo selects the atom sudoku(4,2,5) to be false. Its background color and border are set via rules in Lines 88 and 80, respectively. Whenever clingo selects an atom to be true at a decision point, we visualize it as green (rule in Line 89).
Ultimately, our animation allows us to analyze different aspects of the solving process of the Sudoku. For instance, the first graph illustrates that during the initial propagation clingo already fills many cells with digits (those having digits with green background) and constrains the remaining empty cells that only possible digits are shown. This can be an indicator of how simple the Sudoku instance is. Finally, when we reach the last graph (bottom rightmost) passing through various stages of solving in order, we get an answer set representing a solution of the puzzle instance.
3.5 Visualizing the program structure
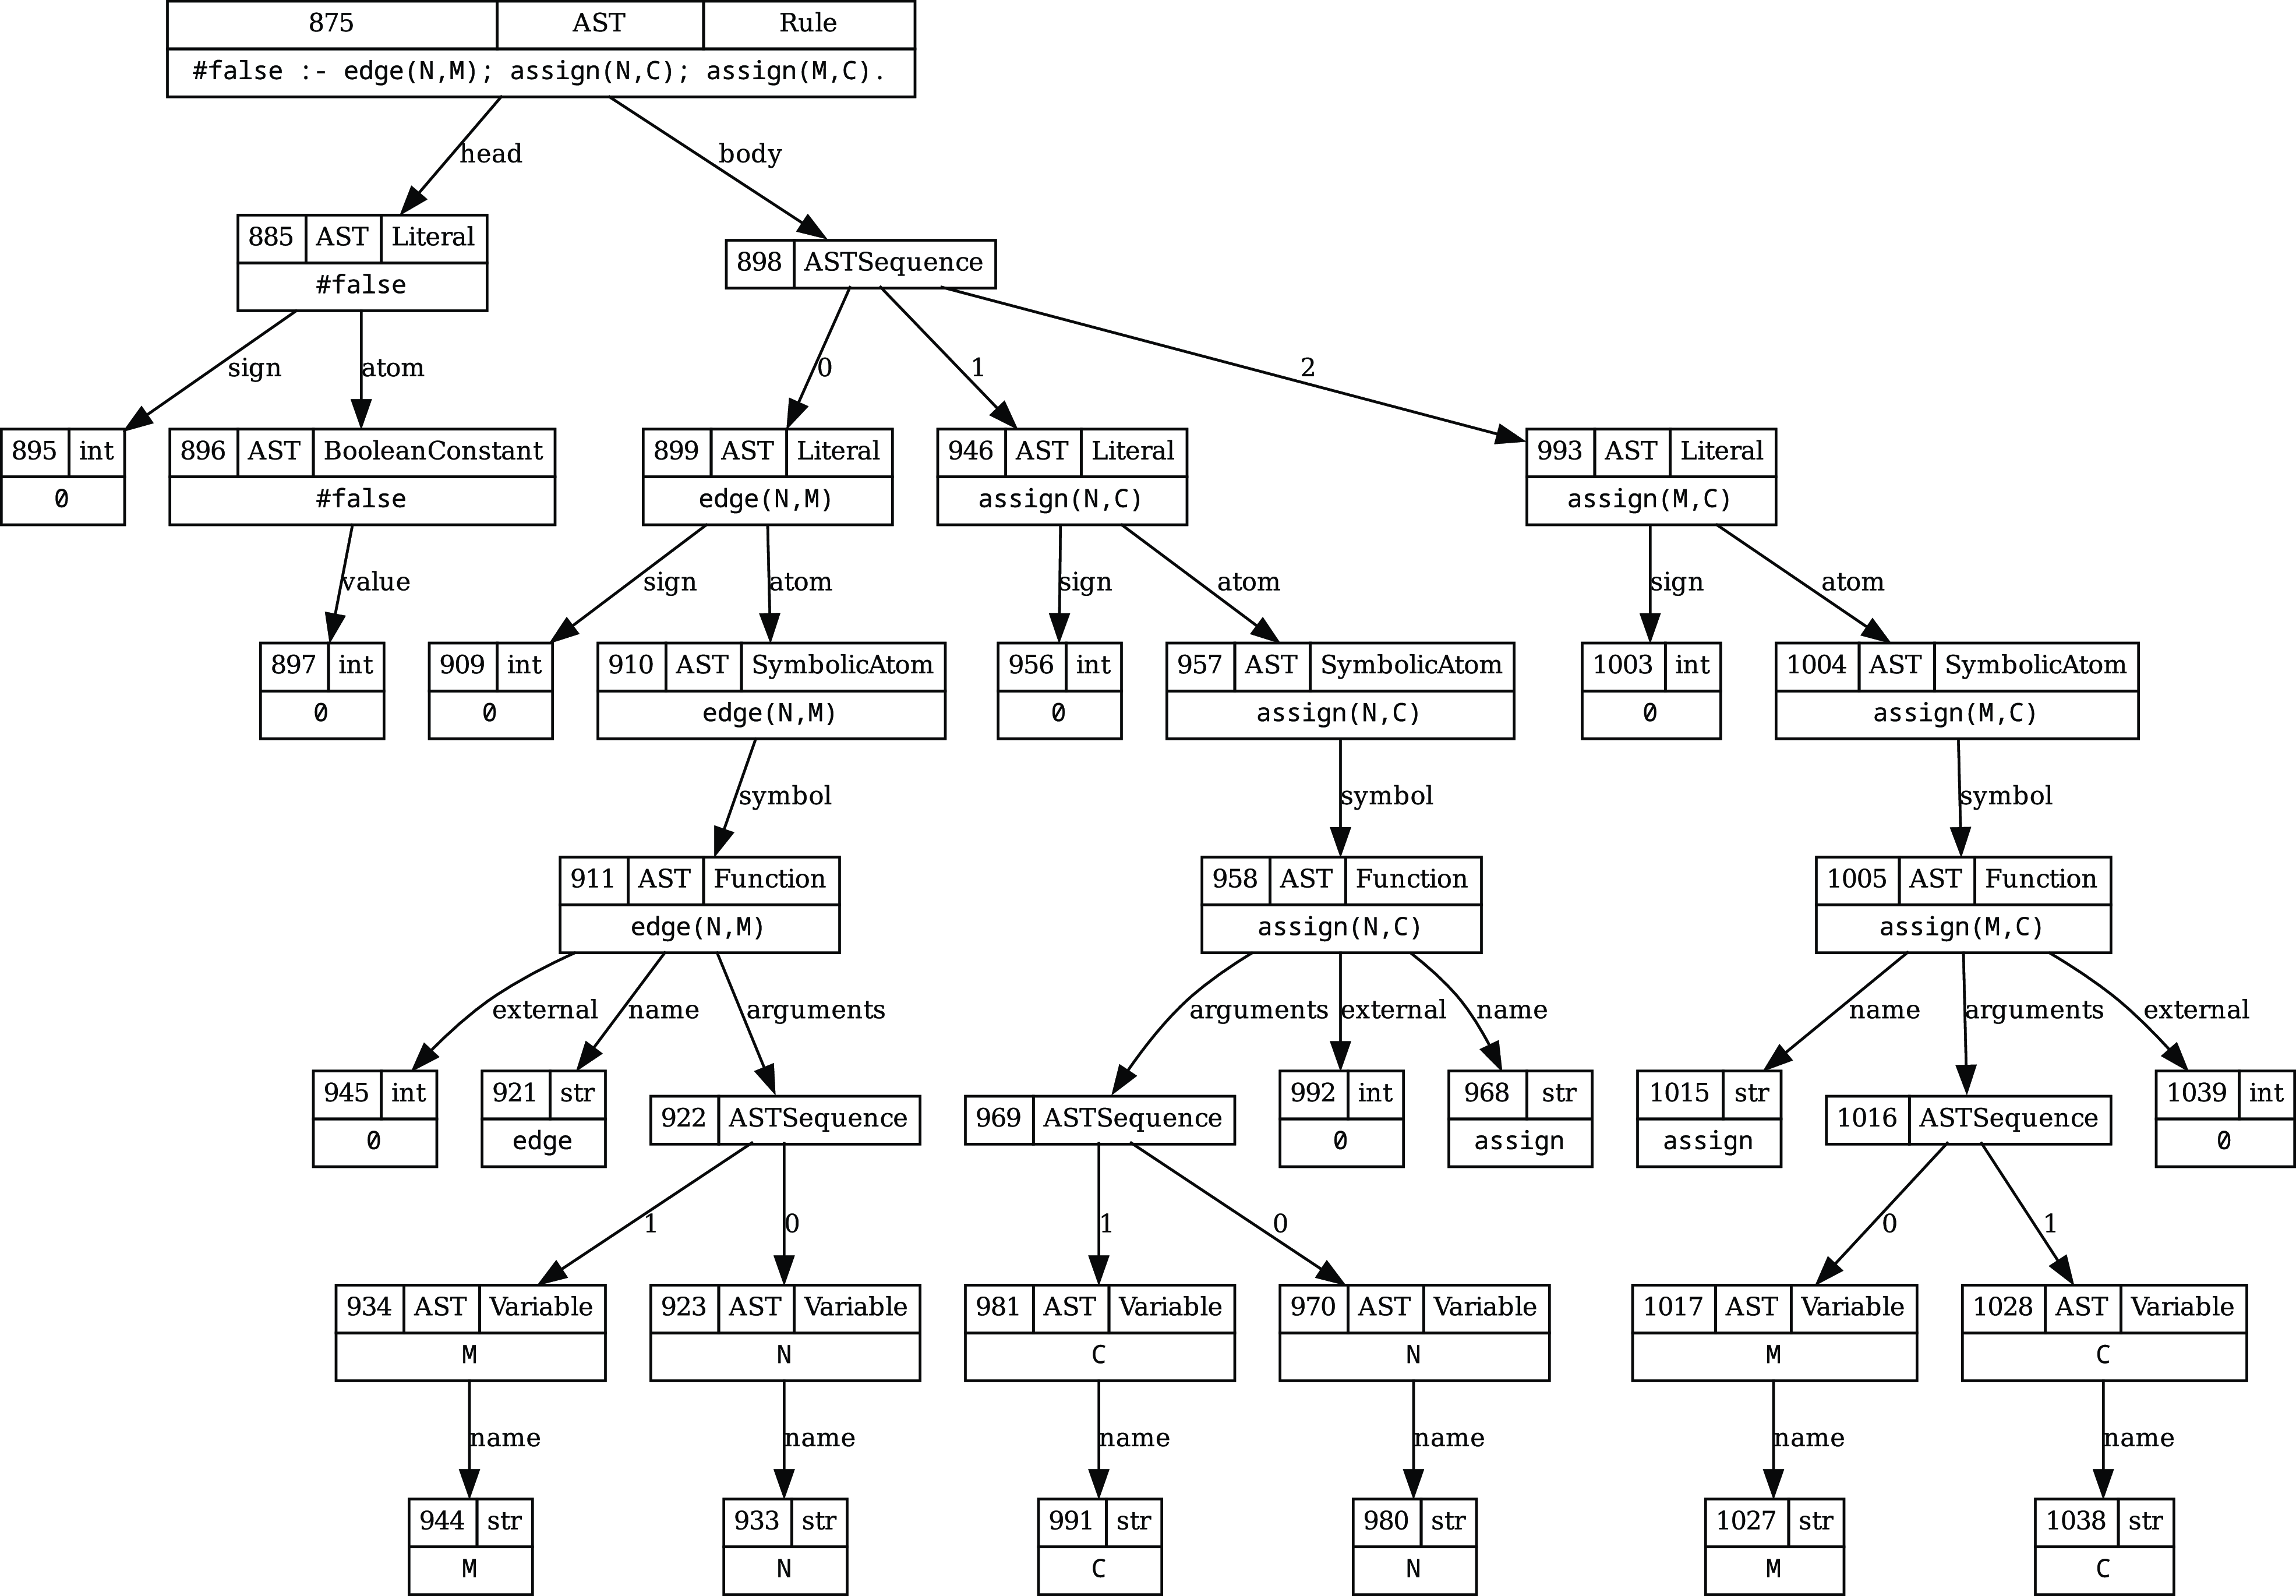
So far, we have visualized the solving process, input, and/or result of a program. However, we may also visualize information about the program itself. In this section, we concentrate on the abstract syntax tree (AST) of a program, as it is accessible via the clingo.ast module of clingo’s Python API. Visualizing a program’s AST eases the understanding of its internal structure. This is of particular interest when dealing with non-ground programs. To this end, we follow a three-stage process. First, we translate the AST into an intermediate fact format using a simple Python script called reify_ast.py. Then, we employ a visualization encoding to convert these facts into clingraph’s format. Finally, we run clingraph to render the graph. All examples can be found in clingraph’s repository. Footnote 21
Partial translation of the program in Listing 1 into our intermediate fact format
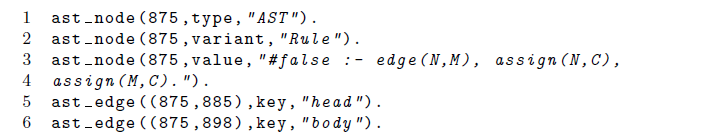
Our intermediate fact format uses two predicates: ast_node/3 and ast_edge/3 represent the nodes and edges in an AST. These predicates are meant to be semantic triples, linking a subject, in our case a node or edge, via a key to a value. This is inspired by the representation of graph data, as used in the Resource Description Framework Footnote 22 . To illustrate how ASTs are stored in terms of triples, let us look at the translation of the program in Listing 1. It is partially depicted in Listing 7 and may be obtained by running reify_ast.py color.lp.
Nodes are represented by unique integers which are arbitrarily chosen by our script. Edges are identified using the integers of the adjacent nodes. Line 1 tells us that a node 875 exists and that it stands for an instance of the class clingo.ast.AST in the Python API of clingo. The other possible types are ASTSequence, Location, Position, Symbol, int, str and None. They cover the respective classes in clingo.ast and the necessary basic types in Python. If the type of a node is AST, declaring a variant as in Line 2 is mandatory. The variant reflects the clingo.ast.ASTType of each instance of clingo.ast.AST. The possible variants include Rule, Variable, SymbolicAtom, and many more. Line 4 assigns a value to node 875, in this case a string representing the rule represented by node 875. Lines 5 and 6 reflect two outgoing edges of node 875, named head and body. As the names suggest, these edges point to nodes capturing the head and body of the rule.
Selected lines from the encoding visualizing the AST (viz-ast.lp)
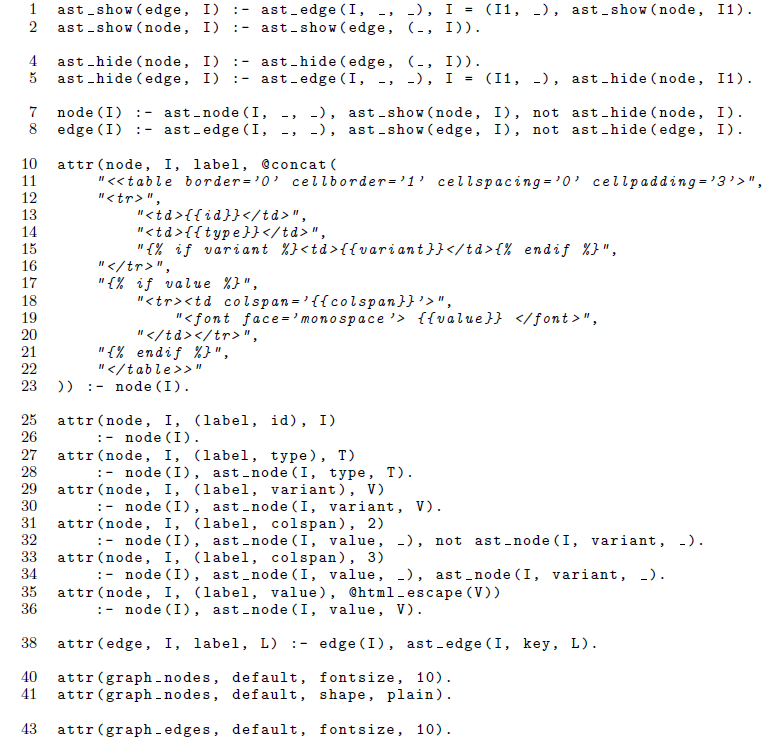
In order to translate the output of our script into the input format of clingraph, we employ a visualization encoding, assembling an HTML-like label including all the data stored in the semantic triples. Its main component is the template (see Section 4) shown in Listing 8 from Lines 10 to 23. Given that even small programs have large syntax trees, our encoding provides functionalities (Lines 1–5) to show and hide subtrees. For instance, using ast_show(node, 875). guarantees that only the subtree of node 875 is shown, while the rule
allows us to hide any subtree that is rooted at a node of type Location. Calling
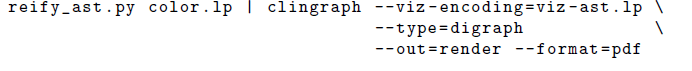
with the above line in the visualization encoding instructs clingraph to render the graph shown in Figure 7.
A partial visualization of the AST of the program in Listing 1.
Showing the AST is by far not the only option to visualize a program’s structure. In principle, clingraph may render any structured knowledge about the program provided that a reification format, a tool generating it, and a visualization encoding exists. To this end, our case study may serve as a blueprint for future ideas.
4 Formatting attributes with templates
Generating complex string values for attributes can become quite cumbersome, especially when dealing with HTML-like labels.
Footnote 23
This type of graphviz labels are formed by an HTML string delimited by <…> which gives a lot of flexibility for formatting the text and generating tables. We simplify the generation of such strings by using the template engine Jinja.
Footnote 24
Attribute values can then be seen as Jinja templates, which are rendered using the variables provided by atoms of the form attr(t,id,(n,v),x). In these atoms, the third argument is a pair indicating that variable $\mathit{v}$
has value
$\mathit{v}$
has value $\mathit{x}$
when rendering the template of attribute
$\mathit{x}$
when rendering the template of attribute $\mathit{n}$
. Furthermore, we can encapsulate values in dictionary variables by using triples instead, where (n,v,k) indicates that variable
$\mathit{n}$
. Furthermore, we can encapsulate values in dictionary variables by using triples instead, where (n,v,k) indicates that variable $\mathit{v}$
is a dictionary with entry
$\mathit{v}$
is a dictionary with entry $\{k:x\}$
. When no template is provided, the values of all the variables are concatenated.
$\{k:x\}$
. When no template is provided, the values of all the variables are concatenated.
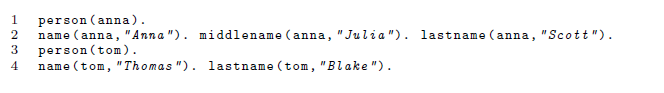
For illustration, we visualize the data of people, defined by predicates person/1, name/1, middlename/1 and lastname/1 (see Listing 10 for an example). We visualize the data using HTML-like labels to generate the tables in Listing 9. Line 1 generates a node for each person and Line 2 removes the shape of the node (no shape is needed since the label is a table). Lines 3–7 define the template for the label using the HTML tags <table>, <tr>, <td> and <b> to construct a table, row, cell, and boldface text, respectively. Variables are enclosed in double braces … and corresponding values are substituted by Jinja for these variables. The rules in Lines 8–11, for instance, generate atoms of attr/4 to populate values for the template variables. Lines 8 and 11 use a pair to assign N to the variable $\mathit{id}$
and the last name to
$\mathit{id}$
and the last name to $\mathit{lastname}$
. Unlike, Lines 9 and 10 use a triple, making the variable
$\mathit{lastname}$
. Unlike, Lines 9 and 10 use a triple, making the variable $\mathit{name}$
a dictionary with the keys
$\mathit{name}$
a dictionary with the keys $\mathit{first}$
and
$\mathit{first}$
and $\mathit{middle}$
, which is accessed in the template as
$\mathit{middle}$
, which is accessed in the template as $\mathit{name['first']}$
and
$\mathit{name['first']}$
and $\mathit{name['middle']}$
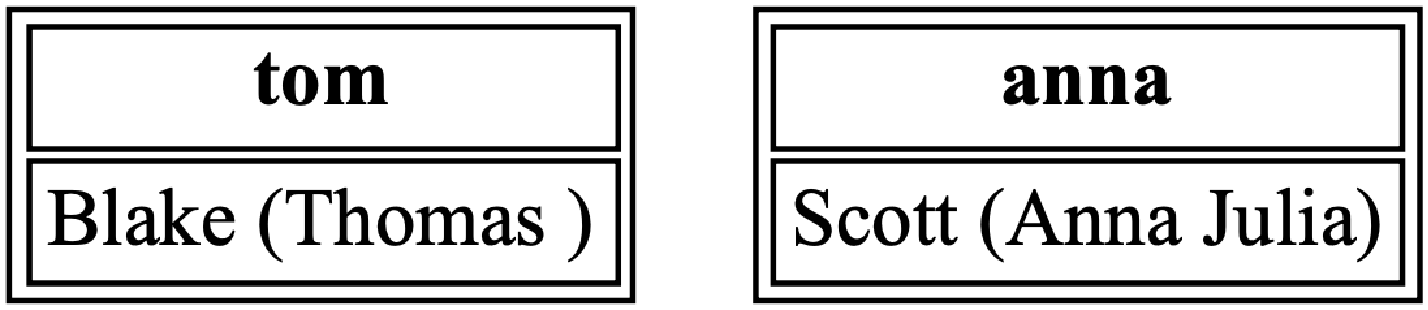
, respectively. The output of this encoding together with the instance defined in Listing 10 is shown in Figure 8.
$\mathit{name['middle']}$
, respectively. The output of this encoding together with the instance defined in Listing 10 is shown in Figure 8.
Visualization encoding to exemplify the generation of strings via templates (template.lp).
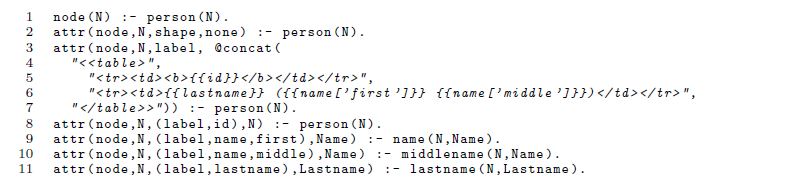
Instance for the template example (people.lp).
Example of HTML-like labels using attribute templates.
It is produced by means of the following instruction:
Jinja’s syntax of templates also includes statements like conditionals, loops, and several operations. We refer the interested reader to our github repository for more complex examples of clingraph using such features. Footnote 25
5 Related work
Many aspects of clingraph are inspired by previous systems described in the literature. The basic goal – to visualize answer sets by mapping special atoms to graphic elements – traces back to aspviz (Cliffe et al. Reference Cliffe, de Vos, Brain and Padget2008), a command-line application written in Java using the Standard Widget Toolkit (SWT) for rendering. It is capable of rendering two-dimensional graphics with absolute coordinates but does neither allow relative positioning nor graph structures. These features were introduced by kara (Kloimüllner et al. Reference Kloimüllner, Oetsch, Pührer, Tompits, Abreu, Oetsch, Pührer, Seipel, Tompits, Umeda and Wolf2011), a plugin written for the SeaLion IDE. The alternative of using graphviz as a backend was first mentioned by the authors of aspviz and followed up with a rather basic implementation in lonsdaleite. Footnote 26 Another visualizer for answer sets is idpdraw, Footnote 27 although it seems to be discontinued.
The idea of visualizing the solving process was first explored for the nomore system (Bösel et al. Reference Bösel, Linke and Schaub2004) which uses a graph-oriented computational model. For dlv, there exists a graphical tool for developing and testing logic programs (Perri et al. Reference Perri, Ricca, Terracina, Cianni, Veltri, de Vos and Schaub2007) as well as a visual tracer (Calimeri et al. Reference Calimeri, Leone, Ricca, Veltri, de Vos and Schaub2009). In the realms of clingo, visualizing the solving process has been explored using a tweaked version of clasp (König and Schaub Reference König, Schaub, Lamma and Swift2013).
Our system not only integrates ideas from the literature and makes them available for modern ASP systems, but also has some features that have – to the best of our knowledge – never been implemented before. There is a powerful API which makes it easy to include clingraph in custom projects, a multitude of different output formats including LaTeX and animated GIF, and the capacity of integrating a propagator for visualizing the solving process of clingo.
6 Discussion
Clingraph provides essentially an ASP-based front-end to the graph visualization software graphviz. In doing so, it takes up the early approach of aspviz (Cliffe et al. Reference Cliffe, de Vos, Brain and Padget2008) and extends it in the context of modern ASP technology. The advantage of clingraph is that one does not have to resort to foreign programming languages for visualization but rather remains within the realm of ASP. This provides users with an easy interface among logic programs and/or answer sets and their visualization. Moreover, clingraph offers a Python API that extends this ease of interfacing to clingo’s API, and in turn to connect and monitor various aspects of the solving process. The fact-based interface of clingraph makes it readily applicable to any ASP system. For more advanced features, like json output and API functionality, clingraph depends on clingo. Clingraph is open source software and freely available at https://github.com/potassco/clingraph.
Clingraph is a single-shot system mapping logic programs to graphs – no return flow is envisaged. A natural extension is thus to allow for returning user input into the system. This idea is pursued in the system clinguin Footnote 28 (Hahn Reference Hahn2023), which allows for interacting through user interfaces, specified in terms of logic programs. Another avenue of future research is to consider alternatives to graphs for visualization. Candidates of interest are plots and tables but also game descriptions seem possible.
Acknowledgments
This work was supported by DFG grants SCHA 550/11 and 15 as well as BMBF project ISCO with support code KK5291302GR1.


 Open access