


The study of the survival of twins is motivated by the fact that it has a mortality rate different from that of singletons in the general population. Overall (gross) survival is therefore studied as the result of two components of mortality, corresponding to twins as a specific group and to all singletons. It is reasonable to assume that one reason for the mortality rate is specifically due to being a twin. To put it in perspective, one solution would be to censor only deaths independent of being twin, but the cause of death is often unknown and/or not attributable. Under this decomposition, an estimate for twins would be relative survival. The concept of relative survival was introduced by Berkson (Reference Berkson, Walters, Gray and Priestley1942). Berkson and Gage (Reference Berkson and Gage1950) defined the concept more precisely,, but did not suggest a method of calculation (Berkson and Gage, Reference Berkson and Gage1950). The first calculation methods were introduced by Ederer et al. (Reference Ederer, Axtell and Cutler1961) and improved by Hakulinen in Reference Hakulinen1982.
These calculation methods help answer questions such as: Does the mortality risk of twins exceed that of singletons? If so, does it extend beyond early childhood? Ananth et al. (Reference Ananth, Joseph and Smulian2004) studied the trends in twin neonatal mortality rates in the United States, reporting that the main causes for the change in the rate of multiple pregnancies was the evolution of maternal age and use of assisted reproductive techniques. Sensitive to different effects in which biology, medicine and society interact, the twinning rate is a valuable indicator of biological and social changes. Smits and Monden (Reference Smits and Monden2011) focused on analyzing the tendency of twinning across the developing world.
The factors influencing the mortality risk of twins are multiple and relate to biology and demography, and economic, social and behavioral factors (Steenhaut & Hubinont, Reference Steenhaut, Hubinont and Ezechi2012). A study by Guang and Grummer-Strawn (Reference Guang and Grummer-Strawn1993) analyzed survival among twins in developing countries. However, a major disadvantage of this study was the integration of data from 29 countries into a single base, which largely cancels the heterogeneity among countries, despite the fact that they tried to remedy this problem by controlling (integrating) the characteristics of the countries, such as region, gross national product (GNP) per capita, and proportion of women who were illiterate.
For the Arab world as a whole, no such studies have been undertaken, and this study aims to fill this research gap. The studies we did find were quite old; for example, for the only study conducted in Tunisia by Suchindran and Adlakha (Reference Suchindran and Adlakha1985), we found general topics for child mortality. We note the study of Fawzi et al. (Reference Fawzi, Herrera, Spiegelman, el Amin, Nestel and Mohamed1997), who undertook a prospective study of malnutrition in relation to child mortality in the Sudan. For Iraq, a study on child mortality (Awqati et al., Reference Awqati, Ali, Al-Ward, Majeed, Salman, Al-Alak and Al-Gasseer2009) analyzed their causes and differentials, but this study was limited to the period 1994–1999 and took place in the context of war and sanctions on Iraq. In this study, we obtained samples from six Arab countries — Algeria, Egypt, Iraq, Mauritania, Sudan and Tunisia — based on the Multiple Indicator Cluster Survey (MICS) database (UNICEF, 2018). Among these six countries, Iraq was the exception, given the pooled and security events in this country during the period 1970–2001, including the Iraq–Iran war (1980–1988), the Gulf War (1990–1991) and boycotting imposed on the Iraqi system and economy. Several studies have been realized in this context (see Ascherio et al., Reference Ascherio, Chase, Cote, Dehaes, Hoskins, Laaouej and Zaidi1992; Awqati et al., Reference Awqati, Ali, Al-Ward, Majeed, Salman, Al-Alak and Al-Gasseer2009; Garfield & Waldman, Reference Garfield and Waldman2003; Roberts et al., Reference Roberts, Lafta, Garfield, Khudhairi and Burnham2004).
As mentioned, in the Arab world, no studies have addressed twins’ mortality risk or have at least focused on the study of twins. We believe that our study is the first step in this area of research. The hypothesis we will test is that the risk of twins dying exceeds that of singletons in all six countries. Social and economic factors could be factors in the excess mortality of twins. Using 306,966 observations from the MICS database of six Arab countries, we test whether variations in social and economic development affect twin mortality. Our measures of social and economic development are proxy by the level of education and wealth index in five countries; for Egypt, we used a dummy variable of working for cash or not. The demographic factors are infant sex and mother’s age at birth.
The rest of the article is organized as follows. In the next section, the statistical methods and database used are presented. The third section presents the results of the analysis and discussion. Finally, the conclusion recapitulates the results of this work.
Methodology and Data
Statistical Methods
Survival time can be defined as the time elapsed until the appearance of an event of interest. Indeed, these data are often collected partially, in particular because of the processes of censorship and truncation (Jong & Mara, Reference Jong and Mara2004). The survival function, S(t), is the probability of surviving beyond time t, defined as:
 $$S\left( t \right) = P\left( {X > t} \right) = \int_t^\infty {f\left( x \right)dx,t \ge 0} .$$
(1)
$$S\left( t \right) = P\left( {X > t} \right) = \int_t^\infty {f\left( x \right)dx,t \ge 0} .$$
(1)
S(t) is a decreasing function, and the average survival time expressed follows from the distribution function F(t), which is complementary to S(t), F(t) = 1 – S(t):
 $$F\left( t \right) = P\left( {X \le t} \right) = \int_0^t {f\left( x \right)dx}$$
Risk Function λ(t)
Risk function characterizes the probability of dying in a small time interval after t, conditional on having survived up to time t (i.e., the risk of instant death of those who survived).
 $$\lambda \left( t \right) = lim{_{h \to 0}}{{P(t \le X \le t + h/X \ge t)} \over h} = {{f(t)} \over {S(t)}} = - {{S{{\left( t \right)}^{'}}} \over {S\left( t \right)}} = - \left[ {linS\left( t \right)} \right]'$$
(2)
$$\lambda \left( t \right) = lim{_{h \to 0}}{{P(t \le X \le t + h/X \ge t)} \over h} = {{f(t)} \over {S(t)}} = - {{S{{\left( t \right)}^{'}}} \over {S\left( t \right)}} = - \left[ {linS\left( t \right)} \right]'$$
(2)
An alternative for estimating net survival, that is, survival if the only causes of death are related to being twin, but without the need to know whether the cause of death was attributable to the pathology, was provided by the relative survival model. Indeed, the survival observed in the study group So (t) is corrected by the expected survival, Se (t), estimated from a control group.
 $${S_r}\left( t \right) = {{{S_o}\left( t \right)} \over {{S_e}\left( t \right)}}$$
(3)
$${S_r}\left( t \right) = {{{S_o}\left( t \right)} \over {{S_e}\left( t \right)}}$$
(3)
This represent a ratio between observed survival So (t) and expected survival Se (t) in a given time t in the general population for groups of the same age and same sex. The most common methods for estimating expected survival were the Ederer II method (Ederer & Heise, Reference Ederer and Heise1959) and the Hakulinen method (Hakulinen, Reference Hakulinen1982). These methods are based on the calculation of expected survival from the general population and on nonparametric estimation methods. Later, approaches based on the modeling of the risk function appeared.
Several regression approaches have been proposed in the literature: the additive risk models of Mitry et al. (Reference Mitry, Bouvier, Esteve and Faivre2005) and Hakulinen et al. (Reference Hakulinen, Seppä and Lambert2011), and Breslow’s multiplicative risk models and Andersen et al.’s (Reference Andersen, Borch-Johnsen, Deckert, Green, Hougaard, Keiding and Kreiner1985), which proposed a combined modeling of excess mortality and relative mortality, which is a special case of Aalen’s linear risk-additive regression model. In fact, this method is based on the assumption that the twins are subject to two mortality forces: mortality related to be a twin and mortality related to all other causes of death for children (Figure 1).
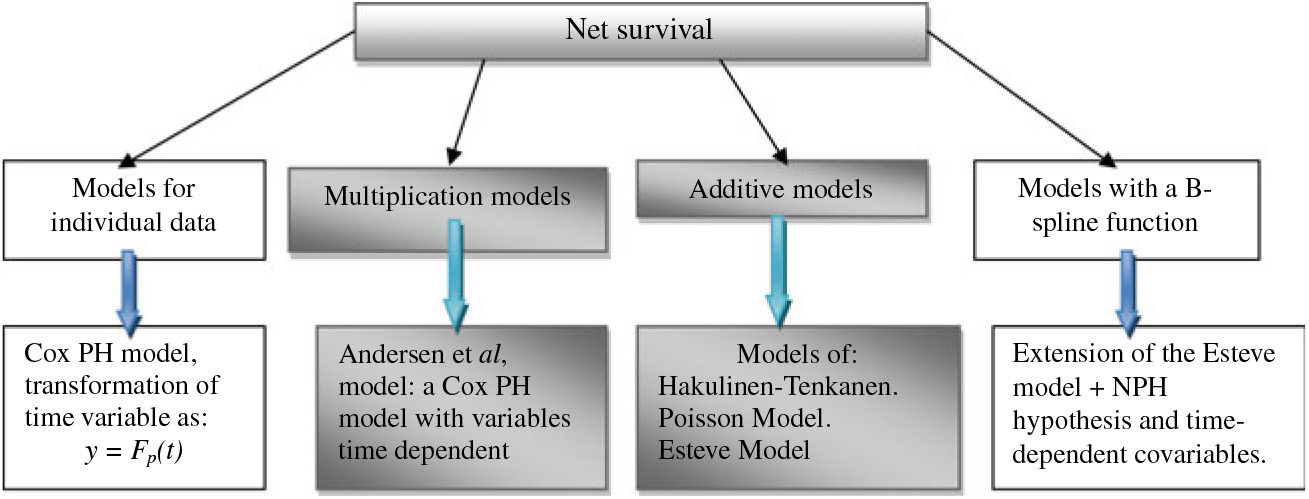
Fig. 1. Estimation methods and models of net survival.
The two main regression models (additive models) of Estève et al. (Reference Estève, Benhamou, Croasdale and Raymond1990) and Hakulinen and Tenkanen (Reference Hakulinen and Tenkanen1987) are both parametric models with proportional hazards, exponential at intervals for the first and discrete for the second. They make it possible to express the excess risk to which the sample studied is subjected. In this study, we used the Estève model, which is based on full maximum likelihood.
Modeling Relative Survival Using a Full Likelihood Approach
Excess mortality is the analogue of mortality in relative survival, and the modeling process was based on this quantity. The total risk of death λ(t; x) at time since birth, t, for twins (with covariate vector x) is modelled as the sum of the expected hazard, λ(t; x)* and the excess hazard due to being a twin, ψ(t; x), that is:
 $$\lambda \left( {t;x} \right) = \lambda {(t;{\rm{}}x)^{\rm{*}}} + \psi \left( {t;x} \right){\rm{}}$$
(4)
$$\lambda \left( {t;x} \right) = \lambda {(t;{\rm{}}x)^{\rm{*}}} + \psi \left( {t;x} \right){\rm{}}$$
(4)
We obtain λ(t; x)* from a table of instantaneous mortality rates of the general population; generally, these tables are stratified on just one variable (i.e., sex). We note (ti , δ i , ai , xi ), i = 1, …, n as sample data of n individuals; ti is the survival time since the birth; the expected hazard λ(t; x)* is obtained from the existing relationship between mortality rates λ i (aj ) at a specific age and the probability of survival pi(j). For the practical needs of this study, it may be considered that
 $${p_i}\left( j \right) = {\left( {1 - {\lambda _i}\left( {{a_j}} \right)} \right)^{\left( {{t_j} - {t_{j - 1}}} \right)}}{\rm{}}$$
(5)
$${p_i}\left( j \right) = {\left( {1 - {\lambda _i}\left( {{a_j}} \right)} \right)^{\left( {{t_j} - {t_{j - 1}}} \right)}}{\rm{}}$$
(5)
For life tables with an age dimension of length, 1, Equation (5) becomes:
 $${p_i}\left( j \right) = 1 - {\lambda _i}\left( {{a_j}} \right){\rm{}}$$
(6)
$${p_i}\left( j \right) = 1 - {\lambda _i}\left( {{a_j}} \right){\rm{}}$$
(6)
ψ(t; x) is modelled using a proportional rate model, constant at intervals of time, which is written as
 $$\psi \left( {t;x} \right) = \eta \left( t \right)exp\left( {\sum\nolimits_{k = 1}^K {{\beta _k}{x_k}} } \right),$$
(7)
$$\psi \left( {t;x} \right) = \eta \left( t \right)exp\left( {\sum\nolimits_{k = 1}^K {{\beta _k}{x_k}} } \right),$$
(7)
With
 $$\eta \left( t \right) = \sum\nolimits_j {{\tau _j}{I_j}\left( t \right)} ,and\left\{ {\matrix{{{I_j}\left( t \right) = 1,{t_{j - 1}} \le {t_i} \le {t_j}} \cr{{I_j}\left( t \right) = 0,{t_{i}} > {t_j}.} \cr}}\right.$$$
Where τ
j
represents a child for whom $\underline {{x_k}} = 0$
, the specific mortality rate in the jth interval (Estève et al., Reference Estève, Benhamou, Croasdale and Raymond1990) illustrates a method for estimating the model in Equation (4) directly from individual-level data using a full maximum likelihood approach. The likelihood function is given as
$\underline {{x_k}} = 0$
, the specific mortality rate in the jth interval (Estève et al., Reference Estève, Benhamou, Croasdale and Raymond1990) illustrates a method for estimating the model in Equation (4) directly from individual-level data using a full maximum likelihood approach. The likelihood function is given as
 $$L\left( {\beta ;{x_i},{t_i},{\delta _i},{a_i}} \right) = \prod\nolimits_{i = 1}^n {exp} \left( { - \int_0^{{t_i}} {\lambda (s,{x_i},{a_i})ds} } \right){\left( {\lambda ({t_i},{x_i},{a_i})} \right)^{{\delta _i}}}$$
(8)
$$L\left( {\beta ;{x_i},{t_i},{\delta _i},{a_i}} \right) = \prod\nolimits_{i = 1}^n {exp} \left( { - \int_0^{{t_i}} {\lambda (s,{x_i},{a_i})ds} } \right){\left( {\lambda ({t_i},{x_i},{a_i})} \right)^{{\delta _i}}}$$
(8)
From Equation (1), the log likelihood is given as:
 $$L\left( {\beta ;{x_i},{t_i},{\delta _i},{a_i}} \right) = = - \sum\nolimits_{i = 1}^n {\left( {\int_0^{{t_i}} {\lambda {{\left( {s,{x_i},{a_i}} \right)}^*}ds} } \right)} - \sum\nolimits_{i = 1}^n {\left( {\int_0^{{t_i}} {\lambda \left( {s;x} \right)ds} } \right)} + \sum\nolimits_{i = 1}^n {{\delta _i}ln\left( {\lambda {{(t;x)}^*} + \psi \left( {t;x} \right)} \right)}$$
(9)
$$L\left( {\beta ;{x_i},{t_i},{\delta _i},{a_i}} \right) = = - \sum\nolimits_{i = 1}^n {\left( {\int_0^{{t_i}} {\lambda {{\left( {s,{x_i},{a_i}} \right)}^*}ds} } \right)} - \sum\nolimits_{i = 1}^n {\left( {\int_0^{{t_i}} {\lambda \left( {s;x} \right)ds} } \right)} + \sum\nolimits_{i = 1}^n {{\delta _i}ln\left( {\lambda {{(t;x)}^*} + \psi \left( {t;x} \right)} \right)}$$
(9)
So,
 $$L\left( {\beta ;{x_i},{t_i},{\delta _i},{a_i}} \right) \propto \sum\nolimits_{i = 1}^n {\left( {\int_0^{{t_i}} {\psi \left( {s;x} \right)ds} } \right)} + \sum\nolimits_{i = 1}^n {{\delta _i}ln\left( {\lambda {{(t;x)}^*} + \psi \left( {t;x} \right)} \right)} $$
(10)
$$L\left( {\beta ;{x_i},{t_i},{\delta _i},{a_i}} \right) \propto \sum\nolimits_{i = 1}^n {\left( {\int_0^{{t_i}} {\psi \left( {s;x} \right)ds} } \right)} + \sum\nolimits_{i = 1}^n {{\delta _i}ln\left( {\lambda {{(t;x)}^*} + \psi \left( {t;x} \right)} \right)} $$
(10)
The contribution of each individual i to the log likelihood is:
 $${L_i}\left( {\beta ;{x_i},{t_i},{\delta _i}} \right) = {\delta _i}ln\left( {\lambda {{(t;x)}^{\rm{*}}} + exp\left( {\mathop \sum \limits_{k = 1}^K {\beta _k}{x_k}} \right)} \right) - {t_i}exp\left( {\mathop \sum \limits_{k = 1}^K {\beta _k}{x_k}} \right).$$
The parameters vector, $\underline {\beta ,}$
are estimated by solving the system equations:
$\underline {\beta ,}$
are estimated by solving the system equations:
 $${{\partial {L_i}\left( {\beta ;{x_i},{t_i},{\rm{}}{\delta _i}} \right)} \over {\partial \beta }} = 0.$$
Similarly, the variance–covariance matrix, Σ
ij $\left( {\underline \beta} \right)$
is given by the following derivatives:
$\left( {\underline \beta} \right)$
is given by the following derivatives:
 $${{\sum}_i}_j\left( {\underline \beta} \right) = {{{\partial ^2}{L_i}\left( {\beta ;{x_i},{t_i},{\delta _i}} \right)} \over {\partial {\beta _i}\partial {\beta _j}}}$$
 $$\propto \mathop \sum \limits_{i = 1}^n \left( {{\delta _i}ln\left( {\lambda {{(t;x)}^{\rm{*}}} + exp\left( {\mathop \sum \limits_{k = 1}^K {\beta _k}{x_k}} \right)} \right) - {t_i}exp\left( {\mathop \sum \limits_{k = 1}^K {\beta _k}{x_k}} \right)} \right)$$
Generally, these models have proportional excess hazards as a special case, but often nonproportional excess hazards are observed. To deal with nonproportionality, we can use a piecewise constant model (Dickman et al., Reference Dickman, Sloggett, Hills and Hakulinen2004), or a fractional polynomials model (Lambert et al., Reference Lambert, Smith, Jones and Botha2005), or splines function (Giorgi et al., Reference Giorgi, Abrahamowicz, Quantin, Bolard, Esteve, Gouvernet and Faivre2003).
Data
The Arab world is located in one of the most strategic regions of the world, extending from the Atlantic Ocean to the Arab Gulf to the east and from the Arabian Sea to Turkey and the Mediterranean to the north (Figure 2). The Arab world covers 10% of the world’s surface (13.5 million km²) and had a population of about 359 million in 2017.
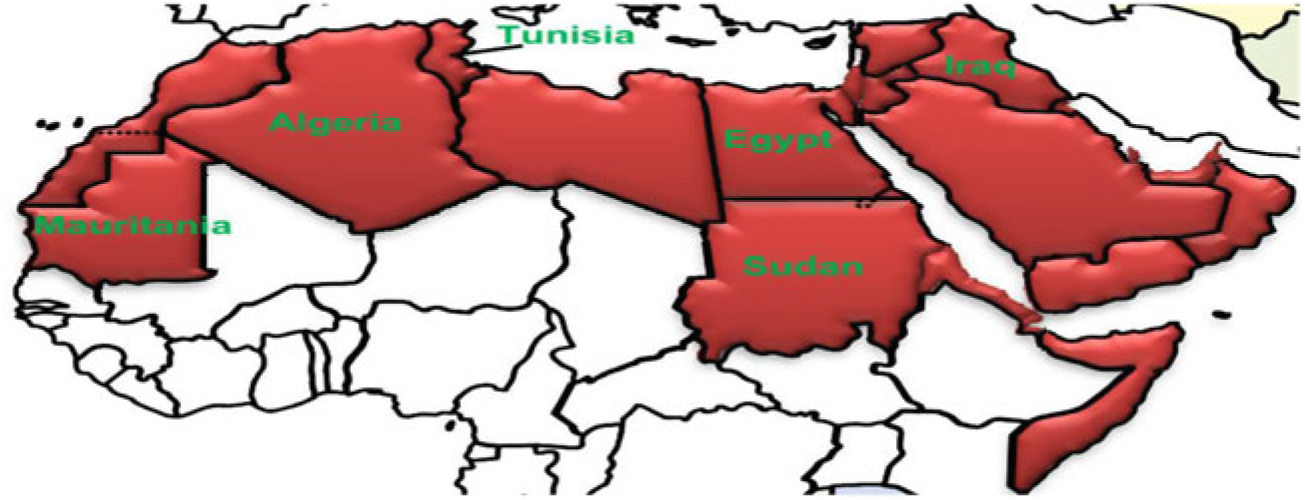
Fig. 2. Geographical locations of countries.
The population growth rate in the Arab world is 2.3%, with the highest growth rate in Oman at 3.48%, the lowest in Lebanon at 1.38% and in Tunisia at 1.15%. The birth rate in the Arab world is 29.38 per 1,000 inhabitants, while the mortality rate is 7.17 per 1,000 inhabitants. The highest infant mortality rate in Somalia is 123.97 per 1,000 live births, and Djibouti has 101.5 deaths per 1,000 live births. The lowest rate is in Kuwait, with 11.82 deaths per 1,000 live births.
This is the first study in the Arab world that focuses on differences in death rates between twins and singletons. As indicated in the Introduction section, we used the MICS database for estimation. The methodology of MICS, which was established by UNICEF (2018), is focused on helping countries to collect and analyze data to fill the gap in data on indicators to monitor the situation of children and women. It has enabled countries to produce statistically robust and internationally comparable estimates for a range of indicators in the areas of health, education, protection and child health, and HIV/AIDS. The findings of MICS have been widely used as a basis for policy and program development, and to raise awareness of the situation of children and women around the world. A summary description of data from the six Arab countries we studied is shown in Table 1.
Table 1. Description of MICS database

Note: Date extracted from MICS4 databases.
The choice of these six Arab countries is not arbitrary, but is based on the ranking according to the Human Development Index (HDI) in 2018 (United Nations, 2018); for high human development, we selected Algeria and Tunisia, for medium development, we selected Iraq and Egypt, and for low development, we selected Mauritania and Sudan. Survival analyses were conducted with R software using relsurv and survival packages (Pohar Perme & Pavlic, Reference Pohar Perme and Pavlic2018), which are publicly available on the R CRAN website.
Variables
The variables in our study were selected based on previous studies on the risk factors for deaths of children in general (Fawzi et al., Reference Fawzi, Herrera, Spiegelman, el Amin, Nestel and Mohamed1997; Mishra et al., Reference Mishra, Ram, Singh and Yadav2017; Selemani et al., Reference Selemani, Mwanyangala, Mrema, Shamte, Kajungu, Mkopi, Mahande and Nathan2014; Suchindran & Adlakha, Reference Suchindran and Adlakha1985) and twins compared to singletons (Ananth et al., Reference Ananth, Joseph and Smulian2004; Guang & Laurance, Reference Guang and Grummer-Strawn1993; Steenhaut & Hubinont, Reference Steenhaut, Hubinont and Ezechi2012). Furthermore, for nonhomogeneous measures in the MICS4 databases for the six countries, we focused our research on these variables: sex of the twin (male: 1, female: 2); birth order of twins within the family as a whole (1st, 2–3, 4–6, +7); mother’s education level (illiterate, primary, secondary, higher); wealth index 1 ; and mother’s age at birth (e.g., <20, 20–29, 30–39, 40–49).
Results and Discussion
For twinning rates in the six countries, the highest rate was recorded in Egypt (2.05%), the lowest in Algeria (1.3%), while the remaining countries have approximately an equal twinning rate. The average rate of twins was 1.5%, which is approximately the same as the United States (Ananth et al., Reference Ananth, Joseph and Smulian2004). Compared with Smits and Monden’s (Reference Smits and Monden2011) study, for Iraq, Mauritania, Tunisia and Sudan, we have approximately the same results. Egypt was an exception, as indicated by a twin rate of 1.8%, because we used a different database and therefore a different sample size; furthermore, Smiths and Monden’s study covered the period 1987–2010, while our study covered the period 1979–2013.
Table 2 describes health, demographic and economic features of the six countries in 2018. In terms of population, Egypt’s population was the highest with 100 million, followed by Algeria with 40 million. Mauritania’s population was the lowest at 4.3 million. If the six countries are ordered according to their current health expenditure per capita (in US$), Algeria is in first position, followed by Tunisia, and Mauritania is last; when ordered according to neonatal mortality rate (per 1,000 live births), the order is inverted, and Mauritania is in first position and Algeria and Tunisia are last. We conclude that there is a negative relationship between these two variables. However, Table 2 shows that the maternal mortality (per 100,000 live births) is very low in Egypt (33), Iraq (50) and Tunisia (62) compared to the level reached by Mauritania (602), Sudan (311) and Algeria (140). Mauritania had the highest level of maternal mortality.
Table 2. Demographic, health and economic characteristics in 2018
Note: Data sourced from World Health Organization (2018).
Despite the fact that the male–female ratio among twins is almost equal, Figure 3 shows that male twins (black line) have a higher risk of dying than female twins (green line); this is true for all countries except Tunisia. Twins are at more risk of dying in the first year of birth than singletons; this risk is higher in households where women are less educated, have a low income level, and whose age is over 40 years (see Tables 3–8). The death risk rates for twins and singletons are recorded for their 10th month in Mauritania, but only for females; male twins maintain the same level of risk during the first year of birth. For Iraq and Tunisia, the interaction of the risk functions of twins and singletons is approximately in the fifth month, with a slight difference between the two sexes. For Algeria, Egypt and Sudan, twins have a higher risk of dying in their first year. Table 9 shows the expected death risk, the relative death risk estimation and the excess rate of deaths of twins; Figure 3 shows the probability of death with the area under the curve, which is calculated on an interval of 365 days. The results in Table 9 confirm that the risk of death rate for twins is higher than that for singletons, and among twins, males have the highest risk rates over the first year of birth, especially in Sudan (0.214) and Mauritania (0.184).
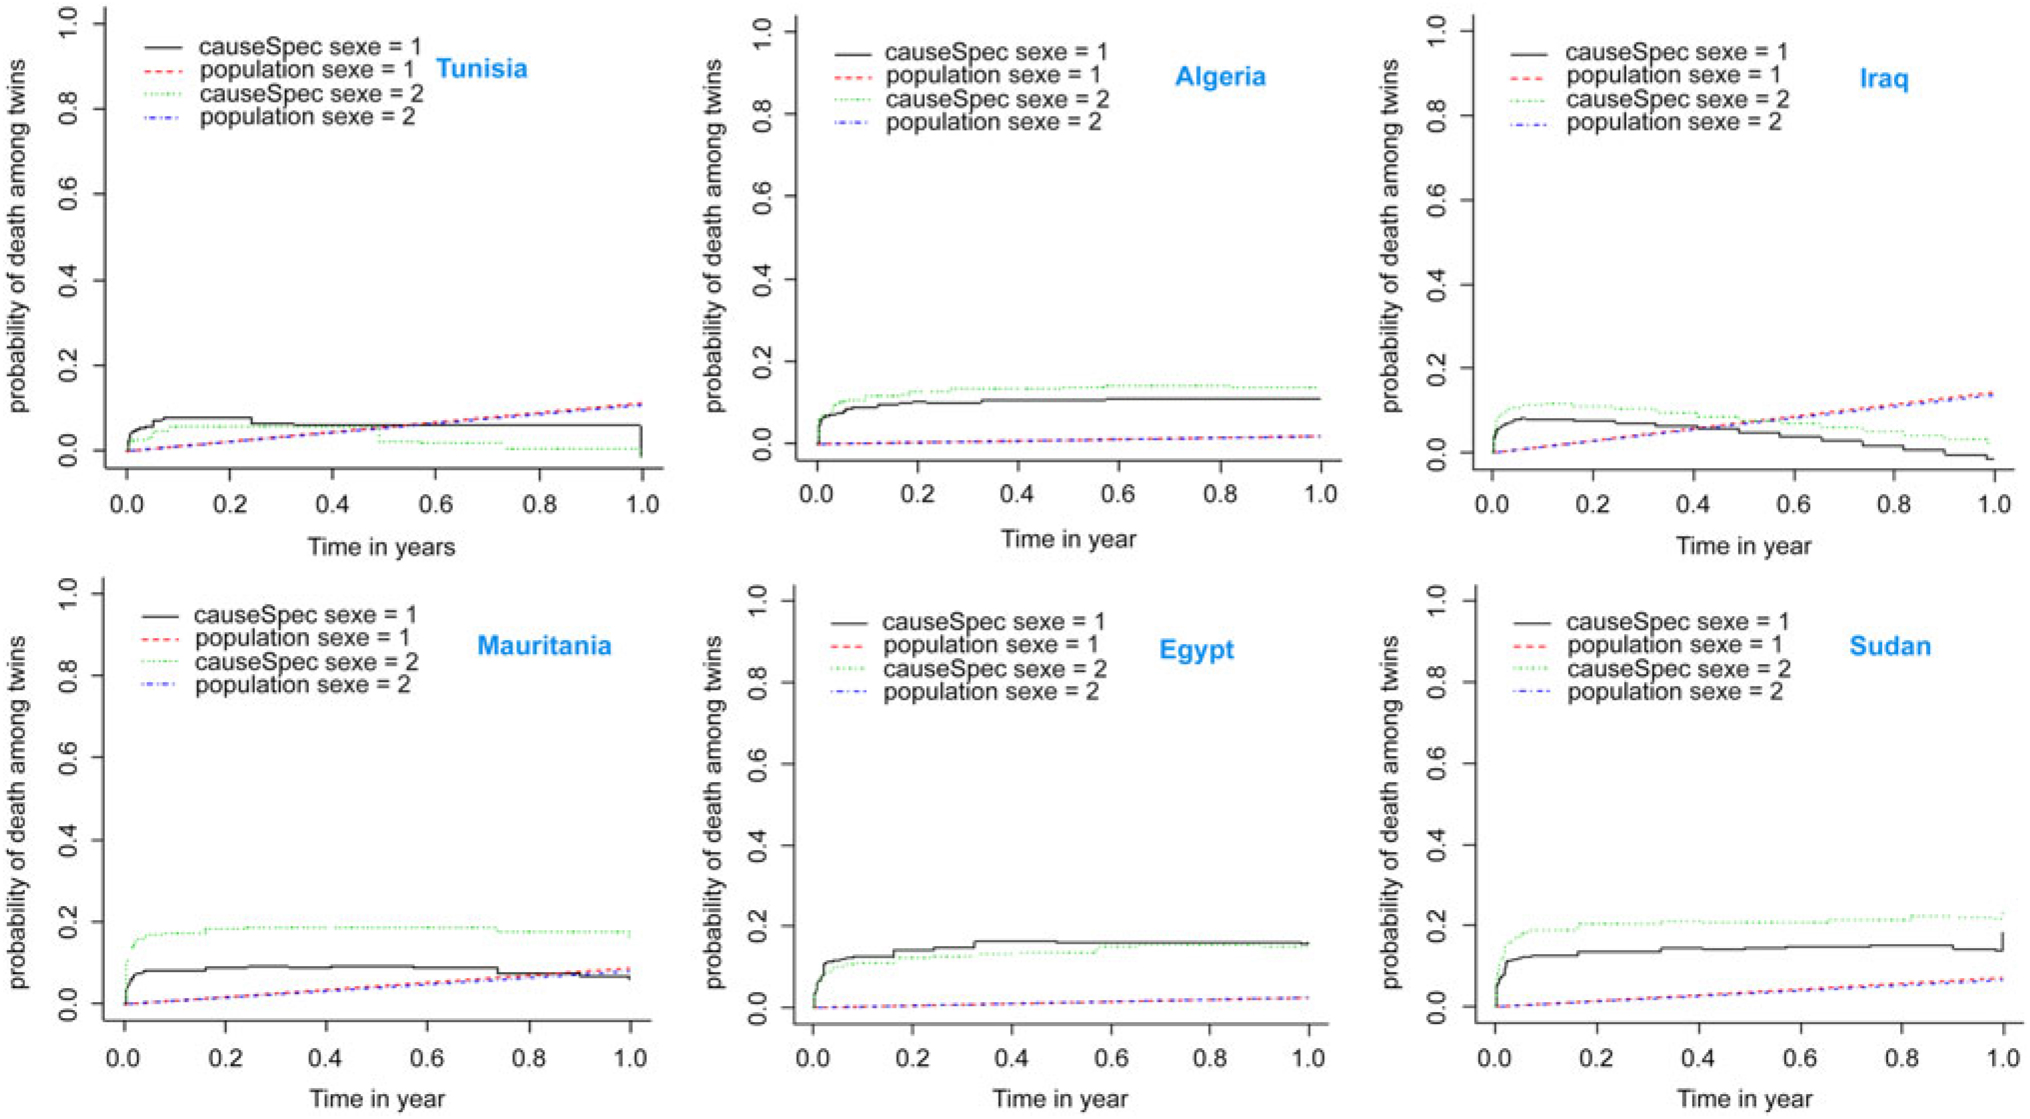
Fig. 3. Relative risk functions of twins and singletons according to sex of child.
Table 3. Relative survival estimate for twins in Egypt using the Estève et al.’s model
Note: Significant variables and Pr(>|z|) are in bold; α = .001, .01, .05, .1.
Table 4. Relative survival estimate for twins in Algeria using the Estève et al.’s model
Note: Significant variables and Pr(>|z|) are in bold; α = .001, .01, .05, .1.
Table 5. Relative survival estimate for twins in Iraq using the Estève et al.’s model
Note: Significant variables and Pr(>|z|) are in bold; α = .001, .01, .05, .1.
Table 6. Relative survival estimate for twins in Tunisia using the Estève et al.’s model
Note: Significant variables and Pr(>|z|) are in bold; α = .001, .01, .05, .1.
Table 7. Relative survival estimate for twins in Sudan using the Estève et al.’s model
Note: Significant variables and Pr(>|z|) are in bold; α = .001, .01, .05, .1.
Table 8. Relative survival estimate for twins in Mauritania using Estève et al.’s model

Note: Significant variables and Pr(>|z|) are in bold; α = .001, .01, .05, .1.
Table 9. Comparison of relative survival estimation between singletons and twins according to infant sex in the six arab countries (*)
Note: Analyses used relsurv R package. Significance levels are shown in bold type. ** An example (for Algeria) of the code instruction used for this estimation is given as: AlgeriaRelsurv = cmp.rel(Surv(age,death)∼sexe,rmap = list(age = age,year = anne,sex = sexe),ratetable = ratable,conf.int = 0.95,data = twins,tau = 365)### (tau = 365 days)######
In univariate modeling, this mortality factor is significant for all six countries, but in the multivariate case, and after adjusting for other demographic and economic variables (Tables 3–8), it is statistically significant for Algeria, Iraq, Mauritania and Sudan. Overall, there is an excess mortality of male twins compared to females, with a hazard ratio (HR) of exp(0.26) = 1.29, exp(0.255) = 1.29, exp(0.491) = 1.63, exp(0.231) = 1.26 in Algeria, Iraq, Mauritania and Sudan, respectively. So, the sex discrimination effect estimation results for the six countries partially confirm those shown in the figures.
According to the results presented in Tables 3–8, for the wealth index effect on twin risk mortality, as one would expect, the income level of the country is correlated with the child mortality rate for most countries. This index is technically the best proxy for household-level wealth as it includes the variables of consumer durables (e.g., TV, fridge, car), housing characteristics (e.g., quality of building material, toilet facility, number of rooms), and access to basic services (e.g., water, electricity). Assets are entered into a principal component analysis (PCA), with the first factor chosen as a wealth index.
The relative coefficients are not significant for Tunisia and Egypt; for the latter, the wealth index was not available in the MICS database, so we used another proxy variable, which was “Working for cash (yes or no)” (Table 3). For Algeria, Iraq, Sudan and Mauritania, the estimated coefficients were respectively: HR = exp(−0.26) = 0.771, HR = exp(−0.118) = 0.889, HR = exp(−0.255) = 1.774, HR = exp(−0.128) = 0.879, respectively. So, the negative relationship is clearly confirmed between the wealth index and the risk of death for twins. The first three are significant at the α = .05 error level, while the last is α = .00. Under the assumption that “malnutrition” is a proxy variable of wealth level of a household, the study by Fawzi et al. (Reference Fawzi, Herrera, Spiegelman, el Amin, Nestel and Mohamed1997) validates the results found in our modeling. Other things being equal, the poorest households have the highest levels of twin excess mortality, and the households with the highest wealth have the lowest rates.
Mother’s Education
As expected, a strong link was found between the mother’s level of education and her children’s survival chances. However, this relationship is not a simple one, because mortality does not decrease uniformly with increasing level of education. For Egypt, Table 3 shows that twins of illiterate mothers have higher excess mortality, estimated as an HR = exp(0.775) = 2.17. For Iraq, twins of mothers with a primary education have 40.7% lower excess mortality, 1 − HR = exp(−0.524) = 0.407, than twins of illiterate mothers; for twins of mothers with secondary education or more, their excess mortality is lower by 37.1%, 1 − HR = exp(−0.464) = 0.371, than twins of mothers with no education. For Sudan, twins of mothers with a primary education have 24.3% lower excess mortality, 1 − HR = exp(−0.279) = 0.243, than twins of illiterate mothers.
Finally, it is generally accepted that the education of parents and especially that of the mother is a determining factor in the mortality rate of young children in general and twins in particular.
Mother’s Age and Twins’ Mortality
Part of the increase in infant mortality among young mothers is due to the lack of experience in caring for the infant (Neal et al., Reference Neal, Channon and Chintsanya2018; Selemani et al., Reference Selemani, Mwanyangala, Mrema, Shamte, Kajungu, Mkopi, Mahande and Nathan2014). For Sudan, we found a negative relationship between mother’s age and excess risk of twins’ death; all others being equal, an increase in a mother’s age by one year will reduce the excess risk of death by 8.05%, 1 – HR = exp(−0.084). For Iraq, age was not a continuous variable; the results showed that in the 20- to 29-year age group, the excess risk of death of twins was reduced by an HR = exp(−0.470) = 37.5% compared to mothers aged below 20 years; for the 30–39 and 40–49 age groups, the excess risk was reduced, respectively, by HR = exp(−1.09) = 66.5%, and HR = exp(−0.737) = 52.1%. For the remaining countries, this variable was not significant.
Birth Order and Twin Excess Risk of Death
Several studies have been conducted to establish the link between birth order and child mortality, (Barclay & Kolk, Reference Barclay and Kolk2015; Black et al., Reference Black, Devereux and Salvanes2005; Mishra et al., Reference Mishra, Ram, Singh and Yadav2017; Sulloway, Reference Sulloway1996; Zajonc & Markus, Reference Zajonc and Markus1975). Although the results are often mixed and controversial, a common finding in most studies is that infants born later have far worse consequences in all areas of life as reported by Mishra et al. (Reference Mishra, Ram, Singh and Yadav2017). The results of these studies were for children in general, and these controversial results were confirmed for the twins in our models (Tables 3–8). The first-order child (i.e., first child born in the household) was taken as a reference class for this variable. For Algeria, the estimates show the excess risk of death of twins if they are the first children is 1.68 times, HR = exp(0.514), compared to twins who were born second or third order, and 3.61 times, HR = exp(1.286), for twins who were seventh order or more. For Iraq, this excess risk is 1.92 times, HR = exp(0.656), compared to twins who were seventh order or more; the rest of the modalities are not significant. For Mauritania, the excess risk of death for the first-order twins is 1.43 times, HR = exp(0.358), compared to the twins who were fourth to sixth order, and 2.03 times, HR = exp(0.711), for twins who were seventh order or more.
Model Check Adequacy
In relative survival analysis, the assumption to be satisfied is its proportional (excess) hazard assumption (Stare et al., Reference Stare, Pohar Perme and Henderson2005), According to the p values shown in Tables 4–9 for each variable and the global models, proportional hazard assumption is true because the p value of all variables is more than .05. Among the six estimated models, the estimation results were adequate and more significant in Iraq than in the other five countries; we think that the sample size (N = 136,578) had an important role in this sense.
Conclusion
In this study, we have empirically investigated the excess risk mortality of twins over singletons in six Arab countries. As an estimation method, we applied the relative survival approach, which allows the estimation of a specific risk factor for a specific group. This study confirms the excess infant mortality risk of twins over singletons for all six countries. It also validates the importance of the wealth index and mother’s education level as determinants of higher excess infant mortality of twins. It reveals differences among twins’ excess risk mortality according to sex and overall birth order within the family. The lack of significance of socioeconomic factors in certain countries partly confirms the major hypothesis of this research, according to which biological (clinical) factors are the generative phenomenon (or the intrinsic factor) of excess mortality of twins compared to singletons. We hope that governments, researchers in demography and health professionals in the Arab world will use our findings to promote the health and well-being of children in general, and twins in particular as more optimal management should minimize losses.
Finally, the countries of the Arab world are not homogeneous in their levels of economic and social development, which must be taken into consideration in any future research in this region. In further research, we think that studying the evolution of twin rates in these countries is extremely important.
Financial support
This research received no specific grant from any funding agency, commercial or not-for-profit sectors.
Conflict of interest
None.


