


Diet quality is measured via dietary indices that weigh different food and nutrients to provide an overall estimate of someone’s dietary intake. Via dietary indices, it is possible to compare the overall diet across individuals and populations (Gil et al., Reference Gil, Martinez de Victoria and Olza2015).
Diet quality is associated with the development of many common disorders, including cardiovascular diseases (CVD; Neelakantan et al., Reference Neelakantan, Koh, Yuan and van Dam2018), mental health (Jacka, Reference Jacka2017) and glaucoma (Al Owaifeer & Al Taisan, Reference Al Owaifeer and Al Taisan2018). Recent studies linked the increased risk of developing common diseases to a less healthy diet (Badimon et al., Reference Badimon, Chagas and Chiva-Blanch2019; Tedstone et al., Reference Tedstone, Duval and Peacock2020). However, adherence to a healthy or unhealthy dietary pattern is influenced by a complex mix of socioeconomic, environmental and genetic factors. Thus, research seeking to ameliorate diet quality at an individual level to smoothen the way of disease prevention should also take into account genetic components (Berciano et al., Reference Berciano, Lai, Herranz, Aslibekyan, Claas, Irvin and Tiwari2017).
Previous twin studies have shown that a strong genetic component defines consumption of some specific foods such as coffee and garlic (Teucher et al., Reference Teucher, Skinner, Skidmore, Cassidy, Fairweather-Tait, Hooper and MacGregor2007), beverages including soda and alcohol (de Castro, Reference de Castro1993), energy and macronutrient intake (Faith et al., Reference Faith, Rha, Neale and Allison1999; Hasselbalch et al., Reference Hasselbalch, Heitmann, Kyvik and Sørensen2008; Liu et al., Reference Liu, Tuvblad, Raine and Baker2013), healthy/unhealthy pattern as well as food liking/disliking (Pallister et al., Reference Pallister, Sharafi, Lachance, Pirastu, Mohney, MacGregor and Menni2015; Vink et al., Reference Vink, van Hooijdonk, Willemsen, Feskens and Boomsma2020), eating behavior (Tholin et al., Reference Tholin, Rasmussen, Tynelius and Karlsson2005) and variety in the overall diet (Scheibehenne et al., Reference Scheibehenne, Todd, van den Berg, Hatemi, Eaves and Vogler2014). However, the full extent of the genetic impact on dietary indices has never been fully explored.
Here for the first time, we define the heritability of the nine most used dietary indices in nutritional epidemiology (Aljuraiban et al., Reference Aljuraiban, Gibson, Oude Griep, Okuda, Steffen, Van Horn and Chan2020) in order to assess to which extent genetic components influence overall dietary intake.
Materials and Methods
Study Population
In this study, we included 2590 female twins from the UK Adult Twin Register, TwinsUK. The TwinsUK cohort is described in detail in Verdi et al. (Reference Verdi, Abbasian, Bowyer, Lachance, Yarand, Christofidou and Steves2019). Briefly, TwinsUK is a large cohort including 14,000 twins historically developed to study the heritability and genetics of diseases with a higher prevalence among women. The study population is not enriched for any particular disease or trait and is representative of the British general population of Caucasian ethnicity (Verdi et al., Reference Verdi, Abbasian, Bowyer, Lachance, Yarand, Christofidou and Steves2019). Twin zygosity was determined by the ‘peas in the pod’ similarity questionnaire (the PPQ), genomewide genotyping or by using 16 short tandem repeat DNA markers (Jarrar et al., Reference Jarrar, Ward, Mangino, Cherkas, Gill, Gillham-Nasenya and Spector2018). All participants included in this study completed a 131-item food frequency questionnaire (FFQ; Ocké et al., Reference Ocké, Bueno-de-Mesquita, Goddijn, Jansen, Pols, van Staveren and Kromhout1997). The TwinsUK study is approved by London-Westminster NHS Research Ethics Committee (TwinsUK, REC ref: EC04/015, November 1, 2011) and all twins have provided written informed consent.
Dietary Assessment
The 131-item FFQ was developed and validated against pre-established nutrient biomarkers for the European Prospective Investigation into Diet and Cancer (EPIC) Norfolk (Bingham et al., Reference Bingham, Gill, Welch, Cassidy, Runswick, Oakes and Day1997; Bingham et al., Reference Bingham, Welch, McTaggart, Mulligan, Runswick, Luben and Day2001) as previously described (Teucher et al., Reference Teucher, Skinner, Skidmore, Cassidy, Fairweather-Tait, Hooper and MacGregor2007). All subjects included in this study completed the FFQ questionnaire in 2007, which captures the average yearly intake. Nutrient intake was determined by FETA software (Mulligan et al., Reference Mulligan, Luben, Bhaniani, Parry-Smith, O’Connor, Khawaja and Khaw2014). We excluded from this study all twins with more than 10 food items missing in their FFQ or if the ratio between the estimate of the individual total energy intake (derived from FFQ) and the subject’s estimated basal metabolic rate (determined by the Harris–Benedict equation; Frankenfield et al., Reference Frankenfield, Muth and Rowe1998) was more than two standard deviations outside the mean of this ratio (<.52 or >2.58).
Standardized Comparative Indices
FFQ items were allocated to predefined food group categories to calculate the nine most frequently reported dietary indices for studies investigating associations with cardiovascular risk (Aljuraiban et al., Reference Aljuraiban, Gibson, Oude Griep, Okuda, Steffen, Van Horn and Chan2020). These include the Alternative Healthy Eating Index (A-HEI; Chiuve et al., Reference Chiuve, Fung, Rimm, Hu, McCullough, Wang and Willett2012), the Amended Mediterranean Score (A-Med; Fung et al., Reference Fung, McCullough, Newby, Manson, Meigs, Rifai and Hu2005), the Dietary Approaches to Stop Hypertension (DASH; Fung et al., Reference Fung, Chiuve, McCullough, Rexrode, Logroscino and Hu2008), the Diet Quality Index International (DQI-I; Kim et al., Reference Kim, Haines, Siega-Riz and Popkin2003), the Dietary Reference Values (DRV; Eriksen et al., Reference Eriksen, Gibson, Lamb, McMeel, Vergnaud, Spear and Frost2018), the Healthy Diet Indicator (HDI; Berentzen et al., Reference Berentzen, Beulens, Hoevenaar-Blom, Kampman, Bueno-de-Mesquita, Romaguera-Bosch and May2013), the Healthy Eating Index 2010 (HEI-2010; Guenther et al., Reference Guenther, Casavale, Reedy, Kirkpatrick, Hiza, Kuczynski and Krebs-Smith2013), Nordic Diet Score (NDS; Galbete et al., Reference Galbete, Kröger, Jannasch, Iqbal, Schwingshackl, Schwedhelm and Schulze2018) and the Original Mediterranean Score (O-Med; Trichopoulou et al., Reference Trichopoulou, Costacou, Bamia and Trichopoulos2003).
The detailed descriptions of the methods utilized to generate the different indices included in this study have been previously reported (Berentzen et al., Reference Berentzen, Beulens, Hoevenaar-Blom, Kampman, Bueno-de-Mesquita, Romaguera-Bosch and May2013; Chiuve et al., Reference Chiuve, Fung, Rimm, Hu, McCullough, Wang and Willett2012; Eriksen et al., Reference Eriksen, Gibson, Lamb, McMeel, Vergnaud, Spear and Frost2018; Fung et al., Reference Fung, McCullough, Newby, Manson, Meigs, Rifai and Hu2005, Reference Fung, Chiuve, McCullough, Rexrode, Logroscino and Hu2008; Galbete et al., Reference Galbete, Kröger, Jannasch, Iqbal, Schwingshackl, Schwedhelm and Schulze2018; Guenther et al., Reference Guenther, Casavale, Reedy, Kirkpatrick, Hiza, Kuczynski and Krebs-Smith2013; Kim et al., Reference Kim, Haines, Siega-Riz and Popkin2003; Trichopoulou et al., Reference Trichopoulou, Costacou, Bamia and Trichopoulos2003). In brief, HEI-2010 is a cumulative score ranging from 0 to 100 points that accounts for 12 dietary components (Guenther et al., Reference Guenther, Casavale, Reedy, Kirkpatrick, Hiza, Kuczynski and Krebs-Smith2013) that reflect recommendations based on the Food Guide Pyramid (Reedy & Krebs-Smith, Reference Reedy and Krebs-Smith2008) and the Dietary Guidelines for Americans (McGuire, Reference McGuire2011). The A-HEI scoring criteria (Chiuve et al., Reference Chiuve, Fung, Rimm, Hu, McCullough, Wang and Willett2012) include elements of the HEI-2010 with selected dietary components, based on their associations with chronic diseases — the score range is from 0 to 110. The DQI-I is a cumulative score ranging from 0 to 100 points based on methods by Kim et al. (Reference Kim, Haines, Siega-Riz and Popkin2003). It accounts for 17 dietary components that measure (a) intake of several food groups and nutrients and (b) diet diversity and moderation. The O-Med is based on the intake of nine dietary components and its score ranges from 0 to 9 points, as described by Trichopoulou et al. (Reference Trichopoulou, Costacou, Bamia and Trichopoulos2003). More recently, Fung et al. (Reference Fung, McCullough, Newby, Manson, Meigs, Rifai and Hu2005) modified the original Mediterranean score. The Amended Mediterranean Score (A-Med) is based on dietary patterns and eating behaviors that have been consistently associated with lower risks of chronic disease in clinical and epidemiologic studies, and more reflective of an American diet (Fung et al., Reference Fung, McCullough, Newby, Manson, Meigs, Rifai and Hu2005). The DASH is a dietary score ranging from 8 to 40 points that accounts for eight dietary components determined by a landmark randomized control trial (Appel et al., Reference Appel, Moore, Obarzanek, Vollmer, Svetkey, Sacks and Harsha1997). Of these eight components, five are beneficial (i.e. fruits, vegetables, legumes and nuts, whole grains, low-fat dairy) and three are detrimental (i.e. meat, sugar sweetened beverages and sodium; Fung et al., Reference Fung, Chiuve, McCullough, Rexrode, Logroscino and Hu2008). The DRV dietary index is a 16-point score based on the intake of the six nutritional components (total carbohydrates, sugars, total fat, SFA, salt, dietary fiber) and two food group components (fruit and vegetables combined and total fish), as listed in the Public Health England UK dietary policy for optimal health and prevention of CVD (Levy & Tedstone, Reference Levy and Tedstone2017). Of these eight components, four are beneficial (i.e. fruits/vegetables, fish, carbohydrates, fiber) and four are detrimental (i.e. SFA, fat, sodium, sugar; Eriksen et al., Reference Eriksen, Gibson, Lamb, McMeel, Vergnaud, Spear and Frost2018). The HDI index was generated as described by Berentzen et al. (Reference Berentzen, Beulens, Hoevenaar-Blom, Kampman, Bueno-de-Mesquita, Romaguera-Bosch and May2013) and accounts for seven dietary components. For each component, a dichotomous variable is defined and the index represents the sum of all the dichotomous variables with a range between 0 and 7 points (Berentzen et al., Reference Berentzen, Beulens, Hoevenaar-Blom, Kampman, Bueno-de-Mesquita, Romaguera-Bosch and May2013). Finally, the construction of the NDS was based on Galbete et al. (Reference Galbete, Kröger, Jannasch, Iqbal, Schwingshackl, Schwedhelm and Schulze2018). The NDS ranges from 0 to 18 points and incorporates nine components. Each food component is categorized into sex-specific tertiles of intake, and each participant receives a score of 0−2 points according to the first, second and third tertile, respectively, (Galbete et al., Reference Galbete, Kröger, Jannasch, Iqbal, Schwingshackl, Schwedhelm and Schulze2018). All indices were constructed in RStudio (Rizzo, Reference Rizzo2019) following relevant methodologies; see Table 1.
Table 1. Summary of the food groups/dietary groups of the dietary indices included in the study

Note: O-Med, Original Mediterranean Score; A-Med, Amended Mediterranean Score; HEI-210, Healthy Eating Index 2010; A-HEI, Alternative Healthy Eating Index; HDI, Healthy Diet Indicator; DASH, Dietary Approaches to Stop Hypertension; DQI-I, Diet Quality Index International; NDS, Nordic Diet Score; DRV, Dietary Reference Values.
Assessment of Covariates
The heritability estimates were adjusted for six major confounders: age, body mass index (BMI), smoking and menopause status, physical activity and the Index of Multiple Deprivation (IMD). Age, physical activity, smoking and menopause status were recorded as part of the self-report lifestyle questionnaire collected on an annual basis and during TwinsUK visits (Verdi et al., Reference Verdi, Abbasian, Bowyer, Lachance, Yarand, Christofidou and Steves2019). BMI was determined from weight and height measurements (weight kg/height m2) collected using harmonized protocols by trained research nurses during clinical visits (Verdi et al., Reference Verdi, Abbasian, Bowyer, Lachance, Yarand, Christofidou and Steves2019).
The IMD is a composite decile score measuring the area-level deprivation (lower deciles represent the most deprived areas). The IMD score is based on a total of seven domains: income, employment, health, education, barriers to services, environment and crime (Goodman & Gatward, Reference Goodman and Gatward2008). The IMD was derived from the postcode reported by the participant at the time of data collection. Furthermore, alcohol and energy intake were included in the analysis models of those scores, which do not account for energy intake and alcohol in their score (O-Med, A-Med, DASH, A-HEI, NDS). Both alcohol (mean g/day) and energy intake (kcal) were estimated from the FFQ.
Heritability
We used the classical twin models to define the influence of genetic and environmental factors on the variance of the nine dietary indices included in this study.
Twin studies compare the degree of similarity among monozygotic (MZ) twins, who share 100% of their genetic makeup, and dizygotic (DZ) twins, who share on average 50% of their segregating genes. Under the equal environment assumption (EEA), the variance of the trait/phenotype (P) is explained by the following latent parameters:
 $${\rm{P}} = {\rm{A}} + {\rm{D}} + {\rm{C}} + {\rm{E,}}$$
where ‘A’ represents the additive genetic influence, ‘D’ the genetic variance explained by the relationship between the recessive/dominant alleles, ‘C’ the common or shared environment between the twin pair and ‘E’ represents the nonshared environment (‘E’ also includes measurement error; Rijsdijk & Sham, Reference Rijsdijk and Sham2002).
However, in studies including only MZ and DZ correlations, it is not possible to estimate the phenotypic variance including all four sources of variation, and either ‘C’ or ‘D’ needs to be excluded from the model. Twin correlations are utilized to define which parameter to include in the model. The common environmental effect ‘C’ is included in the model when the correlation of MZ twins is less than half the correlation of DZ twins, whereas the dominance genetic effects ‘D’ is analyzed when the MZ twin correlation is more than half the correlation of DZ twins. Based on the correlation values reported in the results section, either the ACE or ADE model was fitted in the heritability analyses.
To estimate the heritability, we take advantage of structural equation models (SEM), which utilize observed covariances from both MZ and DZ pairs to establish a causal relationship among the covariances and the latent parameters.
We investigated ACE, ADE, AE and E models, and the Akaike’s information criterion (AIC) was used to select the best-fitting model. The model (ACE, ADE, AE or E) with the minimum AIC reflects the best balance between explanatory power and parsimony and was the preferred model. In all the models, the marginal (individual) effect of each twin was adjusted for age, BMI, smoking status, physical activity, menopause status and IMD. Heritability analyses were performed using the package METs (version 1.2.7.1; Scheike et al., Reference Scheike, Holst and Hjelmborg2014) in R (version 4.0.2).
Results
We included 2590 female twins (1284 DZ and 1306 MZ) from TwinsUK. The full descriptive characteristics of the study population are presented in Table 2. The average age of the participants was 58.1 years (±10.2 years). The mean BMI was 26.5 (± 4.9) and 55.7% of the subjects were classified as overweight/obese (BMI > 25). The majority of the participants were postmenopausal (85%), nonsmokers (70%), not engaged in high physical activity (89%) and had a good socioeconomic status (67% of the participants at the time of sample collection lived in the least deprived areas of the country; IMD ≥ 7).
Table 2. Characteristics of the study population

Note: O-Med, Original Mediterranean Score; A-Med, Amended Mediterranean Score; DASH, Dietary Approaches to Stop Hypertension; HEI-210, Healthy Eating Index 2010; A-HEI, Alternative Healthy Eating Index; NDS, Nordic Diet Score; HDI, Healthy Diet Indicator; DQI-I, Diet Quality Index International; DRV, Dietary Reference Values.
The correlations between MZ twins was higher than the DZ twin correlation for all the analyzed dietary indices (Table 3). The MZ correlation was more than double the DZ correlation for five indices (DRV, O-Med, DASH, DQI-I, A-HEI). For these indices, we fitted an ADE full model. For the remaining four indices (HEI-2010, HDI, A-Med, NDS), as the DZ correlations were more than half of the MZ correlations, we fitted an ACE model (Table 3).
Table 3. Twin correlations (maximum likelihood estimates) for each dietary index for MZ (618 pairs and 70 individuals and DZ female twins (608 pairs and 68 individuals)

Note: MZ, monozygotic; DZ, dizygotic; A-HEI, Alternative Healthy Eating Index; A-Med, Amended Mediterranean Score; DASH, Dietary Approaches to Stop Hypertension; DQI-I, Diet Quality Index International; DRV, Dietary Reference Values; HDI, Healthy Diet Indicator; HEI, Healthy Eating Index; NDS, Nordic Diet Score; O-Med, Original Mediterranean Score.
Heritability estimates for the nine dietary scores are presented in Figure 1 and Table 4.
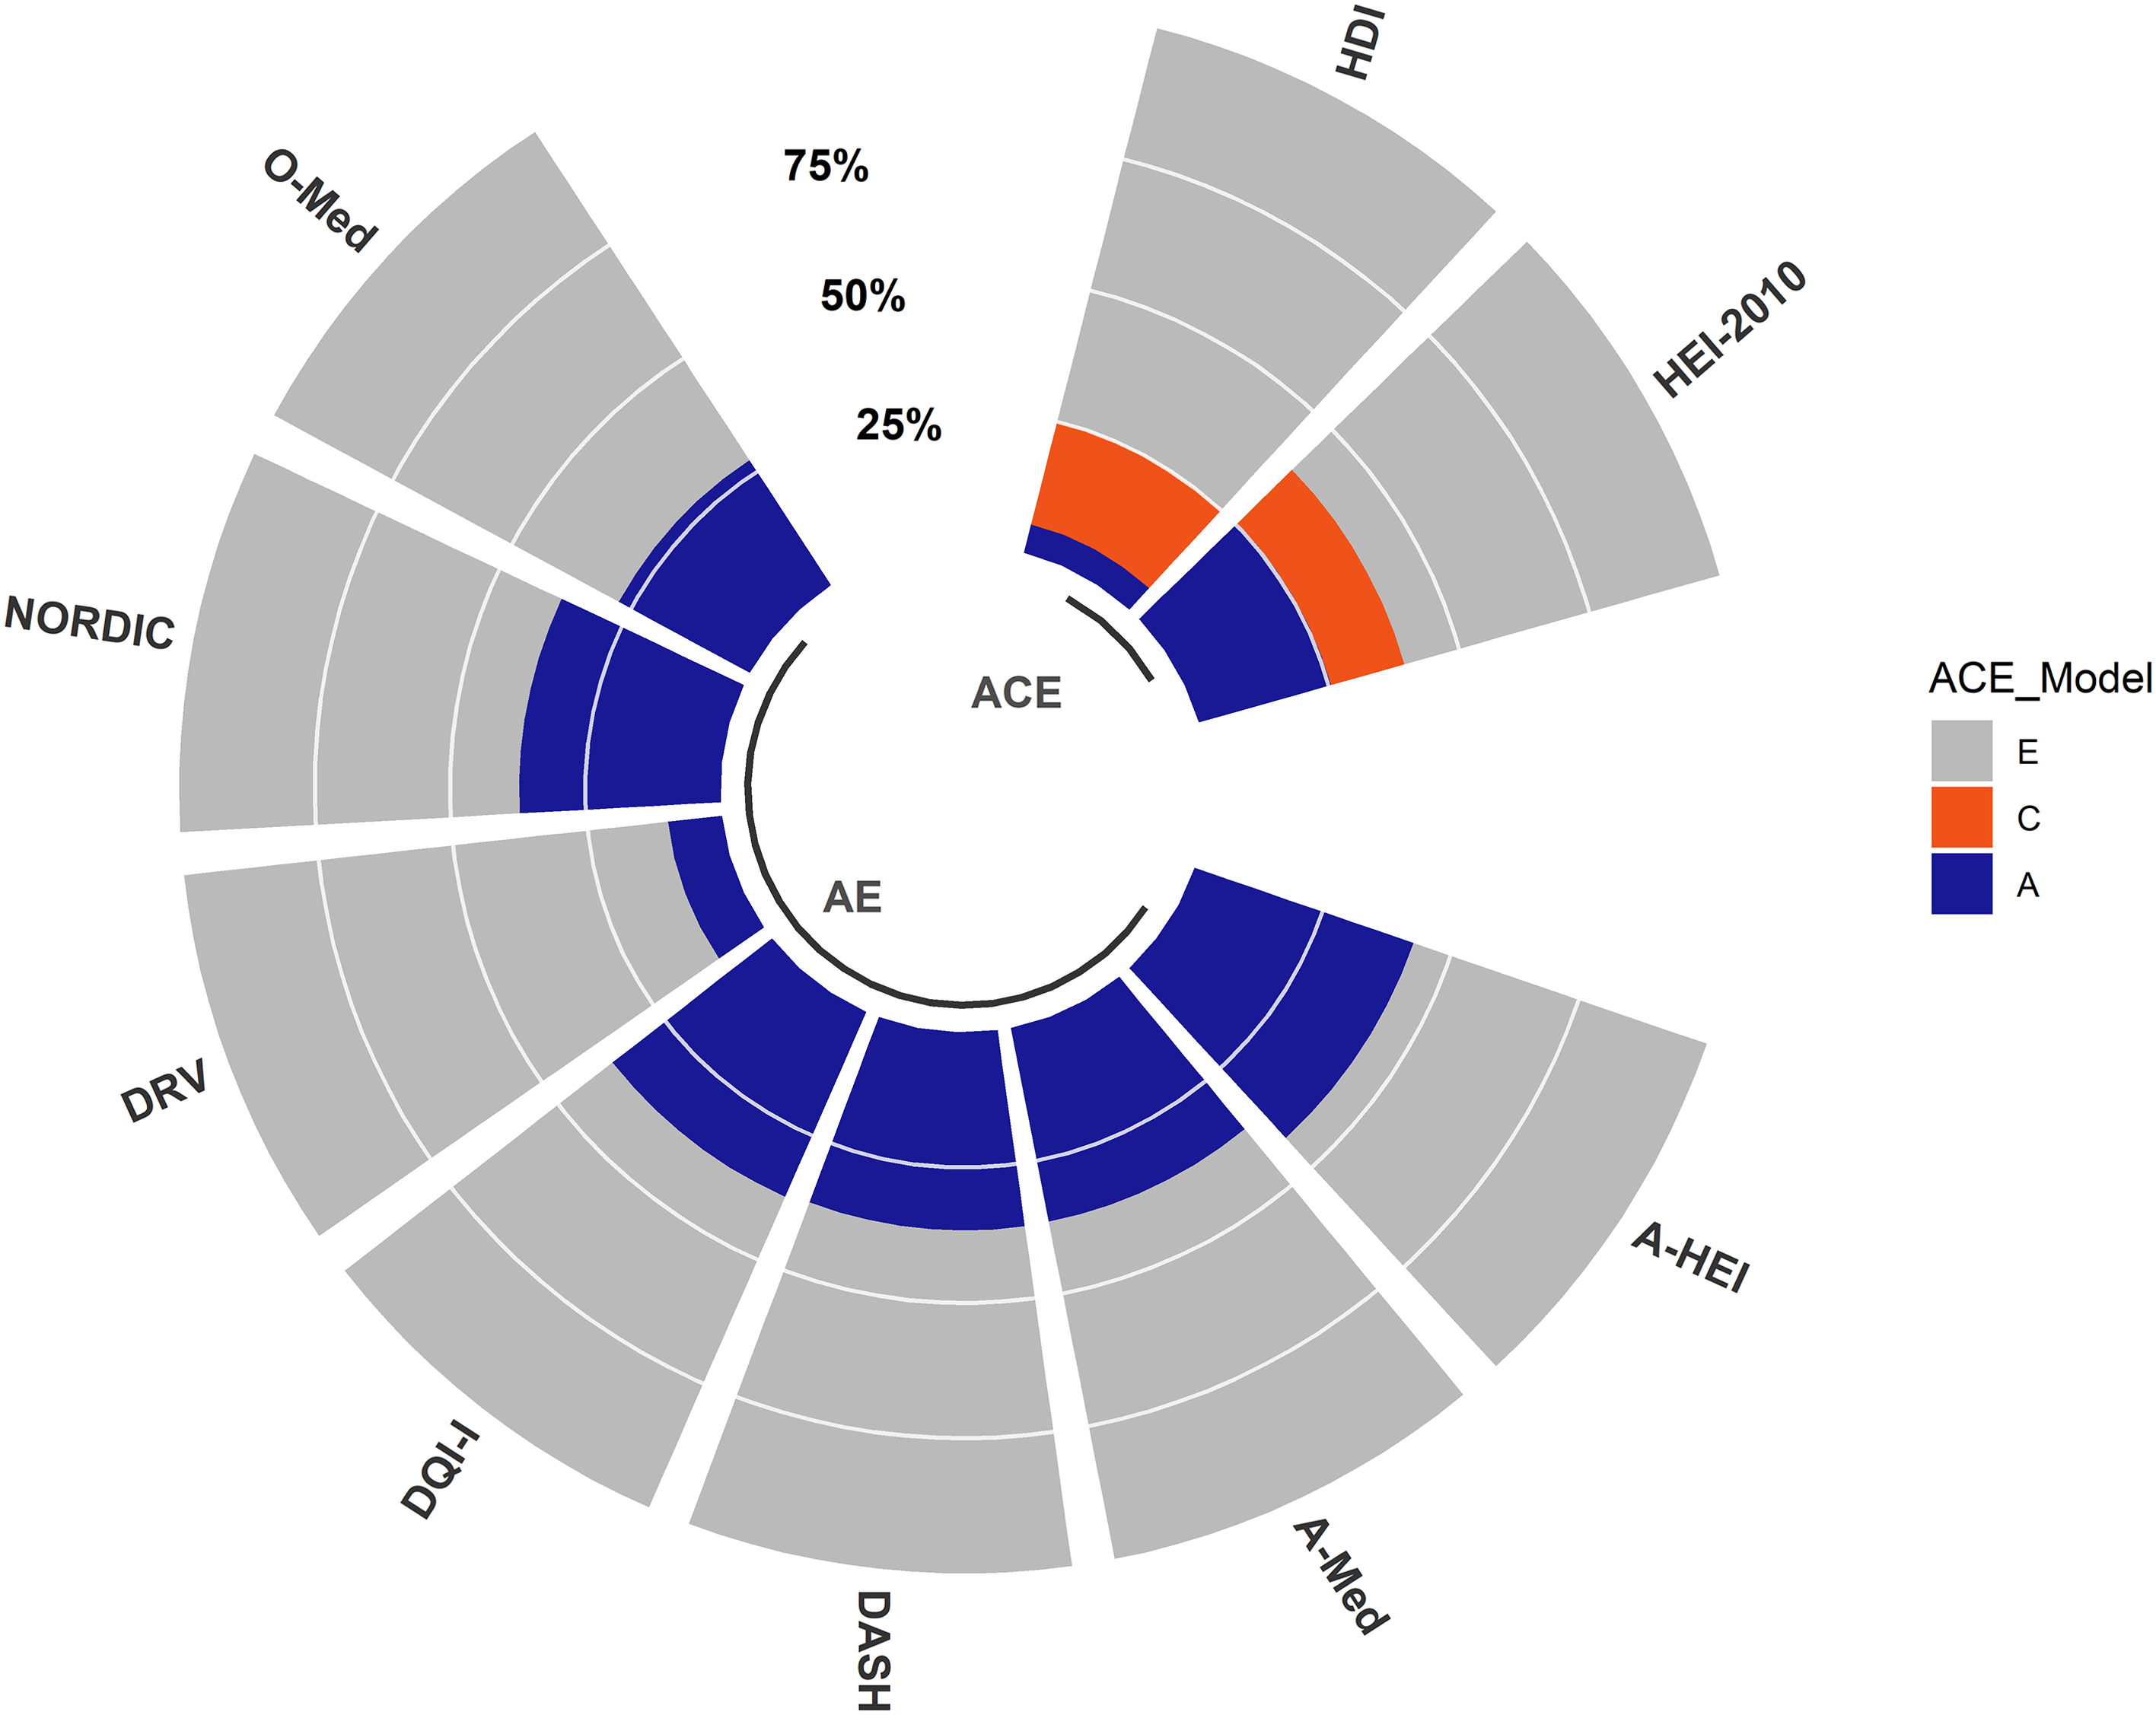
Fig. 1. Heritability of nine dietary indices TwinsUK. The total variance of each dietary index is decomposed into variance components attributed to additive genetics (A), common environment (C) and unique environment (E). The figure represents the best-fitting model for each dietary index determined by the lowest AIC. The full summary report of the heritability estimates is presented in Table 4.
Table 4. Results of model fitting for twin correlations (see Table 3) for all nine analyzed dietary indexes

Note: A-HEI, Alternative Healthy Eating Index; A-Med, Amended Mediterranean Score; DASH, Dietary Approaches to Stop Hypertension; DQI-I, Diet Quality Index International; DRV, Dietary Reference Values; HDI, Healthy Diet Indicator; HEI, Healthy Eating Index; NDS, Nordic Diet Score; O-Med, Original Mediterranean Score.
The ACE model was the best-fitting model for both HDI and HEI-2010. For the remaining seven dietary indices, the AE model was the best-fitting model. We observed a strong genetic effect (A ≥ 20%) for seven out of the nine dietary indices, with the contribution of genetic factors ranging from 47.2% (95% CI [0.36, 0.49]) for A-HEI to 25.4% (95% CI [0.05, 0.46]) for HEI-2010 (Figure 1 and Table 4). We observed a less strong additive genetic effect (A ≤ 10%) for DRV (10%; 95% CI [0.02, 0.18]) and HDI (5.4%; 95% CI [−0.17, 0.28]); see Figure 1 and Table 4.
Discussion
The present study established for the first time to which extent variations in dietary indices in adults are influenced by genetic and environmental factors. We found that variations in overall diet quality measured by diet scores are heritable, with estimates varying between 42% (A-HEI) and 5% (HDI). These estimates are comparable with the results reported in previous studies investigating the heritability of food preference in adults (Pallister et al., Reference Pallister, Sharafi, Lachance, Pirastu, Mohney, MacGregor and Menni2015; Smith et al., Reference Smith, Fildes, Cooke, Herle, Shakeshaft, Plomin and Llewellyn2016; Törnwall et al., Reference Törnwall, Silventoinen, Hiekkalinna, Perola, Tuorila and Kaprio2014; Vink et al., Reference Vink, van Hooijdonk, Willemsen, Feskens and Boomsma2020).
In this study, the interclass correlations were always higher in MZ pairs than in DZ pairs (which suggested a strong genetic component). Indeed, in some cases, MZ correlations were more than double than those observed for the DZ pairs. These gaps were particularly evident for those indices that represent a development of previous scores (O-Med vs. A-Med and HEI-2010 vs. A-HEI). Our hypothesis is that these differences are likely attributable to the amount of the dietary component captured within each index. For example, the food groups included in both O-Med and A-Med are mostly overlapping (Table 1). However, four food groups (poultry, starchy vegetables, refined grains and all the dairy products) are measured in O-Med but not in A-Med (Fung et al., Reference Fung, McCullough, Newby, Manson, Meigs, Rifai and Hu2005; Trichopoulou et al., Reference Trichopoulou, Costacou, Bamia and Trichopoulos2003). Therefore, dissimilar patterns of consumption for these food groups in the DZ pairs will be captured by O-Med but not by the A-Med. This hypothesis is supported by previous studies (Smith et al., Reference Smith, Fildes, Cooke, Herle, Shakeshaft, Plomin and Llewellyn2016; Teucher et al., Reference Teucher, Skinner, Skidmore, Cassidy, Fairweather-Tait, Hooper and MacGregor2007) where, in line with our observations, MZ interclass correlation estimates for poultry, refined grains and potato preferences were always more than double than those observed in DZ pairs (Smith et al., Reference Smith, Fildes, Cooke, Herle, Shakeshaft, Plomin and Llewellyn2016; Teucher et al., Reference Teucher, Skinner, Skidmore, Cassidy, Fairweather-Tait, Hooper and MacGregor2007).
Similarly, A-HEI scoring criteria (Chiuve et al., Reference Chiuve, Fung, Rimm, Hu, McCullough, Wang and Willett2012) differs from the original HEI-2010 as it includes more specific items and a different score range (Table 1). These differences are likely to be responsible for the different results reported for these indices in this study. These dissimilarities were also detected when HEI-2010 and A-HEI were associated with the risk of mortality for both cardiovascular and cancer (Harmon et al., Reference Harmon, Boushey, Shvetsov, Ettienne, Reedy, Wilkens and Kolonel2015).
To date, four studies have investigated the heritability of food preference in adults using either ACE or ADE models (Pallister et al., Reference Pallister, Sharafi, Lachance, Pirastu, Mohney, MacGregor and Menni2015; Smith et al., Reference Smith, Fildes, Cooke, Herle, Shakeshaft, Plomin and Llewellyn2016; Törnwall et al., Reference Törnwall, Silventoinen, Hiekkalinna, Perola, Tuorila and Kaprio2014; Vink et al., Reference Vink, van Hooijdonk, Willemsen, Feskens and Boomsma2020).
None of the studies found evidence of the effects of common environmental component (C) (Pallister et al., Reference Pallister, Sharafi, Lachance, Pirastu, Mohney, MacGregor and Menni2015; Smith et al., Reference Smith, Fildes, Cooke, Herle, Shakeshaft, Plomin and Llewellyn2016). A dominant genetic effect (D) was only identified for some food preferences (fruit and fish in females; Smith et al., Reference Smith, Fildes, Cooke, Herle, Shakeshaft, Plomin and Llewellyn2016; Vink et al., Reference Vink, van Hooijdonk, Willemsen, Feskens and Boomsma2020), but for most of the food preferences, the dominant genetic component was not detected (Smith et al., Reference Smith, Fildes, Cooke, Herle, Shakeshaft, Plomin and Llewellyn2016; Vink et al., Reference Vink, van Hooijdonk, Willemsen, Feskens and Boomsma2020). These results are in line with our findings. Indeed, we did not detect either common environmental or dominant genetic effects for most of the dietary indices included in this study. These observations may provide additional evidence that in adults, early familial experiences have no impact on both food preferences and on overall dietary intake.
This study has some limitations that are worth mentioning. First, our results were derived from middle-aged female twins, and it may be difficult to generalize these findings to men or younger individuals. Indeed, previous studies reported differences in food consumptions in both gender and young generations (Breen et al., Reference Breen, Plomin and Wardle2006; Pallister et al., Reference Pallister, Sharafi, Lachance, Pirastu, Mohney, MacGregor and Menni2015; Prättälä et al., Reference Prättälä, Paalanen, Grinberga, Helasoja, Kasmel and Petkeviciene2006; Smith et al., Reference Smith, Fildes, Cooke, Herle, Shakeshaft, Plomin and Llewellyn2016). Second, most of the samples included in this study are from a wealthy socioeconomic background. It has been observed that BMI heritability estimates are higher in more deprived areas and lower in less deprived areas (Owen et al., Reference Owen, Jones and Harris2017). Although this relationship was statistically significant, the authors could not establish a mechanism behind this relationship (Owen et al., Reference Owen, Jones and Harris2017). To take account of this possible gene–environment interaction and following the authors’ suggestions, we included the socioeconomic factor as a confounder in our model.
The final limitation applies to the twin model in general. The heritability models adopted in this study work under the assumption that common environmental influences are equal in both MZ and DZ pairs (EEA). Indeed, if this assumption is violated, then the heritability estimates would be inflated while the shared environmental values would be underestimated (Felson, Reference Felson2014). However, several studies have shown that bias due to violation of the EEA is negligible in traits such as food preference, eating disorders, weight and BMI (Felson, Reference Felson2014). Therefore, it is likely that this bias is also negligible for the dietary indices.
Conclusions
In conclusion, the present study represents the first comprehensive investigation of the relative contributions of genetic and environmental factors to the variation in dietary indices. We found that all investigated dietary indices are heritable. Future research needs to validate the results reported in this study and explore the heritability patterns of the dietary indices in males and in different countries and/or different ethnicity. However, our results not only reinforce the notion of heredity in the eating behavior, but also define the role of nonshared environmental influences, which may be modifiable. These findings highlight the complex genetic and environmental relationship of eating behavior and may have future implications for public health nutrition programs and nutritional epidemiology.
Acknowledgments
We are grateful to the twins who took part in TwinsUK and the whole TwinsUK team, which includes academic researchers, clinical staff, laboratory technicians, administrative staff and research managers.
Financial Support
TwinsUK receives funding from the Wellcome Trust (212904/Z/18/Z), Medical Research Council (AIMHY; MR/M016560/1) and European Union (H2020 contract #733100). TwinsUK and M.M. are supported by the National Institute for Health Research (NIHR)-funded BioResource, Clinical Research Facility and Biomedical Research Centre based at Guy’s and St Thomas’ NHS Foundation Trust in partnership with King’s College London. O.M. is supported by Chronic Disease Research Foundation (CDRF). C.M. is funded by the Chronic Disease Research Foundation and by the Medical Research Council (MRC)/British Heart Foundation Ancestry and Biological Informative Markers for Stratification of Hypertension (AIMHY; MR/M016560/1). P.C. is founded by the European Union (H2020 contract #733100).
Conflict of Interest
T.D.S. is co-founder of Zoe Global Ltd. S.E.B. is a consultant for Zoe Global Ltd. All other authors declare no competing financial interests.


