


BBMRI Metabolomics Consortium
Cohort Collection and Sample Management Group: M. Beekman1, H. E. D. Suchiman1, N. Amin2, J. W. Beulens3,4, J. A. van der Bom5–8, N. Bomer9, A. Demirkan2, J. A. van Hilten10, J. M. T. A. Meessen11, R. Pool12, M. H. Moed1, J. Fu13,14, G. L. J. Onderwater15, F. Rutters3, C. So-Osman10, W. M. van der Flier3,16, A. A. W. A. van der Heijden17, A. van der Spek2, F. W. Asselbergs18, E. Boersma19, P. M. Elders20,21, J. M. Geleijnse22, M. A. Ikram2,23,24, M. Kloppenburg8,25, I. Meulenbelt1, S. P. Mooijaart26, R. G. H. H. Nelissen27, M. G. Netea28,29, B. W. J. H. Penninx21,30, C.D.A. Stehouwer31,32, C.E. Teunissen33, G. M. Terwindt15, L. M. ‘t Hart1,3,21,34,35, A. M. J. M. van den Maagdenberg36, P. van der Harst8, I. C. C. van der Horst37, C. J. H. van der Kallen31,32, M. M. J. van Greevenbroek31,32, W. E. van Spil38, C. Wijmenga13, A. H. Zwinderman39, A. Zhernikova13, J. W. Jukema40
Database & Catalogue: J. J. H. Barkey Wolf1, M. Beekman1, D. Cats1, H. Mei1,41, M. Slofstra13, M. Swertz13
Quality Control: E. B. van den Akker1,42,43, J. J. H. Barkey Wolf1, J. Deelen1,44, M. J. T. Reinders42,43
Steering Committee: D. I. Boomsma21,45, C. M. van Duijn2, P.E. Slagboom1
1Department of Molecular Epidemiology, Leiden University Medical Center, Leiden, the Netherlands.
2Department of Epidemiology, Erasmus MC University Medical Center, Rotterdam, the Netherlands.
3Department of Epidemiology and Biostatistics, Amsterdam University Medical Center, Amsterdam, the Netherlands.
4Julius Center for Health Sciences and Primary Care, University Medical Center Utrecht, Utrecht, the Netherlands.
5Centre for Clinical Transfusion Research, Sanquin Research, Leiden, the Netherlands.
6Jon J van Rood Centre for Clinical Transfusion Research, Leiden University Medical Centre, Leiden, the Netherlands.
7TIAS, Tilburg University, Tilburg, the Netherlands.
8Department of Clinical Epidemiology, Leiden University Medical Centre, Leiden, the Netherlands.
9Department of Cardiology, University Medical Center Groningen, University of Groningen, Groningen, the Netherlands.
10Center for Clinical Transfusion Research, Sanquin Research, Leiden, the Netherlands.
11Department of Orthopedics, Leiden University Medical Centre, Leiden, The Netherlands.
12Department of Biological Psychology, Vrije Universiteit, Amsterdam, the Netherlands.
13Department of Genetics, University Medical Center Groningen, University of Groningen, Groningen, the Netherlands.
14Department of Pediatrics, University Medical Center Groningen, University of Groningen, Groningen, the Netherlands.
15Department of Neurology, Leiden University Medical Center, Leiden, the Netherlands.
16Department of Neurology and Alzheimer Center, Neuroscience Campus Amsterdam, VU University Medical Center, Amsterdam, the Netherlands.
17Department of General Practice, The EMGO Institute for Health and Care Research, VU University Medical Center, Amsterdam, the Netherlands.
18Department of Cardiology, Division Heart and Lungs, University Medical Center Utrecht, Utrecht, The Netherlands Julius Center for Health Sciences and Primary Care, University Medical Center Utrecht, Utrecht, the Netherlands.
19Thorax Centre, Erasmus Medical Centre, Rotterdam, the Netherlands.
20Department of General Practice and Elderly Care Medicine, VU University Medical Center, Amsterdam, the Netherlands.
21Amsterdam Public Health Research Institute, VU University Medical Center, Amsterdam, the Netherlands.
22Division of Human Nutrition and Health, Wageningen University, Wageningen, the Netherlands.
23Department of Radiology, Erasmus University Medical Center Rotterdam, Rotterdam, the Netherlands.
24Department of Neurology, Erasmus University Medical Center Rotterdam, Rotterdam, the Netherlands.
25Department of Rheumatology, Leiden University Medical Center, the Netherlands.
26Department of Internal Medicine, Division of Gerontology and Geriatrics, Leiden University Medical Centre, Leiden, the Netherlands.
27Department of Orthopaedics, Leiden University Medical Center, Leiden, the Netherlands.
28Department of Internal Medicine, Radboud Center for Infectious Diseases, Radboud University Medical Center, Nijmegen, the Netherlands.
29Department for Genomics & Immunoregulation, Life and Medical Sciences Institute (LIMES), University of Bonn, Bonn, Germany.
30Department of Psychiatry, VU University Medical Center, Amsterdam, the Netherlands.
31Department of Internal Medicine, Maastricht University Medical Center (MUMC+), Maastricht, the Netherlands.
32School for Cardiovascular Diseases (CARIM), Maastricht University, Maastricht, the Netherlands.
33Neurochemistry Laboratory, Clinical Chemistry Department, Amsterdam University Medical Center, Amsterdam Neuroscience, the Netherlands.
34Department of Cell and Chemical Biology, Leiden University Medical Center, Leiden, the Netherlands.
35Department of General practice, Amsterdam University Medical Center, Amsterdam, the Netherlands.
36Department of Human Genetics, Leiden University Medical Center, Leiden, the Netherlands.
37Department of Critical Care, University Medical Center Groningen, Groningen, the Netherlands.
38UMC Utrecht, Department of Rheumatology & Clinical Immunology, Utrecht, the Netherlands.
39Department of Clinical Epidemiology, Biostatistics, and Bioinformatics, Academic Medical Centre, University of Amsterdam, Amsterdam, the Netherlands.
40Department of Cardiology, Leiden University Medical Center, Leiden, the Netherlands.
41Sequencing Analysis Support Core, Leiden University Medical Center, Leiden, the Netherlands.
42Leiden Computational Biology Center, Leiden University Medical Center, Leiden, the Netherlands.
43Department of Pattern Recognition and Bioinformatics, Delft University of Technology, Delft, the Netherlands.
44Max Planck Institute for Biology of Ageing, Cologne, Germany.
45Netherlands Twin Register, Department of Biological Psychology, Vrije Universiteit, Amsterdam, the Netherlands.
Metabolites (small molecules involved in biological processes) are important intermediates in understanding how a person’s genotype translates to health or disease. Many different types of metabolites can be distinguished, including amino acids, lipids, and sugars (Adamski & Suhre, Reference Adamski and Suhre2013). Due to their diversity, metabolites have various functions in the human body, including energy storage, signaling, and forming structures, such as proteins or cell walls (Dunn et al., Reference Dunn, Broadhurst, Atherton, Goodacre and Griffin2011). Thus, metabolites can be considered the building blocks of the body (Hasirci & Hasirci, Reference Hasirci and Hasirci2018). The complete set of metabolites found within a specific biological sample is referred to as the metabolome (Wishart, Reference Wishart2007), the study thereof is termed metabolomics (Fiehn, Reference Fiehn2002). The metabolome is downstream of gene transcription, protein translation and protein function; therefore, metabolites are close to observable phenotypes in health and disease (Draisma et al., Reference Draisma, Beekman, Pool, van Ommen, Vaarhorst, de Craen and Boomsma2013; Goodacre et al., Reference Goodacre, Vaidyanathan, Dunn, Harrigan and Kell2004). Metabolomics has been successful in identifying disease biomarkers, unraveling biological mechanisms, and for drug discovery and development (Pang et al., Reference Pang, Jia and Hu2019).
The metabolome differs between people, as metabolite levels are influenced by many exogenous (originating from outside an organism) and endogenous factors (originating from inside an organism). Exogenous factors influencing the human metabolome include lifestyle, diet or medication use. For example, metabolite levels differ between current-, former- and never-smokers, between individuals on a low fat, low glycemic, or very low carbohydrate diet, and among users of various medication classes (Esko et al., Reference Esko, Hirschhorn, Feldman, Hsu, Deik, Clish and Ludwig2017; J. Liu et al., Reference Liu, Lahousse, Nivard, Bot, Chen, van Klinken and van Duijn2020; Xu et al., Reference Xu, Holzapfel, Dong, Bader, Yu, Prehn and Wang-Sattler2013). Endogenous factors influencing the human metabolome include sex, age or body mass index (BMI). For example, metabolite levels differ between males and females, younger and older individuals and obese and nonobese individuals (Chaleckis et al., Reference Chaleckis, Murakami, Takada, Kondoh and Yanagida2016; Fan et al., Reference Fan, Yeon, Shahid, Anger, Eilber, Fiehn and Kim2018; Rangel-Huerta et al., Reference Rangel-Huerta, Pastor-Villaescusa and Gil2019). Endogenous factors also include genetic influences, either directly on metabolite levels or indirectly through the effect on behavior or lifestyle (e.g., smoking; M. Liu et al., Reference Liu, Jiang, Wedow, Li, Brazel, Chen and Vrieze2019). The metabolome can differ between cases and controls — for example, in major depressive disorder (Bot et al., Reference Bot, Milaneschi, Al-Shehri, Amin, Garmaeva, Onderwater and Penninx2019). Here it is observed that associations between metabolites and the case/control status are attenuated by antidepressant use, while the causalities of the associations remain unknown as of yet. Thus, metabolite levels reflect individual differences in genetics, physiology, lifestyle and behavior or responses to environmental changes (Fiehn, Reference Fiehn2002).
Genetic factors account for approximately 50% of the individual differences in metabolite levels (Shin et al., Reference Shin, Fauman, Petersen, Krumsiek, Santos, Huang and Soranzo2014; Yet et al., Reference Yet, Menni, Shin, Mangino, Soranzo, Adamski and Bell2016). The average proportion of phenotypic variance in metabolite levels ascribed to genetic factors (i.e., heritability; h 2) differs per type of metabolite. The median heritability for lipids is approximately 37%, with heritability estimates for sphingolipids (e.g., sphingomyelins) and glycerolipids (e.g., triglycerides) often, but not consistently, higher than for phospholipids (e.g., phosphatidylcholines; Bellis et al., Reference Bellis, Kulkarni, Mamtani, Kent, Wong, Weir and Curran2014; Darst et al., Reference Darst, Koscik, Hogan, Johnson and Engelman2019; Frahnow et al., Reference Frahnow, Osterhoff, Hornemann, Kruse, Surma, Klose and Pfeiffer2017). Similarly, while the median heritability for amino acids is approximately 40% (Darst et al., Reference Darst, Koscik, Hogan, Johnson and Engelman2019), amino acids that the body is able (nonessential) or unable (essential) to synthesize de novo differ in mean heritability. Specifically, levels of essential amino acids are less heritable than levels of nonessential amino acids (Rhee et al., Reference Rhee, Ho, Chen, Shen, Cheng, Larson and Gerszten2013). These differences in heritability among metabolite classes also occur for single-nucleotide polymorphism (SNP)-based heritability (i.e., heritability estimates derived from genomewide SNPs; Rhee et al., Reference Rhee, Yang, Yu, Liu, Cheng, Deik and Gerszten2016; Tabassum et al., Reference Tabassum, Rämö, Ripatti, Koskela, Kurki, Karjalainen and Ripatti2019). In fact, the observed differences in additive heritability estimates among metabolite classes are rarely significant, while differences in heritability estimates based on known genetic variants are frequently significant (Hagenbeek et al., Reference Hagenbeek, Pool, van Dongen, Draisma, Jan Hottenga, Willemsen and Boomsma2020).
Whereas the contribution of genetic variants to metabolite levels is fairly well established, also through genome-wide association and (exome-) sequencing studies (Hagenbeek et al., Reference Hagenbeek, Pool, van Dongen, Draisma, Jan Hottenga, Willemsen and Boomsma2020; Kastenmüller et al., Reference Kastenmüller, Raffler, Gieger and Suhre2015; Yazdani et al., Reference Yazdani, Yazdani, Elsea, Schaid, Kosorok, Dangol and Samiei2019), the contribution of the shared or common environment (c 2) to metabolite levels is not as well characterized. Not all studies investigating the genetic contribution to metabolite levels were based on the classic twin design (e.g., Draisma et al., Reference Draisma, Beekman, Pool, van Ommen, Vaarhorst, de Craen and Boomsma2013; Tremblay et al., Reference Tremblay, Guénard, Lamarche, Pérusse and Vohl2019). Instead, these types of methods estimate the familial resemblance (or generalized heritability) of metabolite levels, which comprises both additive genetic effects and common environment effects shared by family members (Rice, Reference Rice2008). Studies using the classic twin design to investigate the contributions to metabolite levels vary widely with respect to how metabolites are influenced by common environment as well as in the estimate of the effects of the common environment. Overall, it would appear that studies in smaller samples more frequently report larger contributions of the common environment to metabolite levels (e.g., Frahnow et al., Reference Frahnow, Osterhoff, Hornemann, Kruse, Surma, Klose and Pfeiffer2017; Kettunen et al., Reference Kettunen, Tukiainen, Sarin, Ortega-Alonso, Tikkanen, Lyytikäinen and Ripatti2012). Large-scale twin studies that estimate the contribution of shared environment tend to be scarce.
In the current study, we aim to expand our understanding of the contribution of common environment shared by family members to variation in fasting blood metabolites and analyzed data from multiple metabolomics platforms from a large cohort of twins (between 1037 and 1407 twin pairs per platform), representing a general population. First, a series of power analyses were performed, estimating the statistical power to detect shared environment in the classical twin design, given the number of monozygotic (MZ) and dizygotic (DZ) twin pairs available in our study. The power to detect shared environment in quantitative genetic studies, employing the classical twin design, is influenced by effect size, the heritability of the trait, the sample size, the probability level that is chosen, and the homogeneity of means and variances in the MZ and DZ groups of the sample (Martin et al., Reference Martin, Eaves, Kearsey and Davies1978; Posthuma & Boomsma, Reference Posthuma and Boomsma2000). Sample size and probability were given, and we investigated different values for the proportion of variation explained by shared environment against a background of different heritability values that were chosen based on what is typically reported in the literature for metabolomics. Next, we determined the heritability of all metabolic traits by structural equation modeling where contributions to additive genetic effects (A), shared environmental effects between siblings (C) and unique environmental effects (E) were estimated. By computing the significance of the C variance component when comparing ACE model outcomes to AE model outcomes, we were able to assess whether C contributes to the total variance observed in all metabolic traits. Finally, to obtain insight into the distribution of chemical classes our metabolites belong to over the range of calculated heritabilities and contributions of shared environment, we performed enrichment analyses. The metabolic traits were grouped in heritability and shared environment estimate quartiles. By counting the number of metabolites of a given class per quartile and comparing these to the counts of the entire range of heritabilities or common environment contributions, we determined class enrichment factors per quartile and assessed their statistical significance by Fisher’s exact tests.
Methods
Participants
At the Netherlands Twin Register (NTR; Ligthart et al., Reference Ligthart, van Beijsterveldt, Kevenaar, de Zeeuw, van Bergen, Bruins and Boomsma2019) metabolomics data for twins were available for 886 complete MZ pairs and 601 complete DZ pairs (c.f. Table 1). All measurements were performed in blood samples that were collected from participants of the NTR biobank projects (Willemsen et al., Reference Willemsen, de Geus, Bartels, van Beijsterveldt, Brooks, Estourgie-van Burk and Boomsma2010; Willemsen et al., Reference Willemsen, Vink, Abdellaoui, den Braber, van Beek, Draisma and Boomsma2013). Blood samples were collected after overnight fasting. Fertile women were bled in their pill-free week or on day 2−4 of their menstrual cycle. For the Nightingale Health metabolomics platform (see below), data were acquired in several shipments (subsets). After completing the preprocessing of the metabolomics data, each platform subset (if applicable) was merged into a single per platform dataset, randomly retaining a single observation per platform whenever multiple observations were available. Characteristics for the sample of individuals included in the analyses can be found in Table 1. Informed consent was obtained from all participants. Projects were approved by the Central Ethics Committee on Research Involving Human Subjects of the VU University Medical Centre, Amsterdam, an Institutional Review Board certified by the US Office of Human Research Protections (IRB number IRB00002991 under Federal-wide Assurance-FWA00017598; IRB/institute codes and NTR 03-180).
Table 1. Participant characteristics by the Nightingale, lipidomics and NMR-LUMC platforms
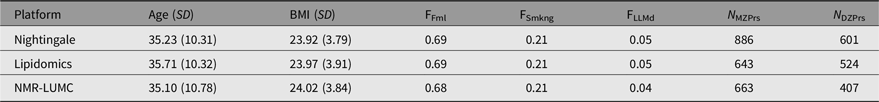
Note: Age (SD) denotes the mean age and standard deviation, BMI (SD) the mean BMI and standard deviation, FFml the fraction of female subjects, FSmkng the fraction of current smokers, FLLMd the fraction of subjects using lipid lowering medication, N MZPrs the number of complete monozygotic twin pairs and N DZPrs the number of complete dizygotic twin pairs.
Metabolite Profiling
Below, we briefly describe the methods used for metabolite profiling. For more detailed information, see Hagenbeek et al. (Reference Hagenbeek, Pool, van Dongen, Draisma, Jan Hottenga, Willemsen and Boomsma2020).
Nightingale Health 1H-NMR platform
Metabolic biomarkers were quantified from plasma samples using high-throughput proton nuclear magnetic resonance spectroscopy (1H-NMR) metabolomics (Nightingale Health Ltd, Helsinki, Finland). This method provides simultaneous quantification of routine lipids, lipoprotein subclass profiling with lipid concentrations within 14 subclasses, fatty acid composition, and various low-molecular weight metabolites, including amino acids, ketone bodies and glycolysis-related metabolites in molar concentration units. Details of the experimentation and epidemiological applications of the NMR metabolomics platform have been reviewed previously (Soininen et al., Reference Soininen, Kangas, Würtz, Suna and Ala-Korpela2015; Würtz et al., Reference Würtz, Kangas, Soininen, Lawlor, Davey Smith and Ala-Korpela2017).
UPLC-MS lipidomics platform
Plasma lipid profiling was performed at the division of Analytical Biosciences at the Leiden Academic Center for Drug Research at Leiden University/Netherlands Metabolomics Centre. The lipids were analyzed with an Ultra-High-Performance Liquid Chromatograph directly coupled to an Electrospray Ionization Quadruple Time-of-Flight high-resolution mass spectrometer (UPLC-ESI-Q-TOF; Agilent 6530, San Jose, CA, USA) that uses reference mass correction. For liquid chromatographic separation, a ACQUITY UPLC HSS T3 column (1.8 μm, 2.1 × 100 mm) was used with a flow of 0.4 ml/min over a 16-min gradient. Lipid detection was performed using a full scan in the positive ion mode. The raw MS data were pre-processed using Agilent MassHunter Quantitative Analysis software (Agilent, Version B.04.00). Detailed descriptions of lipid profiling and quantification have been described previously (Dane et al., Reference Dane, Hendriks, Reijmers, Harms, Troost, Vreeken and Hankemeier2014; Gonzalez-Covarrubias et al., Reference Gonzalez-Covarrubias, Beekman, Uh, Dane, Troost, Paliukhovich and Slagboom2013).
Leiden 1H-NMR platform (for small metabolites)
The Leiden 1H-NMR spectroscopy experiment of ethylenediaminetetraacetic acid plasma samples used a 600-MHz Bruker Advance II spectrometer (Bruker BioSpin, Karlsruhe, Germany). The peak deconvolution method used for this platform has been previously described (Demirkan et al., Reference Demirkan, Henneman, Verhoeven, Dharuri, Amin, van Klinken and van Dijk2015; Verhoeven et al., Reference Verhoeven, Slagboom, Wuhrer, Giera and Mayboroda2017).
Metabolomics Data Preprocessing
To ensure our data were consistent with Hagenbeek, Pool, van Dongen, Draisma, Boomsma et al. (Reference Hagenbeek, Pool, van Dongen, Draisma, Jan Hottenga, Willemsen and Boomsma2020), we excluded participants if they were on lipid-lowering medication at the time of blood draw or if they had not adhered to the fasting protocol (~4 % of the sample of each platform). Preprocessing of the metabolomics data was executed for each of the platforms and measurement/shipment batches per platform separately. Metabolites were excluded from analysis when the mean coefficient of variation exceeded 25% or the missing rate exceeded 5%. Metabolite measurements were set to missing if they were below the lower limit of detection or quantification or could be classified as an outlier (five standard deviations greater or smaller than the mean). Metabolite measurements that were set to missing because they fell below the limit of detection/quantification were imputed with half of the value of this limit, or when this limit was unknown with half of the lowest observed level for this metabolite. All remaining missing values were imputed using multivariate imputation by chained equations (‘mice’; van Buuren & Groothuis-Oudshoorn, Reference Van Buuren and Groothuis-Oudshoorn2011). On average, nine values had to be imputed for each metabolite (SD = 12; range: 1−151). Data for each metabolite on the lipidomics platform and both 1H-NMR platforms were normalized by inverse normal rank transformation (Demirkan et al., Reference Demirkan, Henneman, Verhoeven, Dharuri, Amin, van Klinken and van Dijk2015; Kettunen et al., Reference Kettunen, Demirkan, Wurtz, Draisma, Haller, Rawal and Ala-Korpela2016).
We computed heritability for 237 single metabolic traits (i.e., no ratios or composite variables, see Supplementary Table S1). These traits are members of 11 different chemical classes, as listed by the human metabolome database (Hagenbeek et al., Reference Hagenbeek, Pool, van Dongen, Draisma, Jan Hottenga, Willemsen and Boomsma2020; Wishart et al., Reference Wishart, Feunang, Marcu, Guo, Liang, Vázquez-Fresno and Scalbert2018). As is shown in Table 2, most metabolites are lipid species.
Table 2. Chemical class counts for each platform used
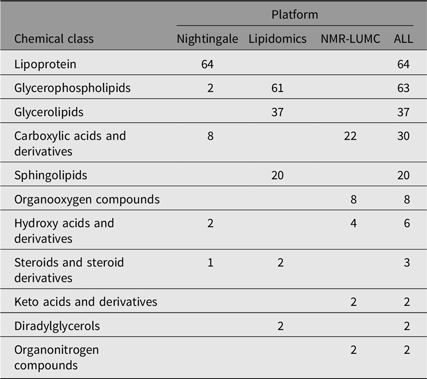
Note: The numbers in the platform columns represent the number of compounds of a chemical class, where ‘−’ means that there are none.
To account for confounding by age and sex, we used the residuals of the linear fit of model M i~Age + Sex for each metabolite i (Mi) as input for the statistical analyses. The above data processing steps were performed in the Jupyterlab environment (v0.35.4), running an IPython kernel (v5.1.1: python v3.7.3) and utilizing modules pandas (v0.24.2), scipy (v1.2.1) and statsmodels (v0.9.0). The complete lists with full names of all detected metabolites that survived QC and preprocessing for all platforms can be found in Supplementary Table S1.
Statistical Analyses
Power analyses
We calculated covariance matrices for multiple combinations of heritability and the proportion of variation explained by common environment (C). Background heritability differed between 0.2 and 0.7, which are typical values estimated for metabolites (Hagenbeek et al., Reference Hagenbeek, Pool, van Dongen, Draisma, Jan Hottenga, Willemsen and Boomsma2020). Within heritability class, the effect of C was increased from 0.1 to 0.3. Power analyses were carried out in the statistical software package Mx (Maes et al., Reference Maes, Neale, Medland, Keller, Martin, Heath and Eaves2009; Neale, Reference Neale1997), with estimation of parameters by normal theory maximum likelihood. Goodness-of-fit testing was based on likelihood ratio tests. First, an ACE model was considered, and next the influence of C was constrained at 0 and power was obtained for a 1 degree of freedom test with p = .05. Note that we do not take into account the number of tests performed, which would lower the probability level (and hence lower the power to detect C).
Genetic analyses
For each metabolite M i, we estimated the additive genetic contribution (A) and the contributions of common and unique environment (C and E). We applied genetic structural equation modeling using maximum likelihood estimation on both ACE and AE models. By comparing the outcomes of both models, for each metabolite, we applied a threshold of 3.84 on the χ2 statistic, above which we considered the contribution of C significant. The analyses were performed in the R software package (v3.5.2) using the OpenMx (v2.13.2.161) library (applying the NPSOL optimizer) for running the ACE and AE models (Boker et al., Reference Boker, Neale, Maes, Wilde, Spiegel, Brick and Fox2011).
Analyses of chemical class enrichment over heritability percentile groups
We subdivided the outcomes of the additive genetic components of the heritability or common environment variance component into three groups: (1) the 0−25 percentile group, (2) the 25−75 percentile group and (3) the 75−100 percentile group. In each group, we counted the number of class memberships of the metabolites. Within each group, we performed Fisher’s exact tests (Fisher, Reference Fisher1922) of the group chemical class counts with respect to their counts in the entire sample.
Results
Power Analyses
The outcomes of the power analyses are summarized in Table 3. As can be observed from these results, for all three platforms, when A is in the range of 0.2–0.6, a larger sample size is needed to enable detection of C ≤ 0.2. This implies that when we observe a statistically significant C variance component, its minimal value needs to be approximately 0.2.
Table 3. Statistical power estimates as a function of values for A, C, rMZ and rDZ for the metabolomics platforms in this work
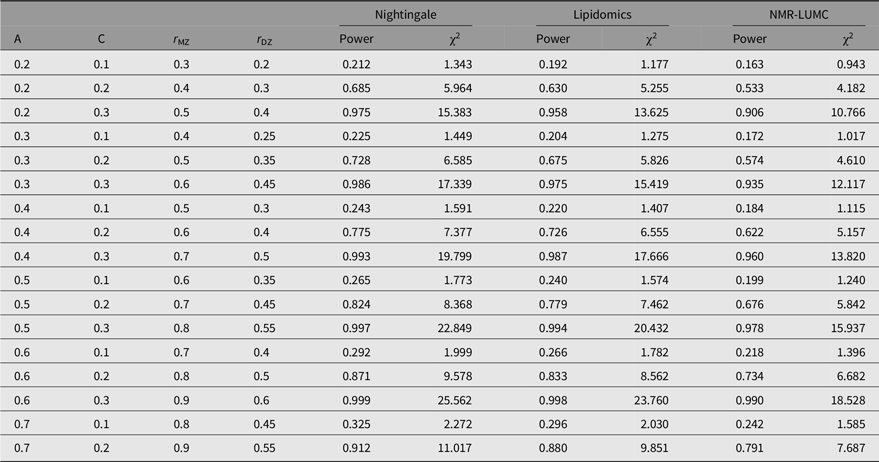
Note: A, additive genetic effects; C, shared environmental effects between siblings; E, unique environmental effects; MZ, monozygotic; DZ, dizygotic. For determining the estimates, we applied N(MZ pairs) = 848 and N(DZ pairs) = 559 for the Nightingale platform, N(MZ pairs) = 612 and N(DZ pairs) = 504 for the lipidomics platform, and N(MZ pairs) = 648 and N(DZ pairs) = 389 for the NMR-LUMC platform.
Genetic Analyses
The results of the ACE models for each platform and across the platforms are listed in Table 4. The results of the ACE and AE models are summarized graphically in Figure 1. On average, the analyses included 694 (range 612–848) and 503 (range 389–559) MZ and DZ pairs, respectively. For 6 of the 237 metabolites, we observe a significant contribution of c 2 ranging from 0.175 to 0.423 (mean = 0.254). Over 6 ACE models and 231 AE models, the mean additive genetic variance component a 2 is 0.456 (range 0.136–0.735) and the mean of the residual error and unique environment variance component e 2 is 0.527 (range 0.265–0.864). Supplementary Figures S1 and S2 depict the model outcomes for the AE and ACE models, respectively. Supplementary Figure S2 shows the MZ and DZ twin correlations for all metabolites.
Table 4. Summary of the AE (a) and ACE models (b and c) per platform and combined across platforms. Table 4b lists the ACE component means and variances only for the traits that exhibited a signifacant contribution of C. Table 4c lists the ACE component means and variances irrespective of the significance of the contribution of C
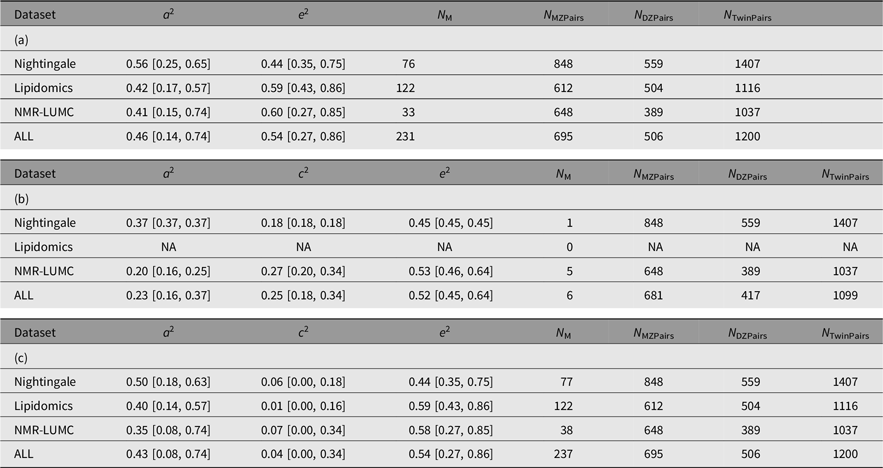
Note: A, additive genetic effects; C, shared environmental effects between siblings; E, unique environmental effects; MZ, monozygotic; DZ, dizygotic. For each metabolomics platform, the additive genetic variance component a 2 and the variance component of the common environment c 2 are listed. These outcomes are based on N M metabolites of which N M(ACE) have a significant C component. The analyses are based on N MZPairs and N DZPairs of MZ and DZ twin pairs. The bottom row lists the statistics over all platforms. Values for the individual metabolites are listed in Supplementary Table S1.
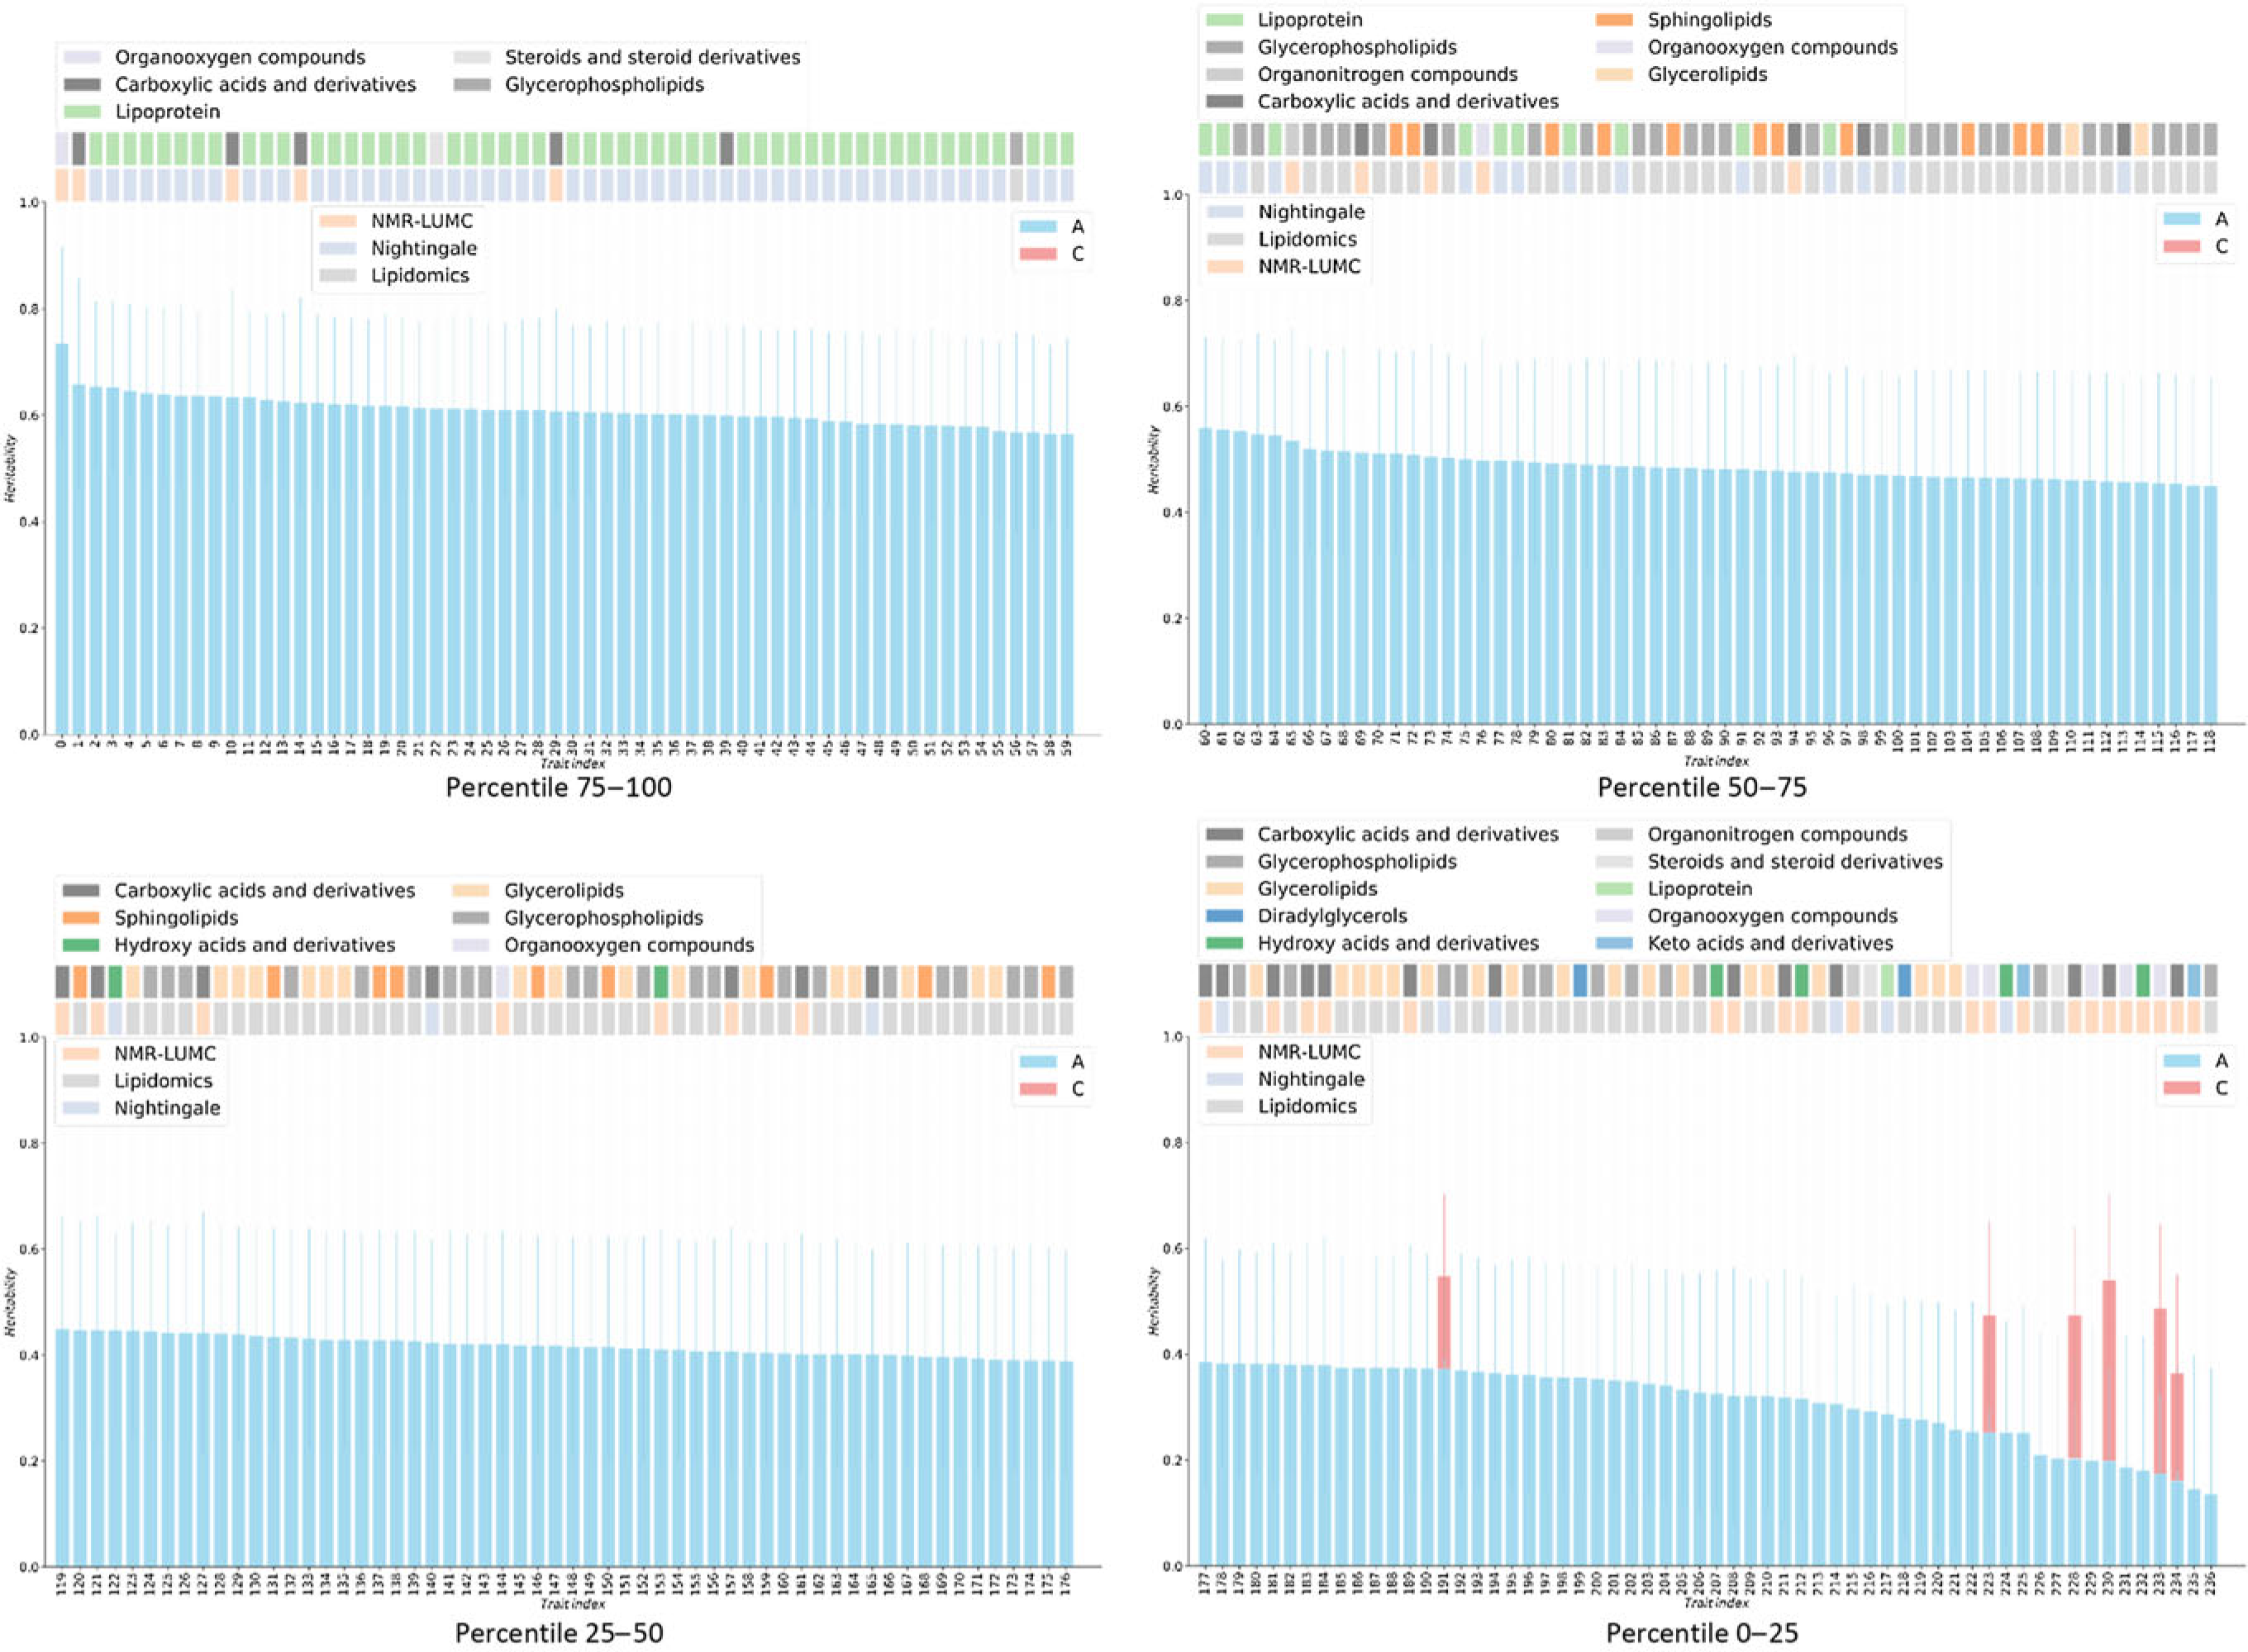
Fig. 1. Heritabilities for twin AE or ACE models. For the six metabolites showing a red bar, a significant contribution of C was observed (χ2 > 3.84). For all other metabolites, only estimates for the additive genetic component are shown, as determined by AE models. On the top of bar plot, two color bars are depicted that indicate the chemical class of the metabolite (top bars) and the metabolomics platform of the metabolite was reported from (bottom bars). The x-axes denote the indices of the metabolites, listed in Supplementary Table S1.
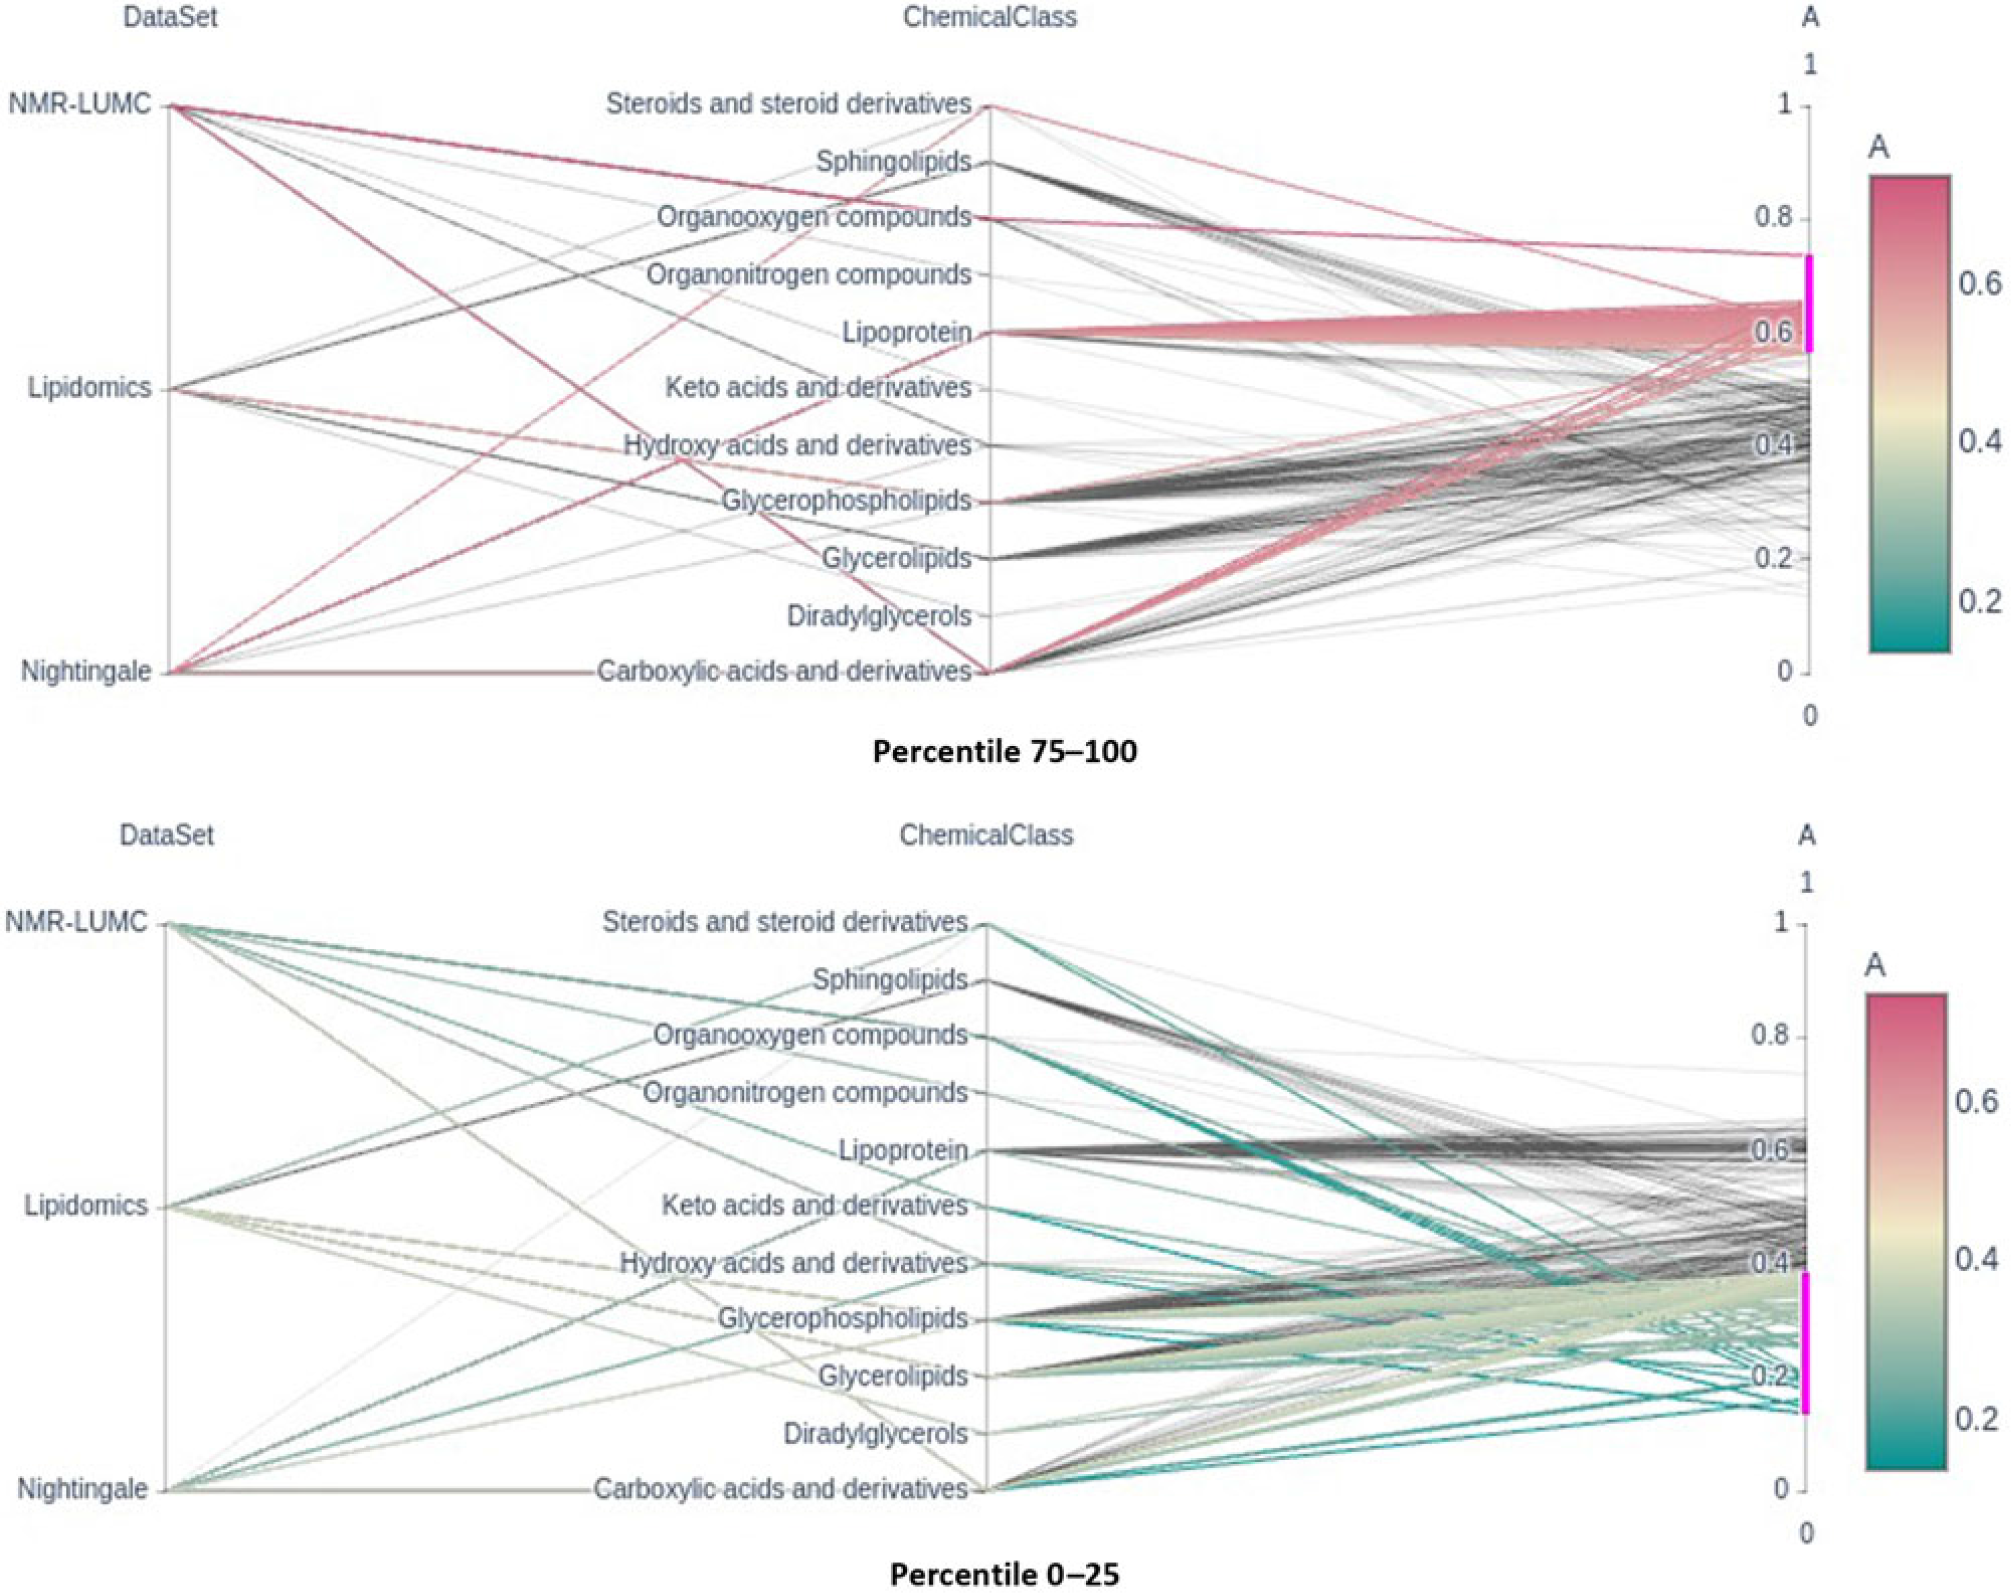
Fig. 2. Parallel coordinates plots of the top and bottom heritability quartlies showing the enrichment of the lipoprotein chemical class in the top percentile and its underrepresentation in the bottom percentile groups. Note that classes glycerophospholipids and glycerolipids are underrepresented in the top percentile group.
Analyses of Chemical Class Enrichment Over Percentile Groups of Heritabilities and Shared Environment Variance Components
Only six metabolic traits exhibit a significant shared environment variance component, rendering it futile to perform an enrichment analysis over C percentile groups. As can be observed in Figure 1, it seems that the lipoprotein chemical class is overrepresented in the top heritability percentile group and underrepresented in percentiles 25–50 and 0–25. This is confirmed by enrichment analyses of the chemical groups across the different heritability percentile groups (Table 5). Moreover, chemical classes glycerophospholipids and glycerolipids are significantly underrepresented in the top percentile group 75–100. The parallel coordinates plots in Figure 2 summarize these findings graphically.
Table 5. Representation of chemical classes across the percentiles of the additive genetic component (A) values as determined by the AE models
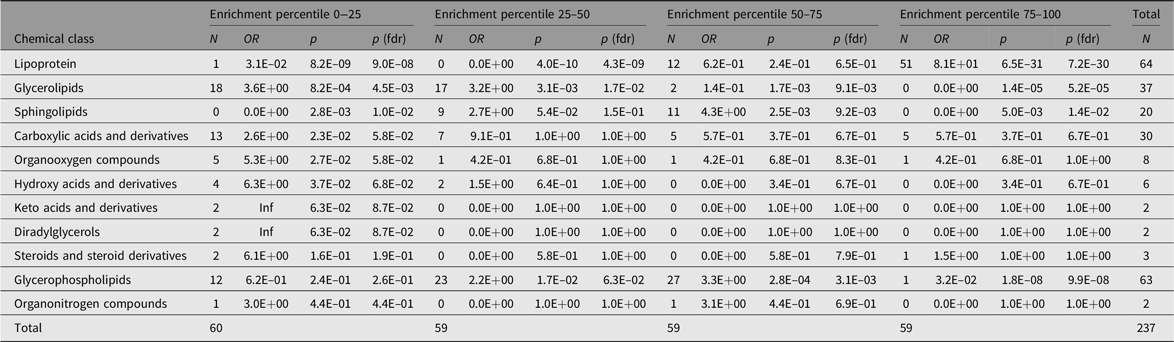
Note: The Count columns list the metabolite counts per chemical class. The enrichment statistics are coming from Fisher’s exact test performed over all metabolite class counts per subset with respect to the entire sample. OR columns list the odds ratios per chemical class, p columns the associated p values and p (fdrb) the Benjamini–Hochberg false discovery rate corrected ones.
Discussion
Metabolites have an important role in the relationship between the genotype and health and disease. Therefore, characterizing the factors influencing metabolite levels is a vital first step toward elucidating the mechanisms underlying health and disease. It is well established that metabolite levels are influenced by a complex interplay of genetic and environmental influences; however, the role of the common, or shared, environment in metabolite levels remains unclear. Here, we investigated the contribution of the common environment to variation in fasting blood metabolite levels in a large twin cohort. Although our study had sufficient power to detect a contribution of the common environment to the metabolite levels of 20% or higher, we found little evidence for a contribution of this size. In contrast, but in line with expectations, we found that additive genetics contributed significantly to metabolite levels. We found that the top 25% most heritable metabolites included mostly lipoproteins, while lipoproteins were underrepresented in the other.
Our conclusions need to be placed in the context of the design, platforms and biofluid that were used. First, while we established that with a fixed sample size, a probability level of 5% and depending on the background heritability, a contribution of common environment of 20% can be detected with reasonable power. A contribution of the common environment of 30% had very high statistical power for all platforms. However, when the contribution of the common environment is small, even for the largest sample sizes in our study (Nightingale platform with 848 MZ and 559 DZ twin pairs), the power to detect common environment shared by twins is low. Second, our study was cross-sectional, not longitudinal. While the fasting metabolite levels of individuals are generally stable over time (Lacruz et al., Reference Lacruz, Kluttig, Tiller, Medenwald, Giegling, Rujescu and Kastenmüller2018), age is a well-established factor influencing metabolite levels, with higher levels observed in adults as compared to children (Ellul et al., Reference Ellul, Wake, Clifford, Lange, Würtz, Juonala and Saffery2019). Third, this work involves metabolic traits measured in blood. Results reported here do not necessarily represent those expected for other tissue types. Fourth, we investigated ‘fasting state’ metabolite levels. As such, this can be considered a relatively stable homeostatic state, in contrast to states of high energy consumption or after food and/or drink intake. Finally, this study, as most others, includes platforms favoring lipids, limiting the conclusions we may draw with regard to nonlipid species (Hagenbeek et al., Reference Hagenbeek, Pool, van Dongen, Draisma, Jan Hottenga, Willemsen and Boomsma2020).
We observed a limited contribution of common environment to the total variation in metabolite levels: we estimated a significant contribution of the common environment only for 6 out of 237 metabolites. For these 6 traits, the average contribution to the common environment was 0.25 (range: 0.17−0.34). Our findings are in line with previous studies reporting an influence of the common environment for a minority of the investigated metabolites, with average contributions of the common environment frequently lower even than the 0.25 we observed (Kettunen et al., Reference Kettunen, Tukiainen, Sarin, Ortega-Alonso, Tikkanen, Lyytikäinen and Ripatti2012; Menni et al., Reference Menni, Zhai, MacGregor, Prehn, Römisch-Margl, Suhre and Valdes2013; Yet et al., Reference Yet, Menni, Shin, Mangino, Soranzo, Adamski and Bell2016). The limited contribution of the common environment on metabolite levels is also consistent with observations for other molecular traits, such as expression (Ouwens et al., Reference Ouwens, Jansen, Nivard, van Dongen, Frieser, Hottenga and Boomsma2020; Wright et al., Reference Wright, Sullivan, Brooks, Zou, Sun, Xia and Boomsma2014) or methylation levels (van Dongen et al., Reference van Dongen, Nivard, Willemsen, Hottenga, Helmer, Dolan and Boomsma2016), which were measured in the same group of twin pairs as in this work. This is in stark contrast to a recent family-based study that reported substantial familial resemblance in metabolite levels to which common environment had the strongest contribution (Tremblay et al., Reference Tremblay, Guénard, Lamarche, Pérusse and Vohl2019). A strong contribution of the common environment has also been observed for specific lipid species, while other lipid species had no or only small contributions of the common environment (Frahnow et al., Reference Frahnow, Osterhoff, Hornemann, Kruse, Surma, Klose and Pfeiffer2017). It must be noted that those studies reporting substantial influence of the common environment frequently have small sample sizes and are generally younger than our own samples.
The observation that an effect of the common environment is more frequently reported in younger participants is in line with observations for other complex traits. For several complex traits with a strong influence of the common environment during childhood, this decreases greatly with age, often completely disappearing in adulthood (Haworth et al., Reference Haworth, Wright, Luciano, Martin, De Geus, Van Beijsterveldt and Plomin2010; Lamb et al., Reference Lamb, Middeldorp, van Beijsterveldt, Bartels, van der Aa, Polderman and Boomsma2010). Currently, longitudinal genetic investigations of metabolite levels starting in childhood are lacking. Therefore, we may not definitely conclude that a similar pattern holds for metabolite levels. Moreover, in general for studies including adult samples, the question arises what the common environment comprises (Finnicum et al., Reference Finnicum, Beck, Dolan, Davis, Willemsen, Ehli and De Geus2019; Zaitlen et al., Reference Zaitlen, Kraft, Patterson, Pasaniuc, Bhatia, Pollack and Price2013). In adult twin pairs living apart the common environment may represent lasting influences of their time spend living together. Alternatively, the common environment could reflect similar living environments, including the same (or similar) neighborhood, exposure to similar pollutants or shared lifestyles. Thus, while many environmental factors influencing metabolite levels have been identified, the distinction between common and unique environmental factors remains unclear.
We found an overrepresentation of lipoproteins with heritability estimates in the highest quartile. Interestingly, we observed no differences in total heritability estimates between lipoproteins and other lipid classes in the same sample using genome-wide SNP data; however, the portion of heritability due to known metabolite loci did differ between lipid classes (Hagenbeek et al., Reference Hagenbeek, Pool, van Dongen, Draisma, Jan Hottenga, Willemsen and Boomsma2020). This could indicate that the genetic relationship estimates from genome-wide SNP data do not comprise enough information to assess this enrichment. Combining the enrichment results with our previous findings that class-specific metabolite loci have a larger contribution to metabolite heritability than nonclass loci suggests the merit of investigating the genetics of biochemical pathways rather than individual metabolites. The strength of leveraging knowledge of biochemical pathways in genetic investigations has been previously established. Genetic investigations of metabolite ratios reflecting enzymatic conversions in biochemical pathways have led to stronger associations than studying single metabolites (Suhre et al., Reference Suhre, Raffler and Kastenmüller2016). Similarly, multivariate genomewide association studies of correlated metabolic networks have proven effective (Inouye et al., Reference Inouye, Ripatti, Kettunen, Lyytikäinen, Oksala, Laurila and de Bakker2012).
Conclusion
Based on structural equation modeling in twins, a significant heritability was found for the blood concentrations of 231 metabolites, explaining 46% of their variance on average. We find that in the top 25% most heritable metabolites, those of class lipoprotein are overrepresented, while metabolites of classes glycerophospholipids and glycerolipids are underrepresented. In contrast, we find little evidence of shared environment influences on individual differences in metabolite levels. These findings show that familial resemblance in the concentrations of metabolites is due to genetic factors with minimal contribution of the shared environment.
Acknowledgments
We warmly thank all twins and family members for their participation.
Supplementary material
To view supplementary material for this article, please visit https://doi.org/10.1017/thg.2020.53.
Financial support
This work was performed within the framework of the BBMRI Metabolomics Consortium funded by BBMRI-NL, a research infrastructure financed by the Dutch government (NWO, no. 184.021.007 and 184.033.111). Analyses were supported by the Netherlands Organization for Scientific Research: Netherlands Twin Registry Repository: researching the interplay between genome and environment (480-15-001/674); the European Union Seventh Framework Program (FP7/2007-2013): ACTION Consortium (Aggression in Children: Unravelling gene-environment interplay to inform Treatment and InterventiON strategies; grant number 602768).
Conflict of Interest
None.
Ethical Standards
The authors assert that all procedures contributing to this work comply with the ethical standards of the relevant national and institutional committees on human experimentation and with the Helsinki Declaration of 1975, as revised in 2008.


 Open access