

The epigenetic mechanism of DNA methylation is highly dynamic throughout the human lifespan. Many factors influence the process of attachment and release of methyl groups at a particular DNA segment and consequently, also the gene expression level. Apart from genetic factors that can influence DNA methylation, the environment should also be taken into account when studying DNA methylation (Qiu et al., Reference Qiu, Wan, Morrow, Cho, Crapo, Silverman and DeMeo2015). Environment can be defined as a combination of internal factors, such as intra- and intercellular mechanisms, and external factors, such as habitat, pollution, radiation, microbiological agents, and lifestyle. Taking a closer look at lifestyle as a factor influencing DNA methylation, physical activity (PA) and nutrition are the two main components that are highly variable within the human population (Burkert et al., Reference Burkert, Muckenhuber, Groβschädl, Rásky and Freidl2014; Loyen et al., Reference Loyen, Van Hecke, Verloigne, Hendriksen, Lakerveld, Steene-Johannessen and van der Ploeg2016). In addition, PA is known to have a beneficial effect on cardiovascular, metabolic, muscular, and skeletal health through several mechanisms (Burton et al., Reference Burton, Stokes and Hall2004). Therefore, investigating the relationship between PA and DNA methylation could offer new insights on how PA influences human health.
Although there is a major direct effect of PA on human health, several studies indicate that some aspects of human health are indirectly influenced by PA through the epigenetic mechanism of DNA methylation. Brennan-Olsen et al. (Reference Brennan-Olsen, Page, Berk, Riancho, Leslie, Wilson and Williams2016) pointed to the importance of the effect of lifestyle on osteoporosis through changes in DNA methylation and subsequent dysregulation and inflammation. Earlier on, Delgado-Calle and Riancho (Reference Delgado-Calle and Riancho2012) noted that interventions to prevent osteoporosis could be improved by having a better understanding of how lifestyle can influence DNA methylation. Also, the development of type 2 diabetes is influenced by PA through alterations in DNA methylation, leading to different levels of skeletal muscle glucose uptake (Dos Santos et al., Reference Dos Santos, Moreli, Tewari and Benite-Ribeiro2015). Furthermore, Wu et al. (Reference Wu, Zhao, Shen, Huang, Zhang, Yan and Mi2015) suggested that child obesity is related to modifications in methylation pattern at the promoter of FAIM2, caused by lifestyle factors such as sedentary behavior (SB) and PA.
When focusing on methylation of the entire genome, a number of studies associate larger amounts of PA with a higher degree of methylation. White et al. (Reference White, Sandler, Bolick, Xu, Taylor and DeRoo2013) found that global DNA methylation levels in peripheral blood cells increase with increasing amounts of PA, thereby possibly counteracting excessive and unbalanced expression of particular genes. However, the effect of PA on DNA methylation seems to be highly tissue- and gene-specific. A recently performed exercise intervention study affected DNA methylation in different tissues in a different way. In adipose tissue, DNA methylation levels predominantly increased for the majority of differentially methylated genes, resulting in lower gene expression levels (Rönn et al., Reference Rönn, Volkov, Davegårdh, Dayeh, Hall, Olsson and Ling2013). On the contrary, DNA methylation levels in skeletal muscle tissue predominantly decreased within differentially methylated genes, mostly leading to higher gene expression levels (Nitert et al., Reference Nitert, Dayeh, Volkov, Elgzyri, Hall, Nilsson and Ling2012).
One of the genes that showed decreased methylation in skeletal muscle tissue in response to PA is PPARGC1A, which encodes the transcriptional coactivator peroxisome proliferator activated receptor gamma coactivator 1 alpha (PGC1α), known to regulate the expression of genes influencing mitochondrial oxidative phosphorylation. Alibegovic et al. (Reference Alibegovic, Sonne, Højbjerre, Bork-Jensen, Jacobsen, Nilsson and Vaag2010) found increased methylation of PPARGC1A when subjects were exposed to bed rest for 9 days, suggesting that SB could have an opposite effect on DNA methylation compared to PA. In addition, Barrès et al. (Reference Barrès, Yan, Egan, Treebak, Rasmussen, Fritz and Zierath2012) found that acute high-intensity PA caused an immediate reduction of PPARGC1A promoter methylation, whereas no significant changes in methylation were found after low-intensity PA. This finding indicates that an intensity threshold exists above which skeletal muscle contractions result in acute gene-specific decreases in promoter methylation, leading to gene activation that triggers structural and metabolic adaptations in the muscle.
Although many components of the interaction between PA, DNA methylation, and human health are discussed in the abovementioned studies, PA assessment is mostly questionnaire-based and not much is known about how different PA patterns influence different aspects of human health. Moreover, SB is not even taken into account in most studies. Therefore, the aim of this study was to explore how time spent on three different levels of PA intensity, measured in an objective way and covering SB, affects global and gene-specific methylation levels in middle-aged men. We hypothesized that spending more time on SB results in a lower level of global DNA methylation, whereas spending more time on being physically active is expected to cause a higher level of global DNA methylation. Furthermore, we also expect that SB, light PA, and more intense PA each influence methylation within a different set of genes and thereby regulate different health-related pathways. On the other hand, we presumed that methylation of some genes is influenced by more than one PA intensity level, potentially in an opposite way.
Materials and Methods
Subjects
In this exploratory study, 41 healthy Flemish men (56.4 ± 0.6 years) were measured within the framework of the third generation Flemish Policy Research Centre Sport (2012–2015). Recruitment was done earlier within the framework of the Leuven Longitudinal Study on Lifestyle, Fitness and Health (LLSLFH; Matton et al., Reference Matton, Beunen, Duvigneaud, Wijndaele, Philippaerts, Claessens and Lefevre2007). Written informed consent was obtained from all participants and the study was approved by the Medical Ethics Committee of KU Leuven (S54083).
Physical Activity and Sedentary Behavior
PA and SB were measured using a SenseWear Pro 3 Armband (BodyMedia, Inc., Pittsburgh, PA, USA). Participants were asked to wear the device uninterrupted for seven consecutive days of a regular week, except during water-based activities. All 41 participants included in this study reached the compliance criterion, 1,296 minutes per day (90% of the full day), for at least three weekdays and both weekend days (Scheers et al., Reference Scheers, Philippaerts and Lefevre2012). The SenseWear Pro 3 Armband uses algorithms (SenseWear Professional Software, version 6.1) that combine information from multiple sensors with personal information of the subjects, and thus energy expenditure, PA intensity, and sleeping time can be estimated. The energy cost of physical activities is expressed in metabolic equivalents (METs), defined as the ratio of work metabolic rate to standard resting metabolic rate (kcal·kg−1·h−1). In accordance with the Compendium of Physical Activities (Ainsworth et al., Reference Ainsworth, Haskell, Herrmann, Mecknes, Bassett, Tudor-Locke and Leon2011), a distinction was made between time spent on four PA intensity levels: SB (<1.5 METs), light PA (LPA, 1.5–3 METs), moderate PA (MPA, 3–6 METs), and vigorous PA (VPA; >6 METs). As SenseWear algorithms were shown to underestimate energy expenditure during vigorous PA (Van Hoye et al., Reference Van Hoye, Mortelmans and Lefevre2014) and as most subjects hardly spent any minutes on VPA, MPA and VPA were jointly treated as one PA intensity level: moderate-to-vigorous PA (MVPA; >3METs). Additionally, estimated sleeping time was subtracted from time spent on SB for further analysis.
DNA Methylation
After an overnight fast, 4.5 ml blood, anticoagulated using EDTA, was drawn from an antecubital vein between 08:00 and 10:00 am. Genomic DNA was extracted using the chemagic Magnetic Separation Module I (PerkinElmer, Inc., Waltham, MA, USA). Sufficient DNA quality and quantity was assured using the DropSense96 spectrophotometer (Trinean, Gentbrugge, Belgium). The degree of methylation at 485,512 CpG sites in the genome was determined at single-nucleotide resolution using the Infinium HumanMethylation450 BeadChip (Illumina, Inc., San Diego, CA, USA). Each copy of a CpG site within a sample can be methylated (β = 1) or unmethylated (β = 0). Consequently, an average β can be calculated, representing the proportion of methylated copies of a particular CpG site within a sample. In the next step, IDAT files containing the raw β values were imported in the R software environment (version 3.3.0; R Core Team, 2016), after which the data were further processed using the package RnBeads (version 1.2.2; Assenov et al., Reference Assenov, Mueller, Lutsik, Walter, Lengauer and Bock2014). After quality control, CpG sites located on sex chromosomes or overlapping with SNPs were removed from the analysis, resulting in 371,050 remaining CpG sites. To decrease the level of technical noise and eliminate the systematic biases of the microarray procedure, the β values were normalized using the BMIQ strategy (Teschendorff et al., Reference Teschendorff, Marabita, Lechner, Bartlett, Tegner, Gomez-Cabrero and Beck2013). Blood cell type composition within the samples was estimated using 36 methylomes of six different reference cell types derived from six different subjects (Reinius et al., Reference Reinius, Acevedo, Joernik, Pershagen, Dahlén, Greco and Kere2012) according to the method described by Houseman et al. (Reference Houseman, Accomando, Koestler, Christensen, Marsit, Nelson and Kelsey2012), after which the β values were corrected for cell type heterogeneity between the samples. Subsequently, the β values were exported to Partek Genomics Suite (version 6.6; Partek, Inc., St. Louis, MO, USA) and corrected for age and between-slide effects within the batch.
Statistical Analyses
To be able to investigate associations between global DNA methylation and time spent on SB, LPA, and MVPA, all β values were converted to z-scores using the mean and standard deviation of the β values per CpG site. Subsequently, the average z-score across all CpG sites was calculated for each subject, representing the global DNA methylation level of that subject compared to the average global DNA methylation level of the sample. Using Partek Genomics Suite, Pearson correlation coefficients were calculated to study associations between time spent on the different PA intensity levels and the degree of global DNA methylation, represented by this average z-score. To investigate whether time spent on one particular PA intensity level can predict the degree of methylation at a particular CpG site, linear regression analyses were performed using Partek Genomics Suite. For each PA intensity level, 371,050 linear regressions were performed, treating time spent on SB, LPA, or MVPA as an independent variable and the β values per CpG site as dependent variables. As a result, two sets of associated CpG sites were created for each PA intensity level, based on significance levels α = 0.05 and α = 0.005. Since correction for multiple testing based on the false discovery rate (FDR) method did not result in any significantly associated CpG sites, except for one CpG site in association with time spent on SB, unadjusted p values were chosen as cut-offs for the linear regression analyses. Using these cut-offs, a sufficient number of significantly associated CpG sites were obtained to be able to perform a biological pathway analysis. Based on the RefSeq database (O'Leary et al., Reference O'Leary, Wright, Brister, Ciufo, Haddad, McVeigh and Pruitt2016), a list of genes whose promoter region overlaps with at least one significantly associated CpG site was created for each PA intensity level. Next, these gene lists were subjected to a biological pathway analysis, using the KEGG database (Kanehisa et al., Reference Kanehisa, Furumichi, Tanabe, Sato and Morishima2017) as a reference. For each gene list, all pathways in the KEGG database were given an enrichment score based on the number of genes in the gene list, the number of genes in the pathway, and the percentage of genes in the pathway that are also present in the gene list. Subsequently, the pathways were put in order based on the significance of the enrichment score. Only pathways consisting of at least 3 genes were included in the analyses. Associations between time spent on the different PA intensity levels and promoter methylation of genes within the pathways were visualized using Partek Pathway (Partek, Inc., St. Louis, MO, USA). A power analysis was performed using the software G*Power (version 3.1; Heinrich-Heine-Universität Düsseldorf, Düsseldorf, Germany).
Results
Physical (In)Activity Parameters
The average time per day spent on SB, LPA, MVPA, and sleep, measured using the SenseWear Pro 3 Armband, is presented in Table 1. A large coefficient of variation can be observed for time spent on MVPA.
TABLE 1 Physical (In)Activity Parameters
Data in parentheses represent the minimum and maximum time spent on the concerned PA intensity level across the 41 subjects.
DNA Methylation in Relation to the PA Intensity Levels
In Table 2, associations are shown between the global DNA methylation level and time spent on SB, LPA, and MVPA. For none of the three PA intensity levels was a significant correlation found with the global DNA methylation z-score.
TABLE 2 Associations Between Global DNA Methylation and the PA Intensity Levels

A Pearson product-moment correlation coefficient was calculated between the time spent on each PA intensity level and the average z-score of the subjects, representing the average methylation level of each subject relative to the other subjects over 371,050 CpG sites.
The number of CpG sites whose methylation level is associated with time spent on SB, LPA, and MVPA are listed in Table 3, based on two different significance levels. At both α = 0.005 and α = 0.05, an equivalent number of CpG sites are associated with SB, LPA, and MVPA. For a small majority of CpG sites associated with SB, methylation level is positively correlated with time spent on SB. On the other hand, for the vast majority of CpG sites associated with LPA and MVPA, methylation level is negatively correlated with time spent on these PA intensity levels. For all three PA intensity levels, the percentage of associated CpG sites with a positive correlation between methylation level and time spent on the concerned PA intensity level is lower at α = 0.005 than at α = 0.05. In addition, the percentages in Table 3 are in line with the directions of the correlation coefficients in Table 2. More detailed tables regarding the associations between CpG site-specific methylation and time spent on SB, LPA, and MVPA can be found in the online supplementary material (Supplementary Tables S1–S3).
TABLE 3 Number of CpG sites Whose Methylation Level is Associated With SB, LPA, and MVPA
Percentages indicate the portion of CpG sites whose methylation level is positively correlated with time spent on the respective PA intensity level.
Pathway Analysis
The pathways from the KEGG database (Kanehisa et al., Reference Kanehisa, Furumichi, Tanabe, Sato and Morishima2017) of which methylation is significantly associated with time spent on SB, LPA, or MVPA at α = 0.05, are listed in Table 4. All three PA intensity levels are associated with a similar number of pathways. The gene lists that were used to perform this pathway analysis can be found in the online supplementary material (Supplementary Tables S4–S6).
TABLE 4 Pathways Associated With the Three PA Intensity Levels (p < .05)
The numbers in parentheses correspond to the different functional groups in which the pathways are subdivided, as indicated in Figure 1. This subdivision is based on the KEGG database (Kanehisa et al., Reference Kanehisa, Furumichi, Tanabe, Sato and Morishima2017).
For each functional group, according to the KEGG database (Kanehisa et al., Reference Kanehisa, Furumichi, Tanabe, Sato and Morishima2017), the number of pathways of which methylation is significantly associated (α = 0.05) with time spent on SB, LPA, and MVPA are shown in Figure 1. Pathways related to infectious diseases and signaling and pathology of cardiomyocytes as well as the excretory ‘vasopressin-regulated water reabsorption’ pathway are all associated with only one PA intensity level. Pathways related to different cancer types and the processing of genetic information are associated with SB, LPA or both, but not with MVPA. On the other hand, pathways related to aging and substance dependence are associated with SB, MVPA or both, but not with LPA. The ‘circadian entrainment’ pathway is the only pathway that is associated with both LPA and MVPA (Table 4). All other functional groups include pathways in association with SB, LPA, and MVPA. The ‘endocytosis’ and ‘cholinergic synapse’ pathways are even associated with all the three PA intensity levels (Table 4). Pathways related to signal transduction are more often associated with SB and MVPA than with LPA, whereas four pathways related to cellular processes are only associated with LPA. More detailed figures regarding the associations between methylation of the pathways mentioned in Table 4 and time spent on the three PA intensity levels can be found in the online supplementary material (Supplementary Figures S1–S69).
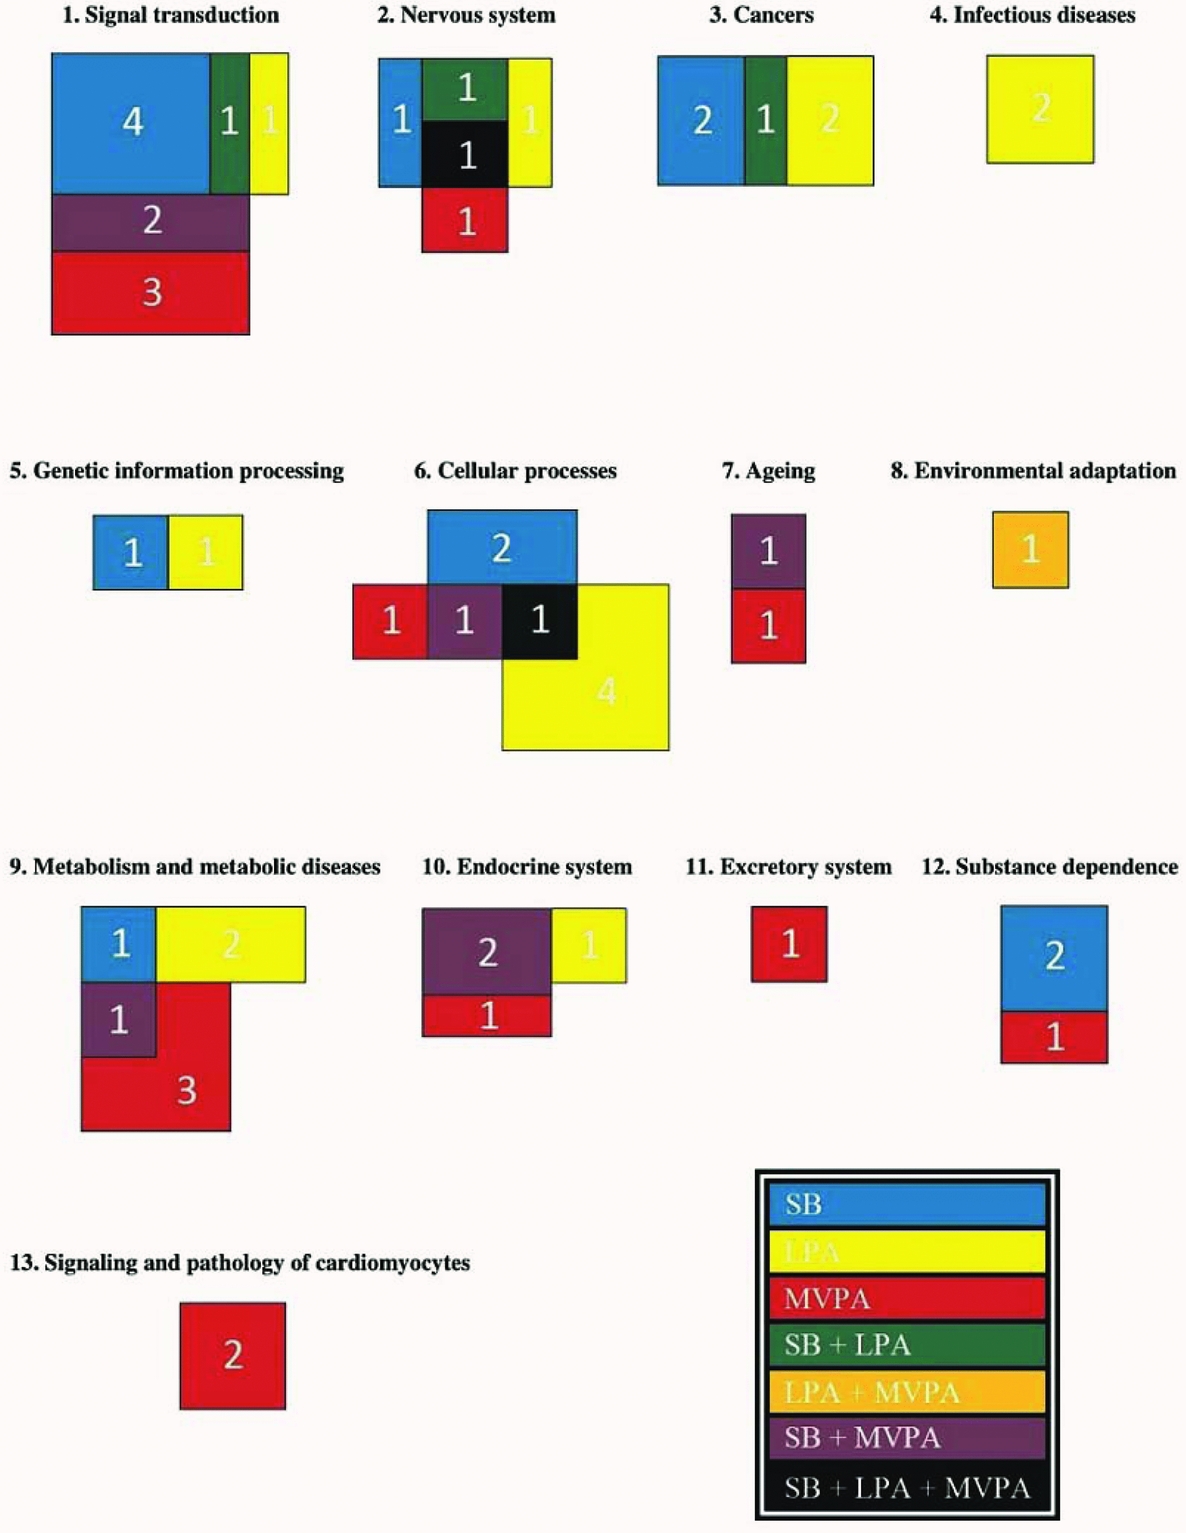
FIGURE 1 The number of pathways in each functional group of which methylation is associated with time spent on SB, LPA, and MVPA (p < .05). Subdivision of the pathways in functional groups is based on the KEGG database (Kanehisa et al., Reference Kanehisa, Furumichi, Tanabe, Sato and Morishima2017). The exact pathways per functional group can be found in Table 4. The different colors point to the different combinations of PA intensity levels the pathways are associated with, as indicated in the lower right corner of the figure.
Discussion
Physical (In)Activity Assessment
An important asset of this exploratory study is that PA and SB were assessed objectively using the SenseWear Pro 3 Armband. As most other related studies use questionnaires instead of portable multisensor devices, it can be argued that PA and SB were assessed in a more reliable way in this study. The coefficient of variation of time spent on MVPA was larger than the coefficient of variation of time spent on LPA. A possible explanation is that it seems quite easy for people to reach the threshold of 1.5 METs for LPA multiple times a day during household activities and transportation, whereas it might be harder for some people to reach the threshold of 3 METs for MVPA because of inter-individual differences in rate of energy consumption and execution of highly energy-consuming activities (Ainsworth et al., Reference Ainsworth, Haskell, Whitt, Irwin, Swartz, Strath and Leon2000). This is confirmed by our data, as four subjects spent less than 1 hour a day on MVPA, while six subjects spent more than 4 hours a day above 3 METs. Furthermore, the subjects in this study are potentially more physically active than their peers in the general population because of participation bias.
Global DNA Methylation in Relation to Physical (In)Activity
Although none of the correlations in Table 2 are significant, the direction of the correlation coefficients is opposite to what could be expected, as a positive association is generally reported between time spent on PA and global DNA methylation, resulting in less genomic instability since expression levels of repetitive sequences are not enhanced (Sharma et al., Reference Sharma, Kelly and Jones2010). White et al. (Reference White, Sandler, Bolick, Xu, Taylor and DeRoo2013) found that being more physically active than average during the past year resulted in higher global DNA methylation levels in peripheral blood, although this association was not significant. Nevertheless, it should be noted that in the study of White et al. (Reference White, Sandler, Bolick, Xu, Taylor and DeRoo2013), only female subjects were included, and PA was not assessed objectively but based on questionnaires. Zhang et al. (Reference Zhang, Cardarelli, Carroll, Zhang, Fulda, Gonzalez and Santella2011) assessed PA for both men and women using an accelerometer and found that individuals spending 26–30 min/day on PA had a significantly higher level of global leukocyte DNA methylation compared to individuals spending less than 10 min/day on PA. However, Zhang et al. (Reference Zhang, Cardarelli, Carroll, Zhang, Fulda, Gonzalez and Santella2011) defined PA as all activities that require more than 3 METs, which corresponds to the definition of MVPA used in this study. LPA was thus considered as physical inactivity, which may explain the differences in results between this study and the study by Zhang et al. (Reference Zhang, Cardarelli, Carroll, Zhang, Fulda, Gonzalez and Santella2011). Moreover, Zhang et al. (Reference Zhang, Cardarelli, Carroll, Zhang, Fulda, Gonzalez and Santella2011) reported that after correction for sex, age, and ethnicity, the association between physically active time and global DNA methylation became non-significant. It should be noted that both the studies by White et al. (Reference White, Sandler, Bolick, Xu, Taylor and DeRoo2013) and Zhang et al. (Reference Zhang, Cardarelli, Carroll, Zhang, Fulda, Gonzalez and Santella2011) only measured methylation at transposable long interspersed nuclear elements-1 (LINE-1), covering less than 20% of the genome (International Human Genome Sequencing Consortium, 2001). As the z-score-based method to determine global methylation used in this study takes a much larger portion of the CpG sites in the genome into account, differences in findings can also be attributed to this different approach. On the contrary, Luttropp et al. (Reference Luttropp, Nordfors, Ekström and Lind2013), using the luminometric methylation assay (Karimi et al., Reference Karimi, Johansson, Stach, Corcoran, Grandér, Schalling and Ekström2006) to determine global methylation, found a negative association between global DNA methylation and self-reported time spent on PA in a Swedish elderly population, even after correcting for sex and multiple cardiovascular risk factors. Therefore, the combined influence of age, sex, ethnicity, and several other factors on the interaction between physical (in)activity and global DNA methylation may clarify why the results in this exploratory study correspond most to the results found by Luttropp et al. (Reference Luttropp, Nordfors, Ekström and Lind2013) instead of the results reported by most other studies. Furthermore, it should be noted that 4 out of the 41 subjects in this study were smokers. However, no extreme values can be observed for these subjects regarding global DNA methylation level and physical (in)activity, implying that it is highly unlikely that exclusion of these four subjects would have had a major impact on the results of this study. Future studies including a larger number of subjects are needed to confirm the directions of the associations between the different PA intensity levels and global DNA methylation, as suggested by this study.
Gene-Specific Methylation in Relation to Physical (In)Activity
The directions of the correlation coefficients in Table 2 are confirmed by the percentages in Table 3, representing the percentage of significantly associated CpG sites for each PA intensity level with a positive correlation between methylation level and time spent on the respective PA intensity level. Although there is no significant correlation between global DNA methylation level and time spent on LPA and MVPA, focusing only on the significantly associated CpG sites confirms that in this study DNA methylation levels are mostly decreased by PA. For both LPA and MVPA, this pattern is even clearer when using a stricter significance level and thereby including only the less extensive lists of associated CpG sites at α = 0.005. A plausible explanation is that the lists of CpG sites associated with time spent on LPA and MVPA, especially at α = 0.005, include a large portion of CpG sites within the promoter regions of genes whose expression levels are positively correlated with health outcomes. As PA can improve health, and since DNA methylation levels are generally inversely correlated with gene expression levels, decreased methylation levels at these CpG sites by PA can be expected. For example, methylation levels at the promoter region of CACNA2D3 were shown to be decreased by PA in a population of gastric cancer patients, resulting in more gene expression (Yuasa et al., Reference Yuasa, Nagasaki, Akiyama, Hashimoto, Takizawa, Kojima and Nakachi2009). In this study, the promoter region of CACNA2D1, encoding another member of the alpha-2/delta subfamily, is also hypomethylated for individuals spending more time on LPA (Supplementary Table S5), whereas the promoter regions of CACNA1A and CACNA1G, 2 other related genes with tumor-suppressor properties (García-Baquero et al., Reference García-Baquero, Puerta, Beltran, Alvarez, Sacristan, Alvarez-Ossorio and Sánchez-Carbayo2013), are hypomethylated for individuals spending more time on MVPA (Supplementary Table S6). In addition, methylation levels at the promoter region of tumor suppressor gene APC, which has been associated with breast cancer tumorigenesis (Coyle et al., Reference Coyle, Xie, Lewis, Bu, Milchgrub and Euhus2007), are decreased by LPA (Supplementary Table S5), while promoter methylation of the paralog gene APC2 is decreased by MVPA (Supplementary Table S6). Furthermore, this study reveals a similar negative association between time spent on LPA and promoter methylation of SIRT2 on the one hand (Supplementary Table S5) and between time spent on MVPA and promoter methylation of SIRT4 on the other hand (Supplementary Table S6). Both genes code for a member of the sirtuin protein family, presumably playing a key role in terms of cell cycle regulation, cell survival, and lifespan extension (Pallàs et al., Reference Pallàs, Verdaguer, Tajes, Gutierrez-Cuesta and Camins2008). Finally, some CpG sites influencing genes also involved in transcriptional activity showed significant associations with time spent on LPA or MVPA at α = 0.005. The methylation level at the promoter region of MEP2D is decreased by LPA (Supplementary Table S5), which can be explained by the fact that MEP2D codes for a member of the MEP2 transcription factor family, playing an important role in muscle and neural development as well as in metabolic regulation (Pon & Marra, Reference Pon and Marra2016). In summary, the results in this study suggest that the stronger the association between methylation at a specific CpG site and time spent on PA, the more chance that this association will be negative. This may also be one of the reasons why a negative correlation coefficient was found in this study when examining the association between global DNA methylation and time spent on both LPA and MVPA, as global DNA methylation is calculated as the average of the CpG site-specific z-scores.
However, it should be noted that the sample size of 41 in this exploratory study was small, implying low power. After FDR correction, only one CpG site, cg22900193 (PTPLAD1), reached significance in association with time spent on SB (Supplementary Table S1). Given the exploratory character of this study, only the uncorrected p values of all regression analyses are reported (Supplementary Tables S1–S3) and a threshold of α = 0.005 was chosen to perform the biological pathway analysis. Based on the given sample size of 41 and the smallest effect sizes that are still determined as significant, r² = 0.095 at α = 0.05 and r² = 0.185 at α = 0.005, the power of the linear regression analyses is 53% and 54%, respectively, using uncorrected p values. To reach 80% power for all linear regressions, given these effect sizes and using uncorrected p values, the sample size should be 77 at α = 0.05 and 63 at α = 0.005.
Biological Pathways Associated With Physical (In)Activity
Although all the three PA intensity levels are associated with a similar number of pathways (Table 4), most pathways show an association with only one PA intensity level, indicating that each of the three PA intensity levels influences methylation of separate sets of genes and pathways. This may be counterintuitive because if methylation of a gene or pathway is increased by SB, a decrease in methylation of the same gene or pathway by LPA and MVPA can be expected. However, a professional athlete has a high level of MVPA, but probably spends a lot of time on SB in between training sessions to recover, both being considered as beneficial for the performance of the athlete. This example indicates that it is crucial to take the separate effects of SB, LPA, and MVPA on DNA methylation into account, which is done in this study by treating the three PA intensity levels as variables that affect DNA methylation independently of each other. Another approach could be to take the combined effect of SB, LPA, and MVPA on DNA methylation into account, thereby looking at the PA pattern of a particular individual.
Clear differences can be observed between the functional groups regarding the number of pathways of which methylation is associated with a particular PA intensity level (Figure 1). Furthermore, it is remarkable that LPA and MVPA mainly influence promoter methylation of different genes within different pathways significantly, as only three pathways are associated with both LPA and MVPA. These results suggest that different PA intensities affect different aspects of human health, offering new insights concerning PA guidelines to improve specific health-related outcomes. On the contrary, five pathways are associated with both SB and LPA, and nine pathways are associated with both SB and MVPA, indicating that next to the PA pattern of an individual the inactive period also has to be taken into account when studying associations between physical (in)activity and human health. Promoter methylation of many genes within these pathways is oppositely associated with time spent on SB on the one hand and time spent on LPA or MVPA on the other hand. Therefore, regular PA often only seems to have a beneficial effect on health if the sedentary time is also notably reduced. Notwithstanding the exploratory character of this study, some pathways belonging to the functional groups ‘Cancers’, ‘Metabolism and metabolic diseases’, and ‘Substance dependence’ are discussed in more detail below.
The general idea behind the interaction between DNA methylation and cancer development is that initially silenced genomic regions, consisting of repetitive sequences, become demethylated and therefore activated, whereas promoter methylation increases in tumor suppressor genes, resulting in less gene expression. This combined effect is assumed to induce carcinogenesis (Esteller, Reference Esteller2002). Instead of genetic mutations that influence only one gene, changes in DNA methylation can influence multiple genomic regions at the same time within the same cell, facilitating growth and reproduction of tumor cells (Coppedè, Reference Coppedè2014). Sanchis-Gomar et al. (Reference Sanchis-Gomar, Garcia-Gimenez, Perez-Quilis, Gomez-Cabrera, Pallardo and Lippi2012) reported that PA can reduce cancer risk as healthy stress can induce beneficial epigenetic modifications in tumor cells. On the other hand, bad habits such as smoking can induce demethylation of metastatic genes in tumor cells because of downregulation of the DNA methyltransferase enzyme DNMT3B (Liu et al., Reference Liu, Zhou, Boggs, Belinsky and Liu2007). In this study, two cancer-related pathways are only associated with SB, two are only associated with LPA, and one, the ‘proteoglycans in cancer’ pathway, is associated with both SB and LPA (Supplementary Figures S1, S45, S52, S57, and S58). The ‘proteoglycans in cancer’ pathway consists of 205 genes, of which 18 display an association between their promoter methylation level and time spent on SB. This association is positive for 8 genes and negative for 10 genes. On the other hand, 26 genes in this pathway display an association between their promoter methylation level and time spent on LPA, of which only 3 genes display a positive association. 8 genes in this pathway display an association between their promoter methylation level and both SB and LPA. For 5 of these genes, the direction of the association with time spent on SB is opposite to the direction of the association with time spent on LPA. Promoter methylation of IGF1R, for example, is positively associated with time spent on SB and negatively associated with time spent on LPA. However, as overexpression of IGF1R is generally found in tumor cells (Ryan et al., Reference Ryan, Haqq, Simko, Nonaka, Chan, Weinberg and Goldfine2007), PA would rather be expected to cause decreased expression of the gene and therefore a positive association between time spent on LPA and methylation of the IGF1R promoter would be more likely hypothesized. On the contrary, promoter methylation of 3 genes within the ‘proteoglycans in cancer’ pathway, including CAMKα2, is associated in the same direction with time spent on SB and LPA. Smith et al. (Reference Smith, Kohn, Chetty and Ojuka2008) reported that CAMK2 is activated during physical exercise, which seems to be confirmed by this study, as CAMK2α promoter methylation is negatively associated with time spent on LPA, even though CAMK2α promoter methylation is also negatively associated with time spent on SB.
CAMK2 is also important for metabolic function as its activation is required for the binding of myocyte enhancer factor 2A to the GLUT4 promoter. GLUT4 encodes a protein that functions as an insulin-regulated glucose transporter and thus plays a role in the development of type 2 diabetes (Smith et al., Reference Smith, Kohn, Chetty and Ojuka2008). In this study, methylation of the GLUT4 promoter is not associated with any of the PA intensity levels, but the pathways related to type 2 diabetes and insulin resistance are both associated with LPA. On the other hand, the ‘fatty acid elongation’ pathway, another metabolic pathway, is only associated with SB (Supplementary Figure S31). Within this pathway and in case of increased SB, a decreased promoter methylation level is observed for genes involved in biosynthesis of fatty acids within the endoplasmic reticulum, presumably resulting in gene activation, whereas an increased promoter methylation level is observed for genes involved in mitochondrial fatty acid degradation, presumably resulting in gene inactivation. Therefore, SB seems to induce accumulation of fat tissue through its effect on DNA methylation.
The last functional group to be discussed at a more detailed level is ‘Substance Dependence’. Whereas methylation of the pathways involved in cocaine and amphetamine addiction is only associated with SB, methylation of the pathway involved in morphine addiction is only associated with MVPA (Supplementary Figures S6, S21, and S46). Both the ‘cocaine addiction’ and ‘amphetamine addiction’ pathways share some genes, such as DAT1 and VMAT1, of which promoter methylation is increased by SB. Accordingly, we can expect that expression levels of these 2 genes are decreased in relation to increased SB. DAT1 and VMAT1 both play a role in the dopaminergic synapse, and their expression levels are directly influenced by the respective stimulants, but amphetamine influences expression of both genes in the opposite direction in comparison with cocaine. Therefore, as we expect both genes to have a decreased expression level in relation to increased SB, the combined effect of SB and amphetamine on gene expression is presumably not comparable with the combined effect of SB and cocaine on gene expression. Whereas the majority of genes in these two pathways show increased promoter methylation in relation to increased SB, the majority of genes in the ‘morphine addiction’ pathway show decreased promoter methylation in relation to increased MVPA, suggesting that intensive PA generally increases gene expression in pathways related to drug addiction. Furthermore, several drugs such as cocaine, amphetamines, and opiates are also known to induce epigenetic modifications themselves (Doehring et al., Reference Doehring, Oertel, Sittl and Lötsch2013; Renthal & Nestler, Reference Renthal and Nestler2008), making the study of associations between physical (in) activity, DNA methylation and substance dependence even more complex.
Conclusions
In summary, using a z-score-based method to determine global DNA methylation levels, this exploratory study suggests a trend toward a positive association between time spent on SB and global DNA methylation and a negative association between time spent on PA and global DNA methylation, which is opposite to what is found in most other studies. Methylation of some genes is influenced by only one PA intensity level, whereas methylation of other genes is influenced by a combination of the three PA intensity levels defined in this study. Correspondingly, methylation within some health-related pathways is associated with only one PA intensity level, while the other pathways show an association with multiple PA intensity levels. In some cases, a counteracting effect of SB, LPA, and MVPA on promoter methylation of the same gene within a pathway is observed. Some functional groups of pathways seem to be mainly associated with SB, whereas other functional groups of pathways are only found in association with LPA or MVPA. In general, it is clear that SB and PA influence DNA methylation at global, gene-specific and pathway level in a different way and therefore both should be taken into account when investigating the effect of physical (in)activity on health outcomes through epigenetic mechanisms. Furthermore, LPA and MVPA also affect methylation of different genes and pathways, indicating that epigenetic modifications such as changes in DNA methylation are highly dependent on PA intensity. Because of the exploratory character of this study, pathways from only three functional groups were discussed in more detail regarding their association with physical (in)activity through DNA methylation, resulting in some promising insights. However, future studies should try to acquire more information regarding the interaction between objectively assessed physical (in)activity variables, DNA methylation and human health, keeping in mind the importance of a sufficiently large sample size and covariates such as age, sex, and ethnicity.
Acknowledgments
This study was performed within the framework of the third generation Flemish Policy Research Centre Sport, Physical Activity and Health (SPAH) (2012–2014). Therefore, the authors would like to thank all staff members and participants involved in this study. This study was funded by FWO Vlaanderen (G.0898.15).
Conflict of Interest
None.
Ethical Standards
The authors assert that all procedures contributing to this work comply with the ethical standards of the relevant national and institutional committees on human experimentation and with the Helsinki Declaration of 1975, as revised in 2008.
Supplementary Material
To view supplementary material for this article, please visit https://doi.org/10.1017/thg.2018.10


