


Data collected for administrative or policy purposes often include detailed information at the individual level and are proving to be of great value for medical and scientific research. The Nordic countries are well known for studies on health outcomes based on register data because these data can be linked across registers with a unique personal identification number (Maret-ouda et al., Reference Maret-ouda, Tao, Wahlin and Lagergren2017). Individuals’ data on, for example, education or income can be linked to the use of social insurance schemes and health care and also to data on their family members and their place of residence. The advantage of register data is that nonresponse is not a problem and that data are collected in a uniform manner from all individuals. However, register data are generally not collected with a specific research purpose in mind. Cohort studies, on the other hand, employ surveys, collect biological samples and carry out clinical and experimental studies to gather data directly from participants (lifestyle, personality, attitudes, genotypes, biomarkers and clinical diagnoses). Linking individual-level register data to cohort data offers the possibility to enhance existing data resources and address research questions that are of relevance to individuals and to society.
In the Netherlands, population-based register data are collected and analyzed by Statistics Netherlands (CBS; www.cbs.nl/en-gb) to publish reliable statistics on the Dutch economy and society (www.statline.nl). CBS has administrative data for approximately 17 million inhabitants of the Netherlands on pedigree structure and outcomes, including education, income and health, which can all be linked at the individual level. CBS is legally entitled to make these data, under strict terms, available for research purposes as well as link them to external data in a secure remote-access (RA) environment (www.cbs.nl/microdata). However, this RA environment does not offer high-performance computing facilities, which limits the scale of research projects. The Open Data Infrastructure for Social Science and Economic Innovations (ODISSEI; www.odissei-data.nl) has set up a sustainable national data infrastructure for research in the Netherlands by coordinating the integration of data from large cohort studies in the Netherlands and administrative data. ODISSEI has supported the development of a secure platform, called the ODISSEI Secure Supercomputer (OSSC) (Scheerman et al., Reference Scheerman, Voort and Zarrabi2019) on the high-performance computer facility at Samenwerkende Universitaire Reken Faciliteiten (SURF; www.surf.nl). SURF hosts and maintains the Dutch national supercomputer Cartesius with 2000 multicore compute nodes, connected with Infiniband for high-speed, low-latency communication and storage access. The OSSC is developed as a ‘Platform as a Service’ on top of the Cartesius, where users can use the computing resources and software offered on the supercomputer. The platform is based on customizable, virtualized private clusters that are deployed on Cartesius, imposing strict security measures required by data owners, and facilitates access and record linkage (Private Cloud on a Compute Cluster [PCOCC], developed by CEA, https://github.com/cea-hpc/pcocc.). From the CBS RA environment, data can be copied to OSSC through a dedicated VPN connection between CBS and SURF(sara), seamlessly and securely integrating the HPC cluster into their own private network. Stringent automated security controls make sure this VPN is the only path for sensitive data to leave the cluster (see Figure S1).
In the current study, we used the OSSC platform to link CBS register data on health care expenditure to genotype information from the Netherlands Twin Register (NTR; www.tweelingenregister.vu.nl). The NTR is a large twin-family study that has followed thousands of family members longitudinally with surveys and has collected DNA samples from a large number of their participants (Ligthart et al., Reference Ligthart, van Beijsterveldt, Kevenaar, de Zeeuw, van Bergen, Bruins and Boomsma2019). The scientific aim of our study was to run a genomewide association (GWA) study and estimate the associations between genetic variants and health care expenditure. While the effect of environmental determinants related to overall health has been extensively studied, less is known about the genetic architecture of individual differences between people. Given that expenditure is directly related to medical conditions that are characterized by genetic contributions, we hypothesize that a substantial contribution of genetic differences to overall health expenditure exists. Knowledge on the genetic contributions to overall health is currently limited to studies that measured it with self-reports. Twin studies indicate that self-rated health is partly due to genetic differences between people, with estimates of a heritability of over 30% in young adulthood (Silventoinen et al., Reference Silventoinen, Posthuma, Lahelma, Rose and Kaprio2007) and almost 50% at older ages (Mosing, Pedersen et al., Reference Mosing, Pedersen, Martin and Wright2010). The first GWA study (~6700 individuals) on self-rated health did not report any genomewide significant hits (Mosing, Verweij et al., Reference Mosing, Verweij, Medland, Painter, Scott, Heath and Nicholas2010), but a better powered study in almost 112,000 individuals identified 13 independent genomewide significant signals, of which several were in regions previously implicated in specific diseases (Harris et al., Reference Harris, Hagenaars, Davies, Hill, Liewald, Ritchie and Deary2017). The proportion of variance in self-rated health explained by all the measured common genetic variants was 13%. We argue that investigating overall health, more objectively measured by health care expenditure, will lead to a better understanding of its genetic architecture.
Methods
Participants
The NTR was established around 1987 by the Department of Biological Psychology at Vrije Universiteit Amsterdam (Ligthart et al., Reference Ligthart, van Beijsterveldt, Kevenaar, de Zeeuw, van Bergen, Bruins and Boomsma2019). Adult twins, their families and parents of young twins take part in surveys. DNA collection from blood or buccal samples has been done in several large projects (Ligthart et al., Reference Ligthart, van Beijsterveldt, Kevenaar, de Zeeuw, van Bergen, Bruins and Boomsma2019). Genotyping has been carried out in subsamples that are, in general, unselected for specific traits. Height measured in centimeters was obtained from clinical and experimental studies or reported by participants in surveys. Many participants filled out more than one survey, and longitudinal height data were checked for consistency. NTR data collection was approved by the Central Ethics Committee on Research Involving Human Subjects of the VU University Medical Centre, Amsterdam, an Institutional Review Board certified by the U.S. Office of Human Research Protections (IRB number 00002991 under Federal-Wide Assurance-FWA00017598; IRB/Institute codes, NTR 03-180), and informed consent was obtained from all participants.
Health Care Expenditure
Dutch residents are obliged by law (Health Insurance Act; ZVW) to take out a basic health insurance. Just 0.07% of the population are conscientious objectors and have no insurance for health care expenditure (European Commission, 2017). Statistic Netherlands (CBS) receives, via Vektis (www.vektis.nl), an executive organization of health insurance companies in the Netherlands, health care expenditure as reimbursed under the basic health insurance. Health care expenditure included the annual costs per resident for primary, hospital, mental health, birth and geriatric care, physiotherapy and medication. Not included are costs that (1) fall under a supplementary health insurance, (2) fall outside of the Health Insurance Act and are paid by the patient or (3) fall under long-term care. We analyzed average expenditure costs across all available reporting years (2009−2016) for total health, mental health, primary and hospital care and medication (Statistics Netherlands (CBS), 2019a). Data were log-transformed prior to analyses to correct for the skewness of the data.
Genotype Data
Genotyping was done on several platforms, that is, Affymetrix-Perlegen, Illumina 660, Illumina Omni Express 1M, Affymetrix 6.0, Affimetrix Axiom and Illumina GSA. For criteria on quality control (QC) of the single nucleotide polymorphisms (SNPs) and samples, before and after imputation (see de Zeeuw et al., Reference de Zeeuw, Jan, Klaasjan, Conor, Erik, Davies and Bergen2020), data were cross-platform phased and imputed using Mach-admix with GoNL (Francioli et al., Reference Francioli, Menelaou, Pulit, Van Dijk, Palamara, Elbers and Wijmenga2014) as the reference panel for all SNPs that were, after QC, present for at least one platform (Boomsma et al., Reference Boomsma, Wijmenga, Slagboom, Swertz, Karssen, Abdellaoui and Van Duijn2014). The cross-chip imputed data set was used to calculate genetic principal components with the SmartPCA software (Price et al., Reference Price, Patterson, Plenge, Weinblatt, Shadick and Reich2006). Subsequently, the data set was aligned against the 1000G phase 3 version 5 reference panel and imputed on the Michigan imputation server (Das et al., Reference Das, Forer, Schönherr, Sidore, Locke, Kwong and Fuchsberger2016). Best guess genotypes were calculated for all SNPs in Plink 1.96 (Purcell et al., Reference Purcell, Neale, Todd-Brown, Thomas, Ferreira, Bender and Sham2007).
Record Linkage
Personal data (name, address, date of birth) of NTR participants and their Administrative number (A-number) under which Dutch residents are registered in the population register are stored under a pseudonymized NTR identifier on a server that is disconnected from the internet; note that NTR does not have the social security number (BSN) of the participants (Boomsma et al., Reference Boomsma, Willemsen, Vink, Bartels, Groot, Hottenga and Van Der Kleij2008, Reference Boomsma, Helmer, Nieuwboer, Hottenga, de Moor, van den Berg and de Geus2018). Phenotype data are stored under a different pseudonymized NTR identifier. The genotype data of NTR participants are stored at SURF in binary format and do not contain any identifiers, but the order within the data set is an implicit identifier. At CBS, all individual-level register data (microdata) are stored under a pseudonymized identifier (RIN) and CBS has access to the A-number of Dutch residents.
Figure 1 displays the different steps in the record linkage process. Record linkage between the NTR identifier and CBS identifier was done by the Central Record Linkage department (CBK) at CBS on the basis of the A-number (step 1). After linkage and removal of the A-number, the NTR and CBS identifiers were encrypted and a record linkage key was sent to SURF (step 2). The key with encrypted identifiers was added to CBS microdata, and NTR cohort data and the NTR cohort data were re-ordered (step 3). SURF, which acted as a trusted third party (TTP), used the record linkage key for pseudo-randomizing the order of the genotype data (step 4). CBS uploaded CBS microdata and NTR cohort data to the OSSC environment via a secure virtual private network (VPN). SURF placed the reordered genotype data and the key of the new order of the genotype data in the OSSC (step 5). NTR linked CBS microdata to NTR cohort data and sorted the NTR cohort data in the same order as the new order of the genotype data (step 6). The complete procedure ensured that none of the parties involved had access to all the record linkage keys and, therefore, could neither identify participants in the cohort nor in the administrative or genotype data.

Fig. 1. Flow chart of record linkage between data from the Netherlands Twin Register and data from Statistics Netherlands on the ODISSEI Secure SuperComputer (OSSC) platform. Note: Step 1: Record linkage between the NTR identifier and CBS identifier on the basis of the A-number. Step 2: NTR and CBS identifiers were encrypted, and the record linkage key was sent to SURF. Step 3: The key was added to CBS microdata and NTR cohort data, and NTR cohort data were re-ordered. Step 4: SURF used the record linkage key for pseudorandomizing the order of the genotype data. Step 5: CBS uploaded CBS microdata and NTR cohort data to the OSSC environment via a secure virtual private network (VPN). SURF placed the re-ordered genotype data and the key of the new order in the OSSC. Step 6: NTR linked CBS microdata to NTR cohort data and sorted NTR cohort data in the same new order as the genotype data.
Statistical Analyses
To verify that the encryption of the NTR identifiers and the pseudo-randomization of the genotype data were correct, we conducted a GWA study on height reported by the NTR participants. The data on height were uploaded to the OSSC together with the other NTR cohort data — that is, data on covariates — and underwent the same procedure of identifier encryption, and the analyses were carried out using the reordered genotype data. A large meta-analysis reported genetic variants associated with height (Wood et al., Reference Wood, Esko, Yang, Vedantam, Pers, Gustafsson and Frayling2014), and we estimated the genetic correlation between these and our own results with LD-score regression (Bulik-Sullivan et al., Reference Bulik-Sullivan, Loh, Finucane, Ripke, Yang, Patterson and O’Donovan2015). For a successful procedure, we expected a genetic correlation close to 1.
We regressed the log-transformed total health, mental health, primary and hospital care and medication expenditure on all SNPs in linear mixed models in GCTA 1.92.1beta6 (Yang et al., Reference Yang, Lee, Goddard and Visscher2011), controlling for genetic relatedness by including a SNP-derived genetic relationship matrix (GRM) with all the off-diagonal elements < .05 set to zero. Population stratification was taken into account by including 10 principal components (PC) from the PCA of the SNP genotypes as fixed effects (Price et al., Reference Price, Patterson, Plenge, Weinblatt, Shadick and Reich2006). Sex, age and age-squared were also included as fixed effects. To declare genomewide significance for SNP-phenotype associations, an alpha level of 5 × 10⁻⁸ was adopted (Duggal et al., Reference Duggal, Gillanders, Holmes and Bailey-Wilson2008). Based on the GWA results, we conducted gene-based association analyses in MAGMA (de Leeuw et al., Reference de Leeuw, Mooij, Heskes and Posthuma2015). Genetic variants were assigned to genes on the basis of their position according to the NCBI 37.3 build, resulting in 15,438 genes. The European panel of the 1000 genomes (Auton et al., Reference Auton, Abecasis, Altshuler, Durbin, Bentley, Chakravarti and Schloss2015) data was used as a reference for linkage disequilibrium. In line with the Bonferroni method, a genomewide significance threshold of .05/15,438 = 3 × 10⁻⁶ was adopted for gene-based association tests.
We estimated family-based heritability by employing the differences in genetic resemblance between all family members in our sample as determined with the GRM in GCTA 1.92.1beta6 (Yang et al., Reference Yang, Lee, Goddard and Visscher2011). The SNP-based heritability for each of the outcome measures and the genetic correlation with self-rated health (Harris et al., Reference Harris, Hagenaars, Davies, Hill, Liewald, Ritchie and Deary2017) were estimated with LD-score regression v1.0.0 (Bulik-Sullivan et al., Reference Bulik-Sullivan, Loh, Finucane, Ripke, Yang, Patterson and O’Donovan2015).
Results
Genotype data were successfully linked to CBS for 16,726 individuals from European ancestry (Galinsky et al., Reference Galinsky, Bhatia, Loh, Georgiev, Mukherjee, Patterson and Price2016) who had given consent for linking to external databases and for whom the A-number was known. The analysis of adult height data (N = 12,498) gave a SNP-based heritability of 37.3% (5.9). The genetic correlation between our results and the results from the large meta-analysis on height as reported by the GIANT consortium was .99 (.06), indicating that the record linkage was done correctly.
For 14,572 participants (5842 males and 8727 females; 699 families) with an average age of 45, genotype data and expenditure for total health care in euros were available (males: mean = 1556.7, SD = 3406.9; females: mean = 1668.8, SD = 3432.1), mental health care (males: mean = 113.2, SD = 835.1; females: mean = 158.0, SD = 1308.7), medication (males: mean = 175.1, SD = 784.1; females: mean = 206.6, SD = 631.3), primary care (males: mean = 117.4, SD = 49.1; females: mean = 133.7, SD = 61.1) and hospital care (males: mean = 813.4, SD = 2292.9; females: mean = 1009.4, SD = 2260.9; see Figure 2 and Supplementary Figure S2). The unavailability of health care expenditure data might have been due to, for example, residence outside of the Netherlands.
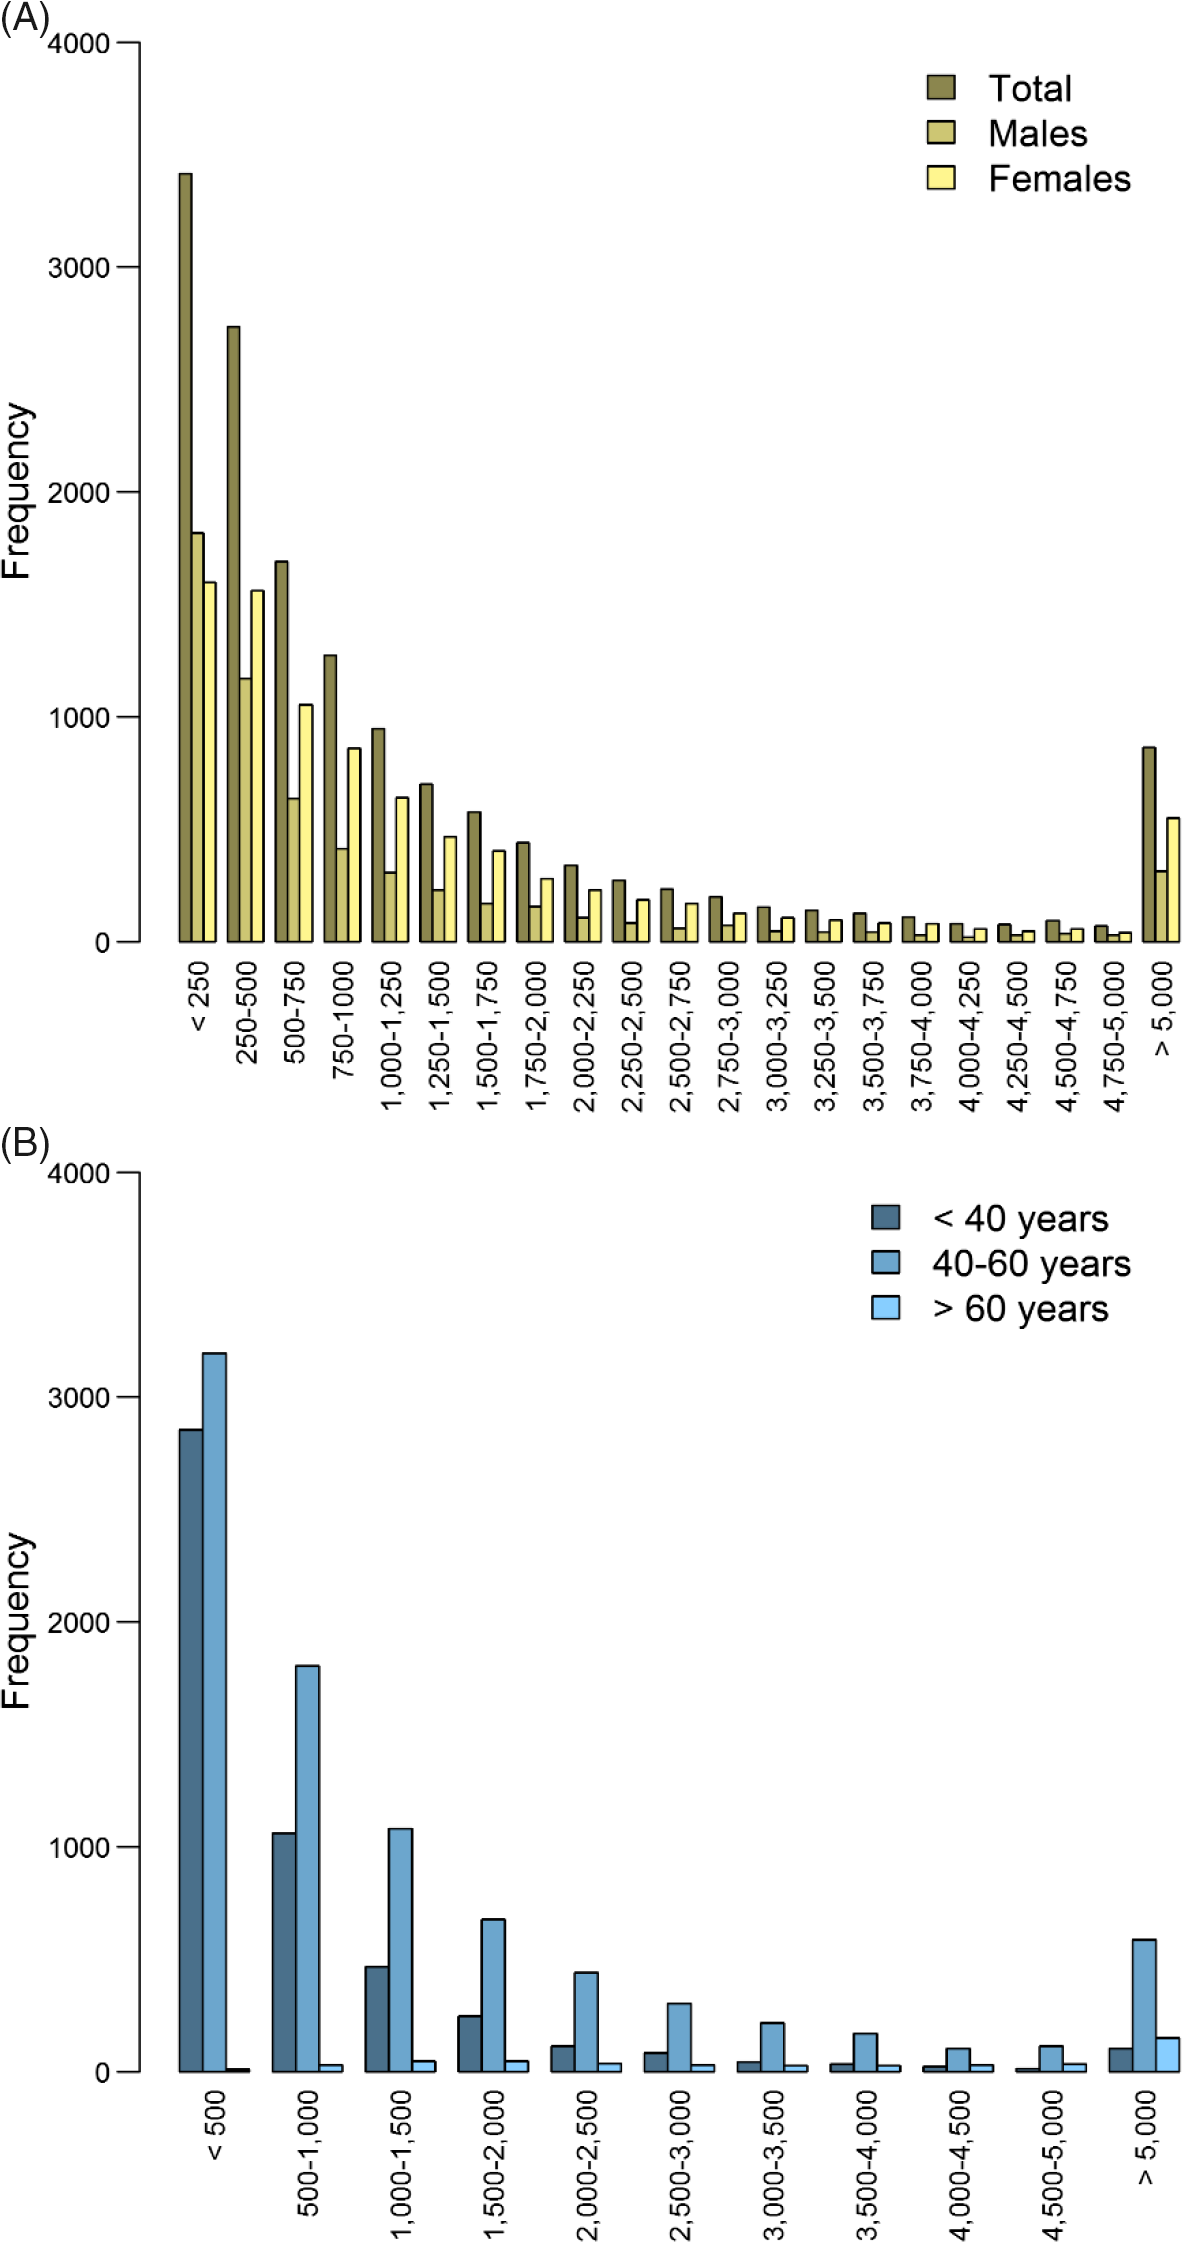
Fig. 2. Histogram of total health care expenditure in euros separately for (A) males (n = 5845) and females (n = 8727) and (B) for individuals < 40 years (n = 5059), between 40 and 60 years (n = 8706) and >60 years (n = 483).
The results of the GWA analyses summarized in Manhattan and Q-Q plots for health care expenditure are depicted in Figure 3 and Supplementary Figures S3−S6. There were no SNPs that were associated with health care expenditure at a genomewide significance level, and gene-based tests did not reveal genes that were significantly associated with health care expenditure, with the strongest associations for the genes TRPV3 (17p13, p = 2 × 10⁻⁵), CAT (11p13, p = 7 × 10⁻⁵) and SSBP2 (5q14, p = 4 × 10⁻⁵). Family-based heritability was .319 (.01) for total health care, .302 (.01) for mental health care, .294 (.01) for medication, .375 (.01) for primary health care and .295 (.01) for hospital care, and SNP-based heritability was −004 (.03) for total health care, .054 (.03) for mental health care, −.005 (.04) for medication, .044 (.04) for primary health care and −.002 (.04) for hospital care (see Figure 4). The genetic correlation between the GWA results that showed a significant SNP-based heritability and the results from the meta-analysis on self-rated health (Harris et al., Reference Harris, Hagenaars, Davies, Hill, Liewald, Ritchie and Deary2017) was .26 (.17) for mental health care expenditure and .70 (.30) for primary care expenditure.
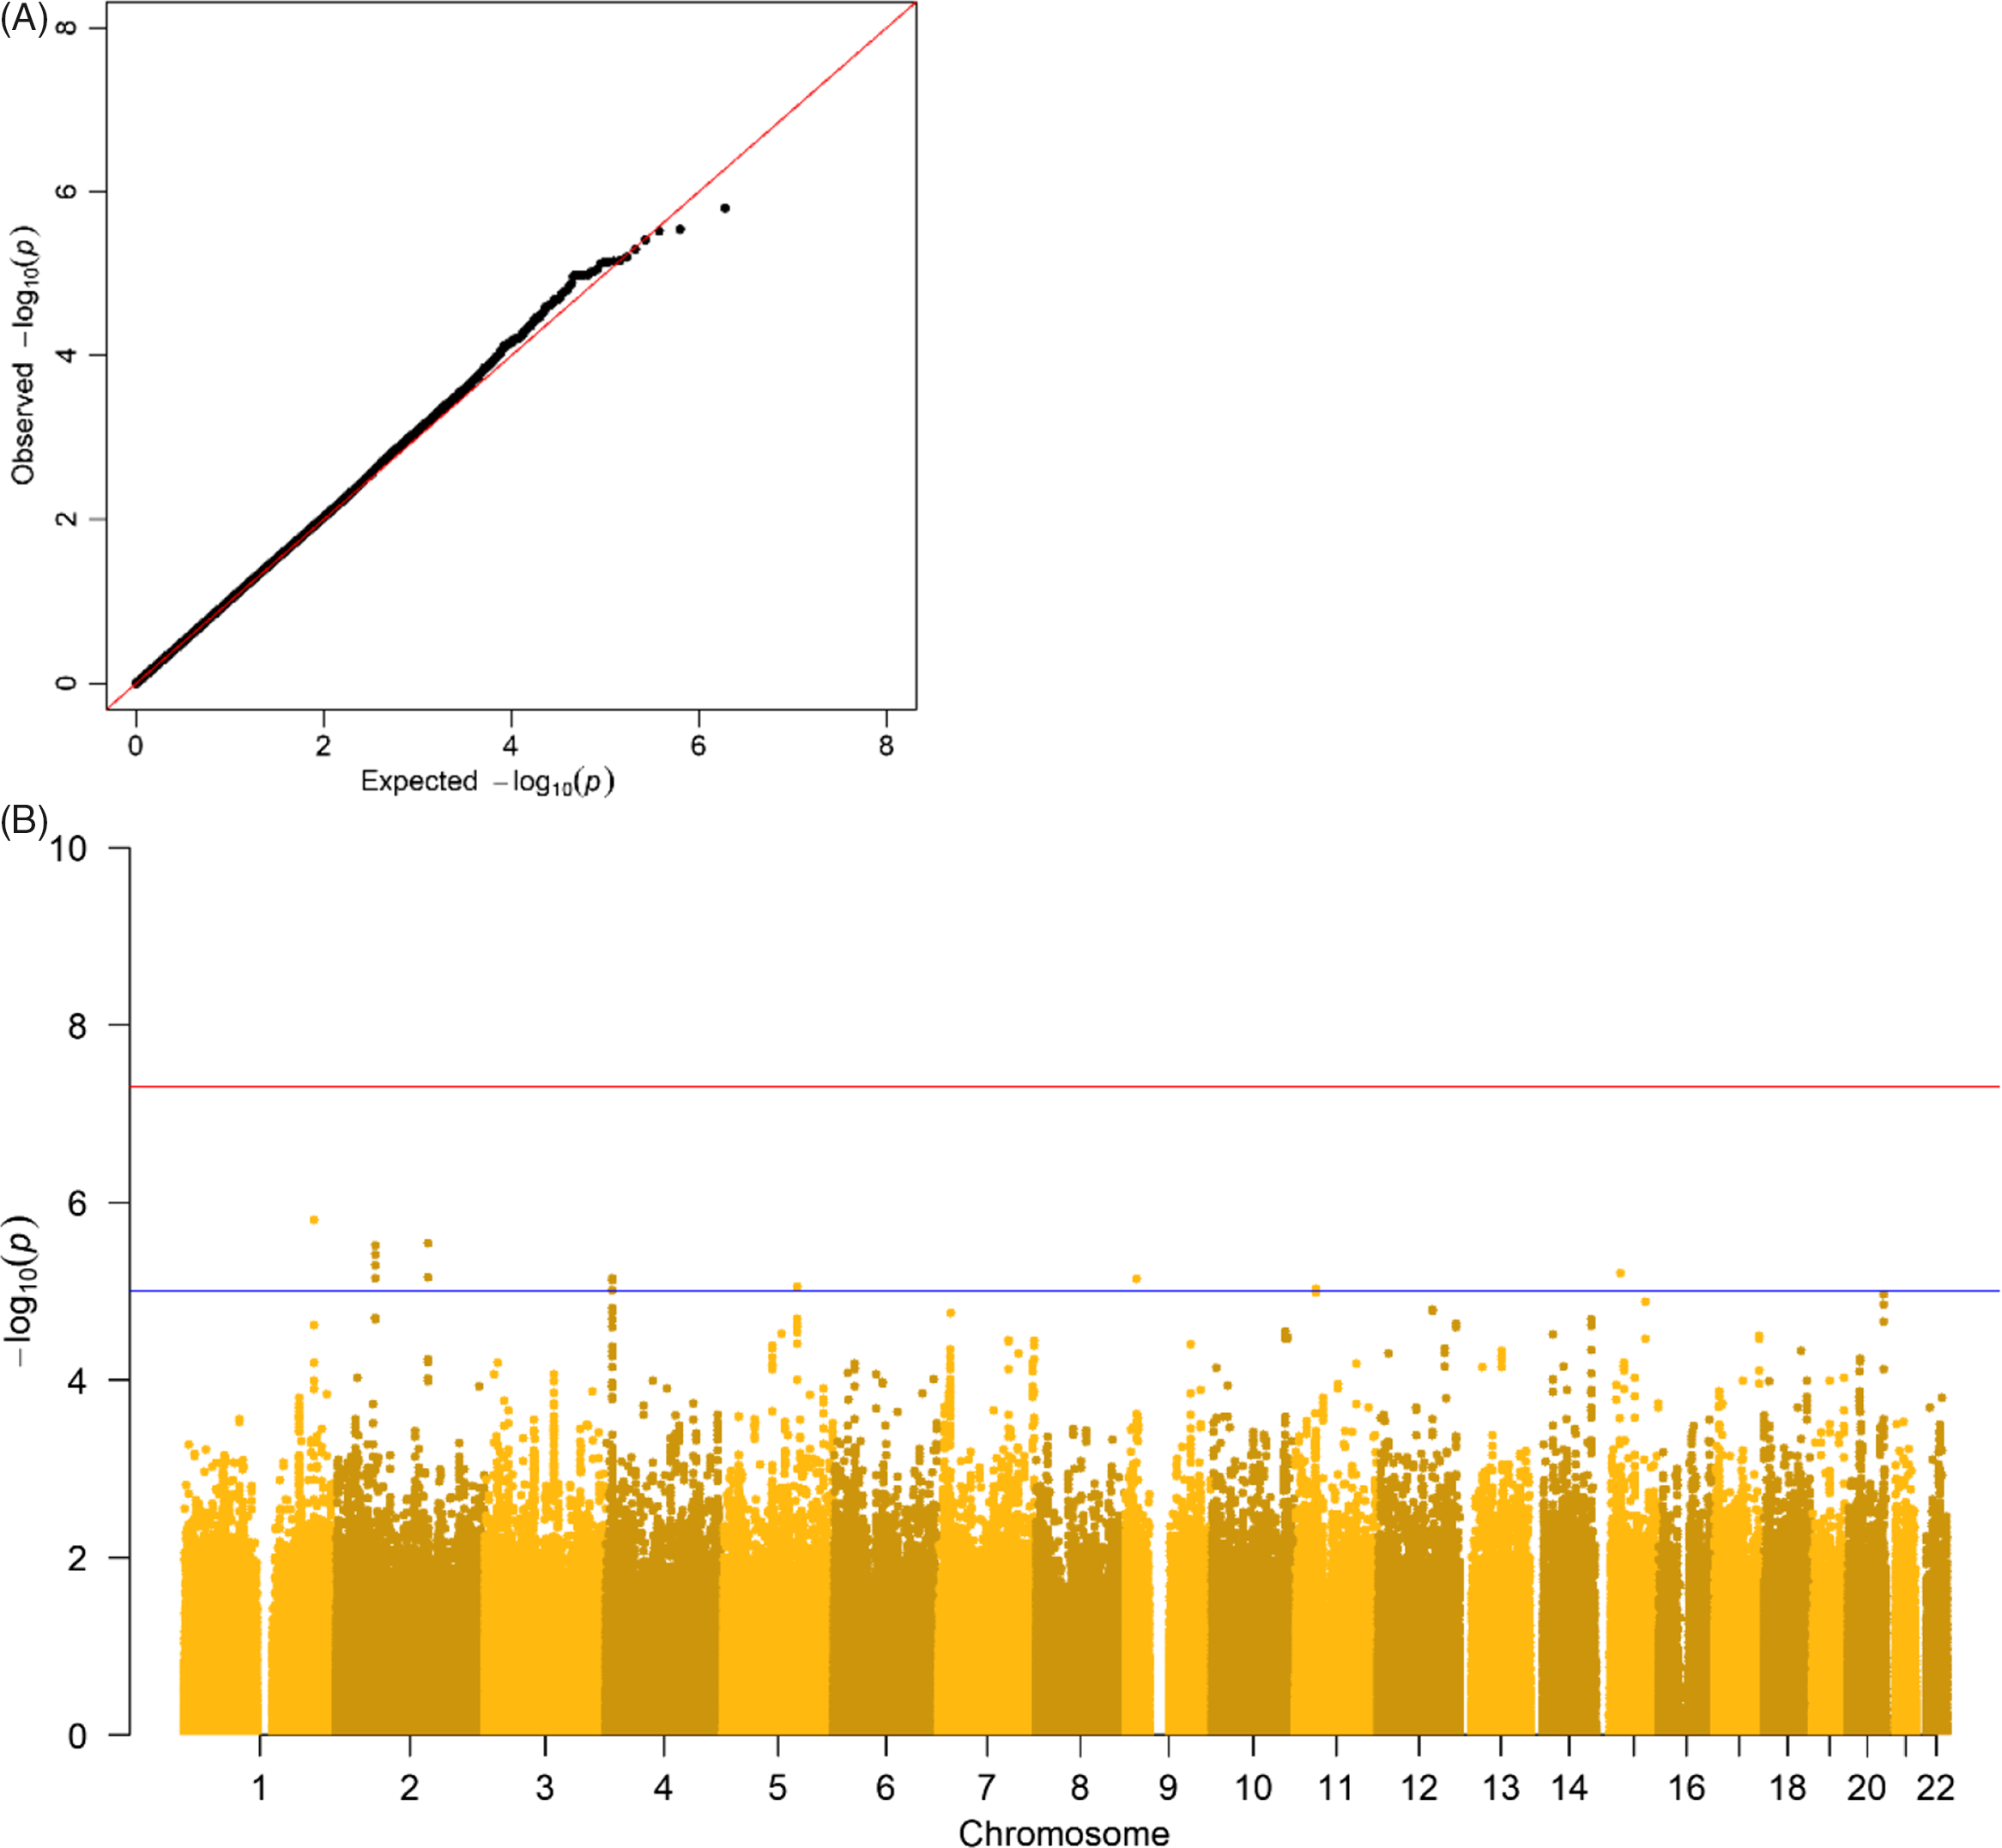
Fig. 3. (A) Q-Q plot and (B) Manhattan plot of p values of the genomewide association analysis for total health care expenditure. Note: The top line is the genomewide significance threshold (p < 5 × 10⁻⁸), and the bottom line indicates the threshold for suggestive significance (p < 1 × 10⁻⁵).
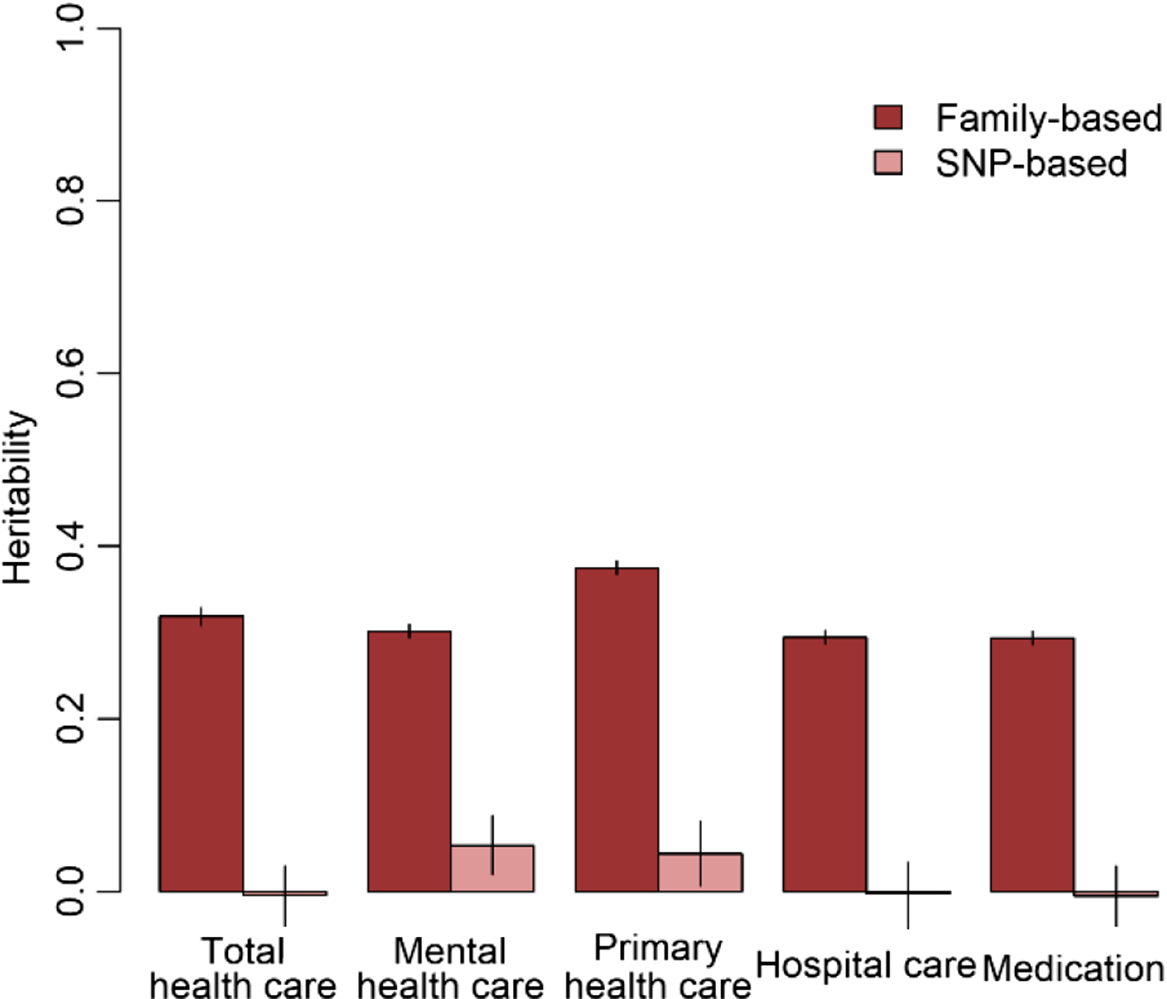
Fig. 4. Family-based and SNP-based heritability of total health, mental health, primary health and hospital care and medication expenditure.
Discussion
The aim of the current study was to demonstrate the feasibility of running a large-scale GWA study for health care expenditure by linking NTR genotype data and CBS administrative data on the OSSC platform. We successfully linked genotype data to self-reported height from NTR participants in the OSSC after encrypting all identifiers and pseudo-randomization of the order in the genotype data. The finding of a significant SNP heritability for height and a genetic correlation of unity with the GIANT study on height (Wood et al., Reference Wood, Esko, Yang, Vedantam, Pers, Gustafsson and Frayling2014) confirmed that the encryption and reordering of the data were done correctly. The OSSC thus enabled us to link sensitive data from multiple databases in a privacy protecting way on a secure system that provided the required high-performance computing facilities.
No genetic variants that were genomewide significantly associated with health care expenditure were found. For significantly associated genes at the stringent genomewide level, larger studies are required and this will become feasible when multiple Dutch cohorts collaborate in the OSSC environment. No significantly associated genes were found, but we identified some promising genes — for example, SSBP2 — that were previously found to be related to diseases (Liu et al., Reference Liu, Nagpal, Sun, Lee, Kim, Ostrow and Sidransky2008). Overall, the proportion of variance explained by all genotyped autosomal SNPs ranged from zero to 5.4%. The estimate for the SNP-based heritability was different from zero for mental health care expenditure and primary care expenditure. The genetic correlation between self-rated health and health care expenditure was larger for primary care (r = .70) compared to mental health care (r = .26). Family-based heritability was much larger for all types of health care expenditure (29−38%), indicating that there are possibilities for larger samples to identify genetic variants related to health care expenditure. Health care expenditure may be influenced not only by a large number of genetic variants that all have a very small effect but also by rare genetic variants that, although they can have a large effect, explain only a small part of the differences between people. Larger sample sizes are required to identify the effects of common genetic variants on health care expenditure. The OSSC brings these large sample sizes within reach as it will provide the possibility to link multiple cohorts to the register data, allowing the exact same outcome measure to be analyzed across all these cohorts.
Identifying genetic variants associated with overall health is important as these genetic variants can be employed in bidirectional Mendelian randomization (MR; Smith & Hemani, Reference Smith and Hemani2014). MR is a natural experiment that employs genetic variants as instrumental variables, which has been suggested to provide the best opportunity to establish the causal effect of specific traits on overall health (Dixon et al., Reference Dixon, Davey Smith, von Hinke, Davies and Hollingworth2016), since randomized controlled trials are in this case impossible to implement. The identification of the impact of specific traits on overall health will give information needed to estimate the cost-effectiveness of prevention and intervention programs. Such information is essential as health care expenditure in the Netherlands has increased to 76.9 billion euros, 9.9% of the gross domestic product (Statistics Netherlands (CBS), 2019b), only partly explained by the growth of the proportion of the Dutch population over 65 years (Howdon & Rice, Reference Howdon and Rice2018).
The OSSC platform presents a novel method for creating secure computing environments on traditional multitenant high-performance computing clusters. The platform as a service provides a customizable virtualized solution using PCOCC to meet strict security requirements for storing, processing and linking highly sensitive data. The OSSC development is moving toward a production-ready version of the platform by automating the manual steps for setting up the virtual environment and creating a scalable and robust solution. The platform allows data- and compute-intensive research projects to be conducted in parallel. The individual-level register data from Statistics Netherlands will offer opportunities for research in public health, health care, economics, education, sociology, bioinformatics, ‘omics’ and many other fields. The OSSC platform also facilitates multidisciplinary research and promotes open science by allowing for the increased linkage and interoperability of sensitive data. Projects may, for example, link data from MRI scans to data on psychiatric diagnoses as well as to data about urbanization level of the neighborhood to get more insight into the mediating effect of neural processes in the association between the urban environment and psychopathology (Lederbogen et al., Reference Lederbogen, Kirsch, Haddad, Streit, Tost, Schuch and Meyer-Lindenberg2011). In addition, in light of the current COVID-19 pandemic, the linkage of this population-based register data with cohort data will provide researchers with invaluable opportunities to determine the impact of the pandemic and the lockdown measures on individual outcomes such as mental health and educational outcomes in children, or address questions on host–virus interactions.
Supplementary material
To view supplementary material for this article, please visit https://doi.org/10.1017/thg.2021.18.
Acknowledgments
We are thankful to the twin families registered with the Netherlands Twin Register for their participation. This work was carried out on the Dutch national e-infrastructure with the support of SURF Cooperative. The results are based on own analyses of the VU Amsterdam researchers based on the nonpublic data from Statistics Netherlands.
Financial support
We gratefully acknowledge the Open Data Infrastructure for Social Science and Economic Innovations (ODISSEI; NWO: NRGWI.obrug.2018.008); ‘Netherlands Twin Register Repository: Researching the interplay between genome and environment’ (NWO: 480-15-001/674); KNAW Academy Professor Award (PAH/6635) and ‘Genetics as a research tool: A natural experiment to elucidate the causal effects of social mobility on health’ (ZonMw: 531003014).
Conflict of interest
None.


 Open access