


Introduction
To enable the visual system to respond in a wide range of light intensities, the retina adapts to background luminance at many stages including at the photoreceptors (Tamura et al., Reference Tamura, Nakatani and Yau1991; Woodruff et al., Reference Woodruff, Janisch, Peshenko, Dizhoor, Tsang and Fain2008), the horizontal cells (Xin & Bloomfield, Reference Xin and Bloomfield1999b), the excitatory bipolar and inhibitory amacrine cells (Green et al., Reference Green, Dowling, Siegel and Ripps1975; Naka et al., Reference Naka, Chan and Yasui1979; Green & Powers, Reference Green and Powers1982; Shapley & Enroth-Cugell, Reference Shapley and Enroth-Cugell1984; Page-McCaw et al., Reference Page-McCaw, Chung, Muto, Roeser, Staub, Finger-Baier, Korenbrot and Baier2004; Dunn et al., Reference Dunn, Doan, Sampath and Rieke2006, Reference Dunn, Lankheet and Rieke2007; Mazade & Eggers, Reference Mazade and Eggers2016), and the ganglion cells. As luminance increases, ganglion cell receptive field responses, which are modulated by inhibitory input through horizontal cells and inner retinal amacrine cells (Dedek et al., Reference Dedek, Pandarinath, Alam, Wellershaus, Schubert, Willecke, Prusky, Weiler and Nirenberg2008; Stroh et al., Reference Stroh, Puller, Swirski, Holzel, van der Linde, Segelken, Schultz, Block, Monyer, Willecke, Weiler, Greschner, Janssen-Bienhold and Dedek2018), increase signal sensitivity and strength (Barlow et al., Reference Barlow, Fitzhugh and Kuffler1957; Merwine et al., Reference Merwine, Amthor and Grzywacz1995; Troy et al., Reference Troy, Bohnsack and Diller1999; Dedek et al., Reference Dedek, Pandarinath, Alam, Wellershaus, Schubert, Willecke, Prusky, Weiler and Nirenberg2008; Farrow et al., Reference Farrow, Teixeira, Szikra, Viney, Balint, Yonehara and Roska2013; Borghuis et al., Reference Borghuis, Ratliff and Smith2018). Ganglion cell response changes with light adaptation could in part be a consequence of changes in pre-synaptic bipolar cell inhibitory receptive field surround strength and extent, which are mediated largely by amacrine cells. Bipolar cell receptive field surrounds are reduced during light adaptation, which could lead to stronger ganglion cell input from small stimuli and may play a role in increased retinal acuity (Mazade & Eggers, Reference Mazade and Eggers2016). It is unclear what may be mediating these receptive field changes; however, the neuromodulator dopamine is compelling as a major candidate.
Dopamine is released from specialized amacrine cells (Bauer et al., Reference Bauer, Ehinger and Aberg1980; Godley & Wurtman, Reference Godley and Wurtman1988; Witkovsky, Reference Witkovsky2004) and has been shown to be important for visual processing and light adaptation by affecting many retinal circuits (Godley & Wurtman, Reference Godley and Wurtman1988; Boatright et al., Reference Boatright, Hoel and Iuvone1989; Doyle et al., Reference Doyle, Grace, McIvor and Menaker2002). Mice lacking dopamine are impaired in many functions associated with light adaptation, including reduced light responses, contrast sensitivity, circadian rhythms, and visual acuity thresholds (Jackson et al., Reference Jackson, Ruan, Aseem, Abey, Gamble, Stanwood, Palmiter, Iuvone and McMahon2012). Since dopamine dysfunction reduces visual properties that rely on excitatory–inhibitory interactions, and inhibitory pathways shape center-surround structure (Flores-Herr et al., Reference Flores-Herr, Protti and Wassle2001; Russell & Werblin, Reference Russell and Werblin2010; Buldyrev & Taylor, Reference Buldyrev and Taylor2013; Protti et al., Reference Protti, Di Marco, Huang, Vonhoff, Nguyen and Solomon2014), dopaminergic pathways likely play a prominent role in the weakening of inner retinal receptive field surrounds with light adaptation.
Dopamine receptors are located on many retinal neurons in all layers (Veruki & Wassle, Reference Veruki and Wassle1996; Nguyen-Legros et al., Reference Nguyen-Legros, Simon, Caille and Bloch1997; Farshi et al., Reference Farshi, Fyk-Kolodziej, Krolewski, Walker and Ichinose2016). Dopamine signaling directly shapes ganglion cell receptive fields (Jensen & Daw, Reference Jensen and Daw1984; Maguire & Smith, Reference Maguire and Smith1985; Jensen & Daw, Reference Jensen and Daw1986; Jensen, Reference Jensen1989, Reference Jensen1991, Reference Jensen1992; Maguire & Hamasaki, Reference Maguire and Hamasaki1994) and heavily regulates amacrine cell coupling (Hampson et al., Reference Hampson, Vaney and Weiler1992; Kothmann et al., Reference Kothmann, Massey and O’Brien2009; Xia & Mills, Reference Xia and Mills2004). Dopamine regulation of cell coupling is similar to the regulation by luminance and likely one mechanism for receptive field changes with light adaptation (Bloomfield et al., Reference Bloomfield, Xin and Osborne1997). Additionally, dopamine D1 receptors modulate GABAA (Feigenspan & Bormann, Reference Feigenspan and Bormann1994a) and GABAC (Feigenspan & Bormann, Reference Feigenspan and Bormann1994b) receptor currents and GABAergic and glycinergic amacrine cell release (Pycock & Smith, Reference Pycock and Smith1983; Kato et al., Reference Kato, Negishi and Teranishi1985; O’Brien & Dowling, Reference O’Brien and Dowling1985; Calaza et al., Reference Calaza, de Mello and Gardino2001; Mazade et al., Reference Mazade, Flood and Eggers2019b). A recent study demonstrated that D1 receptor activation decreased local inhibition onto mouse bipolar cells to the same extent as light adaptation (Mazade et al., Reference Mazade, Flood and Eggers2019b). However, the similarity between dopamine and luminance regulation of inner retinal receptive fields is unknown.
We hypothesized that activation of D1 receptors would be sufficient to elicit light-adapted inhibitory changes in bipolar cell receptive field surrounds. We focused on OFF bipolar cells, which respond to the offset of light, because they receive inhibition from both dark- and light-adapted pathways and show robust changes in receptive field surrounds with light (Mazade & Eggers, Reference Mazade and Eggers2013, Reference Mazade and Eggers2016; Mazade et al., Reference Mazade, Flood and Eggers2019b). OFF bipolar cell surrounds are composed of glycinergic and GABAergic sources (Eggers et al., Reference Eggers, McCall and Lukasiewicz2007), which may be differentially modulated by dopamine (Veruki & Wassle, Reference Veruki and Wassle1996; Nguyen-Legros et al., Reference Nguyen-Legros, Simon, Caille and Bloch1997; Farshi et al., Reference Farshi, Fyk-Kolodziej, Krolewski, Walker and Ichinose2016). Our previous results suggested that D1 receptors are primarily modulating glycinergic, and not GABAergic, local amacrine cell inputs to OFF bipolar cells (Mazade et al., Reference Mazade, Flood and Eggers2019b). Here, we show that this is mostly replicated across the whole OFF bipolar cell receptive field surround. These results expand the role of dopamine to likely modulating light-adapted changes in bipolar cell receptive fields but indicate non-D1 receptor pathways are also required for adaptation.
Materials and methods
Preparation of mouse retinal slices
All animal protocols for this study were approved by the University of Arizona’s Institutional Animal Care and Use Committee (IACUC). As described previously (Eggers & Lukasiewicz, Reference Eggers and Lukasiewicz2006; Eggers et al., Reference Eggers, Mazade and Klein2013; Mazade & Eggers, Reference Mazade and Eggers2013), male mice (n = 27), fed ad libitum (C57BL/6J strain; Jackson Laboratories, Bar Harbor, ME), 35–60 days of age, were euthanized using carbon dioxide and their eyes enucleated. The retina was removed and a large rectangle of the central retina was cropped from the periphery. A nitrocellulose membrane filter paper (0.45 μm pore size, Millipore, Ireland) was placed on the retina and an average of six 250 μm slices were cut with a hand chopper, rotated 90°, and mounted onto glass coverslips using vacuum grease. Cells used from these slices were selected using previous criteria (Mazade & Eggers, Reference Mazade and Eggers2016). The tissue was maintained in oxygenated extracellular solution at room temperature. All dissection and storage procedures were performed under infrared illumination to preserve retinal light sensitivity.
Solutions and drugs
The extracellular recording solution used for dissection and for measuring light-evoked currents contained (in mm) 125 NaCl, 2.5 KCl, 1 MgCl2, 1.25 NaH2PO4, 2 CaCl2, 20 glucose, and 26 NaHCO3. For voltage clamp recordings, the intracellular solution contained (in mm) 120 CsOH, 120 gluconic acid, 1 MgCl2, 10 HEPES, 10 TEA-Cl, 10 phosphocreatine-Na2, 4 Mg-ATP, 0.5 Na-GTP, 10 EGTA, and 50 μ m Alexa Fluor 488 (Invitrogen, Carlsbad, CA) and was adjusted to pH 7.2 with CsOH. Extracellular solutions were bubbled with 95% O2–5% CO2. To isolate the inhibitory receptor inputs, SR-95531 (SR, 20 μ m) to block GABAA receptors, (1,2,5,6-tetrahydropyridine-4yl) methylphosphinic acid (TPMPA, 50 μ m) to block GABAC receptors, and strychnine (1 μ m) to block glycine receptors were used (Mazade & Eggers, Reference Mazade and Eggers2013, Reference Mazade and Eggers2016). To test dopamine D1 receptors, the D1 receptor agonist SKF-38393 (SKF, 20 μ m, Tocris) was used with a concentration similar to previous studies (Ichinose & Lukasiewicz, Reference Ichinose and Lukasiewicz2007; Liu et al., Reference Liu, Grove, Hirano, Brecha and Barnes2016; Mazade et al., Reference Mazade, Flood and Eggers2019b). All drug solutions were applied to the slice for five minutes before recordings began using a gravity-driven superfusion system (Cell Microcontrols, Norfolk, VA), with continuous perfusion throughout the experiment (∼1–2 ml/min). Unless otherwise indicated, all chemicals were obtained from Sigma-Aldrich (St. Louis, MO).
Whole cell recordings
Light-evoked inhibitory postsynaptic currents (L-IPSCs) were recorded from OFF bipolar cells in retinal slices using whole-cell patch clamp sampled at 10 kHz and voltage clamped to 0 mV, the reversal potential of nonselective cation channels. Liquid junction potentials (20 mV) were calculated with Clampex software (Molecular Devices, Sunnyvale, CA) and corrected for at the start of the recording. Electrodes were pulled from borosilicate glass (World Precision Instruments, Sarasota, FL) on a P97 Flaming/Brown puller (Sutter Instruments, Novato, CA) and had resistances of 5–7 MΩ. Mice were dark-adapted overnight, and all recordings were performed in the dark under infrared illumination to preserve retinal light sensitivity. Recording extracellular solution was heated to 32°C using thin stage and inline heaters (Cell Microcontrols). Responses were filtered at 6 kHz with the four-pole Bessel filter on a Multi-clamp 700B patch-clamp amplifier (Molecular Devices) and digitized with a Digidata 1140 data acquisition system (Molecular Devices).
Morphological identification of cells
The intracellular solution contained Alexa 488 to label OFF bipolar cells. Cells were classified as OFF bipolar cells using axonal morphology, inner plexiform layer terminal stratification, and the soma position in the inner nuclear layer (Ghosh et al., Reference Ghosh, Bujan, Haverkamp, Feigenspan and Wassle2004). Cells were imaged with a Nikon Digital Sight camera with Elements software using a Nikon Intensilight C-HGFIE Fluorescent lamp (Nikon Instruments, Tokyo, Japan). Axon terminal morphology and response properties (Mazade & Eggers, Reference Mazade and Eggers2013) were used to identify OFF bipolar cells. A total of 29 bipolar cells were included in this study (12 OFF type 1/2/4 and 17 OFF type 3). In previous studies, we found no difference between subtype spatial inhibitory response profiles or center receptive field responses when comparing between OFF types 1, 2, and 4 and OFF type 3 (Mazade & Eggers, Reference Mazade and Eggers2016; Mazade et al., Reference Mazade, Flood and Eggers2019b). Therefore, we combined all OFF bipolar cell subtypes for averaging their spatial response profiles in each condition.
Visual stimulus
Bar stimuli (25 μm wide, flashed every 100 μm) were presented using a white organic light-emitting diode (OLED Microdisplay, eMagin EMA-100503 SXGA Monochrome White XL, Bellevue, WA) projected through the camera port of the microscope, which elicited strong, stable, and reproducible responses (Mazade & Eggers, Reference Mazade and Eggers2016). The stimulus was presented through the 4× objective and the stimulus field was limited to the size of the OLED screen that was 3 mm long × 2.1 mm tall. The length of the retinal slice varied but was always <3 mm long (average of 1.5 mm long). The OLED screen (e.g., stimulus field) was always centered over the recorded cell, so that the bar stimulated the retina up to 600 μm to either side of the cell and the bar extended well over the height of the retinal slice (∼0.25 mm). Therefore, the stimulus presentation fully activated retinal neurons at each stimulus location. Recordings were made in the central retinal region of mixed green/UV cone opsins (Applebury et al., Reference Applebury, Antoch, Baxter, Chun, Falk, Farhangfar, Kage, Krzystolik, Lyass and Robbins2000; Haverkamp et al., Reference Haverkamp, Wassle, Duebel, Kuner, Augustine, Feng and Euler2005). The stimulus was presented and controlled with custom MATLAB (Mathworks, Natick, MA, 1984) code with Psychtoolbox-3 (Brainard, Reference Brainard1997) extensions by controlling the intensity (7.83 × 10⁴ photons/μm2/s), size, location, and duration of the stimulus. The background luminance used to light adapt the retina was 1150 photons/μm2/s (Mazade & Eggers, Reference Mazade and Eggers2016). A one-second stimulus was used to elicit a robust response and determine the type of inhibition for identification (Mazade & Eggers, Reference Mazade and Eggers2013) with an interstimulus interval of 29 s.
Data analysis and statistics
Clampfit software (Molecular Devices) was used to measure the peak amplitude and charge transfer of L-IPSC traces averaged from at least two stimulus repeats. The peak amplitude of L-IPSCs was estimated by reducing the sampling rate of averaged traces (50-fold) with each point replaced with the average of those data points, after which the maximum value was measured. This was performed to reduce variations from spontaneous activity. A peak amplitude measurement was included if the L-IPSC was larger than one standard deviation (SD) above the baseline current, leaving a positive value after the baseline + SD was subtracted from the response. If the measurement after subtraction was negative, indicating no light response, the value was set at zero for including a “no response” value in the quantification for that stimulus position and condition. For current charge transfer, the area under the response was measured in Clampfit over the length of the response (1–2 s) using the same time window in each condition for the same cell. As for peak amplitude, an evoked light response was included if it was larger than one SD above baseline noise. The mean + SD of the baseline current was subtracted from all evoked responses for analysis to limit baseline or spontaneous noise. All example light response traces in the figures were filtered with a low pass Gaussian filter (1000 Hz) to limit noise for display purposes. Example L-IPSCs show responses to the central bar stimulus directly over the recorded cell and 400 μm away from the cell in each direction. The light gray bar under the example trace notes the start and end of the light stimulus. A disconnected bar indicates that the light stimulus occurred before or proceeded after the example trace shown.
By mapping the receptive field with a series of bars, we could quantify the extent (size) and strength of the surround by measuring the strength of the light-evoked response at each location. Spatial light-evoked response charge transfer, normalized to the dark-adapted response at zero μm (bar stimulus over the recorded cell), and peak amplitude measurements were used. Responses to SKF or light-adapted conditions in the figure panels comparing the two were normalized to their respective dark-adapted responses. Normalized responses were used to control for variability between bipolar cell L-IPSCs and standardize response magnitude, so that the widths of the receptive field could be better compared without influence of any initial amplitude change. Peak amplitude was used as a reliable maximum response current. Two-way analysis of variance (ANOVA) with Student–Newman–Keuls (SNK) post hoc test was used to compare spatial profiles before and after light adaptation or D1 receptor activation as well as between response characteristics at each stimulus distance. All data are mean ± SEM, showing only the outer error bars in the figure plots for visualization. Significance is exact P values in text (P value less than 0.001 noted as P < 0.001) and as P < 0.05 (*), P < 0.01 (**), and P < 0.001 (***) in figures.
Results
D1 receptor activation partially replicates OFF bipolar cell surround reductions with light adaptation
D1 receptors are a likely candidate for mediating light-adapted changes to OFF pathway surrounds, since some populations of OFF bipolar cells and the glycinergic and GABAergic amacrine cells providing inhibitory input express D1 receptors (Fig. 1A). Horizontal cells are also important for shaping receptive field surrounds; however, a vast majority of OFF bipolar cell input in the dark is glycinergic (Eggers et al., Reference Eggers, McCall and Lukasiewicz2007; Mazade & Eggers, Reference Mazade and Eggers2013, Reference Mazade and Eggers2016; Mazade et al., Reference Mazade, Flood and Eggers2019b), so inner retinal amacrine cells likely play a larger role in OFF bipolar cell surrounds. While D1 receptor activation modulates local light-evoked and spontaneous inhibition to OFF bipolar cells in a similar manner as with light adaptation (Mazade et al., Reference Mazade, Flood and Eggers2019b), it is unknown whether D1 receptor activation and light adaptation similarly affect the spatial inhibitory input to OFF bipolar cells (Fig. 1B). Previously, we found that light adaptation narrows and weakens OFF bipolar cell light-evoked inhibitory surrounds (Mazade & Eggers, Reference Mazade and Eggers2016) and we predicted that activation of D1 receptors with SKF would be sufficient to replicate this result. To test this prediction, we mapped the spatial extent of light-evoked OFF bipolar cell inhibition using a narrow light bar flashed across the retinal slice (bar width: 25 μm, interstimulus distance: 100 μm, flash duration: 1 s, interstimulus interval: 29 s). All OFF bipolar cell subtypes were grouped together for the following analyses (see Materials and Methods). We found that OFF bipolar cell inhibition became significantly narrower and weaker after SKF application (Fig. 2). OFF bipolar cell L-IPSCs in the dark were robust, with inhibitory responses at distances more than 400 μm away from the recorded cell (Fig. 2A). After SKF application, most OFF bipolar cells did not have measurable inhibition if stimuli were presented more than 400 μm away from the cell (Fig. 2B). The spatial profile of response charge transfer normalized to the center bar in each condition became significantly narrower with SKF (n = 7, P < 0.001, ANOVA, Fig. 2C) as the average responses in the periphery became significantly smaller than dark-adapted responses. Similarly, the L-IPSC peak amplitude spatial profile became significantly smaller after SKF application (n = 7, P < 0.001, ANOVA, Fig. 2D).
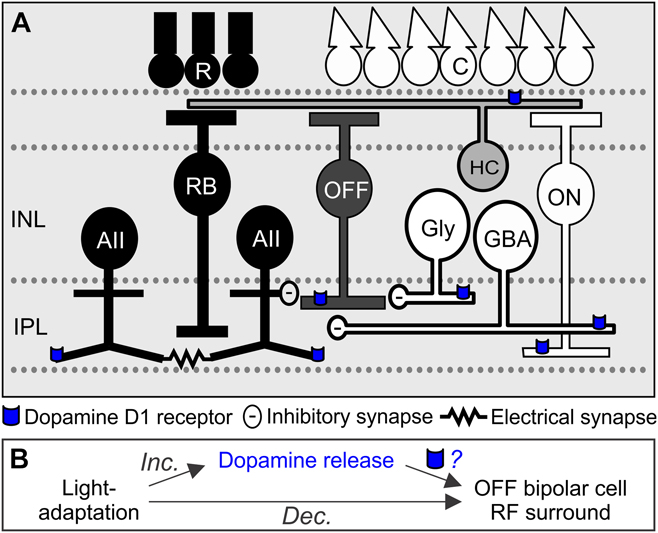
Fig. 1. Schematic of dopamine D1 receptor locations on major inhibitory inputs to OFF bipolar cells. (A) In dark-adapted conditions, AII amacrine cells (AII) are activated by the rod pathway (dark pathway, R = rod photoreceptors, RB = rod bipolar cells) and release glycine onto OFF cone bipolar cells (OFF). AII amacrine cells are coupled to other AII amacrine cells through electrical gap junctions. In light-adapted conditions, other narrow-field glycinergic amacrine cells (Gly) and wide-field GABAergic amacrine cells (GBA) are activated by cone pathways (white pathways, C = cone photoreceptor, ON = ON cone bipolar cell), which provide inhibitory input to OFF bipolar cells. In the inner retina, dopamine is released onto D1 receptors (blue) located on cone bipolar and amacrine terminals. INL = inner nuclear layer, IPL = inner plexiform layer. (B) Light adaptation increases dopamine release and decreases OFF bipolar cell receptive field (RF) surround size and strength. However, it is unknown to what extent dopamine, through dopamine D1 receptor activation, replicates the light-adapted effects on OFF bipolar cell surrounds.
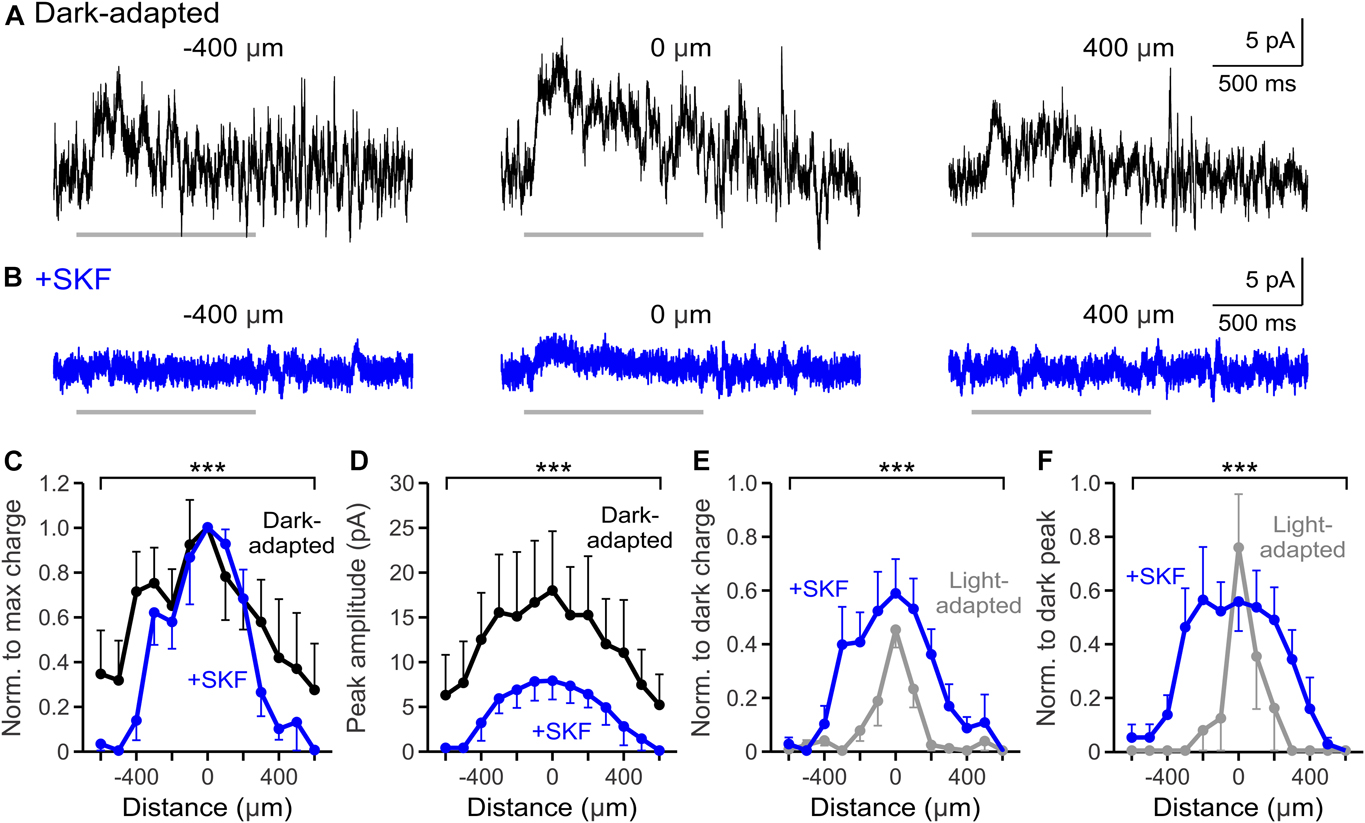
Fig. 2. D1 receptor activation weakens the spatial inhibitory input to OFF bipolar cells. (A, B) Example L-IPSCs recorded in dark-adapted (black, A) and dark-adapted + SKF (+SKF, blue, B) conditions in response to a light stimulus (1 s, 25 μm bar) presented at −400, 0, and 400 μm from the cell. SKF application reduced L-IPSC strength at all stimulus distances. Light stimulus = light gray bar under example OFF type 1/2 traces. (C) Spatial inhibition profiles of response charge transfer normalized to the center bar stimulus in dark-adapted and SKF conditions (n = 7). The spatial profile became significantly narrower with SKF. (D) Same as in C but for response peak amplitude. The peak amplitude profile was significantly narrower and smaller with light adaptation. (E) Spatial inhibition profiles of response charge transfer normalized to the respective dark-adapted center bar stimulus in SKF and light-adapted (n = 5, gray) conditions. Light-adapted spatial input was significantly narrower and smaller than with SKF application. (F) Same as in E but for normalized response peak amplitude. The peak amplitude profile was significantly smaller in the periphery with light adaptation. Cells included in averages: SKF = 3 OFF type 1/2/4 and 4 OFF type 3; light-adapted = 1 OFF type 1/2/4 and 4 OFF type 3. Light-adapted data were adapted from Mazade and Eggers (Reference Mazade and Eggers2016) Fig. 2C and 2F for comparison. Error bars are ±SEM and only show the outer bar for each data point (*** P < 0.001).
To determine if activation of D1 receptors replicated light-adapted changes in spatial input, we compared the response charge transfer and peak amplitude spatial profiles between light-adapted (data adapted from Mazade & Eggers, Reference Mazade and Eggers2016) and SKF conditions. The spatial responses for SKF and light-adapted conditions were normalized to their respective dark-adapted center responses to determine whether activating D1 receptor signaling is sufficient to produce the magnitude of inhibitory changes caused with increased background luminance. Although there was a significant decrease in spatial charge transfer to OFF bipolar cells with SKF application (Fig. 2C), the spatial response profile was still significantly larger and wider than under light-adapted conditions (light-adapted n = 5, SKF vs. light-adapted P < 0.001, ANOVA, Fig. 2E). The normalized inhibitory peak amplitude profile was also significantly larger under SKF than under light-adapted conditions (light-adapted n = 5, SKF vs. light-adapted P < 0.001, ANOVA, Fig. 2F). The main differences between SKF and light-adapted spatial changes were localized to the central surround area (<400 μm). Therefore, D1 receptor activation replicated the reduction in spatial surrounds but not the magnitude of change evoked with light adaptation. This suggests that D1 receptors are only part of the mechanism for light-adapted inner retinal OFF pathway receptive field adaptation.
D1 receptors reduces GABAergic input at the edges of OFF bipolar cell surrounds
Inhibition to OFF bipolar cells is mediated by inputs from GABAergic and glycinergic amacrine cells onto GABAA, GABAC, and glycine receptors, and each of these components may be independently modulated by D1 receptors. Previous work found that the light-adapted narrowing of OFF bipolar surrounds was due in part to narrowing and weakening of the GABAergic component of the receptive field (Mazade & Eggers, Reference Mazade and Eggers2016). Since activation of D1 receptors caused significant narrowing of total spatial inhibitory input (Fig. 2) and decreases in spontaneous GABA release to OFF bipolar cells (Mazade et al., Reference Mazade, Flood and Eggers2019b), we wanted to determine whether D1 receptor activation reduces the strength of the GABAergic component of the spatial surround. Pharmacologically isolated GABAergic spatial profiles (in strychnine to block glycine receptors) were measured in the dark before and after SKF application. Bar stimuli elicited small L-IPSCs at both near and far distances from the cell (Fig. 3A). Small GABAergic responses in dark-adapted OFF bipolar cells are expected due to the relatively minor GABAergic input compared with glycinergic input. However, GABAergic responses at 400 μm away still remained after SKF application (Fig. 3B). The GABAergic spatial profile was not different in the SKF condition (P = 0.085, ANOVA); however, there were significant reductions in response strength localized only to the farthest stimulus distances (n = 4, −600 μm: P = 0.006, −500 μm: P < 0.001, 500 μm: P = 0.031, 600 μm: P = 0.028, ANOVA SNK post hoc, Fig. 3C). Likewise, the changes in the peak amplitude of GABAergic responses were only reduced at the farthest stimulus distances (−600 μm: P = 0.022, 500 μm: P = 0.007, ANOVA SNK post hoc, Fig. 3D). Weak responses at the edges but not the center of the receptive field surround suggest that D1 receptors affect long-distance connections from wide-field GABAergic amacrine cells or at least the distal processes responsible for long range inputs.
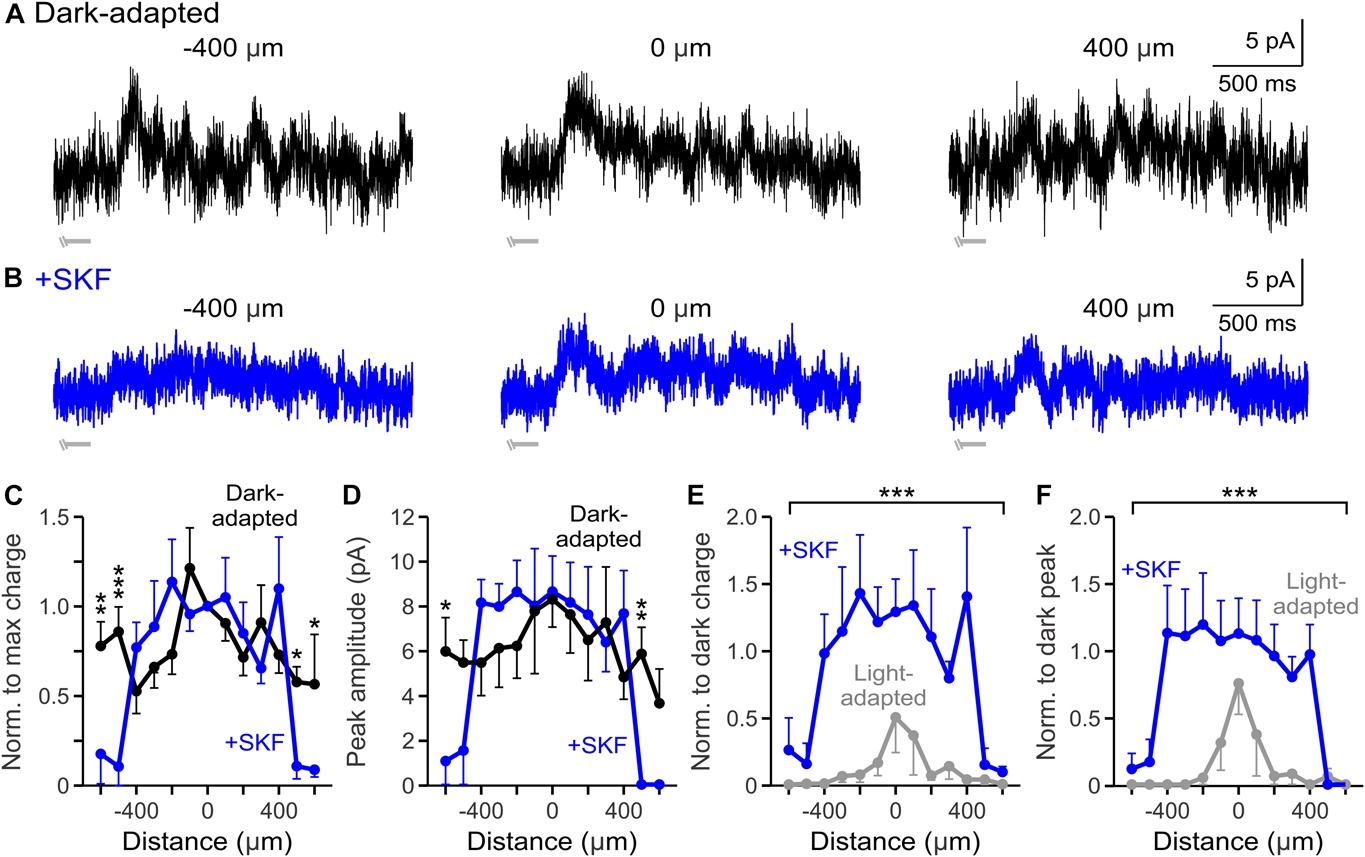
Fig. 3. D1 receptor activation affects the edges of GABAergic spatial input to OFF bipolar cells. (A, B) Example GABAergic L-IPSCs recorded in dark-adapted (black, A) and dark-adapted + SKF (+SKF, blue, B) conditions. SKF application did not reduce overall response strength 400 μm away from the cell. Light stimulus = light gray disconnected bar under example traces; this OFF type 3 cell responded to the offset of the stimulus so only the end of the light stimulus is shown. (C) Spatial inhibition profiles of GABAergic response charge transfer normalized to the center bar stimulus in dark-adapted and SKF conditions (n = 4). Inhibition was significantly reduced only at far stimulus distances. (D) Same as in C but for GABAergic response peak amplitude. Peak amplitude was only reduced at far stimulus distances. (E) Spatial inhibition curves of GABAergic response charge transfer normalized to the respective dark-adapted center bar stimulus in SKF and light-adapted (n = 5, gray) conditions. Spatial inhibitory strength was reduced in the near surround more with light adaptation than with SKF. (F) Same as in E but for normalized response peak amplitude. The peak amplitude spatial profile was significantly smaller with light adaptation only in the local surround. Cells included in averages: SKF = 1 OFF type 1/2/4 and 3 OFF type 3; light-adapted = 4 OFF type 3. Light-adapted data were adapted from Mazade and Eggers (Reference Mazade and Eggers2016) Fig. 3C and 3F for comparison. Error bars are ±SEM and only show the outer bar for each data point (* P < 0.05, ** P < 0.01, and *** P < 0.001).
To determine the extent that D1 receptor activation is similar to light-adapted GABAergic spatial changes, we compared the spatial response and peak amplitude profiles between light-adapted conditions (data adapted from a previous report, Fig. 3C and 3F; Mazade & Eggers, Reference Mazade and Eggers2016) and SKF, when both were normalized to their respective dark-adapted center responses. We found that GABAergic spatial charge transfer was significantly wider and larger after SKF application than under light-adapted conditions (SKF n = 4, light-adapted n = 4, P < 0.001, ANOVA, Fig. 3E). All but the farthest distances (<500 μm, all comparisons P < 0.05, ANOVA SNK post hoc) were significantly larger after SKF. Likewise, the normalized spatial peak amplitude profile was significantly larger with D1 receptor activation than with light adaptation (SKF: n = 4, light-adapted: n = 4, P < 0.001, ANOVA, Fig. 3F). While these results indicate that D1 receptors affect the edges of receptive field surrounds, other factors must modulate the central GABAergic surround changes seen with increased luminance.
D1 receptor stimulation reduces glycinergic surround extent and strength to light-adapted levels
The results from Fig. 3 show that dopaminergic signaling can affect GABA receptor–mediated currents, but the effects of dopamine on glycinergic surround inhibition is unknown. Total light-evoked glycinergic input to OFF bipolar cells decreases with light adaptation (Mazade & Eggers, Reference Mazade and Eggers2013) and the glycinergic component of the receptive field surround becomes narrower and smaller (Mazade & Eggers, Reference Mazade and Eggers2016). Additionally, D1 receptor activation suppresses local glycinergic light-evoked and spontaneous currents by reducing glycine release (Mazade et al., Reference Mazade, Flood and Eggers2019b). Since activation of D1 receptors causes significant narrowing and weakening of total spatial inhibition to OFF bipolar cells (Fig. 2) and glycine is the dominant inhibitory signal (Eggers et al., Reference Eggers, McCall and Lukasiewicz2007), we determined whether dopamine modulation of light-evoked glycinergic spatial input is similar to that with light adaptation.
Using the same spatial mapping stimulus in Figs. 2 and 3, the spatial extent of pharmacologically isolated glycinergic inhibitory input (in SR and TPMPA to block all GABA receptors) was measured in dark-adapted conditions before and after SKF application. Center bar stimuli elicited strong L-IPSCs with smaller L-IPSCs at 400 μm away (Fig. 4A). However, SKF application reduced all L-IPSCs at each mapping location (Fig. 4B). The spatial profile of normalized charge transfer became significantly narrower in the SKF condition (n = 5, P < 0.001, ANOVA, Fig. 4C), similar to total inhibition with SKF. Likewise, the peak amplitude spatial profile became significantly smaller in the SKF-treated retina (n = 5, P = 0.003, ANOVA, Fig. 4D). Unlike the GABAergic dark-adapted response profiles (Fig. 3), glycinergic dark-adapted spatial profiles are similar in shape and magnitude to the total inhibition dark-adapted spatial profiles (compare Figs. 2 and 4) likely due to the glycine-dominated input to OFF bipolar cells in the dark. These results suggest that D1 receptor modulation is contributing to the observed reduction of glycinergic spatial inhibition to OFF bipolar cells (Mazade & Eggers, Reference Mazade and Eggers2016), which is likely the primary driver of weakening the total inhibitory spatial surround. To determine similarity to changes with light adaptation, we compared the response charge transfer and peak amplitude spatial profiles between glycinergic light-adapted (data adapted from Mazade & Eggers, Reference Mazade and Eggers2016, Fig. 5C and 5F) and SKF conditions normalized to their respective dark-adapted center responses. We found that there was no difference between SKF (n = 5) and light-adapted conditions (n = 4) in the response charge transfer (P = 0.892, ANOVA, Fig. 4E) or peak amplitude (P = 0.190, ANOVA, Fig. 4F) profiles. These results indicate that D1 receptor activation is sufficient to replicate light-adapted levels of change in glycinergic surround size and magnitude.

Fig. 4. D1 receptor stimulation reduces glycinergic spatial inhibitory strength to light-adapted levels. (A, B) Example glycinergic L-IPSCs recorded in dark-adapted (black, A) and dark-adapted + SKF (+SKF, blue, B) conditions. SKF application reduced overall response 400 μm away from the OFF bipolar cell. Light stimulus = light gray disconnected bar under example OFF type 4 traces. The response ended before the end of the light stimulus, so only the initial portion of the light stimulus is shown. (C) Spatial inhibition profiles of glycinergic response charge transfer normalized to the center bar stimulus in dark-adapted and SKF conditions (n = 5). The spatial profile of inhibitory responses was reduced with D1 receptor activation. (D) Same as in C but for glycinergic response peak amplitude. The peak amplitude spatial profile was significantly smaller with SKF activation. (E) Spatial inhibition curves of glycinergic response charge transfer normalized to the respective dark-adapted center bar stimulus in SKF and light-adapted (n = 4, gray) conditions. Light-adapted spatial input was not different from that with SKF application. (F) Same as in E but for normalized glycinergic response peak amplitude. The peak amplitude spatial profile was not significantly different from that with light adaptation. Cells included in averages: SKF = 4 OFF type 1/2/4 and 1 OFF type 3; light-adapted = 3 OFF type 1/2/4 and 1 OFF type 3. Light-adapted data were adapted from Mazade and Eggers (Reference Mazade and Eggers2016) Fig. 5C and 5F for comparison. Error bars are ±SEM and only show the outer bar for each data point (** P < 0.01 and *** P < 0.001).
Discussion
We found that D1 receptor activation can replicate many but not all light-adapted changes in OFF bipolar cell surround inhibition by reducing the size and extent of spatial input. This was likely primarily due to modulation of glycinergic inputs, as the effects of activating D1 receptors were comparable to light-adapted glycinergic decreases, and less so from GABAergic sources as D1 receptor activation reduced responses only at the edges of the surround. Interestingly, while these results suggest that dopamine (through D1 receptors) is one factor in light-adapted changes in inner retinal inhibition, our findings show that other mechanisms are required to reach the full magnitude of adaptation effects for OFF bipolar receptive fields.
D1 receptor regulation of OFF bipolar cell surrounds may modulate OFF ganglion cell responses
Our results showing that D1 receptor activation replicates some bipolar cell light-adapted surround changes add context to several studies investigating the role of dopamine in modulating ganglion cell light-evoked signals. Work in vitro and in vivo in rabbit OFF ganglion cells found that dopamine reduced their sensitivity to light stimuli (Jensen & Daw, Reference Jensen and Daw1984, Reference Jensen and Daw1986) and blocking D1 receptors reduced surround responses (Jensen & Daw, Reference Jensen and Daw1984). Similar effects were seen in vivo in the cat, where blocking D1 receptors reduced light-evoked activity of OFF ganglion cells, suggesting that D1 receptors normally increase light responses (Maguire & Hamasaki, Reference Maguire and Hamasaki1994). The authors hypothesized that the site of action could include the outer retina and inner retinal amacrine cells, which is supported by changes we find here. Additionally, blocking D1 receptors in the mouse decreased OFF ganglion cell responses in light-adapted retinas, where the suggested site of action was through OFF bipolar cell glutamate release (Yang et al., Reference Yang, Pahng and Wang2013). A common theme in many of these studies includes the inhibition modulating upstream bipolar cell release. The D1 receptor–mediated reduction in spatial inhibition to OFF bipolar cells that we show here could help explain increased OFF ganglion cell responses reported previously and modeled in a previous study (Mazade & Eggers, Reference Mazade and Eggers2016). For example, light adaptation acting through D1 receptor activation would reduce the inhibitory input to OFF bipolar cells in response to a small spot of light leading to increased bipolar cell output to ganglion cells. This could be one way of strengthening ganglion cell responses to smaller stimuli to increase acuity in bright light conditions. This predicts that blocking dopamine would attenuate this inhibitory reduction, leading to a more inhibited bipolar cell output and reduced signaling to ganglion cells, which may explain the previous results using D1 receptor antagonists. The data here suggest that the modulation observed in ganglion cell spiking responses in bright light conditions is likely to arise from dopamine-mediated mechanisms at the bipolar cell level. However, this remains to be demonstrated directly.
The weakening in size and strength of OFF bipolar cell surrounds with dopamine and light adaptation contrasts recent evidence suggesting the opposite for ON bipolar cells. Interestingly, it was found that D1 receptor activation increased GABAergic activity in ON bipolar cell dendrites, likely mediated through horizontal cells, suggesting a strengthening of their receptive field surrounds (Chaffiol et al., Reference Chaffiol, Ishii, Cao and Mangel2017). Furthermore, following a period of darkness, when D1 receptors are presumably the least active, GABAergic function was weak. Differences between ON and OFF bipolar cell pathways are not unexpected, given the unique rod-mediated AII amacrine cell inhibitory connections to OFF but not ON bipolar cells in addition to many other retinal ON and OFF pathway asymmetries (Chichilnisky & Kalmar, Reference Chichilnisky and Kalmar2002; Ravi et al., Reference Ravi, Ahn, Greschner, Chichilnisky and Field2018). Previously, we predicted that weaker OFF bipolar cell surrounds may increase OFF ganglion cell preference for small stimuli. It could be that stronger ON bipolar cell surrounds with D1 receptors/light adaptation produces the opposite change: ON ganglion cells become less sensitive to smaller stimuli. This matches the larger receptive field sizes for ON than OFF ganglion cells (Ravi et al., Reference Ravi, Ahn, Greschner, Chichilnisky and Field2018) and parallels recent work showing cortical ON pathways prefer larger stimuli than cortical OFF pathways in the cat (Mazade et al., Reference Mazade, Jin, Pons and Alonso2019a). However, whether ON bipolar cells show changes in receptive field surrounds coming from amacrine cells, not horizontal cell inputs to dendrites, is less clear.
D1 receptors mediate wide-field GABAergic and narrow-field glycinergic amacrine cell inhibitory changes to OFF bipolar cells
We report that D1 receptor modulation of GABAergic pathways could be partially responsible for the light-induced reduction in the GABAergic component of the receptive field surround (Mazade & Eggers, Reference Mazade and Eggers2016). Previous results suggest that D1 receptors do not modulate the postsynaptic GABA receptors on OFF bipolar cells as the peak amplitude of GABAergic spontaneous events did not change (Mazade et al., Reference Mazade, Flood and Eggers2019b). Instead, the effects on GABAergic currents were likely due to decreased GABA release from distal amacrine cells, since D1 receptors decrease the frequency of GABAergic spontaneous events (Mazade et al., Reference Mazade, Flood and Eggers2019b) and light-evoked reductions only occurred at the edges of the OFF bipolar cell surround (Fig. 3). Given that the steep decline in GABAergic response at the edges of the surround occurred only in D1-receptor activated conditions, and not light adaptation, it is likely that D1 receptors are strongly linked to long-range GABAergic input to OFF bipolar cells. Although we observe a steep decline, there may be a gradual weakening of the response within the 100 μm distance between our stimuli. However, in general, the GABAergic component of OFF bipolar cell inhibition is very small, especially in the dark-adapted condition, as can be seen by comparing with glycinergic and total inhibition here and in previous studies (Eggers et al., Reference Eggers, McCall and Lukasiewicz2007; Mazade & Eggers, Reference Mazade and Eggers2013, Reference Mazade and Eggers2016; Mazade et al., Reference Mazade, Flood and Eggers2019b). Therefore, it is unlikely that GABAergic inhibition is playing a major role in the adaptation of OFF bipolar cell receptive fields. Together with previous findings, our results suggest that the main effect of D1 receptors on GABAergic inhibition is on wide-field GABAergic amacrine cells but that additional mechanisms are required to mediate GABAergic changes in the central or local surround.
In contrast to the GABAergic component of the OFF bipolar cell surround, D1 receptor activation reduced glycinergic inputs at both the central and peripheral surround (Fig. 4). While there have been relatively few studies investigating how dopaminergic signaling affects retinal glycinergic pathways, work on the rabbit retina showed that the effects of D1 antagonists on the surround response of OFF ganglion cells (Falch et al., Reference Falch, Hedegaard, Nielsen, Jensen, Hjeds and Krogsgaard-Larsen1986; Jensen, Reference Jensen1992) was blocked by inhibiting glycine receptors (Jensen, Reference Jensen1989). This suggests that dopamine may be acting through glycinergic pathways to increase ganglion cell responses, which is supported by our data here and implied by previous work (Mazade & Eggers, Reference Mazade and Eggers2016). A reduction in the glycinergic surround strength of OFF bipolar cells would greatly alter the inhibitory input to the OFF bipolar cell and would subsequently increase signal transmission to downstream ganglion cells. Our current findings suggest that D1 receptors are primarily modulating glycinergic amacrine cell inputs to OFF bipolar cells, which is consistent with our previous work on D1 receptor–mediated presynaptic effects on local glycinergic inputs (Mazade et al., Reference Mazade, Flood and Eggers2019b).
The conclusion that dopamine-mediated effects mainly occur presynaptically on amacrine cells and are correlated with light-adapted changes in receptive fields, adds further support for amacrine cell importance in adaptation. Additionally, we propose that glycinergic spatial inhibition to OFF bipolar cells is more important than previously thought for contributing to lateral, and not only vertical or crossover, inhibition. We find here and in previous studies (Mazade & Eggers, Reference Mazade and Eggers2016) that the glycinergic component of OFF pathway receptive fields can extend at least 600 μm away from the recorded cell (Fig. 4). This suggests that they are playing a role in lateral inhibition that may be mediated heavily by gap junction connections between narrow-field glycinergic amacrine cells. We previously proposed (Mazade & Eggers, Reference Mazade and Eggers2016) that the reduced extent of glycinergic inputs with light adaptation could be explained by uncoupling of retinal gap junctions between glycinergic amacrine cells. Dopamine is well documented to modulate coupling state and synchronized activity throughout the retina (Lasater & Dowling, Reference Lasater and Dowling1985; Dong & McReynolds, Reference Dong and McReynolds1991; Hampson et al., Reference Hampson, Vaney and Weiler1992; Ribelayga et al., Reference Ribelayga, Cao and Mangel2008; Kothmann et al., Reference Kothmann, Massey and O’Brien2009; Hu et al., Reference Hu, Pan, Volgyi and Bloomfield2010; Bu et al., Reference Bu, Li, Gong, Liang and Zhang2014). Both D1 receptors (Hampson et al., Reference Hampson, Vaney and Weiler1992; Xia & Mills, Reference Xia and Mills2004; Kothmann et al., Reference Kothmann, Massey and O’Brien2009) and increased background illumination (Bloomfield et al., Reference Bloomfield, Xin and Osborne1997; Xin & Bloomfield, Reference Xin and Bloomfield1997, Reference Xin and Bloomfield1999a) uncouple glycinergic AII amacrine cells that provide large inhibitory input to OFF bipolar cells (Fig. 1).
Our data are consistent with the idea that D1 receptors cause uncoupling and thus reduce the spatial spread of glycinergic signals (Mazade & Eggers, Reference Mazade and Eggers2016; Veruki et al., Reference Veruki, Oltedal and Hartveit2010) in a similar manner to light adaptation. However, uncoupling of other glycinergic amacrine cells are also likely involved since not all OFF bipolar cell subtypes receive AII amacrine cell input (Mazade & Eggers, Reference Mazade and Eggers2013; Tsukamoto & Omi, Reference Tsukamoto and Omi2017). In fact, AII amacrine cells appear to preferentially contact OFF types 1/2 (Graydon et al., Reference Graydon, Lieberman, Rho, Briggman, Singer and Diamond2018), but all OFF bipolar cells receive a majority of glycinergic input (Eggers et al., Reference Eggers, McCall and Lukasiewicz2007). Therefore, other glycinergic amacrine cells, such as the A8, which are coupled to each other and also provide glycinergic inhibition to OFF bipolar cells, may be involved (Lee et al., Reference Lee, Meyer, Schubert, Huser, Dedek and Haverkamp2015; Yadav et al., Reference Yadav, Tetenborg and Dedek2019). However, A8 amacrine cell coupling was not modulated by D1 receptors, and it is unknown how coupling state is affected by luminance (Yadav et al., Reference Yadav, Tetenborg and Dedek2019). Regardless, OFF bipolar cells not receiving AII input are likely receiving input from other glycinergic amacrine cells that perform similar functions as the AII.
We propose that D1 receptor activation has two main effects on OFF bipolar cell inhibition. The first is uncoupling of AII or other glycinergic amacrine cells to reduce surround extent and magnitude while also reducing distal GABAergic inputs in the far surround. The second is a decrease in spontaneous noise leading to more excitable OFF bipolar cells in bright environments (Mazade & Eggers, Reference Mazade and Eggers2016; Mazade et al., Reference Mazade, Flood and Eggers2019b). Overall, the results of this study suggest that while dopamine signaling through D1 receptors is a prominent component in mediating OFF pathway light-adapted changes, other factors must also contribute to achieve the complete light-adapted reduction in receptive field surround. Light adaptation causes a shift from rod-dominant to cone-dominant pathways, can activate additional dopamine receptors (Cohen et al., Reference Cohen, Todd, Harmon and O’Malley1992; Nguyen-Legros et al., Reference Nguyen-Legros, Versaux-Botteri and Vernier1999; Li et al., Reference Li, Zhang, Blackburn, Wang, Ribelayga and O’Brien2013), and can cause the release of other retinal neuromodulators such as nitric oxide (Neal et al., Reference Neal, Cunningham and Matthews1998). Therefore, activation of D1 receptors may be only one part of increasing visual acuity through light (Wilcox, Reference Wilcox1932), at least at the level of inner retinal signal processing.
Acknowledgments
Disclosures: The authors declare no conflicts of interest regarding the present study.
Grants: This work was supported by NSF-1552184 (EDE), Army Research Office W911NF-15-1-0613 (EDE), the University of Arizona Office of Research and Discovery, Faculty Seed Grant (EDE), National Eye Institute Grant R01-EY-026027 (EDE), the ARCS Foundation (REM), and the University of Arizona Graduate and Professional Student Council Research and Project Grant (REM).
Acknowledgments: We thank the members of the Eggers laboratory for helpful comments.
Author Contributions: REM performed experiments, analyzed data, and prepared figures. REM and EDE wrote and edited the manuscript.


