

1. Introduction
In the classical compound Poisson insurance risk model, the baseline (i.e., without dividends) surplus process
 $$\{ U(t)\} _{{t\geq 0}} $$
of the insurer is modelled as
$$\{ U(t)\} _{{t\geq 0}} $$
of the insurer is modelled as
 $$U(t)=u{\plus}ct\,{\minus}\,S(t),\,\,\,\,\,t\geq 0$$
where u=U(0)≥0 is the initial surplus, c>0 the incoming premium rate per unit time, and
 $$\{ S(t)\} _{{t\geq 0}} $$
the aggregate claims process. Specifically, the aggregate claim amount until time t is given by
$$\{ S(t)\} _{{t\geq 0}} $$
the aggregate claims process. Specifically, the aggregate claim amount until time t is given by
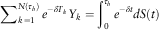
 $$S(t)=\mathop{\sum}\nolimits_{k=1}^{N(t)} Y_{k} $$
, where
$$S(t)=\mathop{\sum}\nolimits_{k=1}^{N(t)} Y_{k} $$
, where
 $$\{ N(t)\} _{{t\geq 0}} $$
is a Poisson process with rate λ>0, and
$$\{ N(t)\} _{{t\geq 0}} $$
is a Poisson process with rate λ>0, and
 $$\{ Y_{k} \} _{{k=1}}^{\infty} $$
a sequence of independent and identically distributed positive continuous random variables representing the individual claim amounts. Moreover, it is assumed that
$$\{ Y_{k} \} _{{k=1}}^{\infty} $$
a sequence of independent and identically distributed positive continuous random variables representing the individual claim amounts. Moreover, it is assumed that
 $$\{ N(t)\} _{{t\geq 0}} $$
and
$$\{ N(t)\} _{{t\geq 0}} $$
and
 $$\{ Y_{k} \} _{{k\,=\,1}}^{\infty} $$
are independent. For later use, the common probability density function of the random variables
$$\{ Y_{k} \} _{{k\,=\,1}}^{\infty} $$
are independent. For later use, the common probability density function of the random variables
 $$\{ Y_{k} \} _{{k\,=\,1}}^{\infty} $$
is denoted by p(·) and its Laplace transform is
$$\{ Y_{k} \} _{{k\,=\,1}}^{\infty} $$
is denoted by p(·) and its Laplace transform is
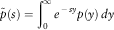 $\tilde{p}(s)=\mathop{\int}\nolimits_0^\infty {e^{{\,{\minus}\,sy}} p(y)\, dy} $
.
$\tilde{p}(s)=\mathop{\int}\nolimits_0^\infty {e^{{\,{\minus}\,sy}} p(y)\, dy} $
.
The seminal paper by de Finetti (Reference de Finetti1957) suggested that the insurer should redistribute some of its surplus to its shareholders, leading to extensive study of dividend strategies in various insurance risk models (see e.g., Albrecher & Thonhauser, Reference Albrecher and Thonhauser2009; Avanzi, Reference Avanzi2009 for reviews). The most commonly studied dividend strategy in the literature is the barrier strategy (e.g., Gerber, Reference Gerber1979) in which any excess of the surplus over a fixed barrier is immediately paid to the shareholders as dividends. Although such a strategy is optimal as far as the maximisation of the expected discounted dividends until ruin is concerned when p(·) is completely monotone (e.g., Loeffen, Reference Lu and Li2008, theorem 3), it results in an ultimate ruin probability of one which is practically undesirable. In this paper, we shall impose a threshold dividend strategy (e.g., Gerber & Shiu, Reference Gerber and Shiu2006; Lin & Pavlova, Reference Lin and Pavlova2006) to the surplus process (1.1), so that part of the incoming premium rate is paid as dividends whenever the insurer’s surplus exceeds a fixed threshold level b>0. Denoting the dividend rate by α>0 and the premium rate by c
1=c, the net premium rate is c
2=c
1−α when the surplus is above b. Therefore, the modified risk process
 $$\{ U_{b} (t)\} _{{t\geq 0}} $$
under the above threshold strategy follows the dynamics:
$$\{ U_{b} (t)\} _{{t\geq 0}} $$
under the above threshold strategy follows the dynamics:
 $$dU_{b} (t)=\left\{ {\matrix{ {c_{1} \, dt\,{\minus}\,dS(t),} \hfill & {U_{b} (t)\,\lt \, b} \hfill \cr {c_{2} \, dt\,{\minus}\,dS(t),} \hfill & {U_{b} (t)\, \geq \, b} \hfill \cr } } \right.$$
and the initial surplus is given by
 $$u=U_{b} (0)\, \geq \, 0$$
. The time of ruin of
$$u=U_{b} (0)\, \geq \, 0$$
. The time of ruin of
 $$\{ U_{b} (t)\} _{{t\, \geq \, 0}} $$
is defined to be
$$\{ U_{b} (t)\} _{{t\, \geq \, 0}} $$
is defined to be
 $\tau _{b} ={\rm inf}\{ t\, \geq \, 0\,:\,U_{b} (t)\,\lt \, 0\} $
with the convention that
$\tau _{b} ={\rm inf}\{ t\, \geq \, 0\,:\,U_{b} (t)\,\lt \, 0\} $
with the convention that
 $\tau _{b} ={\rm inf}\,\emptyset =\infty$
if
$\tau _{b} ={\rm inf}\,\emptyset =\infty$
if
 $$U_{b} (t)\geq 0$$
for all t≥0. Then, the ruin probability is given by
$$U_{b} (t)\geq 0$$
for all t≥0. Then, the ruin probability is given by
 $\psi (u;b)={\rm Pr}\{ \tau _{b} \,\lt \, \infty\!\! \mid\! \!U_{b} (0)=u\} $
. The positive security loading condition c
2>λE[Y
1] is assumed to ensure that
$\psi (u;b)={\rm Pr}\{ \tau _{b} \,\lt \, \infty\!\! \mid\! \!U_{b} (0)=u\} $
. The positive security loading condition c
2>λE[Y
1] is assumed to ensure that
 $\psi (u;b)\,\lt \, 1$
for all u≥0 (e.g., Kyprianou, Reference Kyprianou2013, corollary 8.5). Note that D(t)=U(t)−U
b
(t) is the total dividends paid until time t. An important quantity of interest is the total discounted dividends until ruin, as it represents the value of firm in corporate finance. In the present context, it is defined by
$\psi (u;b)\,\lt \, 1$
for all u≥0 (e.g., Kyprianou, Reference Kyprianou2013, corollary 8.5). Note that D(t)=U(t)−U
b
(t) is the total dividends paid until time t. An important quantity of interest is the total discounted dividends until ruin, as it represents the value of firm in corporate finance. In the present context, it is defined by
 $$D_{\delta } (\tau _{b} )=\mathop{\int}\nolimits_0^{\tau _{b} } {e^{{{\minus}\delta s}} \:dD(s)=\alpha \mathop{\int}\nolimits_0^{\tau _{b} } {e^{{{\minus}\delta s}} 1_{{\{ U_{b} (s)\, \geq \, b\} }} \,ds} } $$
where δ>0 is the force of interest and 1
A
the indicator function of the event A. When each claim amount Y
k
is exponentially distributed, Gerber & Shiu (Reference Gerber and Shiu2006, section 9) showed that the threshold strategy is optimal in maximising the expected discounted dividends until ruin for restricted dividend rate. Given a threshold strategy, Dickson & Drekic (Reference Dickson and Drekic2006) analysed the optimal pair of threshold level and dividend rate that maximises the expectation of
 $D_{\delta } (\tau _{b} )$
under a ruin probability constraint, whereas Cheung et al. (Reference Cheung and Woo2008) derived the higher moments of
$D_{\delta } (\tau _{b} )$
under a ruin probability constraint, whereas Cheung et al. (Reference Cheung and Woo2008) derived the higher moments of
 $$D_{\delta } (\tau _{b} )$$
and computed the optimal threshold minimising the coefficient of variation of
$$D_{\delta } (\tau _{b} )$$
and computed the optimal threshold minimising the coefficient of variation of
 $D_{\delta } (\tau _{b} )$
.
$D_{\delta } (\tau _{b} )$
.
Apart from
 $D_{\delta } (\tau _{b} )$
, which is the total discounted payment made by the insurance company to its shareholders, another quantity of interest is the aggregate discounted claim amount payable to the policyholders until ruin, namely
$D_{\delta } (\tau _{b} )$
, which is the total discounted payment made by the insurance company to its shareholders, another quantity of interest is the aggregate discounted claim amount payable to the policyholders until ruin, namely
 $\mathop{\int}\nolimits_0^{\tau _{b} } {e^{{{\minus} \delta t}} \:dS(t)} $
, where δ>0 is the force of interest. More generally, one may consider the aggregate discounted claim costs until ruin defined by
$\mathop{\int}\nolimits_0^{\tau _{b} } {e^{{{\minus} \delta t}} \:dS(t)} $
, where δ>0 is the force of interest. More generally, one may consider the aggregate discounted claim costs until ruin defined by
 $$Z_{\delta } (\tau _{b} )=\mathop{\sum}\limits_{k\,=\,1}^{N(\tau _{b} )} {e^{{{\minus} \delta T_{k} }} f(Y_{k} )} $$
where T
k
is the time of the kth claim (which is the kth arrival time of the Poisson process
 $$\{ N(t)\} _{{t\, \geq \, 0}} $$
), and f(·) is a non-negative “cost function” applied to each claim. Clearly, if f(y)=y then
$$\{ N(t)\} _{{t\, \geq \, 0}} $$
), and f(·) is a non-negative “cost function” applied to each claim. Clearly, if f(y)=y then
 $Z_{\delta } (\tau _{b} )$
becomes
$Z_{\delta } (\tau _{b} )$
becomes
 $\mathop{\sum}\nolimits_{k\,=1\,}^{N(\tau _{b} )} {e^{{{\minus} \delta T_{k} }} Y_{k} } =\mathop{\int}\nolimits_0^{\tau _{b} } {e^{{{\minus} \delta t}} \:dS(t)} $
. We remark that the aggregate discounted claim amount here is different from the one considered by e.g. Taylor (Reference Taylor1979), Willmot (Reference Willmot1989), Léveillé & Garrido (Reference Léveillé and Garrido2001), and Woo & Cheung (Reference Woo and Cheung2013), which is concerned with the aggregate until a fixed time t instead of the ruin time. The quantity
$\mathop{\sum}\nolimits_{k\,=1\,}^{N(\tau _{b} )} {e^{{{\minus} \delta T_{k} }} Y_{k} } =\mathop{\int}\nolimits_0^{\tau _{b} } {e^{{{\minus} \delta t}} \:dS(t)} $
. We remark that the aggregate discounted claim amount here is different from the one considered by e.g. Taylor (Reference Taylor1979), Willmot (Reference Willmot1989), Léveillé & Garrido (Reference Léveillé and Garrido2001), and Woo & Cheung (Reference Woo and Cheung2013), which is concerned with the aggregate until a fixed time t instead of the ruin time. The quantity
 $Z_{\delta } (\tau _{b} )$
in (1.3) has gained some attention in recent years (in models without dividends, i.e., α=0). For example, the expectation of
$Z_{\delta } (\tau _{b} )$
in (1.3) has gained some attention in recent years (in models without dividends, i.e., α=0). For example, the expectation of
 $$Z_{\delta } (\tau _{b} )$$
was studied by Cai et al. (Reference Cai, Feng and Willmot2009, section 6) and Feng (2009
Reference Fenga
, section 4.2, 2009
Reference Fengb
, section 5.2) in the compound Poisson and phase-type renewal risk models, whereas Cheung & Feng (Reference Cheung, Dickson and Drekic2013) analysed the higher moments of
$$Z_{\delta } (\tau _{b} )$$
was studied by Cai et al. (Reference Cai, Feng and Willmot2009, section 6) and Feng (2009
Reference Fenga
, section 4.2, 2009
Reference Fengb
, section 5.2) in the compound Poisson and phase-type renewal risk models, whereas Cheung & Feng (Reference Cheung, Dickson and Drekic2013) analysed the higher moments of
 $$Z_{\delta } (\tau _{b} )$$
in a Markovian arrival process.
$$Z_{\delta } (\tau _{b} )$$
in a Markovian arrival process.
In addition to the discounted dividends, the Gerber–Shiu expected discounted penalty function has also been widely studied in insurance risk theory since the seminal paper by Gerber & Shiu (Reference Gerber and Shiu1998) was published. In the present model, it is defined by
 $$\phi _{\delta } (u;b)=E[e^{{{\minus} \delta \tau _{b} }} w(U_{b} (\tau _{b}^{\,{\minus}\,} ),\, \mid \! \! U_{b} (\tau _{b} ) \! \! \mid )1_{{\{ \tau _{b} \,\lt \, \infty\} }} \!\! \mid \! \!U_{b} (0)=u],\,\,\,\,\,u\, \geq \, 0$$
where δ≥0 can be regarded as the force of interest or the Laplace transform argument with respect to the time of ruin
 $\tau _{b} $
, and w(·, ·) is a non-negative “penalty” as a function of the surplus immediately before ruin
$\tau _{b} $
, and w(·, ·) is a non-negative “penalty” as a function of the surplus immediately before ruin
 $U_{b} (\tau _{b}^{\,{\minus}\,} )$
and the deficit at ruin
$U_{b} (\tau _{b}^{\,{\minus}\,} )$
and the deficit at ruin
 $ \! \! \mid \! \! U_{b} (\tau _{b} ) \! \! \mid $
. Typically, w(·, ·) is assumed to satisfy some mild integrability conditions. While the Gerber–Shiu function (1.4) was studied by Lin & Pavlova (Reference Lin and Pavlova2006), some related results on the corresponding discounted densities were given by Zhou (Reference Zhou2004, section 4). Interested readers are referred to e.g. Albrecher et al. (Reference Albrecher, Hartinger and Thonhauser2007, section 2), Badescu et al. (2007
Reference Badescu, Drekic and Landriaulta
), Zhu & Yang (Reference Zhu and Yang2008), Lu & Li (Reference Loeffen2009), and Kyprianou & Loeffen (Reference Kyprianou and Loeffen2010) for the analysis of the discounted dividends and the Gerber–Shiu function in more general processes such as the generalised Erlang(n) renewal model, risk model with Markovian claim arrivals, and the Lévy insurance risk process. We also remark that a more general multi-threshold dividend strategy was also considered by e.g. Albrecher & Hartinger (Reference Albrecher and Hartinger2007), Badescu et al. (2007
Reference Badescu, Drekic and Landriaultb
), and Lin & Sendova (Reference Lin and Sendova2008).
$ \! \! \mid \! \! U_{b} (\tau _{b} ) \! \! \mid $
. Typically, w(·, ·) is assumed to satisfy some mild integrability conditions. While the Gerber–Shiu function (1.4) was studied by Lin & Pavlova (Reference Lin and Pavlova2006), some related results on the corresponding discounted densities were given by Zhou (Reference Zhou2004, section 4). Interested readers are referred to e.g. Albrecher et al. (Reference Albrecher, Hartinger and Thonhauser2007, section 2), Badescu et al. (2007
Reference Badescu, Drekic and Landriaulta
), Zhu & Yang (Reference Zhu and Yang2008), Lu & Li (Reference Loeffen2009), and Kyprianou & Loeffen (Reference Kyprianou and Loeffen2010) for the analysis of the discounted dividends and the Gerber–Shiu function in more general processes such as the generalised Erlang(n) renewal model, risk model with Markovian claim arrivals, and the Lévy insurance risk process. We also remark that a more general multi-threshold dividend strategy was also considered by e.g. Albrecher & Hartinger (Reference Albrecher and Hartinger2007), Badescu et al. (2007
Reference Badescu, Drekic and Landriaultb
), and Lin & Sendova (Reference Lin and Sendova2008).
In almost all works in the literature, the analyses of the discounted dividends (1.2), the aggregate discounted claim costs (1.3) and (the random variables in) the Gerber–Shiu function (1.4) were performed separately. Therefore, Cheung et al. (Reference Cheung, Liu and Woo2015) proposed an extended version of the Gerber–Shiu function defined as
 $$\eqalignno{ \phi _{{\delta _{1} ,\delta _{2} ,\delta _{3} ,n,m}} (u;\,b)&=\,\phi _{{\delta _{{123}} ,n,m}} (u;b)\cr& =E[e^{{{\minus} \delta _{1} \tau _{b} }} D_{{\delta _{2} }}^{n} (\tau _{b} )Z_{{\delta _{3} }}^{m} (\tau _{b} )w(U_{b} (\tau _{b}^{\,{\minus}\,} ), \! \mid \! \! U_{b} (\tau _{b} ) \!\! \mid \! \, )1_{{\{ \tau _{b} \,\lt \, \infty\} }} \! \mid \! \! U_{b} (0)=u],\,\,\,\,\,u\, \geq \, 0$$
where
 $$n,m\in {\Bbb N}$$
(with
$$n,m\in {\Bbb N}$$
(with
 $${\Bbb N}$$
being the set of non-negative integers) are the orders of moments of
$${\Bbb N}$$
being the set of non-negative integers) are the orders of moments of
 $D_{{\delta _{2} }} (\tau _{b} )$
and
$D_{{\delta _{2} }} (\tau _{b} )$
and
 $Z_{{\delta _{3} }} (\tau _{b} )$
. It is assumed that the cost function f(·) satisfies some mild integrability conditions (see Lemmas 2 and 3). Moreover, we assume δ
1≥0, while δ
2, δ
3>0 are possibly different forces of interest used to discount dividends and claims for the shareholders and policyholders, respectively. Note that the indicator function
$Z_{{\delta _{3} }} (\tau _{b} )$
. It is assumed that the cost function f(·) satisfies some mild integrability conditions (see Lemmas 2 and 3). Moreover, we assume δ
1≥0, while δ
2, δ
3>0 are possibly different forces of interest used to discount dividends and claims for the shareholders and policyholders, respectively. Note that the indicator function
 $$1_{{\{ \tau _{b} \,\lt \, \infty\} }} $$
does not appear in Cheung et al.’s (Reference Cheung, Liu and Woo2015) definition since they considered a dividend barrier strategy for which ruin occurs almost surely (a.s.). For notational convenience, we shall use the abbreviation
$$1_{{\{ \tau _{b} \,\lt \, \infty\} }} $$
does not appear in Cheung et al.’s (Reference Cheung, Liu and Woo2015) definition since they considered a dividend barrier strategy for which ruin occurs almost surely (a.s.). For notational convenience, we shall use the abbreviation
 $\phi _{{\delta _{{123}} ,n,m}} (u;b)$
for
$\phi _{{\delta _{{123}} ,n,m}} (u;b)$
for
 $$\phi _{{\delta _{1} ,\delta _{2} ,\delta _{3} ,n,m}} (u;b)$$
when it does not cause any confusion. Obviously, if n=m=0 then
$$\phi _{{\delta _{1} ,\delta _{2} ,\delta _{3} ,n,m}} (u;b)$$
when it does not cause any confusion. Obviously, if n=m=0 then
 $\phi _{{\delta _{{123}} ,0,0}} (u;b)=\phi _{{\delta _{1} }} (u;b)$
reduces to the classical Gerber–Shiu function defined in (1.4). Under a compound Poisson risk model with a dividend barrier, Cheung et al. (Reference Cheung, Liu and Woo2015) applied
$\phi _{{\delta _{{123}} ,0,0}} (u;b)=\phi _{{\delta _{1} }} (u;b)$
reduces to the classical Gerber–Shiu function defined in (1.4). Under a compound Poisson risk model with a dividend barrier, Cheung et al. (Reference Cheung, Liu and Woo2015) applied
 $$\phi _{{\delta _{{123}} ,n,m}} (u;b)$$
to find various covariance measures between ruin-related quantities such as the discounted dividends until ruin and the aggregate discounted claims until ruin. Through some numerical examples, they demonstrated that the covariance between the above two random variables may take positive or negative value and gave some interpretations as well. The motivation for calculating the above covariance (or the resulting correlation) is as follows. Because the payments to the policyholders (claims) and the shareholders (dividends) both come from the same source, namely the insurer’s surplus, it is interesting to see whether the discounted dividends and the aggregate discounted claims tend to move in the same or opposite direction. A high positive correlation indicates that the needs of the two groups could indeed be satisfied at the same time, but a negative correlation may suggest conflicting interests between the two groups. We remark that Gerber–Shiu-type functions resembling (1.5) were also introduced and analysed by Cheung (Reference Cheung2013) and Cheung & Woo (Reference Cheung and Feng2016) in the absence of dividends. While the former contribution considered (1.5) where n=0, δ
1=kδ
3 for some
$$\phi _{{\delta _{{123}} ,n,m}} (u;b)$$
to find various covariance measures between ruin-related quantities such as the discounted dividends until ruin and the aggregate discounted claims until ruin. Through some numerical examples, they demonstrated that the covariance between the above two random variables may take positive or negative value and gave some interpretations as well. The motivation for calculating the above covariance (or the resulting correlation) is as follows. Because the payments to the policyholders (claims) and the shareholders (dividends) both come from the same source, namely the insurer’s surplus, it is interesting to see whether the discounted dividends and the aggregate discounted claims tend to move in the same or opposite direction. A high positive correlation indicates that the needs of the two groups could indeed be satisfied at the same time, but a negative correlation may suggest conflicting interests between the two groups. We remark that Gerber–Shiu-type functions resembling (1.5) were also introduced and analysed by Cheung (Reference Cheung2013) and Cheung & Woo (Reference Cheung and Feng2016) in the absence of dividends. While the former contribution considered (1.5) where n=0, δ
1=kδ
3 for some
 $$k\in {\Bbb N}$$
and the penalty w only depends on the deficit in renewal risk models with general interclaim times and exponential claims, the latter looked at (1.5), where n=0 and w further depends on the surplus immediately after the second last claim before ruin in the dependent Sparre Andersen risk model. The latter work was also extended to a discrete time framework by Woo & Liu (Reference Woo and Liu2014).
$$k\in {\Bbb N}$$
and the penalty w only depends on the deficit in renewal risk models with general interclaim times and exponential claims, the latter looked at (1.5), where n=0 and w further depends on the surplus immediately after the second last claim before ruin in the dependent Sparre Andersen risk model. The latter work was also extended to a discrete time framework by Woo & Liu (Reference Woo and Liu2014).
It is instructive to note that the Gerber–Shiu function (1.5) only takes into account the sample paths of
 $$\{ U_{b} (t)\} _{{t\, \geq \, 0}} $$
for which ruin occurs. Under the loading condition c
2>λE[Y
1], the process
$$\{ U_{b} (t)\} _{{t\, \geq \, 0}} $$
for which ruin occurs. Under the loading condition c
2>λE[Y
1], the process
 $$\{ U_{b} (t)\} _{{t\, \geq \, 0}} $$
has a positive survival probability. For these sample paths where
$$\{ U_{b} (t)\} _{{t\, \geq \, 0}} $$
has a positive survival probability. For these sample paths where
 $$\{ U_{b} (t)\} _{{t\, \geq \, 0}} $$
survives forever (i.e.,
$$\{ U_{b} (t)\} _{{t\, \geq \, 0}} $$
survives forever (i.e.,
 $\tau _{b} =\infty$
), the discounted dividends
$\tau _{b} =\infty$
), the discounted dividends
 $D_{{\delta _{2} }} (\tau _{b} )$
and the aggregate discounted claim costs
$D_{{\delta _{2} }} (\tau _{b} )$
and the aggregate discounted claim costs
 $Z_{{\delta _{3} }} (\tau _{b} )$
are still defined although
$Z_{{\delta _{3} }} (\tau _{b} )$
are still defined although
 $U_{b} (\tau _{b}^{\,{\minus}\,} )$
and
$U_{b} (\tau _{b}^{\,{\minus}\,} )$
and
 $ \! \mid \! \! U_{b} (\tau _{b} ) \! \! \mid \! $
are not. Therefore, we will also analyse the joint moments of
$ \! \mid \! \! U_{b} (\tau _{b} ) \! \! \mid \! $
are not. Therefore, we will also analyse the joint moments of
 $D_{{\delta _{2} }} (\tau _{b} )$
and
$D_{{\delta _{2} }} (\tau _{b} )$
and
 $Z_{{\delta _{3} }} (\tau _{b} )$
without ruin occurring via
$Z_{{\delta _{3} }} (\tau _{b} )$
without ruin occurring via
 $$\varphi _{{\delta _{2} ,\delta _{3} ,n,m}} (u;b)=\varphi _{{\delta _{{23}} ,n,m}} (u;b)=E[D_{{\delta _{2} }}^{n} (\tau _{b} )Z_{{\delta _{3} }}^{m} (\tau _{b} )1_{{\{ \tau _{b}\, =\, \infty\} }} \! \! \mid \! \! U_{b} (0)=u],\,\,\,\,\,u\, \geq \, 0$$
where
 $$n,m\in {\Bbb N}$$
and δ
2, δ
3>0. Note that the usual joint moments for all sample paths can readily be obtained as
$$n,m\in {\Bbb N}$$
and δ
2, δ
3>0. Note that the usual joint moments for all sample paths can readily be obtained as
 $$E[D_{{\delta _{2} }}^{n} (\tau _{b} )Z_{{\delta _{3} }}^{m} (\tau _{b} ) \! \! \mid \! \! U_{b} (0)=u]=\phi _{{\delta _{{123}}\! ,n,m}} (u;b) \!\! \mid _{{\delta _{1}\, =\, 0,\,w\,\equiv\,1}} {\plus}\varphi _{{\delta _{{23}} ,n,m}} (u;b)$$
This paper is organised as follows. In section 2, the integro-differential equations (IDEs) for
 $\phi _{{\delta _{{123}} ,n,m}} (u;b)$
and
$\phi _{{\delta _{{123}} ,n,m}} (u;b)$
and
 $$\varphi _{{\delta _{{23}} ,n,m}} (u;b)$$
as well as the corresponding continuity conditions and limiting behaviours as u→∞ are given. Under the assumption that each individual claim is distributed as a combination of exponentials, section 3 provides some explicit expressions for
$$\varphi _{{\delta _{{23}} ,n,m}} (u;b)$$
as well as the corresponding continuity conditions and limiting behaviours as u→∞ are given. Under the assumption that each individual claim is distributed as a combination of exponentials, section 3 provides some explicit expressions for
 $\phi _{{\delta _{{123}} ,n,m}} (u;b)$
and
$\phi _{{\delta _{{123}} ,n,m}} (u;b)$
and
 $\varphi _{{\delta _{{23}} ,n,m}} (u;b)$
when f(y)=y and w(x,y) depends on the deficit argument y but not x. Because the derivation of the IDEs and the procedure towards the exact solutions are quite standard but require tedious and careful calculations, only the main results are stated in sections 2 and 3 with the details of the proofs provided in the Appendix. Section 4 is concerned with some numerical illustrations in which we compute the correlation between the discounted dividends and the aggregate discounted claims separately for the cases of ruin and survival. For the case where ruin occurs, the correlations between the time of ruin and the above two quantities are also given. Probabilistic interpretations follow as well. Section 5 ends the paper with some concluding remarks.
$\varphi _{{\delta _{{23}} ,n,m}} (u;b)$
when f(y)=y and w(x,y) depends on the deficit argument y but not x. Because the derivation of the IDEs and the procedure towards the exact solutions are quite standard but require tedious and careful calculations, only the main results are stated in sections 2 and 3 with the details of the proofs provided in the Appendix. Section 4 is concerned with some numerical illustrations in which we compute the correlation between the discounted dividends and the aggregate discounted claims separately for the cases of ruin and survival. For the case where ruin occurs, the correlations between the time of ruin and the above two quantities are also given. Probabilistic interpretations follow as well. Section 5 ends the paper with some concluding remarks.
2. General Results
Due to the presence of the dividend threshold b, the IDEs in u satisfied by
 $\phi _{{\delta _{{123}} ,n,m}} (u;b)$
are different depending on whether 0≤u<b or u≥b (and hence the solution forms will also be different as in section 3). Therefore, we shall denote
$\phi _{{\delta _{{123}} ,n,m}} (u;b)$
are different depending on whether 0≤u<b or u≥b (and hence the solution forms will also be different as in section 3). Therefore, we shall denote
 $\phi _{{\delta _{{123}} ,n,m}} (u;b)$
by
$\phi _{{\delta _{{123}} ,n,m}} (u;b)$
by
 $\phi _{{L,\delta _{{123}} ,n,m}} (u;b)$
for 0≤u<b and
$\phi _{{L,\delta _{{123}} ,n,m}} (u;b)$
for 0≤u<b and
 $\phi _{{U,\delta _{{123}} ,n,m}} (u;b)$
for u≥b, where “L” and “U” stand for “Lower” and “Upper” layers, respectively. Furthermore, we shall use
$\phi _{{U,\delta _{{123}} ,n,m}} (u;b)$
for u≥b, where “L” and “U” stand for “Lower” and “Upper” layers, respectively. Furthermore, we shall use
 $\phi '_{{\delta _{{123}} ,n,m}} (u;b)=(d/du)\phi _{{\delta _{{123}} ,n,m}} (u;b)$
to denote the derivative of
$\phi '_{{\delta _{{123}} ,n,m}} (u;b)=(d/du)\phi _{{\delta _{{123}} ,n,m}} (u;b)$
to denote the derivative of
 $\phi _{{\delta _{{123}} ,n,m}} (u;b)$
with respect to the first argument u. Similar notations will be applied to
$\phi _{{\delta _{{123}} ,n,m}} (u;b)$
with respect to the first argument u. Similar notations will be applied to
 $\varphi _{{\delta _{{23}} ,n,m}} (u;b)$
and other related functions as well. The proofs of the theorems and lemmas in this section are given in the Appendix.
$\varphi _{{\delta _{{23}} ,n,m}} (u;b)$
and other related functions as well. The proofs of the theorems and lemmas in this section are given in the Appendix.
2.1. IDEs and continuity condition for
 $\phi _{{\delta _{{123}} ,n,m}} (u;b)$
when
$n \, = \, 0$
$\phi _{{\delta _{{123}} ,n,m}} (u;b)$
when
$n \, = \, 0$


First, we consider
 $\phi _{{\delta _{{123}} ,0,m}} (u;b)$
(i.e., n=0) so that the dividend component
$\phi _{{\delta _{{123}} ,0,m}} (u;b)$
(i.e., n=0) so that the dividend component
 $D_{{\delta _{2} }} (\tau _{b} )$
does not appear in the definition (1.5). For notational convenience, we write
$D_{{\delta _{2} }} (\tau _{b} )$
does not appear in the definition (1.5). For notational convenience, we write
 $$\hskip -3pt \phi _{{\delta _{{13}} ,m}} (u;b)=\phi _{{\delta _{{123}} ,0,m}} (u;b)=E[e^{{{\minus} \delta _{1} \tau _{b} }} Z_{{\delta _{3} }}^{m} (\tau _{b} )w(U_{b} (\tau _{b}^{\,{\minus}\,} ),\! \mid \! \! U_{b} (\tau _{b} )\! \! \mid \! )1_{{\{ \tau _{b} \,\lt \, \infty\} }} \! \! \mid \! \! U_{b} (0)=u],\,\,\,u\, \geq \, 0$$
The IDEs and continuity condition for
 $\phi _{{\delta _{{13}} ,m}} (u;b)$
are stated in the following theorem, where
$\phi _{{\delta _{{13}} ,m}} (u;b)$
are stated in the following theorem, where
 $\phi _{{\delta _{{13}} ,m}} (u;b)=\phi _{{L,\delta _{{13}} ,m}} (u;b)$
for 0≤u<b and
$\phi _{{\delta _{{13}} ,m}} (u;b)=\phi _{{L,\delta _{{13}} ,m}} (u;b)$
for 0≤u<b and
 $\phi _{{\delta _{{13}} ,m}} (u;b)=\phi _{{U,\delta _{{13}} ,m}} (u;b)$
for u≥b according to our afore-mentioned convention.
$\phi _{{\delta _{{13}} ,m}} (u;b)=\phi _{{U,\delta _{{13}} ,m}} (u;b)$
for u≥b according to our afore-mentioned convention.
Theorem 1
For
 $$m\in {\Bbb N}$$
, the Gerber–Shiu function
$$m\in {\Bbb N}$$
, the Gerber–Shiu function
 $\phi _{{\delta _{{13}} ,m}} (u;b)$
in (2.1) satisfies the IDEs, for 0<u<b
$\phi _{{\delta _{{13}} ,m}} (u;b)$
in (2.1) satisfies the IDEs, for 0<u<b
 $$\eqalignno{ & c_{1} \phi '_{{L,\delta _{{13}} ,m}} (u;b)\,{\minus}\,(\lambda {\plus}\delta _{1} {\plus}m\delta _{3} )\phi _{{L,\delta _{{13}} ,m}} (u;b){\plus}\lambda \mathop{\sum}\limits_{i=0}^m {\left( {\matrix{ m \cr i \cr } } \right)\mathop{\int}\nolimits_0^u {f^{{m\,{\minus}\,i}} (y)\phi _{{L,\delta _{{13}} ,i}} (u\,{\minus}\,y;b)p(y)\, dy} } \cr & \quad {\plus}\lambda \mathop{\int}\nolimits_u^\infty {f^{m} (y)w(u,y\,{\minus}\,u)p(y)\, dy=0} $$
and for u>b
 $$\eqalignno{ & c_{2} \phi '_{{U,\delta _{{13}} ,m}} (u;b)\,{\minus}\,(\lambda {\plus}\delta _{1} {\plus}m\delta _{3} )\phi _{{U,\delta _{{13}} ,m}} (u;b){\plus}\lambda \mathop{\sum}\limits_{i=0}^m {\left( {\matrix{ m \cr i \cr } } \right)} \mathop{\int}\nolimits_0^{u\,{\minus}\,b} {f^{{m\,{\minus}\,i}} (y)\phi _{{U\!,\delta _{{13}}\! ,i}} (u\,{\minus}\,y;b)p(y)\, dy} \cr & \quad {\plus}\lambda \mathop{\sum}\limits_{i=0}^m {\left( {\matrix{ m \cr i \cr } } \right)} \mathop{\int}\nolimits_{u\,{\minus}\,b}^u {f^{{m\,{\minus}\,i}} (y)\phi _{{L,\delta _{{13}} ,i}} (u\,{\minus}\,y;b)p(y)\,dy} {\plus}\lambda \mathop{\int}\nolimits_u^\infty {f^{m} (y)w(u,y\,{\minus}\,u)p(y)\, dy=0} $$
In addition,
 $\phi _{{\delta _{{13}} ,m}} (u;b)$
is continuous at u=b, i.e.
$\phi _{{\delta _{{13}} ,m}} (u;b)$
is continuous at u=b, i.e.
 $$\phi _{{L,\delta _{{13}} ,m}} (b^{{\minus}\,} ;b)=\phi _{{U,\delta _{{13}} ,m}} (b^\!{{\plus}} ;b)$$
□
Remark 1
As
 $\phi _{{\delta _{{13}} ,m}} (u;b)$
reduces to the classical Gerber–Shiu function
$\phi _{{\delta _{{13}} ,m}} (u;b)$
reduces to the classical Gerber–Shiu function
 $$\phi _{{\delta _{1} }} (u;b)$$
when m=0, it is noted that the results in Lin & Pavlova (Reference Lin and Pavlova2006, theorem 3.1) can be retrieved from the above theorem by putting m=0. Note also that the determination of
$$\phi _{{\delta _{1} }} (u;b)$$
when m=0, it is noted that the results in Lin & Pavlova (Reference Lin and Pavlova2006, theorem 3.1) can be retrieved from the above theorem by putting m=0. Note also that the determination of
 $\phi _{{\delta _{{13}} ,m}} (u;b)$
is recursive in m, with the starting point given by
$\phi _{{\delta _{{13}} ,m}} (u;b)$
is recursive in m, with the starting point given by
 $\phi _{{\delta _{1} }} (u;b)$
. Assuming that the lower-order Gerber–Shiu functions
$\phi _{{\delta _{1} }} (u;b)$
. Assuming that the lower-order Gerber–Shiu functions
 $\phi _{{\delta _{{13}} ,i}} ( \cdot ;b)$
for i=0, 1, … , m−1 are known, it is observed that the IDE (2.3) involves both
$\phi _{{\delta _{{13}} ,i}} ( \cdot ;b)$
for i=0, 1, … , m−1 are known, it is observed that the IDE (2.3) involves both
 $\phi _{{L,\delta _{{13}} ,m}} ( \cdot ;b)$
in the lower layer and
$\phi _{{L,\delta _{{13}} ,m}} ( \cdot ;b)$
in the lower layer and
 $\phi _{{U,\delta _{{13}} ,m}} ( \cdot ;b)$
in the upper layer as unknown functions, while (2.2) only involves
$\phi _{{U,\delta _{{13}} ,m}} ( \cdot ;b)$
in the upper layer as unknown functions, while (2.2) only involves
 $\phi _{{L,\delta _{{13}} ,m}} ( \cdot ;b)$
. Therefore, the typical procedure is to first utilise (2.2) to determine the solution form of
$\phi _{{L,\delta _{{13}} ,m}} ( \cdot ;b)$
. Therefore, the typical procedure is to first utilise (2.2) to determine the solution form of
 $\phi _{{L,\delta _{{13}} ,m}} ( \cdot ;b)$
, and then attempt to find
$\phi _{{L,\delta _{{13}} ,m}} ( \cdot ;b)$
, and then attempt to find
 $\phi _{{U,\delta _{{13}} ,m}} ( \cdot ;b)$
in (2.3) by treating
$\phi _{{U,\delta _{{13}} ,m}} ( \cdot ;b)$
in (2.3) by treating
 $\phi _{{L,\delta _{{13}} ,m}} ( \cdot ;b)$
as known (see the proofs of theorems in section 3).□
$\phi _{{L,\delta _{{13}} ,m}} ( \cdot ;b)$
as known (see the proofs of theorems in section 3).□
Remark 2
Having established the continuity of
 $\phi _{{\delta _{{13}} ,i}} ( \cdot ;b)$
for
$\phi _{{\delta _{{13}} ,i}} ( \cdot ;b)$
for
 $$i\in {\Bbb N}$$
in the proof of Theorem 1, we observe from (2.2) that for each
$$i\in {\Bbb N}$$
in the proof of Theorem 1, we observe from (2.2) that for each
 $$m\in {\Bbb N}$$
the derivative
$$m\in {\Bbb N}$$
the derivative
 $\phi '_{{L,\delta _{{13}} ,m}} (u;b)$
is continuous in u in the layer 0<u<b if
$\phi '_{{L,\delta _{{13}} ,m}} (u;b)$
is continuous in u in the layer 0<u<b if
 $\mathop{\int}\nolimits_u^\infty {f^{m} (y)w(u,y\,{\minus}\,u)p(y)\, dy} $
is continuous in u. A sufficient condition for
$\mathop{\int}\nolimits_u^\infty {f^{m} (y)w(u,y\,{\minus}\,u)p(y)\, dy} $
is continuous in u. A sufficient condition for
 $\mathop{\int}\nolimits_u^\infty {f^{m} (y)w(u,y\,{\minus}\,u)p(y)\, dy} $
to be continuous in u is that the penalty w(·, ·) is a continuous function. For the same reason,
$\mathop{\int}\nolimits_u^\infty {f^{m} (y)w(u,y\,{\minus}\,u)p(y)\, dy} $
to be continuous in u is that the penalty w(·, ·) is a continuous function. For the same reason,
 $\phi '_{{U,\delta _{{13}} ,m}} (u;b)$
is continuous in u for u>b under the same sufficient condition. However, although
$\phi '_{{U,\delta _{{13}} ,m}} (u;b)$
is continuous in u for u>b under the same sufficient condition. However, although
 $\phi _{{\delta _{{13}} ,m}} (u;b)$
is continuous at u=b, the derivative
$\phi _{{\delta _{{13}} ,m}} (u;b)$
is continuous at u=b, the derivative
 $\phi '_{{\delta _{{13}} ,m}} (u;b)$
is generally not continuous at u=b. To see this, letting u→b
− in (2.2) and u→b
+ in (2.3) (assuming
$\phi '_{{\delta _{{13}} ,m}} (u;b)$
is generally not continuous at u=b. To see this, letting u→b
− in (2.2) and u→b
+ in (2.3) (assuming
 $\mathop{\int}\nolimits_u^\infty {f^{m} (y)w(u,y\,{\minus}\,u)p(y)\, dy} $
is continuous at u=b) and comparing the two equations gives rise to
$\mathop{\int}\nolimits_u^\infty {f^{m} (y)w(u,y\,{\minus}\,u)p(y)\, dy} $
is continuous at u=b) and comparing the two equations gives rise to
 $$c_{1} \phi '_{{L,\delta _{{13}} ,m}} (b^{{\minus}\,} ;b)=c_{2} \phi '_{{U,\delta _{{13}} ,m}} (b\!^{{\plus}} ;b)$$
which generalises the result at the end of section 3 in Lin & Pavlova (Reference Lin and Pavlova2006) (see also Gerber & Shiu, Reference Gerber and Shiu2006, equation (10.5)). Therefore,
 $\phi '_{{L,\delta _{{13}} ,m}} (b^{\,{\minus}\,} ;b)\,\ne\,\phi '_{{U,\delta _{{13}} ,m}} (b^{{\plus}} ;b)$
unless c
1=c
2 (or equivalently α=0).□
$\phi '_{{L,\delta _{{13}} ,m}} (b^{\,{\minus}\,} ;b)\,\ne\,\phi '_{{U,\delta _{{13}} ,m}} (b^{{\plus}} ;b)$
unless c
1=c
2 (or equivalently α=0).□
2.2. IDEs and continuity condition for
$\phi _{{\delta _{{123}} ,n,m}} (u;b)$
when
$$n\in {\Bbb N}^{{\plus}} $$


Next, we look at the Gerber–Shiu function
 $\phi _{{\delta _{{123}} ,n,m}} (u;b)$
defined in (1.5) when
$\phi _{{\delta _{{123}} ,n,m}} (u;b)$
defined in (1.5) when
 $$n\in {\Bbb N}^{{\plus}} $$
and
$$n\in {\Bbb N}^{{\plus}} $$
and
 $$m\in {\Bbb N}$$
(where
$$m\in {\Bbb N}$$
(where
 $${\Bbb N}^{\!{\plus}} $$
is the set of positive integers). The following theorem gives the associated IDEs and continuity condition.
$${\Bbb N}^{\!{\plus}} $$
is the set of positive integers). The following theorem gives the associated IDEs and continuity condition.
Theorem 2
For
 $$n\in {\Bbb N}^{\!{\plus}} $$
and
$$n\in {\Bbb N}^{\!{\plus}} $$
and
 $$m\in {\Bbb N}$$
, the Gerber–Shiu function
$$m\in {\Bbb N}$$
, the Gerber–Shiu function
 $\phi _{{\delta _{{123}} ,n,m}} (u;b)$
in (1.5) satisfies the IDEs, for 0<u<b
$\phi _{{\delta _{{123}} ,n,m}} (u;b)$
in (1.5) satisfies the IDEs, for 0<u<b
 $$\eqalignno{ &c_{1} \phi '_{{L,\delta _{{123}} ,n,m}} (u;b)\,{\minus}\,(\lambda {\plus}\delta _{1} {\plus}n\delta _{2} {\plus}m\delta _{3} )\phi _{{L,\delta _{{123}} ,n,m}} (u;b) \cr & \quad {\plus}\,\lambda \mathop{\sum}\limits_{i\,=\,0}^m {\left( {\matrix{ m \cr i \cr } } \right)} \mathop{\int}\nolimits_0^u {f^{{m\,{\minus}\,i}} (y)\phi _{{L,\delta _{{123}} ,n,i}} (u\,{\minus}\,y;b)p(y)\, dy=0} $$
and for u>b
 $$\eqalignno{ & c_{2} \phi '_{{U,\delta _{{123}} ,n,m}} (u;b)\,{\minus}\,(\lambda {\plus}\delta _{1} {\plus}n\delta _{2} {\plus}m\delta _{3} )\phi _{{U,\delta _{{123}} ,n,m}} (u;b){\plus}\alpha n\phi _{{U,\delta _{{123}} ,n\,{\minus}\,1,m}} (u;b) \cr & \quad{\plus}\,\lambda \mathop{\sum}\limits_{i\,=\,0}^m {\left( {\matrix{ m \cr i \cr } } \right)} \mathop{\int}\nolimits_0^{u\,{\minus}\,b} {f^{{m\,{\minus}\,i}} (y)\phi _{{U,\delta _{{123}} ,n,i}} (u\,{\minus}\,y;b)p(y)\, dy} \cr &\quad{\plus}\,\lambda \mathop{\sum}\limits_{i\,=\,0}^m {\left( {\matrix{ m \cr i \cr } } \right)} \mathop{\int}\nolimits_{u\,{\minus}\,b}^u {f^{{m\,{\minus}\,i}} (y)\phi _{{L,\delta _{{123}} ,n,i}} (u\,{\minus}\,y;b)p(y)\, dy=0} $$
In addition,
 $\phi _{{\delta _{{123}} ,n,m}} (u;b)$
is continuous at u=b, i.e.
$\phi _{{\delta _{{123}} ,n,m}} (u;b)$
is continuous at u=b, i.e.
 $$\phi _{{L,\delta _{{123}} ,n,m}} (b^{\,{\minus}\,} ;b)=\phi _{{U,\delta _{{123}} ,n,m}} (b\!^{{\plus}} ;b)$$
□
Remark 3
It is instructive to note from (2.5) and (2.6) that one requires a double recursion in both n and m to determine
 $\phi _{{\delta _{{123}} ,n,m}} (u;b)$
(see similar comments in Remark 1 concerning
$\phi _{{\delta _{{123}} ,n,m}} (u;b)$
(see similar comments in Remark 1 concerning
 $\phi _{{\delta _{{13}} ,m}} (u;b)$
). Furthermore, in parallel to Remark 2 (assuming
$\phi _{{\delta _{{13}} ,m}} (u;b)$
). Furthermore, in parallel to Remark 2 (assuming
 $\mathop{\int}\nolimits_u^\infty {f^{m} (y)w(u,y\,{\minus}\,u)p(y)\, dy} $
is continuous at u=b) it is clear that, for
$\mathop{\int}\nolimits_u^\infty {f^{m} (y)w(u,y\,{\minus}\,u)p(y)\, dy} $
is continuous at u=b) it is clear that, for
 $$n\in {\Bbb N}^{\!{\plus}} $$
 $$c_{1} \phi '_{{L,\delta _{{123}} ,n,m}} (b^{{\minus}\,} ;b)=c_{2} \phi '_{{U,\delta _{{123}} ,n,m}} (b\!^{{\plus}} ;b){\plus}\alpha n\phi _{{U,\delta _{{123}} ,n\,{\minus}\,1,m}} (b;b)$$
i.e. the derivative of
 $\phi _{{\delta _{{123}} ,n,m}} (u;b)$
is not necessarily continuous at u=b.□
$\phi _{{\delta _{{123}} ,n,m}} (u;b)$
is not necessarily continuous at u=b.□
Remark 4
Note that the IDEs (2.2) and (2.5) for
 $\phi _{{\delta _{{123}} ,n,m}} (u;b)$
in the lower layer are the same as those in theorems 1 and 2 in Cheung et al. (Reference Cheung, Liu and Woo2015) concerning the dividend barrier strategy. This is because these IDEs are obtainable by considering an infinitesimal time interval, for which the dynamics of the surplus process are identical as no dividend is payable in the lower layer regardless of whether a barrier or a threshold strategy is implemented. Such an observation will allow us to reuse some of the intermediate results in Cheung et al. (Reference Cheung, Liu and Woo2015) in section 3.□
$\phi _{{\delta _{{123}} ,n,m}} (u;b)$
in the lower layer are the same as those in theorems 1 and 2 in Cheung et al. (Reference Cheung, Liu and Woo2015) concerning the dividend barrier strategy. This is because these IDEs are obtainable by considering an infinitesimal time interval, for which the dynamics of the surplus process are identical as no dividend is payable in the lower layer regardless of whether a barrier or a threshold strategy is implemented. Such an observation will allow us to reuse some of the intermediate results in Cheung et al. (Reference Cheung, Liu and Woo2015) in section 3.□
2.3. IDEs and continuity condition for
$\varphi _{{\delta _{{23}} ,n,m}} (u;b)$

In the next theorem, the IDEs and continuity condition concerning
 $\varphi _{{\delta _{{23}}\! ,n,m}} (u;b)$
(i.e., without ruin occurring) for
$\varphi _{{\delta _{{23}}\! ,n,m}} (u;b)$
(i.e., without ruin occurring) for
 $$n,m\in {\Bbb N}$$
will be provided. Because the dividend value
$$n,m\in {\Bbb N}$$
will be provided. Because the dividend value
 $D_{{\delta _{2} }} (\tau _{b} )$
cannot be 0 on the set
$D_{{\delta _{2} }} (\tau _{b} )$
cannot be 0 on the set
 $\{ \tau _{b} =\infty\} $
, here we do not need to separate the analysis into the cases n=0 or
$\{ \tau _{b} =\infty\} $
, here we do not need to separate the analysis into the cases n=0 or
 $$n\in {\Bbb N}^{\!{\plus}} $$
(unlike the Gerber–Shiu function
$$n\in {\Bbb N}^{\!{\plus}} $$
(unlike the Gerber–Shiu function
 $\phi _{{\delta _{{123}} ,n,m}} (u;b)$
in the previous two subsections).
$\phi _{{\delta _{{123}} ,n,m}} (u;b)$
in the previous two subsections).
Theorem 3
For
 $$n,m\in {\Bbb N}$$
, the joint moment
$$n,m\in {\Bbb N}$$
, the joint moment
 $$\varphi _{{\delta _{{23}} ,n,m}} (u;b)$$
in (1.6) satisfies the IDEs, for 0<u<b
$$\varphi _{{\delta _{{23}} ,n,m}} (u;b)$$
in (1.6) satisfies the IDEs, for 0<u<b
 $$c_{1} \varphi \prime _{{L,\delta _{{23}} ,n,m}} (u;b)\,{\minus}\,(\lambda {\plus}n\delta _{2} {\plus}m\delta _{3} )\varphi _{{L,\delta _{{23}} ,n,m}} (u;b){\plus}\lambda \mathop{\sum}\limits_{i\,=\,0}^m {\left( {\matrix{ m \cr i \cr } } \right)} \mathop{\int}\nolimits_0^u {f^{{m\,{\minus}\,i}} (y)\varphi _{{L,\delta _{{23}} ,n,i}} (u\,{\minus}\,y;b)p(y)\, dy=0} $$
and for u>b
 $$\eqalignno{ & c_{2} \varphi '_{{U,\delta _{{23}} ,n,m}} (u;b)\,{\minus}\,(\lambda {\plus}n\delta _{2} {\plus}m\delta _{3} )\varphi _{{U,\delta _{{23}} ,n,m}} (u;b){\plus}\alpha n\varphi _{{U,\delta _{{23}} ,n\,{\minus}\,1,m}} (u;b) \cr & \quad{\plus}\,\lambda \mathop{\sum}\limits_{i\,=\,0}^m {\left( {\matrix{ m \cr i \cr } } \right)} \mathop{\int}\nolimits_0^{u\,{\minus}\,b} {f^{{m\,{\minus}\,i}} (y)\varphi _{{U,\delta _{{23}} ,n,i}} (u\,{\minus}\,y;b)p(y)\, dy} \cr &\quad{\plus}\,\lambda \mathop{\sum}\limits_{i\,=\,0}^m {\left( {\matrix{ m \cr i \cr } } \right)\mathop{\int}\nolimits_{u\,{\minus}\,b}^u {f^{{m\,{\minus}\,i}} (y)\varphi _{{L,\delta _{{23}} ,n,i}} (u\,{\minus}\,y;b)p(y)\, dy=0} } $$
In addition,
 $\varphi _{{\delta _{{23}} ,n,m}} (u;b)$
is continuous at u=b, i.e.
$\varphi _{{\delta _{{23}} ,n,m}} (u;b)$
is continuous at u=b, i.e.
 $$\varphi _{{L,\delta _{{23}} ,n,m}} (b^{{\minus}\,} ;b)=\varphi _{{U,\delta _{{23}} ,n,m}} (b\!^{{\plus}} ;b)$$
It is understood that
 $\varphi _{{U,\delta _{{23}} ,n\,{\minus}\,1,m}} (u;b)$
appearing in (2.9) is regarded as 0 when n=0.□
$\varphi _{{U,\delta _{{23}} ,n\,{\minus}\,1,m}} (u;b)$
appearing in (2.9) is regarded as 0 when n=0.□
Remark 5
For
 $$n\in {\Bbb N}^{\!{\plus}} $$
and
$$n\in {\Bbb N}^{\!{\plus}} $$
and
 $$m\in {\Bbb N}$$
, it is observed that the IDEs (2.5) and (2.6) in Theorem 2 satisfied by
$$m\in {\Bbb N}$$
, it is observed that the IDEs (2.5) and (2.6) in Theorem 2 satisfied by
 $\phi _{{\delta _{{123}} ,n,m}} (u;b) \!\! \mid _{{\delta _{1} \,=\,0}} $
in the case of ruin are identical to the IDEs (2.8) and (2.9) in Theorem 3 for
$\phi _{{\delta _{{123}} ,n,m}} (u;b) \!\! \mid _{{\delta _{1} \,=\,0}} $
in the case of ruin are identical to the IDEs (2.8) and (2.9) in Theorem 3 for
 $\varphi _{{\delta _{{23}} ,n,m}} (u;b)$
concerning the case of survival. However, the full solutions to
$\varphi _{{\delta _{{23}} ,n,m}} (u;b)$
concerning the case of survival. However, the full solutions to
 $\phi _{{\delta _{{123}} ,n,m}} (u;b) \! \! \mid _{{\delta _{1} \, =\, 0}} $
and
$\phi _{{\delta _{{123}} ,n,m}} (u;b) \! \! \mid _{{\delta _{1} \, =\, 0}} $
and
 $\varphi _{{\delta _{{23}} ,n,m}} (u;b)$
are generally different due to different limiting conditions as u→∞ (which will be discussed in the next subsection) and the fact that the lower-order moments appearing in the two sets of IDEs are different.□
$\varphi _{{\delta _{{23}} ,n,m}} (u;b)$
are generally different due to different limiting conditions as u→∞ (which will be discussed in the next subsection) and the fact that the lower-order moments appearing in the two sets of IDEs are different.□
2.4. Limits of
$\phi _{{\delta _{{123}} ,n,m}} (u;b)$
and
$\varphi _{{\delta _{{23}} ,n,m}} (u;b)$
as
$u \rightarrow \infty $


From Theorems 1 and 2, the Gerber–Shiu function
 $\phi _{{\delta _{{123}} ,n,m}} (u;b)$
satisfies two different IDEs in the lower and upper layers, and each IDE contains a derivative term. Therefore, the determination of the full solution of
$\phi _{{\delta _{{123}} ,n,m}} (u;b)$
satisfies two different IDEs in the lower and upper layers, and each IDE contains a derivative term. Therefore, the determination of the full solution of
 $\phi _{{\delta _{{123}} ,n,m}} (u;b)$
from the IDEs typically requires one more piece of information apart from the continuity condition. Similar comments are applicable to
$\phi _{{\delta _{{123}} ,n,m}} (u;b)$
from the IDEs typically requires one more piece of information apart from the continuity condition. Similar comments are applicable to
 $\varphi _{{\delta _{{23}} ,n,m}} (u;b)$
as well. In this subsection, we shall consider the limits
$\varphi _{{\delta _{{23}} ,n,m}} (u;b)$
as well. In this subsection, we shall consider the limits
 ${{\rm lim}}_{u\to\infty} \, \phi _{{\delta _{{123}} ,n,m}} (u;b)$
and
${{\rm lim}}_{u\to\infty} \, \phi _{{\delta _{{123}} ,n,m}} (u;b)$
and
 ${{\rm lim}}_{u\to\infty} \, \varphi _{{\delta _{{23}} ,n,m}} (u;b)$
. It is not our objective here to discuss the existence and/or uniqueness of solution to the IDEs given the continuity and limiting conditions in general, but we point out that these are sufficient to yield a unique solution in section 3 when each claim is distributed as a combination of exponentials (see Remark 9). Interested readers are referred to e.g. Mihálykó & Mihálykó (Reference Mihálykó and Mihálykó2011) where conditions for the uniqueness of the solution to an integral equation satisfied by the classical Gerber–Shiu function are analysed. Before providing the limits in Lemmas 2 and 3, we state the following lemma which is a special case of Léveillé & Garrido (Reference Léveillé and Garrido2001, corollary 2.1).
${{\rm lim}}_{u\to\infty} \, \varphi _{{\delta _{{23}} ,n,m}} (u;b)$
. It is not our objective here to discuss the existence and/or uniqueness of solution to the IDEs given the continuity and limiting conditions in general, but we point out that these are sufficient to yield a unique solution in section 3 when each claim is distributed as a combination of exponentials (see Remark 9). Interested readers are referred to e.g. Mihálykó & Mihálykó (Reference Mihálykó and Mihálykó2011) where conditions for the uniqueness of the solution to an integral equation satisfied by the classical Gerber–Shiu function are analysed. Before providing the limits in Lemmas 2 and 3, we state the following lemma which is a special case of Léveillé & Garrido (Reference Léveillé and Garrido2001, corollary 2.1).
Lemma 1
Define, for
 $$m\in {\Bbb N}$$
and δ>0
$$m\in {\Bbb N}$$
and δ>0
 $$\theta _{{\delta ,m}} =E\left[ {\left( {\mathop{\sum}\limits_{k\,=1\,}^\infty {e^{{{\minus} \delta T_{k} }} f(Y_{k} )} } \right)^{m} } \right]$$
Then, θ
δ,m
can be computed recursively using, for
 $$m\in {\Bbb N}^{\!{\plus}} $$
 $$\theta _{{\delta ,m}} ={\lambda \over {m\delta }}\mathop{\sum}\limits_{i\,=\,0}^{m\,{\minus}\,1} \left( {\matrix{ m \cr i \cr } } \right)E[f^{{m\,{\minus}\,i}} (Y_{1} )]\theta _{{\delta ,i}} $$
with the starting value θ δ, 0=1.□
Remark 6 From Lemma 1, it is clear that θ δ, 1 is finite if E[f(Y 1)] is finite. For θ δ, 2 to be finite, one requires E[f 2(Y 1)] to be finite (which implies finiteness of E[f(Y 1)] and hence θ δ, 1). Recursively, one observes that θ δ, m is finite if E[f m (Y 1)] is finite.□
Next, we shall first state
 ${{\rm lim}}_{u\to\infty}\, \varphi _{{\delta _{{23}} ,n,m}} (u;b)$
in the following lemma under some mild conditions, and some intermediate results in the proof will be used to identify
${{\rm lim}}_{u\to\infty}\, \varphi _{{\delta _{{23}} ,n,m}} (u;b)$
in the following lemma under some mild conditions, and some intermediate results in the proof will be used to identify
 ${{\rm lim}}_{u\to\infty} \,\phi _{{\delta _{{123}}\! ,n,m}} (u;b)$
in the proof of Lemma 2.
${{\rm lim}}_{u\to\infty} \,\phi _{{\delta _{{123}}\! ,n,m}} (u;b)$
in the proof of Lemma 2.
Lemma 2
For a given value of
 $$m\in {\Bbb N}$$
, if
$$m\in {\Bbb N}$$
, if
 $$\theta _{{\delta _{3} ,m}} $$
defined via (2.11) is finite, then under the positive security loading condition, the limit of
$$\theta _{{\delta _{3} ,m}} $$
defined via (2.11) is finite, then under the positive security loading condition, the limit of
 $\varphi _{{\delta _{{23}} \!,n,m}} (u;b)$
is finite and is given by, for
$\varphi _{{\delta _{{23}} \!,n,m}} (u;b)$
is finite and is given by, for
 $$n\in {\Bbb N}$$
 $$\mathop {{\rm lim}}\limits_{u\to\infty} \varphi _{{\delta _{{23}} ,n,m}} (u;b)=\left( {{\alpha \over {\delta _{2} }}} \right)^{n} \theta _{{\delta _{3} ,m}} $$
□
Lemma 3
For a given value of
 $m\in {\Bbb N}$
, if the penalty function w(·, ·) is bounded and
$m\in {\Bbb N}$
, if the penalty function w(·, ·) is bounded and
 $$\theta _{{\delta _{3} ,m}} $$
defined via (2.11) is finite, then under the positive security loading condition, the limit of
$$\theta _{{\delta _{3} ,m}} $$
defined via (2.11) is finite, then under the positive security loading condition, the limit of
 $\phi _{{\delta _{{123}} ,n,m}} (u;b)$
is given by, for
$\phi _{{\delta _{{123}} ,n,m}} (u;b)$
is given by, for
 $$n\in {\Bbb N}$$
 $$\mathop {{\rm lim}}\limits_{u\to\infty} \phi _{{\delta _{{123}} ,n,m}} (u;b)=0$$
□
3. Combination of Exponentials Claims
In this entire section, we assume that the distribution of each claim amount Y k follows a combination of exponentials with density
 $$p(y)=\mathop{\sum}\limits_{k\,=1\,}^r {q_{k} \mu _{k} e^{{{\minus} \mu _{k} y}} } ,\,\,\,\,\,y\,\gt \,0$$
where
 $\mathop{\sum}\nolimits_{k\,=1\,}^r {q_{k} =1} $
, and for k=1, 2, … , r the parameters μ
k
’s are positive and distinct whereas q
k
’s are non-zero. The class of combinations of exponentials is known to be dense in the set of distributions on (0,∞), and we refer interested readers to Dufresne (Reference Dufresne2007) for its fitting. Concerning the quantity
$\mathop{\sum}\nolimits_{k\,=1\,}^r {q_{k} =1} $
, and for k=1, 2, … , r the parameters μ
k
’s are positive and distinct whereas q
k
’s are non-zero. The class of combinations of exponentials is known to be dense in the set of distributions on (0,∞), and we refer interested readers to Dufresne (Reference Dufresne2007) for its fitting. Concerning the quantity
 $Z_{{\delta _{3} }} (\tau _{b} )$
defined via (1.3), we shall focus on its special case
$Z_{{\delta _{3} }} (\tau _{b} )$
defined via (1.3), we shall focus on its special case
 $\mathop{\sum}\nolimits_{k\,=1\,}^{N(\tau _{b} )} {e^{{{\minus} \delta _{3} T_{k} }} Y_{k} } $
(for δ
3>0), which represents the aggregate discounted claims until ruin. Thus, it is assumed that f(y)=y throughout this section. Since all the moments of Y
1 are finite, the quantity
$\mathop{\sum}\nolimits_{k\,=1\,}^{N(\tau _{b} )} {e^{{{\minus} \delta _{3} T_{k} }} Y_{k} } $
(for δ
3>0), which represents the aggregate discounted claims until ruin. Thus, it is assumed that f(y)=y throughout this section. Since all the moments of Y
1 are finite, the quantity
 $$\theta _{{\delta _{3\!} ,m}} $$
computed via Lemma 1 is also finite for every
$$\theta _{{\delta _{3\!} ,m}} $$
computed via Lemma 1 is also finite for every
 $$m\in {\Bbb N}$$
according to Remark 6. In particular, the first two moments of Y
1 are given by
$$m\in {\Bbb N}$$
according to Remark 6. In particular, the first two moments of Y
1 are given by
 $E[Y_{1} ]=\mathop{\sum}\nolimits_{k\,=1\,}^r {q_{k} /\mu _{k} } $
and
$E[Y_{1} ]=\mathop{\sum}\nolimits_{k\,=1\,}^r {q_{k} /\mu _{k} } $
and
 $E[Y_{1}^{2} ]=\mathop{\sum}\nolimits_{k\,=1\,}^r {2q_{k} /\mu _{k}^{2} } $
. Consequently, the random variable
$E[Y_{1}^{2} ]=\mathop{\sum}\nolimits_{k\,=1\,}^r {2q_{k} /\mu _{k}^{2} } $
. Consequently, the random variable
 $\mathop{\sum}\nolimits_{k\,=1\,}^{N(\tau _{b} )} {e^{{{\minus} \delta _{3} T_{k} }} Y_{k} } $
is integrable as
$\mathop{\sum}\nolimits_{k\,=1\,}^{N(\tau _{b} )} {e^{{{\minus} \delta _{3} T_{k} }} Y_{k} } $
is integrable as
 $\mathop{\sum}\nolimits_{k\,=1\,}^{N(\tau _{b} )} {e^{{{\minus} \delta _{3} T_{k} }} Y_{k} } \leq \mathop{\sum}\nolimits_{k\,=1\,}^\infty {e^{{{\minus} \delta _{3} T_{k} }} Y_{k} } $
and
$\mathop{\sum}\nolimits_{k\,=1\,}^{N(\tau _{b} )} {e^{{{\minus} \delta _{3} T_{k} }} Y_{k} } \leq \mathop{\sum}\nolimits_{k\,=1\,}^\infty {e^{{{\minus} \delta _{3} T_{k} }} Y_{k} } $
and
 $E[\mathop{\sum}\nolimits_{k\,=1\,}^\infty {e^{{{\minus} \delta _{3} T_{k} }} Y_{k} ]=\theta _{{\delta _{3} \!,1}} } $
is finite, and hence
$E[\mathop{\sum}\nolimits_{k\,=1\,}^\infty {e^{{{\minus} \delta _{3} T_{k} }} Y_{k} ]=\theta _{{\delta _{3} \!,1}} } $
is finite, and hence
 $\mathop{\sum}\nolimits_{k\,=1\,}^{N(\tau _{b} )} {e^{{{\minus} \delta _{3} T_{k} }} Y_{k} } $
is also integrable on the sets
$\mathop{\sum}\nolimits_{k\,=1\,}^{N(\tau _{b} )} {e^{{{\minus} \delta _{3} T_{k} }} Y_{k} } $
is also integrable on the sets
 $\{ \tau _{b} \,\lt \, \infty\} $
and
$\{ \tau _{b} \,\lt \, \infty\} $
and
 $\{ \tau _{b} =\infty\} $
. Conditional on ruin occurring, we are interested in correlations involving any two of the aggregate discounted claims until ruin
$\{ \tau _{b} =\infty\} $
. Conditional on ruin occurring, we are interested in correlations involving any two of the aggregate discounted claims until ruin
 $\mathop{\sum}\nolimits_{k\,=1\,}^{N(\tau _{b} )} {e^{{{\minus} \delta _{3} T_{k} }} Y_{k} } $
, the discounted dividends until ruin
$\mathop{\sum}\nolimits_{k\,=1\,}^{N(\tau _{b} )} {e^{{{\minus} \delta _{3} T_{k} }} Y_{k} } $
, the discounted dividends until ruin
 $D_{{\delta _{2} }} (\tau _{b} )$
(for δ
2>0), and the ruin time
$D_{{\delta _{2} }} (\tau _{b} )$
(for δ
2>0), and the ruin time
 $\tau _{b} $
(see section 4). Although a penalty function of w≡1 is sufficient for our purposes, we shall assume a bounded penalty w(x,y)=w(y) that depends on the deficit
$\tau _{b} $
(see section 4). Although a penalty function of w≡1 is sufficient for our purposes, we shall assume a bounded penalty w(x,y)=w(y) that depends on the deficit
 $\! \mid \! \!U_{b} (\tau _{b} ) \!\! \mid \! $
but not the surplus before ruin
$\! \mid \! \!U_{b} (\tau _{b} ) \!\! \mid \! $
but not the surplus before ruin
 $U_{b} (\tau _{b}^{\,{\minus}\,} )$
, as this does not complicate our analysis. Note that the limiting condition (2.13) is applicable under the above setting, so is the condition (2.12) as far as the joint moments of the aggregate discounted claims and the discounted dividends are concerned without ruin occurring.
$U_{b} (\tau _{b}^{\,{\minus}\,} )$
, as this does not complicate our analysis. Note that the limiting condition (2.13) is applicable under the above setting, so is the condition (2.12) as far as the joint moments of the aggregate discounted claims and the discounted dividends are concerned without ruin occurring.
The derivations of explicit expressions for
 $\phi _{{\delta _{{123}} ,n,m}} (u;b)$
and
$\phi _{{\delta _{{123}} ,n,m}} (u;b)$
and
 $\varphi _{{\delta _{{23}} ,n,m}} (u;b)$
rely on the Lundberg’s equation, for l=1, 2 and
$\varphi _{{\delta _{{23}} ,n,m}} (u;b)$
rely on the Lundberg’s equation, for l=1, 2 and
 $$n,m\in {\Bbb N}$$
 $$c_{l} s\,{\minus}\,(\lambda {\plus}\delta _{1} {\plus}n\delta _{2} {\plus}m\delta _{3} ){\plus}\lambda \tilde{p}(s)=0$$
where
 $\tilde{p}(s)=\mathop{\sum}\nolimits_{k\,=1\,}^r {q_{k} \mu _{k} /(\mu _{k} {\plus}s)} $
is the Laplace transform of Y
1. Let
$\tilde{p}(s)=\mathop{\sum}\nolimits_{k\,=1\,}^r {q_{k} \mu _{k} /(\mu _{k} {\plus}s)} $
is the Laplace transform of Y
1. Let
 $$\{ \rho _{{n,m,j}} \} _{{j=1}}^{{r{\plus}1}} $$
and
$$\{ \rho _{{n,m,j}} \} _{{j=1}}^{{r{\plus}1}} $$
and
 $\{ \kappa _{{n,m,j}} \} _{{j=1}}^{{r{\plus}1}} $
be the r+1 roots of (3.2) when l=1 and l=2, respectively (i.e., the roots ρ’s correspond to the full premium rate c
1=c, while
$\{ \kappa _{{n,m,j}} \} _{{j=1}}^{{r{\plus}1}} $
be the r+1 roots of (3.2) when l=1 and l=2, respectively (i.e., the roots ρ’s correspond to the full premium rate c
1=c, while
 $\kappa $
’s belong to the net premium rate c
2=c−α). Each of these two sets of roots are assumed to be distinct (see Remark 7). It is well known that (3.2) has a unique root with non-negative real part (and it is a real root), while the other r roots have negative real parts. When l=2, we need to distinguish between these roots, and the non-negative root is denoted by
$\kappa $
’s belong to the net premium rate c
2=c−α). Each of these two sets of roots are assumed to be distinct (see Remark 7). It is well known that (3.2) has a unique root with non-negative real part (and it is a real root), while the other r roots have negative real parts. When l=2, we need to distinguish between these roots, and the non-negative root is denoted by
 $\kappa _{{n,m,r{\plus}1}} $
. (Note that
$\kappa _{{n,m,r{\plus}1}} $
. (Note that
 $\kappa _{{n,m,r{\plus}1}} $
is indeed positive except when δ
1=n=m=0.) Also,
$\kappa _{{n,m,r{\plus}1}} $
is indeed positive except when δ
1=n=m=0.) Also,
 $$\rho _{{n,m,j}} $$
and
$$\rho _{{n,m,j}} $$
and
 $\kappa _{{n,m,j}} $
are denoted by
$\kappa _{{n,m,j}} $
are denoted by
 $$\rho _{{n,m,j}}^{{\asterisk}} $$
and
$$\rho _{{n,m,j}}^{{\asterisk}} $$
and
 $\kappa _{{n,m,j}}^{{\asterisk}} $
, respectively, when δ
1=0. We shall see that the solutions to
$\kappa _{{n,m,j}}^{{\asterisk}} $
, respectively, when δ
1=0. We shall see that the solutions to
 $\phi _{{\delta _{{123}} ,n,m}} (u;b)$
and
$\phi _{{\delta _{{123}} ,n,m}} (u;b)$
and
 $$\varphi _{{\delta _{{23}} ,n,m}} (u;b)$$
admit the representations
$$\varphi _{{\delta _{{23}} ,n,m}} (u;b)$$
admit the representations
 $$\phi _{{L,\delta _{{123}} ,n,m}} (u;b)=\mathop{\sum}\limits_{i\,=\,0}^m {\mathop{\sum}\limits_{j=1}^{r{\plus}1} {A_{{n,m,i,j}} e^{{\rho _{{n,i,j}} u}} } } ,\,\,\,\,\,0\leq u\leq b$$
 $$\phi _{{U,\delta _{{123}} ,n,m}} (u;b)=\mathop{\sum}\limits_{i\,=\,0}^n {\mathop{\sum}\limits_{j=0}^m {\mathop{\sum}\limits_{k\,=1\,}^r {A_{{n,m,i,j,k}}^{{\asterisk}} e^{{\kappa _{{i,j,k}} u}} } } } ,\,\,\,\,\,u\, \geq \, b$$
 $$\varphi _{{L,\delta _{{23}} ,n,m}} (u;b)=\mathop{\sum}\limits_{i\,=\,0}^m {\mathop{\sum}\limits_{j=1}^{r{\plus}1} {C_{{n,m,i,j}} e^{{\rho _{{n,i,j}}^{{\asterisk}} u}} } } ,\,\,\,\,\,0\leq u\leq b$$
and
 $$\varphi _{{U,\delta _{{23}} ,n,m}} (u;b)=\mathop{\sum}\limits_{i\,=\,0}^n {\mathop{\sum}\limits_{j=0}^m {\mathop{\sum}\limits_{k\,=1\,}^r {C_{{n,m,i,j,k}}^{{\asterisk}} e^{{\kappa _{{i,j,k}}^{{\asterisk}} u}} } } } {\plus}\left( {{\alpha \over {\delta _{2} }}} \right)^{n} \theta _{{\delta _{3} ,m}}, \,\,\,\,\,u\, \geq \, b$$
As it has been shown that
 $\phi _{{\delta _{{123}} ,n,m}} (u;b)$
and
$\phi _{{\delta _{{123}} ,n,m}} (u;b)$
and
 $\varphi _{{\delta _{{23}} ,n,m}} (u;b)$
are continuous for u≥0, we shall use the domain 0≤u≤b and u≥b for the lower and upper layers, respectively, in the upcoming lemmas and theorems.
$\varphi _{{\delta _{{23}} ,n,m}} (u;b)$
are continuous for u≥0, we shall use the domain 0≤u≤b and u≥b for the lower and upper layers, respectively, in the upcoming lemmas and theorems.
Remark 7 In the unlikely case where there are multiple roots to the Lundberg’s equation, one or more model parameters (such as λ or δ 1) may be slightly modified such that the roots become distinct. Consequently, one may approximate the ruin quantities of interest by the corresponding ones in a model with distinct roots. For a detailed treatment of multiple Lundberg’s roots, we refer interested readers to e.g. Ji & Zhang (Reference Ji and Zhang2012). Nevertheless, from e.g. Gerber & Shiu (Reference Gerber and Shiu2006, equation (A.8)), a sufficient condition for the roots to be distinct is that all q k ’s in the claim density (3.1) are positive (so that p(·) is a proper mixture of exponentials). Another sufficient condition is that r=2. See e.g. equations (7.14) and (7.15) of Gerber et al. (Reference Gerber, Shiu and Smith2006) and figures 1 and 2 therein. Under either condition, the roots are real.□
3.1.
$\phi _{{\delta _{{123}} ,n,m}} (u;b)$
and
$$\varphi _{{\delta _{{23}} ,n,m}} (u;b)$$
when
$n = m =0$


When n=m=0,
 $\phi _{{\delta _{{123}} ,0,0}} (u;b)=\phi _{{\delta _{{13}} ,0}} (u;b)=\phi _{{\delta _{1} }} (u;b)$
is simply the classical Gerber–Shiu function defined in (1.4). Its solution can be obtained from Gerber & Shiu (Reference Gerber and Shiu2006, appendix B) with minor adjustments (as they considered w≡1). Since this will be used as a starting point to compute higher moments, the result is stated in the following lemma.
$\phi _{{\delta _{{123}} ,0,0}} (u;b)=\phi _{{\delta _{{13}} ,0}} (u;b)=\phi _{{\delta _{1} }} (u;b)$
is simply the classical Gerber–Shiu function defined in (1.4). Its solution can be obtained from Gerber & Shiu (Reference Gerber and Shiu2006, appendix B) with minor adjustments (as they considered w≡1). Since this will be used as a starting point to compute higher moments, the result is stated in the following lemma.
Lemma 4
The classical Gerber–Shiu function
 $\phi _{{\delta _{1} }} (u;b)$
is given by
$\phi _{{\delta _{1} }} (u;b)$
is given by
 $$\phi _{{\delta _{1} }} (u;b)=\phi _{{L,\delta _{1} }} (u;b)=\mathop{\sum}\limits_{j=1}^{r{\plus}1} {A_{{0,0,0,j}} e^{{\rho _{{0,0,j}} u}} } ,\,\,\,\,\,0\leq u\leq b$$
and
 $$\phi _{{\delta _{1} }} (u;b)=\phi _{{U,\delta _{1} }} (u;b)=\mathop{\sum}\limits_{j=1}^r {A_{{0,0,0,0,j}}^{{\asterisk}} e^{{\kappa _{{0,0,j}} u}} } ,\,\,\,\,\,u\, \geq \, b$$
where
 $$\{ \rho _{{0,0,j}} \} _{{j=1}}^{{r{\plus}1}} $$
and
$$\{ \rho _{{0,0,j}} \} _{{j=1}}^{{r{\plus}1}} $$
and
 $\{ \kappa _{{0,0,j}} \} _{{j=1}}^{r} $
are Lundberg’s roots defined via (3.2). The coefficients
$\{ \kappa _{{0,0,j}} \} _{{j=1}}^{r} $
are Lundberg’s roots defined via (3.2). The coefficients
 $$\{ A_{{0,0,0,j}} \} _{{j=1}}^{{r{\plus}1}} $$
and
$$\{ A_{{0,0,0,j}} \} _{{j=1}}^{{r{\plus}1}} $$
and
 $$\{ A_{{0,0,0,0,j}}^{{\asterisk}} \} _{{j=1}}^{r} $$
satisfy the 2r+1 linear equations which consist of
$$\{ A_{{0,0,0,0,j}}^{{\asterisk}} \} _{{j=1}}^{r} $$
satisfy the 2r+1 linear equations which consist of
 $$\mathop{\sum}\limits_{j=1}^{r{\plus}1} {{{A_{{0,0,0,j}} } \over {\mu _{k} {\plus}\rho _{{0,0,j}} }}} =\tilde{w}(\mu _{k} ),\,\,\,\,\,k=1,2,\,\ldots\,,r$$
 $$\mathop{\sum}\limits_{j=1}^{r{\plus}1} {{{A_{{0,0,0,j}} } \over {\mu _{k} {\plus}\rho _{{0,0,j}} }}e^{{\rho _{{0,0,j}} b}} } =\mathop{\sum}\limits_{j=1}^r {{{A_{{0,0,0,0,j}}^{{\asterisk}} } \over {\mu _{k} {\plus}\kappa _{{0,0,j}} }}e^{{\kappa _{{0,0,j}} b}} } ,\,\,\,\,\,k=1,2,\,\ldots\,,r$$
and
 $$\mathop{\sum}\limits_{j=1}^{r{\plus}1} {A_{{0,0,0,j}} e^{{\rho _{{0,0,j}} b}} } =\mathop{\sum}\limits_{j=1}^r {A_{{0,0,0,0,j}}^{{\asterisk}} e^{{\kappa _{{0,0,j}} b}} } $$
where
 $\tilde{w}(s)=\mathop{\int}\nolimits_0^\infty {e^{{{\minus} sy}} w(y)\, dy} $
is the Laplace transform of w(·).□
$\tilde{w}(s)=\mathop{\int}\nolimits_0^\infty {e^{{{\minus} sy}} w(y)\, dy} $
is the Laplace transform of w(·).□
When n=m=0, it is clear from the definition (1.6) that
 $\varphi _{{\delta _{{23}} ,0,0}} (u;b)=\varphi (u;b)$
is the survival probability (i.e., probability that ruin does not occur). Therefore, one has that
$\varphi _{{\delta _{{23}} ,0,0}} (u;b)=\varphi (u;b)$
is the survival probability (i.e., probability that ruin does not occur). Therefore, one has that
 $\varphi (u;b)=1\,{\minus}\,\phi _{{\delta _{1} }} (u;b)\!\! \mid \! _{{\delta _{1} \,=\,0,w\,\equiv\,1}} $
, where
$\varphi (u;b)=1\,{\minus}\,\phi _{{\delta _{1} }} (u;b)\!\! \mid \! _{{\delta _{1} \,=\,0,w\,\equiv\,1}} $
, where
 $\phi _{{\delta _{1} }} (u;b)\!\! \mid \! \,_{{\delta _{1}\, = \, 0,w\,\equiv\,1}} $
can be computed using Lemma 4. This leads to the following lemma.
$\phi _{{\delta _{1} }} (u;b)\!\! \mid \! \,_{{\delta _{1}\, = \, 0,w\,\equiv\,1}} $
can be computed using Lemma 4. This leads to the following lemma.
Lemma 5
The survival probability
 $\varphi (u;b)$
is given by
$\varphi (u;b)$
is given by
 $$\varphi (u;b)=\varphi _{L} (u;b)=\mathop{\sum}\limits_{j=1}^{r{\plus}1} {C_{{0,0,0,j}} e^{{\rho _{{0,0,j}}^{{\asterisk}} u}} } ,\,\,\,\,\,0\leq u\leq b$$
and
 $$\varphi (u;b)=\varphi _{U} (u;b)=\mathop{\sum}\limits_{j=1}^r {C_{{0,0,0,0,j}}^{{\asterisk}} e^{{\kappa _{{0,0,j}}^{{\asterisk}} u}} {\plus}1} ,\,\,\,\,\,u\, \geq \, b$$
where
 $$\{ \rho _{{0,0,j}}^{{\asterisk}} \} _{{j\,=\,1}}^{{r\,{\plus}1}} $$
and
$$\{ \rho _{{0,0,j}}^{{\asterisk}} \} _{{j\,=\,1}}^{{r\,{\plus}1}} $$
and
 $$\{ \kappa _{{0,0,j}}^{{\asterisk}} \} _{{j\,=\,1}}^{r} $$
are Lundberg’s roots defined via (3.2). The coefficients
$$\{ \kappa _{{0,0,j}}^{{\asterisk}} \} _{{j\,=\,1}}^{r} $$
are Lundberg’s roots defined via (3.2). The coefficients
 $$\{ C_{{0,0,0,j}} \} _{{j=1}}^{{r{\plus}1}} $$
and
$$\{ C_{{0,0,0,j}} \} _{{j=1}}^{{r{\plus}1}} $$
and
 $$\{ C_{{0,0,0,0,j}}^{{\asterisk}} \} _{{j\,=\,1}}^{r} $$
satisfy the 2r+1 linear equations which consist of
$$\{ C_{{0,0,0,0,j}}^{{\asterisk}} \} _{{j\,=\,1}}^{r} $$
satisfy the 2r+1 linear equations which consist of
 $$\mathop{\sum}\limits_{j=1}^{r{\plus}1} {{{C_{{0,0,0,j}} } \over {\mu _{k} {\plus}\rho _{{0,0,j}}^{{\asterisk}} }}=0} ,\,\,\,\,\,k=1,2,\,\ldots\,,r$$
 $$\mathop{\sum}\limits_{j=1}^{r{\plus}1} {{{C_{{0,0,0,j}} \mu _{k} } \over {\mu _{k} {\plus}\rho _{{0,0,j}}^{{\asterisk}} }}e^{{\rho _{{0,0,j}}^{{\asterisk}} b}} } =\mathop{\sum}\limits_{j=1}^r {{{C_{{0,0,0,0,j}}^{{\asterisk}} \mu _{k} } \over {\mu _{k} {\plus}\kappa _{{0,0,j}}^{{\asterisk}} }}e^{{\kappa _{{0,0,j}}^{{\asterisk}} b}} } {\plus}1,\,\,\,\,\,k=1,2,\,\ldots\,,r$$
and
 $$\mathop{\sum}\limits_{j=1}^{r{\plus}1} {C_{{0,0,0,j}} e^{{\rho _{{0,0,j}}^{{\asterisk}} b}} } =\mathop{\sum}\limits_{j=1}^r {C_{{0,0,0,0,j}}^{{\asterisk}} e^{{\kappa _{{0,0,j}}^{{\asterisk}} b}} } {\plus}1$$
□
3.2.
$\phi _{{\delta _{{123}} ,n,m}} (u;b)$
and
$$\varphi _{{\delta _{{23}} ,n,m}} (u;b)$$
when
$$n\in {\Bbb N}^{\!{\plus}} $$
and
$$m = 0$$


We start with the special cases of (1.5) and (1.6) where
 $$n\in {\Bbb N}^{\!{\plus}} $$
and m=0, so that the aggregate claims component
$$n\in {\Bbb N}^{\!{\plus}} $$
and m=0, so that the aggregate claims component
 $Z_{{\delta _{3} }} (\tau _{b} )=\mathop{\sum}\nolimits_{k\,=1\,}^{N(\tau _{b} )} {e^{{{\minus} \delta _{3} T_{k} }} Y_{k} } $
is absent in
$Z_{{\delta _{3} }} (\tau _{b} )=\mathop{\sum}\nolimits_{k\,=1\,}^{N(\tau _{b} )} {e^{{{\minus} \delta _{3} T_{k} }} Y_{k} } $
is absent in
 $\phi _{{\delta _{{123}} ,n,m}} (u;b)$
and
$\phi _{{\delta _{{123}} ,n,m}} (u;b)$
and
 $$\varphi _{{\delta _{{23}\!} ,n,m}} (u;b)$$
. These will be denoted by
$$\varphi _{{\delta _{{23}\!} ,n,m}} (u;b)$$
. These will be denoted by
 $\phi _{{\delta _{{123}} ,n,0}} (u;b)=\phi _{{\delta _{{12}} ,n}} (u;b)$
and
$\phi _{{\delta _{{123}} ,n,0}} (u;b)=\phi _{{\delta _{{12}} ,n}} (u;b)$
and
 $$\varphi _{{\delta _{{23}} ,n,0}} (u;b)=\varphi _{{\delta _{2} ,n}} (u;b)$$
, respectively, and given in the following two theorems. The proofs are provided in the Appendix.
$$\varphi _{{\delta _{{23}} ,n,0}} (u;b)=\varphi _{{\delta _{2} ,n}} (u;b)$$
, respectively, and given in the following two theorems. The proofs are provided in the Appendix.
Theorem 4
For
 $$n\in {\Bbb N}^{\!{\plus}} $$
, the Gerber–Shiu function
$$n\in {\Bbb N}^{\!{\plus}} $$
, the Gerber–Shiu function
 $\phi _{{\delta _{{12}}\! ,n}} (u;b)=\phi _{{\delta _{{123}} \!,n,0}} (u;b)$
is given by
$\phi _{{\delta _{{12}}\! ,n}} (u;b)=\phi _{{\delta _{{123}} \!,n,0}} (u;b)$
is given by
 $$\phi _{{\delta _{{12}\!} ,n}} (u;b)=\phi _{{L,\delta _{{12}} \!,n}} (u;b)=\mathop{\sum}\limits_{j=1}^{r{\plus}1} {A_{{n,0,0,j}} e^{{\rho _{{n,0,j}} u}} } ,\,\,\,\,\,0\leq u\leq b$$
and
 $$\phi _{{\delta _{{12}} \!,n}} (u;b)=\phi _{{U,\delta _{{12}\!} ,n}} (u;b)=\mathop{\sum}\limits_{i\,=\,0}^n {\mathop{\sum}\limits_{j=1}^r {A_{{n,0,i,0,j}}^{{\asterisk}} e^{{\kappa _{{i,0,j}} u}} } } ,\,\,\,\,\,u\, \geq \, b$$
where
 $\{ \rho _{{n,0,j}} \} _{{j=1}}^{{r{\plus}1}} $
and
$\{ \rho _{{n,0,j}} \} _{{j=1}}^{{r{\plus}1}} $
and
 $\{ \kappa _{{i,0,j}} \} _{{j=1}}^{r} $
are Lundberg’s roots defined via (3.2). The coefficients
$\{ \kappa _{{i,0,j}} \} _{{j=1}}^{r} $
are Lundberg’s roots defined via (3.2). The coefficients
 $\{ A_{{n,0,i,0,j}}^{{\asterisk}} \} _{{j=1}}^{r} $
(for i=0, 1, … , n−1) can be obtained from
$\{ A_{{n,0,i,0,j}}^{{\asterisk}} \} _{{j=1}}^{r} $
(for i=0, 1, … , n−1) can be obtained from
 $$A_{{n,0,i,0,j}}^{{\asterisk}} ={{\alpha n} \over {(n\,{\minus}\,i)\delta _{2} }}A_{{n\,{\minus}\,1,0,i,0,j}}^{{\asterisk}} ,\,\,\,\,\,i=0,1,\,\ldots\,,n\,{\minus}\,1;j=1,2,\,\ldots\,,r$$
while the coefficients
 $\{ A_{{n,0,0,j}} \} _{{j=1}}^{{r{\plus}1}} $
and
$\{ A_{{n,0,0,j}} \} _{{j=1}}^{{r{\plus}1}} $
and
 $\{ A_{{n,0,n,0,j}}^{{\asterisk}} \} _{{j=1}}^{r} $
satisfy the 2r+1 linear equations which consist of
$\{ A_{{n,0,n,0,j}}^{{\asterisk}} \} _{{j=1}}^{r} $
satisfy the 2r+1 linear equations which consist of
 $$\mathop{\sum}\limits_{j=1}^{r{\plus}1} {{{A_{{n,0,0,j}} } \over {\mu _{k} {\plus}\rho _{{n,0,j}} }}} =0,\,\,\,\,\,k=1,2,\,\ldots\,,r$$
 $$\mathop{\sum}\limits_{j=1}^{r{\plus}1} {{{A_{{n,0,0,j}} } \over {\mu _{k} {\plus}\rho _{{n,0,j}} }}e^{{\rho _{{n,0,j}} b}} } =\mathop{\sum}\limits_{i\,=\,0}^n {\mathop{\sum}\limits_{j=1}^r {{{A_{{n,0,i,0,j}}^{{\asterisk}} } \over {\mu _{k} {\plus}\kappa _{{i,0,j}} }}e^{{\kappa _{{i,0,j}} b}} } } ,\,\,\,\,\,k=1,2,\,\ldots\,,r$$
and
 $$\mathop{\sum}\limits_{j=1}^{r{\plus}1} {A_{{n,0,0,j}} e^{{\rho _{{n,0,j}} b}} } =\mathop{\sum}\limits_{i\,=\,0}^n {\mathop{\sum}\limits_{j=1}^r {A_{{n,0,i,0,j}}^{{\asterisk}} e^{{\kappa _{{i,0,j}} b}} } } $$
The coefficients
 $$\{ A_{{0,0,0,0,j}}^{{\asterisk}} \} _{{j=1}}^{r} $$
which form the starting point of the recursion in n can be evaluated using Lemma 4.□
$$\{ A_{{0,0,0,0,j}}^{{\asterisk}} \} _{{j=1}}^{r} $$
which form the starting point of the recursion in n can be evaluated using Lemma 4.□
Theorem 5
For
 $$n\in {\Bbb N}^{\!{\plus}} $$
, the nth moment of the discounted dividends without ruin occurring
$$n\in {\Bbb N}^{\!{\plus}} $$
, the nth moment of the discounted dividends without ruin occurring
 $$\varphi _{{\delta _{2} ,n}} (u;b)=\varphi _{{\delta _{{23}} ,n,0}} (u;b)$$
is given by
$$\varphi _{{\delta _{2} ,n}} (u;b)=\varphi _{{\delta _{{23}} ,n,0}} (u;b)$$
is given by
 $$\varphi _{{\delta _{2} ,n}} (u;b)=\varphi _{{L,\delta _{2} ,n}} (u;b)=\mathop{\sum}\limits_{j=1}^{r{\plus}1} {C_{{n,0,0,j}} e^{{\rho _{{n,0,j}}^{{\asterisk}} u}} } ,\,\,\,\,\,0\leq u\leq b$$
and
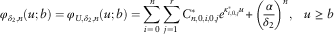 $$\varphi _{{\delta _{2} ,n}} (u;b)=\varphi _{{U,\delta _{2} ,n}} (u;b)=\mathop{\sum}\limits_{i\,=\,0}^n {\mathop{\sum}\limits_{j=1}^r {C_{{n,0,i,0,j}}^{{\asterisk}} e^{{\kappa _{{i,0,j}}^{{\asterisk}} u}} } } {\plus}\left( {{\alpha \over {\delta _{2} }}} \right)^{n} ,\,\,\,\,\,u\, \geq \, b$$
where
 $$\{ \rho _{{n,0,j}}^{{\asterisk}} \} _{{j=1}}^{{r{\plus}1}} $$
and
$$\{ \rho _{{n,0,j}}^{{\asterisk}} \} _{{j=1}}^{{r{\plus}1}} $$
and
 $\{ \kappa _{{i,0,j}}^{{\asterisk}} \} _{{j=1}}^{r} $
are Lundberg’s roots defined via (3.2). The coefficients
$\{ \kappa _{{i,0,j}}^{{\asterisk}} \} _{{j=1}}^{r} $
are Lundberg’s roots defined via (3.2). The coefficients
 $$\{ C_{{n,0,i,0,j}}^{{\asterisk}} \} _{{j=1}}^{r} $$
(for i=0, 1, … , n−1) can be obtained from
$$\{ C_{{n,0,i,0,j}}^{{\asterisk}} \} _{{j=1}}^{r} $$
(for i=0, 1, … , n−1) can be obtained from
 $$C_{{n,0,i,0,j}}^{{\asterisk}} ={{\alpha n} \over {(n\,{\minus}\,i)\delta _{2} }}C_{{n\,{\minus}\,1,0,i,0,j}}^{{\asterisk}} ,\,\,\,\,\,i=0,1,\,\ldots\,,n\,{\minus}\,1;j=1,2,\,\ldots\,,r$$
while the coefficients
 $$\{ C_{{n,0,0,j}} \} _{{j=1}}^{{r{\plus}1}} $$
and
$$\{ C_{{n,0,0,j}} \} _{{j=1}}^{{r{\plus}1}} $$
and
 $$\{ C_{{n,0,n,0,j}}^{{\asterisk}} \} _{{j=1}}^{r} $$
satisfy the 2r+1 linear equations which consist of
$$\{ C_{{n,0,n,0,j}}^{{\asterisk}} \} _{{j=1}}^{r} $$
satisfy the 2r+1 linear equations which consist of
 $$\mathop{\sum}\limits_{j=1}^{r{\plus}1} {{{C_{{n,0,0,j}} } \over {\mu _{k} {\plus}\rho _{{n,0,j}}^{{\asterisk}} }}} =0,\,\,\,\,\,k=1,2,\,\ldots\,,r$$
 $$\mathop{\sum}\limits_{j=1}^{r{\plus}1} {{{C_{{n,0,0,j}} } \over {\mu _{k} {\plus}\rho _{{n,0,j}}^{{\asterisk}} }}e^{{\rho _{{n,0,j}}^{{\asterisk}} b}} } =\mathop{\sum}\limits_{i\,=\,0}^n {\mathop{\sum}\limits_{j=1}^r {{{C_{{n,0,i,0,j}}^{{\asterisk}} } \over {\mu _{k} {\plus}\kappa _{{i,0,j}}^{{\asterisk}} }}e^{{\kappa _{{i,0,j}}^{{\asterisk}} b}} } } {\plus}{1 \over {\mu _{k} }}\left( {{\alpha \over {\delta _{2} }}} \right)^{n} ,\,\,\,\,\,k=1,2,\,\ldots\,,r$$
and
 $$\mathop{\sum}\limits_{j=1}^{r{\plus}1} {C_{{n,0,0,j}} e^{{\rho _{{n,0,j}}^{{\asterisk}} b}} } =\mathop{\sum}\limits_{i\,=\,0}^n {\mathop{\sum}\limits_{j=1}^r {C_{{n,0,i,0,j}}^{{\asterisk}} e^{{\kappa _{{i,0,j}}^{{\asterisk}} b}} } } {\plus}\left( {{\alpha \over {\delta _{2} }}} \right)^{n} $$
The coefficients
 $$\{ C_{{0,0,0,0,j}}^{{\asterisk}} \} _{{j=1}}^{r} $$
, which form the starting point of the recursion in n, can be evaluated using Lemma 5.□
$$\{ C_{{0,0,0,0,j}}^{{\asterisk}} \} _{{j=1}}^{r} $$
, which form the starting point of the recursion in n, can be evaluated using Lemma 5.□
3.3.
$\phi _{{\delta _{{123}} ,n,m}} (u;b)$
and
$\varphi _{{\delta _{{23}} ,n,m}} (u;b)$
when
$n =0$
and
$m =1, 2$


We now look at
 $\phi _{{\delta _{{123}} ,n,m}} (u;b)$
when n=0, which is denoted by
$\phi _{{\delta _{{123}} ,n,m}} (u;b)$
when n=0, which is denoted by
 $\phi _{{\delta _{{123}} ,0,m}} (u;b)=\phi _{{\delta _{{13}} ,m}} (u;b)$
in section 2.1. The following theorem gives the explicit expression for
$\phi _{{\delta _{{123}} ,0,m}} (u;b)=\phi _{{\delta _{{13}} ,m}} (u;b)$
in section 2.1. The following theorem gives the explicit expression for
 $\phi _{{\delta _{{13}} ,1}} (u;b)$
. The proof is given in the Appendix. It will be seen that the analysis is more involved when m is now non-zero.
$\phi _{{\delta _{{13}} ,1}} (u;b)$
. The proof is given in the Appendix. It will be seen that the analysis is more involved when m is now non-zero.
Theorem 6
The Gerber–Shiu function
 $\phi _{{\delta _{{13}} ,1}} (u;b)=\phi _{{\delta _{{123}} ,0,1}} (u;b)$
is given by
$\phi _{{\delta _{{13}} ,1}} (u;b)=\phi _{{\delta _{{123}} ,0,1}} (u;b)$
is given by
 $$\phi _{{\delta _{{13}} ,1}} (u;b)=\phi _{{L,\delta _{{13}} ,1}} (u;b)=\mathop{\sum}\limits_{i\,=\,0}^1 {\mathop{\sum}\limits_{j=1}^{r{\plus}1} {A_{{0,1,i,j}} e^{{\rho _{{0,i,j}} u}} } } ,\,\,\,\,\,0\leq u\leq b$$
and
 $$\phi _{{\delta _{{13}} ,1}} (u;b)=\phi _{{U,\delta _{{13}} ,1}} (u;b)=\mathop{\sum}\limits_{i\,=\,0}^1 {\mathop{\sum}\limits_{j=1}^r {A_{{0,1,0,i,j}}^{{\asterisk}} e^{{\kappa _{{0,i,j}} u}} } } ,\,\,\,\,\,u\, \geq \, b$$
where
 $$\{ \rho _{{0,i,j}} \} _{{j=1}}^{{r{\plus}1}} $$
and
$$\{ \rho _{{0,i,j}} \} _{{j=1}}^{{r{\plus}1}} $$
and
 $\{ \kappa _{{0,i,j}} \} _{{j=1}}^{r} $
are Lundberg’s roots defined via (3.2). The coefficients
$\{ \kappa _{{0,i,j}} \} _{{j=1}}^{r} $
are Lundberg’s roots defined via (3.2). The coefficients
 $$\{ A_{{0,1,0,j}} \} _{{j=1}}^{{r{\plus}1}} $$
and
$$\{ A_{{0,1,0,j}} \} _{{j=1}}^{{r{\plus}1}} $$
and
 $$\{ A_{{0,1,0,0,j}}^{{\asterisk}} \} _{{j=1}}^{r} $$
can be computed directly using
$$\{ A_{{0,1,0,0,j}}^{{\asterisk}} \} _{{j=1}}^{r} $$
can be computed directly using
 $$A_{{0,1,0,j}} ={{\lambda A_{{0,0,0,j}} } \over {\delta _{3} }}\mathop{\sum}\limits_{k\,=1\,}^r {{{q_{k} \mu _{k} } \over {(\mu _{k} {\plus}\rho _{{0,0,j}} )^{2} }}} ,\,\,\,\,\,j=1,2,\,\ldots\,,r{\plus}1$$
and
 $$A_{{0,1,0,0,j}}^{{\asterisk}} ={{\lambda A_{{0,0,0,0,j}}^{{\asterisk}} } \over {\delta _{3} }}\mathop{\sum}\limits_{k\,=1\,}^r {{{q_{k} \mu _{k} } \over {(\mu _{k} {\plus}\kappa _{{0,0,j}} )^{2} }}} ,\,\,\,\,\,j=1,2,\,\ldots\,,r$$
where
 $$\{ A_{{0,0,0,j}} \} _{{j=1}}^{{r{\plus}1}} $$
and
$$\{ A_{{0,0,0,j}} \} _{{j=1}}^{{r{\plus}1}} $$
and
 $$\{ A_{{0,0,0,0,j}}^{{\asterisk}} \} _{{j=1}}^{r} $$
are obtainable from Lemma 4. Then the coefficients
$$\{ A_{{0,0,0,0,j}}^{{\asterisk}} \} _{{j=1}}^{r} $$
are obtainable from Lemma 4. Then the coefficients
 $$\{ A_{{0,1,1,j}} \} _{{j=1}}^{{r{\plus}1}} $$
and
$$\{ A_{{0,1,1,j}} \} _{{j=1}}^{{r{\plus}1}} $$
and
 $$\{ A_{{0,1,0,1,j}}^{{\asterisk}} \} _{{j=1}}^{r} $$
can be solved from the 2r+1 linear equations which consist of
$$\{ A_{{0,1,0,1,j}}^{{\asterisk}} \} _{{j=1}}^{r} $$
can be solved from the 2r+1 linear equations which consist of
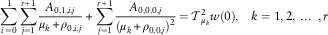 $$\mathop{\sum}\limits_{i\,=\,0}^1 {\mathop{\sum}\limits_{j=1}^{r{\plus}1} {{{A_{{0,1,i,j}} } \over {\mu _{k} {\plus}\rho _{{0,i,j}} }}} } \,{\plus}\mathop{\sum}\limits_{j=1}^{r{\plus}1} {{{A_{{0,0,0,j}} } \over {(\mu _{k} {\plus}\rho _{{0,0,j}} )^{2} }}} ={\cal T}_{{\mu _{k} }}^{2} w(0),\,\,\,\,\,k=1,2,\,\ldots\,,r$$
 $$\eqalignno{ & \mathop{\sum}\limits_{i\,=\,0}^1 {\mathop{\sum}\limits_{j=1}^{r{\plus}1} {{{A_{{0,1,i,j}} } \over {\mu _{k} {\plus}\rho _{{0,i,j}} }}e^{{\rho _{{0,i,j}} b}} } } {\plus}\mathop{\sum}\limits_{j=1}^{r{\plus}1} {{{A_{{0,0,0,j}} } \over {(\mu _{k} {\plus}\rho _{{0,0,j}} )^{2} }}e^{{\rho _{{0,0,j}} b}} } =\mathop{\sum}\limits_{i\,=\,0}^1 {\mathop{\sum}\limits_{j=1}^r {{{A_{{0,1,0,i,j}}^{{\asterisk}} } \over {\mu _{k} {\plus}\kappa _{{0,i,j}} }}e^{{\kappa _{{0,i,j}} b}} } } {\plus}\mathop{\sum}\limits_{j=1}^r {{{A_{{0,0,0,0,j}}^{{\asterisk}} } \over {(\mu _{k} {\plus}\kappa _{{0,0,j}} )^{2} }}e^{{\kappa _{{0,0,j}} b}} } , \cr & \quad \quad \quad \quad \quad \quad \quad \quad \quad \quad \quad \quad \quad \quad \quad \quad \quad \quad \quad \quad \quad \quad \quad \quad \quad \quad \quad \quad \quad \quad \quad \quad \quad k=1,2,\,\ldots\,,r $$
and
 $$\mathop{\sum}\limits_{i\,=\,0}^1 {\mathop{\sum}\limits_{j=1}^{r{\plus}1} {A_{{0,1,i,j}} e^{{\rho _{{0,i,j}} b}} } } =\mathop{\sum}\limits_{i\,=\,0}^1 {\mathop{\sum}\limits_{j=1}^r {A_{{0,1,0,i,j}}^{{\asterisk}} e^{{\kappa _{{0,i,j}} b}} } } $$
where
 ${\cal T}_{{\mu _{k} }}^{2} w(0)=\mathop{\int}\nolimits_0^\infty {ye^{{{\minus} \mu _{k} y}} w(y)\, dy} $
in (3.29) is the notation of a double Dickson–Hipp operator (see Dickson & Hipp, Reference Dickson and Hipp2001; Li & Garrido, Reference Li and Garrido2004).□
${\cal T}_{{\mu _{k} }}^{2} w(0)=\mathop{\int}\nolimits_0^\infty {ye^{{{\minus} \mu _{k} y}} w(y)\, dy} $
in (3.29) is the notation of a double Dickson–Hipp operator (see Dickson & Hipp, Reference Dickson and Hipp2001; Li & Garrido, Reference Li and Garrido2004).□
The next theorem gives the result for
 $\phi _{{\delta _{{13}} ,2}} (u;b)$
. Since the logic of the derivation is identical to that of Theorem 6 (although it is more tedious), the proof is omitted. Note that (3.32)–(3.35) concerning the Gerber–Shiu function
$\phi _{{\delta _{{13}} ,2}} (u;b)$
. Since the logic of the derivation is identical to that of Theorem 6 (although it is more tedious), the proof is omitted. Note that (3.32)–(3.35) concerning the Gerber–Shiu function
 $\phi _{{L,\delta _{{13}} ,2}} (u;b)$
in the lower layer are direct consequences of (39)–(42) in theorem 7 of Cheung et al. (Reference Cheung, Liu and Woo2015) (see Remark 4).
$\phi _{{L,\delta _{{13}} ,2}} (u;b)$
in the lower layer are direct consequences of (39)–(42) in theorem 7 of Cheung et al. (Reference Cheung, Liu and Woo2015) (see Remark 4).
Theorem 7
The Gerber–Shiu function
 $\phi _{{\delta _{{13}} ,2}} (u;b)=\phi _{{\delta _{{123}} ,0,2}} (u;b)$
is given by
$\phi _{{\delta _{{13}} ,2}} (u;b)=\phi _{{\delta _{{123}} ,0,2}} (u;b)$
is given by
 $$\phi _{{\delta _{{13}} ,2}} (u;b)=\phi _{{L,\delta _{{13}} ,2}} (u;b)=\mathop{\sum}\limits_{i\,=\,0}^2 {\mathop{\sum}\limits_{j=1}^{r{\plus}1} {A_{{0,2,i,j}} e^{{\rho _{{0,i,j}} u}} } } ,\,\,\,\,\,0\leq u\leq b$$
and
 $$\phi _{{\delta _{{13}} ,2}} (u;b)=\phi _{{U,\delta _{{13}} ,2}} (u;b)=\mathop{\sum}\limits_{i\,=\,0}^2 {\mathop{\sum}\limits_{j=1}^r {A_{{0,2,0,i,j}}^{{\asterisk}} e^{{\kappa _{{0,i,j}} u}} } } ,\,\,\,\,\,u\, \geq \, b$$
where
 $$\{ \rho _{{0,i,j}} \} _{{j=1}}^{{r{\plus}1}} $$
and
$$\{ \rho _{{0,i,j}} \} _{{j=1}}^{{r{\plus}1}} $$
and
 $\{ \kappa _{{0,i,j}} \} _{{j=1}}^{r} $
are Lundberg’s roots defined via (3.2). For i=0, 1, the coefficients
$\{ \kappa _{{0,i,j}} \} _{{j=1}}^{r} $
are Lundberg’s roots defined via (3.2). For i=0, 1, the coefficients
 $$\{ A_{{0,2,i,j}} \} _{{j=1}}^{{r{\plus}1}} $$
and
$$\{ A_{{0,2,i,j}} \} _{{j=1}}^{{r{\plus}1}} $$
and
 $$\{ A_{{0,2,0,i,j}}^{{\asterisk}} \} _{{j=1}}^{r} $$
can be computed directly using
$$\{ A_{{0,2,0,i,j}}^{{\asterisk}} \} _{{j=1}}^{r} $$
can be computed directly using
 $$A_{{0,2,0,j}} ={{\lambda A_{{0,1,0,j}} } \over {\delta _{3} }}\mathop{\sum}\limits_{k\,=1\,}^r {{{q_{k} \mu _{k} } \over {(\mu _{k} {\plus}\rho _{{0,0,j}} )^{2} }}} \,{\plus}\,{{\lambda A_{{0,0,0,j}} } \over {\delta _{3} }}\mathop{\sum}\limits_{k\,=1\,}^r {{{q_{k} \mu _{k} } \over {(\mu _{k} {\plus}\rho _{{0,0,j}} )^{3} }}} ,\,\,\,\,\,j=1,2,\,\ldots\,,r{\plus}1$$
 $$A_{{0,2,1,j}} ={{2\lambda A_{{0,1,1,j}} } \over {\delta _{3} }}\mathop{\sum}\limits_{k\,=1\,}^r {{{q_{k} \mu _{k} } \over {(\mu _{k} {\plus}\rho _{{0,1,j}} )^{2} }}} ,\,\,\,\,\,j=1,2,\,\ldots\,,r{\plus}1$$
 $$A_{{0,2,0,0,j}}^{{\asterisk}} ={{\lambda A_{{0,1,0,0,j}}^{{\asterisk}} } \over {\delta _{3} }}\mathop{\sum}\limits_{k\,=1\,}^r {{{q_{k} \mu _{k} } \over {(\mu _{k} {\plus}\kappa _{{0,0,j}} )^{2} }}} {\plus}{{\lambda A_{{0,0,0,0,j}}^{{\asterisk}} } \over {\delta _{3} }}\mathop{\sum}\limits_{k\,=1\,}^r {{{q_{k} \mu _{k} } \over {(\mu _{k} {\plus}\kappa _{{0,0,j}} )^{3} }}} ,\,\,\,\,\,j=1,2,\,\ldots\,,r$$
and
 $$A_{{0,2,0,1,j}}^{{\asterisk}} ={{2\lambda A_{{0,1,0,1,j}}^{{\asterisk}} } \over {\delta _{3} }}\mathop{\sum}\limits_{k\,=1\,}^r {{{q_{k} \mu _{k} } \over {(\mu _{k} {\plus}\kappa _{{0,1,j}} )^{2} }}} ,\,\,\,\,\,j=1,2,\,\ldots\,,r$$
where
 $$\{ A_{{0,0,0,j}} \} _{{j=1}}^{{r{\plus}1}} $$
and
$$\{ A_{{0,0,0,j}} \} _{{j=1}}^{{r{\plus}1}} $$
and
 $$\{ A_{{0,0,0,0,j}}^{{\asterisk}} \} _{{j=1}}^{r} $$
are obtainable from Lemma 4, while for i=0, 1, the coefficients
$$\{ A_{{0,0,0,0,j}}^{{\asterisk}} \} _{{j=1}}^{r} $$
are obtainable from Lemma 4, while for i=0, 1, the coefficients
 $$\{ A_{{0,1,i,j}} \} _{{j=1}}^{{r{\plus}1}} $$
and
$$\{ A_{{0,1,i,j}} \} _{{j=1}}^{{r{\plus}1}} $$
and
 $$\{ A_{{0,1,0,i,j}}^{{\asterisk}} \} _{{j=1}}^{r} $$
are obtainable from Theorem 6. Then, the coefficients
$$\{ A_{{0,1,0,i,j}}^{{\asterisk}} \} _{{j=1}}^{r} $$
are obtainable from Theorem 6. Then, the coefficients
 $$\{ A_{{0,2,2,j}} \} _{{j=1}}^{{r{\plus}1}} $$
and
$$\{ A_{{0,2,2,j}} \} _{{j=1}}^{{r{\plus}1}} $$
and
 $$\{ A_{{0,2,0,2,j}}^{{\asterisk}} \} _{{j=1}}^{r} $$
can be solved from the 2r+1 linear equations which consist of
$$\{ A_{{0,2,0,2,j}}^{{\asterisk}} \} _{{j=1}}^{r} $$
can be solved from the 2r+1 linear equations which consist of
 $$\mathop{\sum}\limits_{i\,=\,0}^2 {\mathop{\sum}\limits_{j=1}^{r{\plus}1} {{{A_{{0,2,i,j}} } \over {\mu _{k} {\plus}\rho _{{0,i,j}} }}} } \,{\plus}\mathop{\sum}\limits_{i\,=\,0}^1 {\mathop{\sum}\limits_{j=1}^{r{\plus}1} {{{2A_{{0,1,i,j}} } \over {(\mu _{k} {\plus}\rho _{{0,i,j}} )^{2} }}} }\, {\plus}\mathop{\sum}\limits_{j=1}^{r{\plus}1} {{{2A_{{0,0,0,j}} } \over {(\mu _{k} {\plus}\rho _{{0,0,j}} )^{3} }}} =2{\cal T}_{{\mu _{k} }}^{3} w(0),\,\,\,\,\,k=1,2,\,\ldots\,,r$$
 $$\eqalignno{ & \mathop{\sum}\limits_{i\,=\,0}^2 {\mathop{\sum}\limits_{j=1}^{r{\plus}1} {{{A_{{0,2,i,j}} } \over {\mu _{k} {\plus}\rho _{{0,i,j}} }}e^{{\rho _{{0,i,j}} b}} } } {\plus}\mathop{\sum}\limits_{i\,=\,0}^1 {\mathop{\sum}\limits_{j=1}^{r{\plus}1} {{{2A_{{0,1,i,j}} } \over {(\mu _{k} {\plus}\rho _{{0,i,j}} )^{2} }}e^{{\rho _{{0,i,j}} b}} } } {\plus}\mathop{\sum}\limits_{j=1}^{r{\plus}1} {{{2A_{{0,0,0,j}} } \over {(\mu _{k} {\plus}\rho _{{0,0,j}} )^{3} }}e^{{\rho _{{0,0,j}} b}} } \cr & \quad =\mathop{\sum}\limits_{i\,=\,0}^2 {\mathop{\sum}\limits_{j=1}^r {{{A_{{0,2,0,i,j}}^{{\asterisk}} } \over {\mu _{k} {\plus}\kappa _{{0,i,j}} }}e^{{\kappa _{{0,i,j}} b}} } } {\plus}\mathop{\sum}\limits_{i\,=\,0}^1 {\mathop{\sum}\limits_{j=1}^r {{{2A_{{0,1,0,i,j}}^{{\asterisk}} } \over {(\mu _{k} {\plus}\kappa _{{0,i,j}} )^{2} }}e^{{\kappa _{{0,i,j}} b}} } } {\plus}\mathop{\sum}\limits_{j=1}^r {{{2A_{{0,0,0,0,j}}^{{\asterisk}} } \over {(\mu _{k} {\plus}\kappa _{{0,0,j}} )^{3} }}e^{{\kappa _{{0,0,j}} b}} } ,\,\,\,\,\,k=1,2,\,\ldots\,,r $$
and
 $$\mathop{\sum}\limits_{i\,=\,0}^2 {\mathop{\sum}\limits_{j=1}^{r{\plus}1} {A_{{0,2,i,j}} e^{{\rho _{{0,i,j}} b}} } } =\mathop{\sum}\limits_{i\,=\,0}^2 {\mathop{\sum}\limits_{j=1}^r {A_{{0,2,0,i,j}}^{{\asterisk}} e^{{\kappa _{{0,i,j}} b}} } } $$
where
 ${\cal T}_{{\mu _{k} }}^{3} w(0)=\mathop{\int}\nolimits_0^\infty {(y^{2} e^{{{\minus} \mu _{k} y}} /2)w(y)\, dy} $
in (3.35) is the notation of a triple Dickson–Hipp operator.□
${\cal T}_{{\mu _{k} }}^{3} w(0)=\mathop{\int}\nolimits_0^\infty {(y^{2} e^{{{\minus} \mu _{k} y}} /2)w(y)\, dy} $
in (3.35) is the notation of a triple Dickson–Hipp operator.□
Concerning the first two moments of the aggregate discounted claims without ruin occurring (denoted by
 $\varphi _{{\delta _{{23}} ,0,m}} (u;b)=\varphi _{{\delta _{3} ,m}} (u;b)$
for m=1, 2), the results are stated in the following theorems. Their proofs follow closely those of Theorems 6 and 7 and are omitted.
$\varphi _{{\delta _{{23}} ,0,m}} (u;b)=\varphi _{{\delta _{3} ,m}} (u;b)$
for m=1, 2), the results are stated in the following theorems. Their proofs follow closely those of Theorems 6 and 7 and are omitted.
Theorem 8
The expected aggregate discounted claims
 $\varphi _{{\delta _{3} ,1}} (u;b)=\varphi _{{\delta _{{23}} ,0,1}} (u;b)$
without ruin occurring is given by
$\varphi _{{\delta _{3} ,1}} (u;b)=\varphi _{{\delta _{{23}} ,0,1}} (u;b)$
without ruin occurring is given by
 $$\varphi _{{\delta _{3} ,1}} (u;b)=\varphi _{{L,\delta _{3} ,1}} (u;b)=\mathop{\sum}\limits_{i\,=\,0}^1 {\mathop{\sum}\limits_{j=1}^{r{\plus}1} {C_{{0,1,i,j}} e^{{\rho _{{0,i,j}}^{{\asterisk}} u}} } } ,\,\,\,\,\,0\leq u\leq b,$$
and
 $$\varphi _{{\delta _{3} ,1}} (u;b)=\varphi _{{U,\delta _{3} ,1}} (u;b)=\mathop{\sum}\limits_{i\,=\,0}^1 {\mathop{\sum}\limits_{j=1}^r {C_{{0,1,0,i,j}}^{{\asterisk}} e^{{\kappa _{{0,i,j}}^{{\asterisk}} u}} } } {\plus}{{\lambda E[Y_{1} ]} \over {\delta _{3} }},\,\,\,\,\,u\, \geq \, b$$
where
 $$\{ \rho _{{0,i,j}}^{{\asterisk}} \} _{{j=1}}^{{r{\plus}1}} $$
and
$$\{ \rho _{{0,i,j}}^{{\asterisk}} \} _{{j=1}}^{{r{\plus}1}} $$
and
 $\{ \kappa _{{0,i,j}}^{{\asterisk}} \} _{{j=1}}^{r} $
are Lundberg’s roots defined via (3.2). The coefficients
$\{ \kappa _{{0,i,j}}^{{\asterisk}} \} _{{j=1}}^{r} $
are Lundberg’s roots defined via (3.2). The coefficients
 $$\{ C_{{0,1,0,j}} \} _{{j=1}}^{{r{\plus}1}} $$
and
$$\{ C_{{0,1,0,j}} \} _{{j=1}}^{{r{\plus}1}} $$
and
 $$\{ C_{{0,1,0,0,j}}^{{\asterisk}} \} _{{j=1}}^{r} $$
can be computed directly using
$$\{ C_{{0,1,0,0,j}}^{{\asterisk}} \} _{{j=1}}^{r} $$
can be computed directly using
 $$C_{{0,1,0,j}} ={{\lambda C_{{0,0,0,j}} } \over {\delta _{3} }}\mathop{\sum}\limits_{k\,=1\,}^r {{{q_{k} \mu _{k} } \over {(\mu _{k} {\plus}\rho _{{0,0,j}}^{{\asterisk}} )^{2} }}} ,\,\,\,\,\,j=1,2,\,\ldots\,,r{\plus}1$$
and
 $$C_{{0,1,0,0,j}}^{{\asterisk}} ={{\lambda C_{{0,0,0,0,j}}^{{\asterisk}} } \over {\delta _{3} }}\mathop{\sum}\limits_{k\,=1\,}^r {{{q_{k} \mu _{k} } \over {(\mu _{k} {\plus}\kappa _{{0,0,j}}^{{\asterisk}} )^{2} }}} ,\,\,\,\,\,j=1,2,\,\ldots\,,r$$
where
 $$\{ C_{{0,0,0,j}} \} _{{j=1}}^{{r{\plus}1}} $$
and
$$\{ C_{{0,0,0,j}} \} _{{j=1}}^{{r{\plus}1}} $$
and
 $$\{ C_{{0,0,0,0,j}}^{{\asterisk}} \} _{{j=1}}^{r} $$
are obtainable from Lemma 5. Then the coefficients
$$\{ C_{{0,0,0,0,j}}^{{\asterisk}} \} _{{j=1}}^{r} $$
are obtainable from Lemma 5. Then the coefficients
 $$\{ C_{{0,1,1,j}} \} _{{j=1}}^{{r{\plus}1}} $$
and
$$\{ C_{{0,1,1,j}} \} _{{j=1}}^{{r{\plus}1}} $$
and
 $$\{ C_{{0,1,0,1,j}}^{{\asterisk}} \} _{{j=1}}^{r} $$
can be solved from the 2r+1 linear equations which consist of
$$\{ C_{{0,1,0,1,j}}^{{\asterisk}} \} _{{j=1}}^{r} $$
can be solved from the 2r+1 linear equations which consist of
 $$\mathop{\sum}\limits_{i\,=\,0}^1 {\mathop{\sum}\limits_{j=1}^{r{\plus}1} {{{C_{{0,1,i,j}} } \over {\mu _{k} {\plus}\rho _{{0,i,j}}^{{\asterisk}} }}} } {\plus}\mathop{\sum}\limits_{j=1}^{r{\plus}1} {{{C_{{0,0,0,j}} } \over {(\mu _{k} {\plus}\rho _{{0,0,j}}^{{\asterisk}} )^{2} }}} =0,\,\,\,\,\,k=1,2,\,\ldots\,,r$$
 $$\eqalignno{ & \mathop{\sum}\limits_{i\,=\,0}^1 {\mathop{\sum}\limits_{j=1}^{r{\plus}1} {{{C_{{0,1,i,j}} } \over {\mu _{k} {\plus}\rho _{{0,i,j}}^{{\asterisk}} }}e^{{\rho _{{0,i,j}}^{{\asterisk}} b}} } } {\plus}\mathop{\sum}\limits_{j=1}^{r{\plus}1} {{{C_{{0,0,0,j}} } \over {(\mu _{k} {\plus}\rho _{{0,0,j}}^{{\asterisk}} )^{2} }}e^{{\rho _{{0,0,j}}^{{\asterisk}} b}} } \cr & =\mathop{\sum}\limits_{i\,=\,0}^1 {\mathop{\sum}\limits_{j=1}^r {{{C_{{0,1,0,i,j}}^{{\asterisk}} } \over {\mu _{k} {\plus}\kappa _{{0,i,j}}^{{\asterisk}} }}e^{{\kappa _{{0,i,j}}^{{\asterisk}} b}} } } {\plus}\mathop{\sum}\limits_{j=1}^r {{{C_{{0,0,0,0,j}}^{{\asterisk}} } \over {(\mu _{k} {\plus}\kappa _{{0,0,j}}^{{\asterisk}} )^{2} }}e^{{\kappa _{{0,0,j}}^{{\asterisk}} b}} } {\plus}{{\lambda E[Y_{1} ]} \over {\mu _{k} \delta _{3} }}{\plus}{1 \over {\mu _{k}^{2} }},\,\,\,\,\,k=1,2,\,\ldots\,,r $$
and
 $$\mathop{\sum}\limits_{i\,=\,0}^1 {\mathop{\sum}\limits_{j=1}^{r{\plus}1} {C_{{0,1,i,j}} e^{{\rho _{{0,i,j}}^{{\asterisk}} b}} } } =\mathop{\sum}\limits_{i\,=\,0}^1 {\mathop{\sum}\limits_{j=1}^r {C_{{0,1,0,i,j}}^{{\asterisk}} e^{{\kappa _{{0,i,j}}^{{\asterisk}} b}} } } {\plus}{{\lambda E[Y_{1} ]} \over {\delta _{3} }}$$
□
Theorem 9
The second moment of the aggregate discounted claims
 $$\varphi _{{\delta _{3} ,2}} (u;b)=\varphi _{{\delta _{{23}} ,0,2}} (u;b)$$
without ruin occurring is given by
$$\varphi _{{\delta _{3} ,2}} (u;b)=\varphi _{{\delta _{{23}} ,0,2}} (u;b)$$
without ruin occurring is given by
 $$\varphi _{{\delta _{3} ,2}} (u;b)=\varphi _{{L,\delta _{3} ,2}} (u;b)=\mathop{\sum}\limits_{i\,=\,0}^2 {\mathop{\sum}\limits_{j=1}^{r{\plus}1} {C_{{0,2,i,j}} e^{{\rho _{{0,i,j}}^{{\asterisk}} u}} } } ,\,\,\,\,\,0\leq u\leq b$$
and
 $$\varphi _{{\delta _{3} ,2}} (u;b)=\varphi _{{U,\delta _{3} ,2}} (u;b)=\mathop{\sum}\limits_{i\,=\,0}^2 {\mathop{\sum}\limits_{j=1}^r {C_{{0,2,0,i,j}}^{{\asterisk}} e^{{\kappa _{{0,i,j}}^{{\asterisk}} u}} } } {\plus}\theta _{{\delta _{3} ,2}} ,\,\,\,\,\,u\, \geq \, b$$
where
 $$\{ \rho _{{0,i,j}}^{{\asterisk}} \} _{{j=1}}^{{r{\plus}1}} $$
and
$$\{ \rho _{{0,i,j}}^{{\asterisk}} \} _{{j=1}}^{{r{\plus}1}} $$
and
 $\{ \kappa _{{0,i,j}}^{{\asterisk}} \} _{{j=1}}^{r} $
are Lundberg’s roots defined via (3.2). The constant term
$\{ \kappa _{{0,i,j}}^{{\asterisk}} \} _{{j=1}}^{r} $
are Lundberg’s roots defined via (3.2). The constant term
 $$\theta _{{\delta _{3} ,2}} $$
in (3.36) can be evaluated by Lemma 1 as
$$\theta _{{\delta _{3} ,2}} $$
in (3.36) can be evaluated by Lemma 1 as
 $\theta _{{\delta _{3} ,2}} =\lambda (2E[Y_{1} ]\theta _{{\delta _{3} ,1}} {\plus}E[Y_{1}^{2} ])/(2\delta _{3} )$
with
$\theta _{{\delta _{3} ,2}} =\lambda (2E[Y_{1} ]\theta _{{\delta _{3} ,1}} {\plus}E[Y_{1}^{2} ])/(2\delta _{3} )$
with
 $$\theta _{{\delta _{3} ,1}} =\lambda E[Y_{1} ]/\delta _{3} $$
. For i=0, 1, the coefficients
$$\theta _{{\delta _{3} ,1}} =\lambda E[Y_{1} ]/\delta _{3} $$
. For i=0, 1, the coefficients
 $$\{ C_{{0,2,i,j}} \} _{{j=1}}^{{r{\plus}1}} $$
and
$$\{ C_{{0,2,i,j}} \} _{{j=1}}^{{r{\plus}1}} $$
and
 $$\{ C_{{0,2,0,i,j}}^{{\asterisk}} \} _{{j=1}}^{r} $$
can be computed directly using
$$\{ C_{{0,2,0,i,j}}^{{\asterisk}} \} _{{j=1}}^{r} $$
can be computed directly using
 $$\eqalignno{ & C_{{0,2,0,j}} ={{\lambda C_{{0,1,0,j}} } \over {\delta _{3} }}\mathop{\sum}\limits_{k\,=1\,}^r {{{q_{k} \mu _{k} } \over {(\mu _{k} {\plus}\rho _{{0,0,j}}^{{\asterisk}} )^{2} }}} {\,\plus}{{\lambda C_{{0,0,0,j}} } \over {\delta _{3} }}\mathop{\sum}\limits_{k\,=1\,}^r {{{q_{k} \mu _{k} } \over {(\mu _{k} {\plus}\rho _{{0,0,j}}^{{\asterisk}} )^{3} }}} ,\,\,\,\,\,j=1,2,\,\ldots\,,r{\plus}1 \cr & \quad \quad \quad \quad \quad \quad C_{{0,2,1,j}} ={{2\lambda C_{{0,1,1,j}} } \over {\delta _{3} }}\mathop{\sum}\limits_{k\,=1\,}^r {{{q_{k} \mu _{k} } \over {(\mu _{k} {\plus}\rho _{{0,1,j}}^{{\asterisk}} )^{2} }}} ,\,\,\,\,\,j=1,2,\,\ldots\,,r{\plus}1 \cr & C_{{0,2,0,0,j}}^{{\asterisk}} ={{\lambda C_{{0,1,0,0,j}}^{{\asterisk}} } \over {\delta _{3} }}\mathop{\sum}\limits_{k\,=1\,}^r {{{q_{k} \mu _{k} } \over {(\mu _{k} {\plus}\kappa _{{0,0,j}}^{{\asterisk}} )^{2} }}} \,\,{\plus}{{\lambda C_{{0,0,0,0,j}}^{{\asterisk}} } \over {\delta _{3} }}\mathop{\sum}\limits_{k\,=1\,}^r {{{q_{k} \mu _{k} } \over {(\mu _{k} {\plus}\kappa _{{0,0,j}}^{{\asterisk}} )^{3} }}} ,\,\,\,\,\,j=1,2,\,\ldots\,,r $$
and
 $$C_{{0,2,0,1,j}}^{{\asterisk}} ={{2\lambda C_{{0,1,0,1,j}}^{{\asterisk}} } \over {\delta _{3} }}\mathop{\sum}\limits_{k\,=1\,}^r {{{q_{k} \mu _{k} } \over {(\mu _{k} {\plus}\kappa _{{0,1,j}}^{{\asterisk}} )^{2} }}} ,\,\,\,\,\,j=1,2,\,\ldots\,,r$$
where
 $$\{ C_{{0,0,0,j}} \} _{{j=1}}^{{r{\plus}1}} $$
and
$$\{ C_{{0,0,0,j}} \} _{{j=1}}^{{r{\plus}1}} $$
and
 $$\{ C_{{0,0,0,0,j}}^{{\asterisk}} \} _{{j=1}}^{r} $$
are obtainable from Lemma 5, while for i=0, 1 the coefficients
$$\{ C_{{0,0,0,0,j}}^{{\asterisk}} \} _{{j=1}}^{r} $$
are obtainable from Lemma 5, while for i=0, 1 the coefficients
 $$\{ C_{{0,1,i,j}} \} _{{j=1}}^{{r{\plus}1}} $$
and
$$\{ C_{{0,1,i,j}} \} _{{j=1}}^{{r{\plus}1}} $$
and
 $$\{ C_{{0,1,0,i,j}}^{{\asterisk}} \} _{{j=1}}^{r} $$
are obtainable from Theorem 8. Then, the coefficients
$$\{ C_{{0,1,0,i,j}}^{{\asterisk}} \} _{{j=1}}^{r} $$
are obtainable from Theorem 8. Then, the coefficients
 $$\{ C_{{0,2,2,j}} \} _{{j=1}}^{{r{\plus}1}} $$
and
$$\{ C_{{0,2,2,j}} \} _{{j=1}}^{{r{\plus}1}} $$
and
 $$\{ C_{{0,2,0,2,j}}^{{\asterisk}} \} _{{j=1}}^{r} $$
can be solved from the 2r+1 linear equations which consist of
$$\{ C_{{0,2,0,2,j}}^{{\asterisk}} \} _{{j=1}}^{r} $$
can be solved from the 2r+1 linear equations which consist of
 $$\eqalignno{ & \mathop{\sum}\limits_{i\,=\,0}^2 {\mathop{\sum}\limits_{j=1}^{r{\plus}1} {{{C_{{0,2,i,j}} } \over {\mu _{k} {\plus}\rho _{{0,i,j}}^{{\asterisk}} }}} } {\plus}\mathop{\sum}\limits_{i\,=\,0}^1 {\mathop{\sum}\limits_{j=1}^{r{\plus}1} {{{2C_{{0,1,i,j}} } \over {(\mu _{k} {\plus}\rho _{{0,i,j}}^{{\asterisk}} )^{2} }}} } {\plus}\mathop{\sum}\limits_{j=1}^{r{\plus}1} {{{2C_{{0,0,0,j}} } \over {(\mu _{k} {\plus}\rho _{{0,0,j}}^{{\asterisk}} )^{3} }}=0} ,\,\,\,\,\,k=1,2,\,\ldots\,,r $$
 $$\eqalignno{ & \mathop{\sum}\limits_{i\,=\,0}^2 {\mathop{\sum}\limits_{j=1}^{r{\plus}1} {{{C_{{0,2,i,j}} } \over {\mu _{k} {\plus}\rho _{{0,i,j}}^{{\asterisk}} }}e^{{\rho _{{0,i,j}}^{{\asterisk}} b}} } } {\plus}\mathop{\sum}\limits_{i\,=\,0}^1 {\mathop{\sum}\limits_{j=1}^{r{\plus}1} {{{2C_{{0,1,i,j}} } \over {(\mu _{k} {\plus}\rho _{{0,i,j}}^{{\asterisk}} )^{2} }}e^{{\rho _{{0,i,j}}^{{\asterisk}} b}} } } {\plus}\mathop{\sum}\limits_{j=1}^{r{\plus}1} {{{2C_{{0,0,0,j}} } \over {(\mu _{k} {\plus}\rho _{{0,0,j}}^{{\asterisk}} )^{3} }}e^{{\rho _{{0,0,j}}^{{\asterisk}} b}} } \,{\minus}\,{{\theta _{{\delta _{3} ,2}} } \over {\mu _{k} }}\,{\minus}\,{{2\theta _{{\delta _{3} ,1}} } \over {\mu _{k}^{2} }}\,{\minus}\,{2 \over {\mu _{k}^{3} }} \cr & \quad=\mathop{\sum}\limits_{i\,=\,0}^2 {\mathop{\sum}\limits_{j=1}^r {{{C_{{0,2,0,i,j}}^{{\asterisk}} } \over {\mu _{k} {\plus}\kappa _{{0,i,j}}^{{\asterisk}} }}e^{{\kappa _{{0,i,j}}^{{\asterisk}} b}} } } {\plus}\mathop{\sum}\limits_{i\,=\,0}^1 {\mathop{\sum}\limits_{j=1}^r {{{2C_{{0,1,0,i,j}}^{{\asterisk}} } \over {(\mu _{k} {\plus}\kappa _{{0,i,j}}^{{\asterisk}} )^{2} }}e^{{\kappa _{{0,i,j}}^{{\asterisk}} b}} } } {\plus}\mathop{\sum}\limits_{j=1}^r {{{2C_{{0,0,0,0,j}}^{{\asterisk}} } \over {(\mu _{k} {\plus}\kappa _{{0,0,j}}^{{\asterisk}} )^{3} }}e^{{\kappa _{{0,0,j}}^{{\asterisk}} b}} } ,\,\,\,\,\,k=1,2,\,\ldots\,,r $$
and
 $$\mathop{\sum}\limits_{i\,=\,0}^2 {\mathop{\sum}\limits_{j=1}^{r{\plus}1} {C_{{0,2,i,j}} e^{{\rho _{{0,i,j}}^{{\asterisk}} b}} } } =\mathop{\sum}\limits_{i\,=\,0}^2 {\mathop{\sum}\limits_{j=1}^r {C_{{0,2,0,i,j}}^{{\asterisk}} e^{{\kappa _{{0,i,j}}^{{\asterisk}} b}} {\plus}\theta _{{\delta _{3} ,2}} } } $$
□
3.4.
$\phi _{{\delta _{{123}} ,n,m}} (u;b)$
and
$\varphi _{{\delta _{{23}} ,n,m}} (u;b)$
when
$n = m = 1$


In the next two theorems, the procedures to find
 $\phi _{{\delta _{{123}}\! ,1,1}} (u;b)$
and
$\phi _{{\delta _{{123}}\! ,1,1}} (u;b)$
and
 $\varphi _{{\delta _{{23}}\! ,1,1}} (u;b)$
are provided. These two quantities will be useful for computing the covariance (and hence correlation) between the discounted dividends
$\varphi _{{\delta _{{23}}\! ,1,1}} (u;b)$
are provided. These two quantities will be useful for computing the covariance (and hence correlation) between the discounted dividends
 $D_{{\delta _{2} }} (\tau _{b} )$
and the aggregate discounted claims
$D_{{\delta _{2} }} (\tau _{b} )$
and the aggregate discounted claims
 $Z_{{\delta _{3} }} (\tau _{b} )=\mathop{\sum}\nolimits_{k\,=1\,}^{N(\tau _{b} )} {e^{{{\minus} \delta _{3} T_{k} }} Y_{k} } $
. Again, (3.37), (3.39), and (3.43) follow directly from Cheung et al. (Reference Cheung, Liu and Woo2015, equations (50)–(52)).
$Z_{{\delta _{3} }} (\tau _{b} )=\mathop{\sum}\nolimits_{k\,=1\,}^{N(\tau _{b} )} {e^{{{\minus} \delta _{3} T_{k} }} Y_{k} } $
. Again, (3.37), (3.39), and (3.43) follow directly from Cheung et al. (Reference Cheung, Liu and Woo2015, equations (50)–(52)).
Theorem 10
The Gerber–Shiu function
 $$\phi _{{\delta _{{123}} ,1,1}} (u;b)$$
is given by
$$\phi _{{\delta _{{123}} ,1,1}} (u;b)$$
is given by
 $$\phi _{{\delta _{{123}} ,1,1}} (u;b)=\phi _{{L,\delta _{{123}} ,1,1}} (u;b)=\mathop{\sum}\limits_{i\,=\,0}^1 {\mathop{\sum}\limits_{j=1}^{r{\plus}1} {A_{{1,1,i,j}} e^{{\rho _{{1,i,j}} u}} } } ,\,\,\,\,\,0\leq u\leq b$$
and
 $$\phi _{{\delta _{{123}} ,1,1}} (u;b)=\phi _{{U,\delta _{{123}} ,1,1}} (u;b)=\mathop{\sum}\limits_{l=0}^1 {\mathop{\sum}\limits_{i\,=\,0}^1 {\mathop{\sum}\limits_{j=1}^r {A_{{1,1,l,i,j}}^{{\asterisk}} e^{{\kappa _{{l,i,j}} u}} } } } ,\,\,\,\,\,u\, \geq \, b$$
where
 $$\{ \rho _{{1,i,j}} \} _{{j=1}}^{{r{\plus}1}} $$
and
$$\{ \rho _{{1,i,j}} \} _{{j=1}}^{{r{\plus}1}} $$
and
 $\{ \kappa _{{l,i,j}} \} _{{j=1}}^{r} $
are Lundberg’s roots defined via (3.2). The coefficients
$\{ \kappa _{{l,i,j}} \} _{{j=1}}^{r} $
are Lundberg’s roots defined via (3.2). The coefficients
 $$\{ A_{{1,1,0,j}} \} _{{j=1}}^{{r{\plus}1}} $$
,
$$\{ A_{{1,1,0,j}} \} _{{j=1}}^{{r{\plus}1}} $$
,
 $$\{ A_{{1,1,0,i,j}}^{{\asterisk}} \} _{{j=1}}^{r} $$
(for i=0, 1) and
$$\{ A_{{1,1,0,i,j}}^{{\asterisk}} \} _{{j=1}}^{r} $$
(for i=0, 1) and
 $$\{ A_{{1,1,1,0,j}}^{{\asterisk}} \} _{{j=1}}^{r} $$
can be computed directly using
$$\{ A_{{1,1,1,0,j}}^{{\asterisk}} \} _{{j=1}}^{r} $$
can be computed directly using
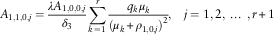 $$A_{{1,1,0,j}} ={{\lambda A_{{1,0,0,j}} } \over {\delta _{3} }}\mathop{\sum}\limits_{k\,=1\,}^r {{{q_{k} \mu _{k} } \over {(\mu _{k} {\plus}\rho _{{1,0,j}} )^{2} }}} ,\,\,\,\,\,j=1,2,\,\ldots\,,r{\plus}1$$
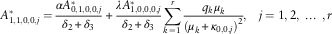 $$A_{{1,1,0,0,j}}^{{\asterisk}} ={{\alpha A_{{0,1,0,0,j}}^{{\asterisk}} } \over {\delta _{2} {\plus}\delta _{3} }}{\plus}{{\lambda A_{{1,0,0,0,j}}^{{\asterisk}} } \over {\delta _{2} {\plus}\delta _{3} }}\mathop{\sum}\limits_{k\,=1\,}^r {{{q_{k} \mu _{k} } \over {(\mu _{k} {\plus}\kappa _{{0,0,j}} )^{2} }}} ,\,\,\,\,\,j=1,2,\,\ldots\,,r$$
 $$A_{{1,1,0,1,j}}^{{\asterisk}} ={\alpha \over {\delta _{2} }}A_{{0,1,0,1,j}}^{{\asterisk}} ,\,\,\,\,\,j=1,2,\,\ldots\,,r$$
and
 $$A_{{1,1,1,0,j}}^{{\asterisk}} ={{\lambda A_{{1,0,1,0,j}}^{{\asterisk}} } \over {\delta _{3} }}\mathop{\sum}\limits_{k\,=1\,}^r {{{q_{k} \mu _{k} } \over {(\mu _{k} {\plus}\kappa _{{1,0,j}} )^{2} }}} ,\,\,\,\,\,j=1,2,\,\ldots\,,r$$
where
 $$\{ A_{{1,0,0,j}} \} _{{j=1}}^{{r{\plus}1}} $$
and
$$\{ A_{{1,0,0,j}} \} _{{j=1}}^{{r{\plus}1}} $$
and
 $$\{ A_{{1,0,i,0,j}}^{{\asterisk}} \} _{{j=1}}^{r} $$
(for i=0, 1) are obtainable from Theorem 4, while
$$\{ A_{{1,0,i,0,j}}^{{\asterisk}} \} _{{j=1}}^{r} $$
(for i=0, 1) are obtainable from Theorem 4, while
 $$\{ A_{{0,1,0,i,j}}^{{\asterisk}} \} _{{j=1}}^{r} $$
(for i=0, 1) are obtainable from Theorem 6. Then the coefficients
$$\{ A_{{0,1,0,i,j}}^{{\asterisk}} \} _{{j=1}}^{r} $$
(for i=0, 1) are obtainable from Theorem 6. Then the coefficients
 $$\{ A_{{1,1,1,j}} \} _{{j=1}}^{{r{\plus}1}} $$
and
$$\{ A_{{1,1,1,j}} \} _{{j=1}}^{{r{\plus}1}} $$
and
 $$\{ A_{{1,1,1,1,j}}^{{\asterisk}} \} _{{j=1}}^{r} $$
can be solved from the 2r+1 linear equations which consist of
$$\{ A_{{1,1,1,1,j}}^{{\asterisk}} \} _{{j=1}}^{r} $$
can be solved from the 2r+1 linear equations which consist of
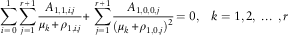 $$\mathop{\sum}\limits_{i\,=\,0}^1 {\mathop{\sum}\limits_{j=1}^{r{\plus}1} {{{A_{{1,1,i,j}} } \over {\mu _{k} {\plus}\rho _{{1,i,j}} }}} } {\plus}\mathop{\sum}\limits_{j=1}^{r{\plus}1} {{{A_{{1,0,0,j}} } \over {(\mu _{k} {\plus}\rho _{{1,0,j}} )^{2} }}=0} ,\,\,\,\,\,k=1,2,\,\ldots\,,r$$
 $$\eqalignno{ & \mathop{\sum}\limits_{i\,=\,0}^1 {\mathop{\sum}\limits_{j=1}^{r{\plus}1} {{{A_{{1,1,i,j}} } \over {\mu _{k} {\plus}\rho _{{1,i,j}} }}e^{{\rho _{{1,i,j}} b}} } } {\plus}\mathop{\sum}\limits_{j=1}^{r{\plus}1} {{{A_{{1,0,0,j}} } \over {(\mu _{k} {\plus}\rho _{{1,0,j}} )^{2} }}e^{{\rho _{{1,0,j}} b}} } \cr & =\mathop{\sum}\limits_{l=0}^1 {\mathop{\sum}\limits_{i\,=\,0}^1 {\mathop{\sum}\limits_{j=1}^r {{{A_{{1,1,l,i,j}}^{{\asterisk}} } \over {\mu _{k} {\plus}\kappa _{{l,i,j}} }}e^{{\kappa _{{l,i,j}} b}} } } } {\plus}\mathop{\sum}\limits_{i\,=\,0}^1 {\mathop{\sum}\limits_{j=1}^r {{{A_{{1,0,i,0,j}}^{{\asterisk}} } \over {(\mu _{k} {\plus}\kappa _{{i,0,j}} )^{2} }}e^{{\kappa _{{i,0,j}} b}} } } ,\,\,\,\,\,k=1,2,\,\ldots\,,r $$
and
 $$\mathop{\sum}\limits_{i\,=\,0}^1 {\mathop{\sum}\limits_{j=1}^{r{\plus}1} {A_{{1,1,i,j}} e^{{\rho _{{1,i,j}} b}} } } =\mathop{\sum}\limits_{l=0}^1 {\mathop{\sum}\limits_{i\,=\,0}^1 {\mathop{\sum}\limits_{j=1}^r {A_{{1,1,l,i,j}}^{{\asterisk}} e^{{\kappa _{{l,i,j}} b}} } } } $$
□
Theorem 11
The first joint moment of the discounted dividends and the aggregate discounted claims
 $\varphi _{{\delta _{{23}} ,1,1}} (u;b)$
without ruin occurring is given by
$\varphi _{{\delta _{{23}} ,1,1}} (u;b)$
without ruin occurring is given by
 $$\varphi _{{\delta _{{23}} ,1,1}} (u;b)=\varphi _{{L,\delta _{{23}} ,1,1}} (u;b)=\mathop{\sum}\limits_{i\,=\,0}^1 {\mathop{\sum}\limits_{j=1}^{r{\plus}1} {C_{{1,1,i,j}} e^{{\rho _{{1,i,j}}^{{\asterisk}} u}} } } ,\,\,\,\,\,0\leq u\leq b$$
and
 $$\varphi _{{\delta _{{23}} ,1,1}} (u;b)=\varphi _{{U,\delta _{{23}} ,1,1}} (u;b)=\mathop{\sum}\limits_{l=0}^1 {\mathop{\sum}\limits_{i\,=\,0}^1 {\mathop{\sum}\limits_{j=1}^r {C_{{1,1,l,i,j}}^{{\asterisk}} e^{{\kappa _{{l,i,j}}^{{\asterisk}} u}} {\plus}{{\alpha \lambda E[Y_{1} ]} \over {\delta _{2} \delta _{3} }}} } } ,\,\,\,\,\,u\, \geq \, b$$
where
 $$\{ \rho _{{1,i,j}}^{{\asterisk}} \} _{{j=1}}^{{r{\plus}1}} $$
and
$$\{ \rho _{{1,i,j}}^{{\asterisk}} \} _{{j=1}}^{{r{\plus}1}} $$
and
 $\{ \kappa _{{l,i,j}}^{{\asterisk}} \} _{{j=1}}^{r} $
are Lundberg’s roots defined via (3.2). The coefficients
$\{ \kappa _{{l,i,j}}^{{\asterisk}} \} _{{j=1}}^{r} $
are Lundberg’s roots defined via (3.2). The coefficients
 $$\{ C_{{1,1,0,j}} \} _{{j=1}}^{{r{\plus}1}} $$
,
$$\{ C_{{1,1,0,j}} \} _{{j=1}}^{{r{\plus}1}} $$
,
 $$\{ C_{{1,1,0,i,j}}^{{\asterisk}} \} _{{j=1}}^{r} $$
(for i=0, 1) and
$$\{ C_{{1,1,0,i,j}}^{{\asterisk}} \} _{{j=1}}^{r} $$
(for i=0, 1) and
 $$\{ C_{{1,1,1,0,j}}^{{\asterisk}} \} _{{j=1}}^{r} $$
can be computed directly using
$$\{ C_{{1,1,1,0,j}}^{{\asterisk}} \} _{{j=1}}^{r} $$
can be computed directly using
 $$\eqalignno{ & C_{{1,1,0,j}} ={{\lambda C_{{1,0,0,j}} } \over {\delta _{3} }}\mathop{\sum}\limits_{k\,=1\,}^r {{{q_{k} \mu _{k} } \over {(\mu _{k} {\plus}\rho _{{1,0,j}}^{{\asterisk}} )^{2} }}} ,\,\,\,\,\,j=1,2,\,\ldots\,,r{\plus}1 \cr & C_{{1,1,0,0,j}}^{{\asterisk}} ={{\alpha C_{{0,1,0,0,j}}^{{\asterisk}} } \over {\delta _{2} {\plus}\delta _{3} }}{\plus}{{\lambda C_{{1,0,0,0,j}}^{{\asterisk}} } \over {\delta _{2} {\plus}\delta _{3} }}\mathop{\sum}\limits_{k\,=1\,}^r {{{q_{k} \mu _{k} } \over {(\mu _{k} {\plus}\kappa _{{0,0,j}}^{{\asterisk}} )^{2} }}} ,\,\,\,\,\,j=1,2,\,\ldots\,,r \cr & C_{{1,1,0,1,j}}^{{\asterisk}} ={\alpha \over {\delta _{2} }}C_{{0,1,0,1,j}}^{{\asterisk}} ,\,\,\,\,\,j=1,2,\,\ldots\,,r $$
and
 $$C_{{1,1,1,0,j}}^{{\asterisk}} ={{\lambda C_{{1,0,1,0,j}}^{{\asterisk}} } \over {\delta _{3} }}\mathop{\sum}\limits_{k\,=1\,}^r {{{q_{k} \mu _{k} } \over {(\mu _{k} {\plus}\kappa _{{1,0,j}}^{{\asterisk}} )^{2} }}} ,\,\,\,\,\,j=1,2,\,\ldots\,,r$$
where
 $$\{ C_{{1,0,0,j}} \} _{{j=1}}^{{r{\plus}1}} $$
and
$$\{ C_{{1,0,0,j}} \} _{{j=1}}^{{r{\plus}1}} $$
and
 $$\{ C_{{1,0,i,0,j}}^{{\asterisk}} \} _{{j=1}}^{r} $$
(for i=0, 1) are obtainable from Theorem 5, while
$$\{ C_{{1,0,i,0,j}}^{{\asterisk}} \} _{{j=1}}^{r} $$
(for i=0, 1) are obtainable from Theorem 5, while
 $$\{ C_{{0,1,0,i,j}}^{{\asterisk}} \} _{{j=1}}^{r} $$
(for i=0, 1) are obtainable from Theorem 8. Then the coefficients
$$\{ C_{{0,1,0,i,j}}^{{\asterisk}} \} _{{j=1}}^{r} $$
(for i=0, 1) are obtainable from Theorem 8. Then the coefficients
 $$\{ C_{{1,1,1,j}} \} _{{j=1}}^{{r{\plus}1}} $$
and
$$\{ C_{{1,1,1,j}} \} _{{j=1}}^{{r{\plus}1}} $$
and
 $$\{ C_{{1,1,1,1,j}}^{{\asterisk}} \} _{{j=1}}^{r} $$
can be solved from the 2r+1 linear equations which consist of
$$\{ C_{{1,1,1,1,j}}^{{\asterisk}} \} _{{j=1}}^{r} $$
can be solved from the 2r+1 linear equations which consist of
 $$\eqalignno{ & \mathop{\sum}\limits_{i\,=\,0}^1 {\mathop{\sum}\limits_{j=1}^{r{\plus}1} {{{C_{{1,1,i,j}} } \over {\mu _{k} {\plus}\rho _{{1,i,j}}^{{\asterisk}} }}} } {\plus}\mathop{\sum}\limits_{j=1}^{r{\plus}1} {{{C_{{1,0,0,j}} } \over {(\mu _{k} {\plus}\rho _{{1,0,j}}^{{\asterisk}} )^{2} }}} =0,\,\,\,\,\,k=1,2,\,\ldots\,,r \cr & \mathop{\sum}\limits_{i\,=\,0}^1 {\mathop{\sum}\limits_{j=1}^{r{\plus}1} {{{C_{{1,1,i,j}} } \over {\mu _{k} {\plus}\rho _{{1,i,j}}^{{\asterisk}} }}e^{{\rho _{{1,i,j}}^{{\asterisk}} b}} } } {\plus}\mathop{\sum}\limits_{j=1}^{r{\plus}1} {{{C_{{1,0,0,j}} } \over {(\mu _{k} {\plus}\rho _{{1,0,j}}^{{\asterisk}} )^{2} }}e^{{\rho _{{1,0,j}}^{{\asterisk}} b}} } \cr & =\mathop{\sum}\limits_{l=0}^1 {\mathop{\sum}\limits_{i\,=\,0}^1 {\mathop{\sum}\limits_{j=1}^r {{{C_{{1,1,l,i,j}}^{{\asterisk}} } \over {\mu _{k} {\plus}\kappa _{{l,i,j}}^{{\asterisk}} }}e^{{\kappa _{{l,i,j}}^{{\asterisk}} b}} } } } {\plus}\mathop{\sum}\limits_{i\,=\,0}^1 {\mathop{\sum}\limits_{j=1}^r {{{C_{{1,0,i,0,j}}^{{\asterisk}} } \over {(\mu _{k} {\plus}\kappa _{{i,0,j}}^{{\asterisk}} )^{2} }}e^{{\kappa _{{i,0,j}}^{{\asterisk}} b}} } } {\plus}{{\alpha \lambda E[Y_{1} ]} \over {\mu _{k} \delta _{2} \delta _{3} }}{\plus}{\alpha \over {\mu _{k}^{2} \delta _{2} }},\,\,\,\,\,k=1,2,\,\ldots\,,r $$
and
 $$\mathop{\sum}\limits_{i\,=\,0}^1 {\mathop{\sum}\limits_{j=1}^{r{\plus}1} {C_{{1,1,i,j}} e^{{\rho _{{1,i,j}}^{{\asterisk}} b}} } } =\mathop{\sum}\limits_{l=0}^1 {\mathop{\sum}\limits_{i\,=\,0}^1 {\mathop{\sum}\limits_{j=1}^r {C_{{1,1,l,i,j}}^{{\asterisk}} e^{{\kappa _{{l,i,j}}^{{\asterisk}} b}} } } } {\plus}{{\alpha \lambda E[Y_{1} ]} \over {\delta _{2} \delta _{3} }}$$
□
Remark 8
From the statements of the theorems in this section, it is important to note the recursive nature of the determination of the coefficients involved in the solution forms (3.3)–(3.6). For example, the computational steps required to calculate
 $$\phi _{{\delta _{{123}} ,1,1}} (u;b)$$
via Theorem 10 involve the use of earlier lemma and theorems, and these are summarised as follows:
$$\phi _{{\delta _{{123}} ,1,1}} (u;b)$$
via Theorem 10 involve the use of earlier lemma and theorems, and these are summarised as follows:
-
1. For each fixed l=1, 2 and n, m=0, 1, we solve the Lundberg’s equation (3.2), which has r+1 roots, i.e. the equation is solved eight times. When l=1 the roots are denoted by
$$\{ \rho _{{n,m,j}} \} _{{j=1}}^{{r{\plus}1}} $$
, but when l=2 they are denoted by
$$\{ \kappa _{{n,m,j}} \} _{{j=1}}^{{r{\plus}1}} $$
and the non-negative root
$\kappa _{{n,m,r{\plus}1}} $
is discarded. -
2. Obtain
$$\{ A_{{0,0,0,j}} \} _{{j=1}}^{{r{\plus}1}} $$
and
$$\{ A_{{0,0,0,0,j}}^{{\asterisk}} \} _{{j=1}}^{r} $$
from Lemma 4 by solving the linear equations (3.9)–(3.11). -
3. Apply the special case of Theorem 4 under n=1, where
$$\{ A_{{1,0,0,j}} \} _{{j=1}}^{{r{\plus}1}} $$
and
$$\{ A_{{1,0,i,0,j}}^{{\asterisk}} \} _{{j=1}}^{r} $$
(for i=0, 1) are computed from (3.15) and the linear system (3.16)–(3.18). -
4. Use Theorem 6 to compute
$$\{ A_{{0,1,i,j}} \} _{{j=1}}^{{r{\plus}1}} $$
and
$$\{ A_{{0,1,0,i,j}}^{{\asterisk}} \} _{{j=1}}^{r} $$
(both for i=0, 1) via (3.27) and (3.28) along with the linear system (3.29)–(3.31). (Although
$$A_{{0,1,i,j}} $$
’s are not needed in the next step, they have to be determined together with
$$A_{{0,1,0,1,j}}^{{\asterisk}} $$
’s.) -
5. Utilise Theorem 10 to calculate
$$\{ A_{{1,1,i,j}} \} _{{j=1}}^{{r{\plus}1}} $$
(for i=0, 1) and
$$\{ A_{{1,1,l,i,j}}^{{\asterisk}} \} _{{j=1}}^{r} $$
(for l, i=0, 1) via (3.39)–(3.42) and the linear system (3.43)–(3.45), so that
$\phi _{{\delta _{{123}} ,1,1}} (u;b)$
is finally evaluated with (3.37) and (3.38).□


Remark 9
Following the proof of Theorem 4 in the Appendix, it is noted that the exact value of the limit
 ${{\rm lim}}_{u\to\infty} \phi _{{\delta _{{12}} ,1}} (u;b)$
is indeed not required for deriving the full solution to
${{\rm lim}}_{u\to\infty} \phi _{{\delta _{{12}} ,1}} (u;b)$
is indeed not required for deriving the full solution to
 $\phi _{{\delta _{{12}} ,1}} (u;b)$
. We only need the finiteness of the limit to conclude that the coefficient of the exponential term
$\phi _{{\delta _{{12}} ,1}} (u;b)$
. We only need the finiteness of the limit to conclude that the coefficient of the exponential term
 $$e^{{\kappa _{{1,0,r{\plus}1}} u}} $$
is 0 as
$$e^{{\kappa _{{1,0,r{\plus}1}} u}} $$
is 0 as
 $\kappa _{{1,0,r{\plus}1}}\, \gt \,0$
, and then from (3.14) the limit
$\kappa _{{1,0,r{\plus}1}}\, \gt \,0$
, and then from (3.14) the limit
 ${{\rm lim}}_{u\to\infty} \,\phi _{{\delta _{{12}} ,1}} (u;b)$
must equal 0 as
${{\rm lim}}_{u\to\infty} \,\phi _{{\delta _{{12}} ,1}} (u;b)$
must equal 0 as
 $\kappa _{{1,0,j}} $
has negative real part for j=1, 2, …, r. This is also true for the proof of Theorem 5, except that the final term in (3.20) (when n=1) obtainable via equating the constant term in (A.17) is non-zero (and it automatically satisfies the limiting value
$\kappa _{{1,0,j}} $
has negative real part for j=1, 2, …, r. This is also true for the proof of Theorem 5, except that the final term in (3.20) (when n=1) obtainable via equating the constant term in (A.17) is non-zero (and it automatically satisfies the limiting value
 ${{\rm lim}}_{u\to\infty} \, \varphi _{{\delta _{2} ,1}} (u;b)$
suggested by Lemma 2). The same comments are also applicable to Theorems 6–11 (although the proofs of Theorems 7–11 have been omitted).□
${{\rm lim}}_{u\to\infty} \, \varphi _{{\delta _{2} ,1}} (u;b)$
suggested by Lemma 2). The same comments are also applicable to Theorems 6–11 (although the proofs of Theorems 7–11 have been omitted).□
4. Numerical Examples
In this section, the results in section 3 are applied to compute the correlations involving the total discounted dividends until ruin
 $D_{{\delta _{2} }} (\tau _{b} )$
, the aggregate discounted claim amount until ruin
$D_{{\delta _{2} }} (\tau _{b} )$
, the aggregate discounted claim amount until ruin
 $\mathop{\sum}\nolimits_{k\,=1\,}^{N(\tau _{b} )} {e^{{{\minus} \delta _{3} T_{k} }} Y_{k} } $
, and the time of ruin
$\mathop{\sum}\nolimits_{k\,=1\,}^{N(\tau _{b} )} {e^{{{\minus} \delta _{3} T_{k} }} Y_{k} } $
, and the time of ruin
 $$\tau _{b} $$
(which is considered only when ruin occurs). Hence, we assume a cost function of f(y)=y (i.e.,
$$\tau _{b} $$
(which is considered only when ruin occurs). Hence, we assume a cost function of f(y)=y (i.e.,
 $$Z_{{\delta _{3} }} (\tau _{b} )=\mathop{\sum}\nolimits_{k\,=1\,}^{N(\tau _{b} )} e^{{{\minus} \delta _{3} T_{k} }} Y_{k} $$
) and a penalty of w≡1 throughout this section. With initial surplus U
b
(0)=u and threshold level b, for notational convenience we denote the unconditional expectation of a random variable X by E[X∣u;b], and we shall use E
r
[X∣u;b] (E
s
[X∣u;b], respectively) to denote the expectation of X conditional on the event
$$Z_{{\delta _{3} }} (\tau _{b} )=\mathop{\sum}\nolimits_{k\,=1\,}^{N(\tau _{b} )} e^{{{\minus} \delta _{3} T_{k} }} Y_{k} $$
) and a penalty of w≡1 throughout this section. With initial surplus U
b
(0)=u and threshold level b, for notational convenience we denote the unconditional expectation of a random variable X by E[X∣u;b], and we shall use E
r
[X∣u;b] (E
s
[X∣u;b], respectively) to denote the expectation of X conditional on the event
 $\{ \tau _{b} \,\lt \, \infty\} $
(
$\{ \tau _{b} \,\lt \, \infty\} $
(
 $$\{ \tau _{b} =\infty\} $$
, respectively). The subscripts “r” and “s” correspond to “ruin” and “survival”, respectively. Clearly, one has
$$\{ \tau _{b} =\infty\} $$
, respectively). The subscripts “r” and “s” correspond to “ruin” and “survival”, respectively. Clearly, one has
 $$E_{r} [X \!\! \mid \! \! u;b]={{E[X1_{{\{ \tau _{b} \,\lt \, \infty\} }} \! \! \mid \! \! u;b]} \over {\psi (u;b)}}$$
and
 $$E_{s} [X \! \! \mid \! \! u;b]={{E[X1_{{\{ \tau _{b} =\infty\} }} \! \! \mid \! \! u;b]} \over {\varphi (u;b)}}$$
where
 $\psi (u;b)$
and
$\psi (u;b)$
and
 $$\varphi (u;b)$$
are the ruin probability and survival probability, respectively. Then the correlation of the random variables X
1 and X
2 is given by
$$\varphi (u;b)$$
are the ruin probability and survival probability, respectively. Then the correlation of the random variables X
1 and X
2 is given by
 $${\rm Corr}_{{\bullet}} (X_{1} ,X_{2} \! \! \mid \! \! u;b)={{{\rm Cov}_{{\bullet}} (X_{1} ,X_{2} \! \! \mid \! \! u;b)} \over {\sqrt {{\rm Var}_{{\bullet}} (X_{1} \! \! \mid \! \! u;b){\rm Var}_{{\bullet}} (X_{2} \! \! \mid \! \! u;b)} }}$$
where
 $${\rm Cov}_{{\bullet}} (X_{1} ,X_{2} \! \! \mid \! \! u;b)=E_{{\bullet}} [X_{1} X_{2} \! \! \mid \! \! u;b]\,{\minus}\,E_{{\bullet}} [X_{1} \! \! \mid \! \! u;b]E_{{\bullet}} [X_{2} \! \! \mid \! \! u;b]$$
is the covariance of X 1 and X 2, and
 $${\rm Var}_{{\bullet}} (X \! \! \mid \! \! u;b)=E_{{\bullet}} [X^{2} \! \! \mid \! \! u;b]\,{\minus}\,(E_{{\bullet}} [X \! \! \mid \! \! u;b])^{2} $$
is the variance of X. Here the expectation E∙ can be the unconditional expectation E or the conditional expectations E
r
or E
s
, and this applies to other moment-based quantities as well. All intermediate quantities required in our computation involving
 $\tau _{b} $
,
$\tau _{b} $
,
 $D_{{\delta _{2} }} (\tau _{b} )$
and
$D_{{\delta _{2} }} (\tau _{b} )$
and
 $Z_{{\delta _{3} }} (\tau _{b} )$
are obtainable from the Gerber–Shiu function
$Z_{{\delta _{3} }} (\tau _{b} )$
are obtainable from the Gerber–Shiu function
 $\phi _{{\delta _{1} ,\delta _{2} ,\delta _{3} ,n,m}} (u;b)=\phi _{{\delta _{{123}} ,n,m}} (u;b)$
in (1.5) and the joint moment
$\phi _{{\delta _{1} ,\delta _{2} ,\delta _{3} ,n,m}} (u;b)=\phi _{{\delta _{{123}} ,n,m}} (u;b)$
in (1.5) and the joint moment
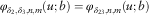 $$\varphi _{{\delta _{2} ,\delta _{3} ,n,m}} (u;b)=\varphi _{{\delta _{{23}} ,n,m}} (u;b)$$
in (1.6). For example, the first joint moment
$$\varphi _{{\delta _{2} ,\delta _{3} ,n,m}} (u;b)=\varphi _{{\delta _{{23}} ,n,m}} (u;b)$$
in (1.6). For example, the first joint moment
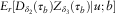 $E_{r} [D_{{\delta _{2} }} (\tau _{b} )Z_{{\delta _{3} }} (\tau _{b} ) \! \! \mid \! u;b]$
conditional on ruin is the ratio of
$E_{r} [D_{{\delta _{2} }} (\tau _{b} )Z_{{\delta _{3} }} (\tau _{b} ) \! \! \mid \! u;b]$
conditional on ruin is the ratio of
 $E[D_{{\delta _{2} }} (\tau _{b} )Z_{{\delta _{3} }} (\tau _{b} )1_{{\{ \tau _{b} \,\lt \, \infty\} }} \! \! \mid \! \! u;b]=\phi _{{\delta _{{123}} ,1,1}} (u;b) \! \! \mid _{{\delta _{1} \,=\,0}} $
to
$E[D_{{\delta _{2} }} (\tau _{b} )Z_{{\delta _{3} }} (\tau _{b} )1_{{\{ \tau _{b} \,\lt \, \infty\} }} \! \! \mid \! \! u;b]=\phi _{{\delta _{{123}} ,1,1}} (u;b) \! \! \mid _{{\delta _{1} \,=\,0}} $
to
 $\psi (u;b)=\phi _{{\delta _{1} }} (u;b) \! \! \mid _{{\delta _{1} \,=\,0}} $
, which can be evaluated using Theorem 10 and Lemma 4. Similarly, the first joint moment
$\psi (u;b)=\phi _{{\delta _{1} }} (u;b) \! \! \mid _{{\delta _{1} \,=\,0}} $
, which can be evaluated using Theorem 10 and Lemma 4. Similarly, the first joint moment
 $E_{s} [D_{{\delta _{2} }} (\tau _{b} )Z_{{\delta _{3} }} (\tau _{b} ) \! \! \mid \! u;b]$
conditional on survival follows from
$E_{s} [D_{{\delta _{2} }} (\tau _{b} )Z_{{\delta _{3} }} (\tau _{b} ) \! \! \mid \! u;b]$
conditional on survival follows from
 $E[D_{{\delta _{2} }} (\tau _{b} )Z_{{\delta _{3} }} (\tau _{b} )1_{{\{ \tau _{b}\, =\,\infty\} }} \! \! \mid \!\! u;b]=\varphi _{{\delta _{{23}} ,1,1}} (u;b)$
(that is available in Theorem 11) and
$E[D_{{\delta _{2} }} (\tau _{b} )Z_{{\delta _{3} }} (\tau _{b} )1_{{\{ \tau _{b}\, =\,\infty\} }} \! \! \mid \!\! u;b]=\varphi _{{\delta _{{23}} ,1,1}} (u;b)$
(that is available in Theorem 11) and
 $\varphi (u;b)=1\,{\minus}\,\psi (u;b)$
. The unconditional first joint moment
$\varphi (u;b)=1\,{\minus}\,\psi (u;b)$
. The unconditional first joint moment
 $E[D_{{\delta _{2} }} (\tau _{b} )Z_{{\delta _{3} }} (\tau _{b} ) \! \! \mid \! u;b]$
is given by (1.7) when n=m=1. It is instructive to note that correlations in relation to
$E[D_{{\delta _{2} }} (\tau _{b} )Z_{{\delta _{3} }} (\tau _{b} ) \! \! \mid \! u;b]$
is given by (1.7) when n=m=1. It is instructive to note that correlations in relation to
 $\tau _{b} $
only exist when
$\tau _{b} $
only exist when
 $\tau _{b} \,\lt \, \infty$
, and the (joint) moments involving
$\tau _{b} \,\lt \, \infty$
, and the (joint) moments involving
 $\tau _{b} $
can be obtained from
$\tau _{b} $
can be obtained from
 $\phi _{{\delta _{{123}} ,n,m}} (u;b)$
. For example, one has
$\phi _{{\delta _{{123}} ,n,m}} (u;b)$
. For example, one has
 $$E_{r} [\tau _{b} Z_{{\delta _{3} }} (\tau _{b} ) \! \! \mid \! u;b]={{E[\tau _{b} Z_{{\delta _{3} }} (\tau _{b} )1_{{\{ \tau _{b} \,\lt \, \infty\} }} \! \! \mid \! u;b]} \over {\psi (u;b)}}=\,{\minus}\,{{{\partial \over {\partial \delta _{1} }}\phi _{{\delta _{{123}} \!,0,1}} (u;b) \! \! \mid _{{\delta _{1} \,=\,0}} } \over {\psi (u;b)}}$$
Before discussing specific examples, we first note that in general the relationship
 $$u{\plus}c\tau _{b} {\plus} \! \! \mid \! \! U_{b} (\tau _{b} ) \! \! \mid \! \; =D(\tau _{b} ){\plus}S(\tau _{b} )\,{\rm on}\,{\rm the}\,{\rm set}\,\{ \tau _{b} \,\lt \, \infty\} $$
among the random variables is valid for sample paths leading to ruin, where
 $D(\tau _{b} )$
is the total dividends paid until ruin and
$D(\tau _{b} )$
is the total dividends paid until ruin and
 $S(\tau _{b} )=\mathop{\sum}\nolimits_{k\,=1\,}^{N(\tau _{b} )} {Y_{k} } $
is the aggregate claims until ruin (both without discounting). For these sample paths, it is clear that
$S(\tau _{b} )=\mathop{\sum}\nolimits_{k\,=1\,}^{N(\tau _{b} )} {Y_{k} } $
is the aggregate claims until ruin (both without discounting). For these sample paths, it is clear that
 $$D(\tau _{b} )\leq \alpha \tau _{b} \,{\rm on}\,{\rm the}\,{\rm set}\,\{ \tau _{b} \,\lt \, \infty\} $$
and therefore
 $$S(\tau _{b} )\, \geq \, u{\plus}c_{2} \tau _{b} {\plus} \! \! \mid \! \! U_{b} (\tau _{b} ) \! \! \mid \! \! \,{\rm on}\,{\rm the}\,{\rm set}\,\{ \tau _{b} \,\lt \, \infty\} $$
On the other hand, concerning the sample paths for which the process survives, one has that
 $$D(t){\plus}S(t)\leq u{\plus}ct\,{\rm for}\,{\rm all}\,t\, \geq \, 0\,{\rm on}\,{\rm the}\,{\rm set}\,\{ \tau _{b} =\infty\} $$
The parameter values that are used for all numerical illustrations are summarised in Table 1. In each subsequent figure, the quantity of interest is plotted against the initial surplus level u under three different claim size distributions, namely
-
i. a sum of two exponentials (“Sum Exp”) with density p(y)=3e −(3/2)y −3e −3y ;
-
ii. an exponential distribution (“Exp”) with density p(y)=e −y ; and
-
iii. a mixture of two exponentials (“Mixed Exp”) with density p(y)=(1/6)e −(1/2)y +(4/3)e −2y .
Parameters used in all numerical examples.

All these distributions belong to the class of combinations of exponentials (see (3.1)) and have the same mean of 1 (and the loading condition
 $c_{2} \gt \lambda E[Y_{1} ]$
holds true). However, they have different amount of variability as evident in their variances of 0.56, 1, and 2, respectively. The curves corresponding to the above claim distributions are marked in solid, dashed, and dotted lines, respectively.
$c_{2} \gt \lambda E[Y_{1} ]$
holds true). However, they have different amount of variability as evident in their variances of 0.56, 1, and 2, respectively. The curves corresponding to the above claim distributions are marked in solid, dashed, and dotted lines, respectively.
Conditional on ruin occurring, Figures 1–3 show how the pairwise correlations of
 $\tau _{{10}} $
and
$\tau _{{10}} $
and
 $Z_{{0.01}} (\tau _{{10}} )$
and
$Z_{{0.01}} (\tau _{{10}} )$
and
 $D_{{0.01}} (\tau _{{10}} )$
vary with u for 0≤u≤200. (For simplicity, we shall write
$D_{{0.01}} (\tau _{{10}} )$
vary with u for 0≤u≤200. (For simplicity, we shall write
 $\tau $
, Z, and D instead of
$\tau $
, Z, and D instead of
 $\tau _{{10}} $
,
$\tau _{{10}} $
,
 $Z_{{0.01}} (\tau _{{10}} )$
, and
$Z_{{0.01}} (\tau _{{10}} )$
, and
 $D_{{0.01}} (\tau _{{10}} )$
, respectively, in the y-axis of the plots.) From Figure 1, it is observed that
$D_{{0.01}} (\tau _{{10}} )$
, respectively, in the y-axis of the plots.) From Figure 1, it is observed that
 ${\rm Corr}_{r} (\tau _{{10}} ,Z_{{0.01}} (\tau _{{10}} ) \! \! \mid \! \! u;10)$
for all three claim distributions is of the same shape. Specifically,
${\rm Corr}_{r} (\tau _{{10}} ,Z_{{0.01}} (\tau _{{10}} ) \! \! \mid \! \! u;10)$
for all three claim distributions is of the same shape. Specifically,
 ${\rm Corr}_{r} (\tau _{{10}} ,Z_{{0.01}} (\tau _{{10}} ) \! \! \mid \! \! u;10)$
starts with a positive value of over 0.9, and it decreases as u increases and then becomes negative when u reaches approximately 95. This complements figures 1 and 2 in Cheung & Woo (Reference Cheung and Feng2016), which demonstrated a sign change of the covariance of the ruin time and the aggregate discounted claims until ruin in a dependent Sparre Andersen risk model without dividends as u increases. Some interpretations therein are indeed applicable: for fixed u, two opposing effects are in place when one analyses sample paths for which
${\rm Corr}_{r} (\tau _{{10}} ,Z_{{0.01}} (\tau _{{10}} ) \! \! \mid \! \! u;10)$
starts with a positive value of over 0.9, and it decreases as u increases and then becomes negative when u reaches approximately 95. This complements figures 1 and 2 in Cheung & Woo (Reference Cheung and Feng2016), which demonstrated a sign change of the covariance of the ruin time and the aggregate discounted claims until ruin in a dependent Sparre Andersen risk model without dividends as u increases. Some interpretations therein are indeed applicable: for fixed u, two opposing effects are in place when one analyses sample paths for which
 $\tau _{b} $
is large. Intuitively, the aggregate (non-discounted) claim amount
$\tau _{b} $
is large. Intuitively, the aggregate (non-discounted) claim amount
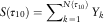 $S(\tau _{{10}} )=\mathop{\sum}\nolimits_{k\,=1\,}^{N(\tau _{{10}} )} {Y_{k} } $
tends to be large because more claims arise as the process survives longer (see also (4.3)). But these claims occur over a longer time horizon and a large claim does not happen early (otherwise it would have caused early ruin), meaning that the discounted amount
$S(\tau _{{10}} )=\mathop{\sum}\nolimits_{k\,=1\,}^{N(\tau _{{10}} )} {Y_{k} } $
tends to be large because more claims arise as the process survives longer (see also (4.3)). But these claims occur over a longer time horizon and a large claim does not happen early (otherwise it would have caused early ruin), meaning that the discounted amount
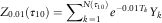 $$Z_{{0.01}} (\tau _{{10}} )=\mathop{\sum}\nolimits_{k\,=1\,}^{N(\tau _{{10}} )} {e^{{{\minus} 0.01T_{k} }} Y_{k} } $$
possibly has a tendency to become smaller due to discounting. Figure 1 suggests that the former effect is more dominant until the correlation changes sign at around u=95. As u increases further from 95, the effect of discounting starts to dominate because the discounting on the nominal amount u appearing on the right-hand side of (4.3) is getting significant.
$$Z_{{0.01}} (\tau _{{10}} )=\mathop{\sum}\nolimits_{k\,=1\,}^{N(\tau _{{10}} )} {e^{{{\minus} 0.01T_{k} }} Y_{k} } $$
possibly has a tendency to become smaller due to discounting. Figure 1 suggests that the former effect is more dominant until the correlation changes sign at around u=95. As u increases further from 95, the effect of discounting starts to dominate because the discounting on the nominal amount u appearing on the right-hand side of (4.3) is getting significant.
Correlation of ruin time and aggregate discounted claims conditional on ruin.

Correlation of ruin time and discounted dividends conditional on ruin.

Correlation of aggregate discounted claims and discounted dividends conditional on ruin.

Next, when we look at Figure 2, which depicts the behaviour of
 ${\rm Corr}_{r} (\tau _{{10}} ,D_{{0.01}} (\tau _{{10}} ) \! \! \mid \! \! u;10)$
, it is noted that the correlation is always positive. This is unlike
${\rm Corr}_{r} (\tau _{{10}} ,D_{{0.01}} (\tau _{{10}} ) \! \! \mid \! \! u;10)$
, it is noted that the correlation is always positive. This is unlike
 ${\rm Corr}_{r} (\tau _{{10}} ,Z_{{0.01}} (\tau _{{10}} ) \! \! \mid \! \! u;10)$
in Figure 1 where there is a change in sign as u increases. A possible explanation is that u does not appear on the right-hand side of (4.2) (as dividend is paid from part of the premium income but not the initial surplus), and thus the effect of discounting on u is absent in this case. As a result, the positive correlation between
${\rm Corr}_{r} (\tau _{{10}} ,Z_{{0.01}} (\tau _{{10}} ) \! \! \mid \! \! u;10)$
in Figure 1 where there is a change in sign as u increases. A possible explanation is that u does not appear on the right-hand side of (4.2) (as dividend is paid from part of the premium income but not the initial surplus), and thus the effect of discounting on u is absent in this case. As a result, the positive correlation between
 $\tau _{{10}} $
and
$\tau _{{10}} $
and
 $D_{{0.01}} (\tau _{{10}} )$
is simply attributed to the fact that, for each fixed u, the surplus process is more likely to stay above the threshold more often when the ruin time is large, resulting in more dividends.
$D_{{0.01}} (\tau _{{10}} )$
is simply attributed to the fact that, for each fixed u, the surplus process is more likely to stay above the threshold more often when the ruin time is large, resulting in more dividends.
In Figure 3, the correlation
 ${\rm Corr}_{r} (Z_{{0.01}} (\tau _{{10}} ),D_{{0.01}} (\tau _{{10}} ) \! \! \mid \! \! u;10)$
conditional on ruin takes on positive values when u increases to about 100 and then it becomes negative. From the above discussions, we argue that the aggregate non-discounted values of the claim amount
${\rm Corr}_{r} (Z_{{0.01}} (\tau _{{10}} ),D_{{0.01}} (\tau _{{10}} ) \! \! \mid \! \! u;10)$
conditional on ruin takes on positive values when u increases to about 100 and then it becomes negative. From the above discussions, we argue that the aggregate non-discounted values of the claim amount
 $S(\tau _{{10}} )$
and dividends
$S(\tau _{{10}} )$
and dividends
 $D(\tau _{{10}} )$
both tend to increase with the ruin time
$D(\tau _{{10}} )$
both tend to increase with the ruin time
 $\tau _{{10}} $
. However,
$\tau _{{10}} $
. However,
 $S(\tau _{{10}} )$
and
$S(\tau _{{10}} )$
and
 $D(\tau _{{10}} )$
may also move in opposite directions because only part of the claims are paid from the premium, while all dividend payments come from the premium (see also (4.1) for the constraint on the sum
$D(\tau _{{10}} )$
may also move in opposite directions because only part of the claims are paid from the premium, while all dividend payments come from the premium (see also (4.1) for the constraint on the sum
 $D(\tau _{{10}} ){\plus}S(\tau _{{10}} )$
). Under discounting, Figure 3 suggests that the former effect dominates for u less than 100, while the latter becomes dominant when u exceeds 100. Interestingly, we observe that
$D(\tau _{{10}} ){\plus}S(\tau _{{10}} )$
). Under discounting, Figure 3 suggests that the former effect dominates for u less than 100, while the latter becomes dominant when u exceeds 100. Interestingly, we observe that
 ${\rm Corr}_{r} (Z_{{0.01}} (\tau _{{10}} ),D_{{0.01}} (\tau _{{10}} ) \! \! \mid \! \! u;10)$
in Figure 3 changes sign at roughly the same place as
${\rm Corr}_{r} (Z_{{0.01}} (\tau _{{10}} ),D_{{0.01}} (\tau _{{10}} ) \! \! \mid \! \! u;10)$
in Figure 3 changes sign at roughly the same place as
 ${\rm Corr}_{r} (\tau _{{10}} ,Z_{{0.01}} (\tau _{{10}} ) \! \! \mid \! \! u;10)$
does in Figure 1. Note also that the curves in Figure 3 are ordered according to the variance of the individual claim size distribution.
${\rm Corr}_{r} (\tau _{{10}} ,Z_{{0.01}} (\tau _{{10}} ) \! \! \mid \! \! u;10)$
does in Figure 1. Note also that the curves in Figure 3 are ordered according to the variance of the individual claim size distribution.
Now, we turn to Figure 4 concerning the correlation of
 $Z_{{0.01}} (\tau _{{10}} )$
and
$Z_{{0.01}} (\tau _{{10}} )$
and
 $D_{{0.01}} (\tau _{{10}} )$
conditional on survival. Clearly, the shape of
$D_{{0.01}} (\tau _{{10}} )$
conditional on survival. Clearly, the shape of
 ${\rm Corr}_{s} (Z_{{0.01}} (\tau _{{10}} ),D_{{0.01}} (\tau _{{10}} ) \! \! \mid \! \! u;10)$
is completely different from that of
${\rm Corr}_{s} (Z_{{0.01}} (\tau _{{10}} ),D_{{0.01}} (\tau _{{10}} ) \! \! \mid \! \! u;10)$
is completely different from that of
 ${\rm Corr}_{r} (Z_{{0.01}} (\tau _{{10}} ),D_{{0.01}} (\tau _{{10}} ) \! \! \mid \! \! u;10)$
in Figure 3. In particular,
${\rm Corr}_{r} (Z_{{0.01}} (\tau _{{10}} ),D_{{0.01}} (\tau _{{10}} ) \! \! \mid \! \! u;10)$
in Figure 3. In particular,
 ${\rm Corr}_{s} (Z_{{0.01}} (\tau _{{10}} ),D_{{0.01}} (\tau _{{10}} ) \! \! \mid \! \! u;10)$
in Figure 4 begins at a negative value between −0.55 and −0.60. It increases with u, stays negative and converges to 0 from below. Note also that the above pattern appears to kick in earlier when the claim size has smaller variance. The reason for negative correlation is the constraint (4.4), which makes it impossible for both
${\rm Corr}_{s} (Z_{{0.01}} (\tau _{{10}} ),D_{{0.01}} (\tau _{{10}} ) \! \! \mid \! \! u;10)$
in Figure 4 begins at a negative value between −0.55 and −0.60. It increases with u, stays negative and converges to 0 from below. Note also that the above pattern appears to kick in earlier when the claim size has smaller variance. The reason for negative correlation is the constraint (4.4), which makes it impossible for both
 $Z_{{0.01}} (\tau _{{10}} )$
and
$Z_{{0.01}} (\tau _{{10}} )$
and
 $D_{{0.01}} (\tau _{{10}} )$
to be large in the presence of discounting. The convergence of
$D_{{0.01}} (\tau _{{10}} )$
to be large in the presence of discounting. The convergence of
 ${\rm Corr}_{s} (Z_{{0.01}} (\tau _{{10}} ),D_{{0.01}} (\tau _{{10}} ) \! \! \mid \! \! u;10)$
to 0 as u increases can be explained by zero covariance at the limit. Indeed, we can apply Lemma 2 three times with (n, m)=(1, 1), (1, 0), and (0, 1) to see that
${\rm Corr}_{s} (Z_{{0.01}} (\tau _{{10}} ),D_{{0.01}} (\tau _{{10}} ) \! \! \mid \! \! u;10)$
to 0 as u increases can be explained by zero covariance at the limit. Indeed, we can apply Lemma 2 three times with (n, m)=(1, 1), (1, 0), and (0, 1) to see that
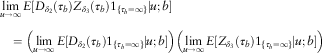 $$\eqalignno{& \mathop {{\rm lim}}\limits_{u\to\infty} E[D_{{\delta _{2} }} (\tau _{b} )Z_{{\delta _{3} }} (\tau _{b} )1_{{\{ \tau _{b} =\infty\} }} \! \! \mid \! \! u;b] \cr & \quad=\left( {\mathop {{\rm lim}}\limits_{u\to\infty} E[D_{{\delta _{2} }} (\tau _{b} )1_{{\{ \tau _{b} =\infty\} }} \! \! \mid \! \! u;b]} \right)\left( {\mathop {{\rm lim}}\limits_{u\to\infty} E[Z_{{\delta _{3} }} (\tau _{b} )1_{{\{ \tau _{b} =\infty\} }} \! \! \mid \! \! u;b]} \right)$$
Correlation of aggregate discounted claims and discounted dividends conditional on survival.

Division of each of the three above limits by the limiting survival probability
 $${{\rm lim}}_{u\to\infty} \varphi (u;b)=1$$
reveals that
$${{\rm lim}}_{u\to\infty} \varphi (u;b)=1$$
reveals that
 $${\rm Cov}_{s} (Z_{{\delta _{3} }} (\tau _{b} ),D_{{\delta _{2} }} (\tau _{b} ) \! \! \mid \! \! u;b)=E_{s} [Z_{{\delta _{3} }} (\tau _{b} )D_{{\delta _{2} }} (\tau _{b} ) \! \! \mid \! \! u;b]\,{\minus}\,E_{s} [Z_{{\delta _{3} }} (\tau _{b} ) \! \! \mid \! \! u;b]E_{s} [D_{{\delta _{2} }} (\tau _{b} )\! \! \mid \! \! u;b]$$
tends to 0 as
$${\rm Cov}_{s} (Z_{{\delta _{3} }} (\tau _{b} ),D_{{\delta _{2} }} (\tau _{b} ) \! \! \mid \! \! u;b)=E_{s} [Z_{{\delta _{3} }} (\tau _{b} )D_{{\delta _{2} }} (\tau _{b} ) \! \! \mid \! \! u;b]\,{\minus}\,E_{s} [Z_{{\delta _{3} }} (\tau _{b} ) \! \! \mid \! \! u;b]E_{s} [D_{{\delta _{2} }} (\tau _{b} )\! \! \mid \! \! u;b]$$
tends to 0 as
 $$u\to\infty$$
.
$$u\to\infty$$
.
Lastly, Figure 5 plots the unconditional correlation of
 $Z_{{0.01}} (\tau _{{10}} )$
and
$Z_{{0.01}} (\tau _{{10}} )$
and
 $D_{{0.01}} (\tau _{{10}} )$
against u. As a function of u, the correlation
$D_{{0.01}} (\tau _{{10}} )$
against u. As a function of u, the correlation
 ${\rm Corr}(Z_{{0.01}} (\tau _{{10}} ),D_{{0.01}} (\tau _{{10}} ) \! \! \mid \! \! u;10)$
first decreases from over 0.95 to negative values and finally converges to 0. Similar to Figure 4, the pattern prevails earlier when the individual claim size has less variability. Note that the unconditional correlation takes all sample paths into account regardless of whether the process ruins or survives. The contributions of these events are in accordance with the ruin probability
${\rm Corr}(Z_{{0.01}} (\tau _{{10}} ),D_{{0.01}} (\tau _{{10}} ) \! \! \mid \! \! u;10)$
first decreases from over 0.95 to negative values and finally converges to 0. Similar to Figure 4, the pattern prevails earlier when the individual claim size has less variability. Note that the unconditional correlation takes all sample paths into account regardless of whether the process ruins or survives. The contributions of these events are in accordance with the ruin probability
 $\psi (u;10)$
and the survival probability
$\psi (u;10)$
and the survival probability
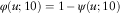 $\varphi (u;10)=1\,{\minus}\,\psi (u;10)$
, respectively. As u increases,
$\varphi (u;10)=1\,{\minus}\,\psi (u;10)$
, respectively. As u increases,
 $\psi (u;10)$
decreases and converges to 0 and therefore the impact of ruin occurrence becomes less significant while that of survival becomes stronger. The shape of Figure 5 is thus a combination of Figures 3 and 4.
$\psi (u;10)$
decreases and converges to 0 and therefore the impact of ruin occurrence becomes less significant while that of survival becomes stronger. The shape of Figure 5 is thus a combination of Figures 3 and 4.
Unconditional correlation of aggregate discounted claims and discounted dividends.

5. Concluding Remarks
This paper jointly analyses the aggregate discounted claims until ruin (payments to policyholders) and the discounted dividends until ruin (payments to shareholders) in the compound Poisson insurance risk model with a threshold dividend strategy. The method adopted here is based on the derivation of recursive IDEs satisfied by Gerber–Shiu-type functions involving the joint moments of these two random variables. When each claim amount is distributed as a combination of exponentials, these IDEs are transformed to ordinary differential equations that can be solved with the help of the continuity and limiting conditions.
An alternative approach will be to connect the risk process to an equivalent fluid flow model (e.g., Badescu et al., Reference Badescu, Breuer, Da Silva Soares, Latouche, Remiche and Stanford2005). In such a construction, a downward jump (caused by the arrival of a claim) of size y in the risk model is replaced by decreasing segment of slope −C in the fluid model over a time period of y/C for some constant C>0. It is well known that (e.g., Ramaswami, Reference Ramaswami2006; Ahn et al., Reference Ahn, Badescu and Ramaswami2007) the Laplace transforms of various first passage times can typically be expressed in terms of the Laplace transform of the busy period, whose evaluation can be done by numerical algorithms that converge quadratically fast (e.g., Ahn & Ramaswami, Reference Ahn and Ramaswami2005; Bean et al., Reference Bean, O’Reilly and Taylor2005). Then one may try to express our Gerber–Shiu-type functions in terms of these quantities pertaining to the fluid model. While the moments of discounted dividends were derived by Badescu & Landriault (Reference Badescu and Landriault2008) in this manner for a multi-threshold model, the aggregate discounted claim amount until ruin has never been analysed via fluid flow to the best of our knowledge. Nevertheless, in the absence of discounting, we note that the total dividend is (a scalar multiple of) the occupation time when the fluid level is in an increasing phase above the threshold level b, while the aggregate claim amount corresponds to (a scalar multiple of) the occupation time of the fluid in a decreasing phase. Finally, we also remark that another research problem will be to determine the exact joint distribution of the discounted dividends and the aggregate discounted claims until ruin (as opposed to joint moments in the present work), which is expected to be a very challenging task. We leave these as open questions.
Acknowledgements
The authors would like to thank the anonymous reviewers for their helpful comments and suggestions which improved both the content and the presentation of an earlier version of the paper. E. C. K. Cheung acknowledges the support from the Research Grants Council of the Hong Kong Special Administrative Region (Project No. HKU 701212P). This research is also partially supported by the CAE 2013 research grant from the Society of Actuaries (SOA). Any opinions, findings, and conclusions or recommendations expressed in this material are those of the authors and do not necessarily reflect the views of the SOA.
Appendix: Proofs of Theorems and Lemmas in Sections 2 and 3
Proof of Theorem 1: We use the standard approach of considering the time interval (0,h] for some small h>0. Conditioning on all possible events together with a binomial expansion (if a claim occurs) yields, for 0≤u<b
 $$\eqalignno{ \phi _{{\delta _{{13}}\! ,m}} (u;b)= &\, (1\,{\minus}\,\lambda h)e^{{{\minus} (\delta _{1} {\plus}m\delta _{3} )h}} \phi _{{\delta _{{13}} ,m}} (u{\plus}c_{1} h;b) \cr & {\plus}\,\lambda he^{{{\minus} (\delta _{1} {\plus}m\delta _{3} )h}} \left[\mathop{\int}\nolimits_0^{u{\plus}c_{1} h} \mathop{\sum}\limits_{i\,=\,0}^m \left( {\matrix{ m \cr i \cr } } \right)f^{{m\,{\minus}\,i}} (y)\phi _{{\delta _{{13}} ,i}} (u{\plus}c_{1} h\,{\minus}\,y;b)p(y)\, dy \right \cr & \left {\plus}\mathop{\int}\nolimits_{u{\plus}c_{1} h}^\infty f^{m} (y)w(u{\plus}c_{1} h,y\,{\minus}\,u\,{\minus}\,c_{1} h)p(y)\, dy \right]{\plus}o(h) $$
Letting
 $$h\to0^{\!{\plus}} $$
, one observes that
$$h\to0^{\!{\plus}} $$
, one observes that
 $$\phi _{{\delta _{{13}} ,m}} (u;b)$$
is right-continuous in u for 0≤u<b. Since
$$\phi _{{\delta _{{13}} ,m}} (u;b)$$
is right-continuous in u for 0≤u<b. Since
 $$e^{{{\minus} (\delta _{1} {\plus}m\delta _{3} )h}} =1\,{\minus}\,(\delta _{1} {\plus}m\delta _{3} )h{\plus}o(h)$$
, rearrangements and division by h give, for 0<u≤b
$$e^{{{\minus} (\delta _{1} {\plus}m\delta _{3} )h}} =1\,{\minus}\,(\delta _{1} {\plus}m\delta _{3} )h{\plus}o(h)$$
, rearrangements and division by h give, for 0<u≤b
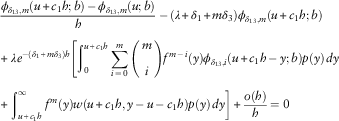 $$\eqalignno{ & {{\phi _{{\delta _{{13}} ,m}} (u{\plus}c_{1} h;b)\,{\minus}\,\phi _{{\delta _{{13}} ,m}} (u;b)} \over h}\,{\minus}\,(\lambda {\plus}\delta _{1} {\plus}m\delta _{3} )\phi _{{\delta _{{13}} ,m}} (u{\plus}c_{1} h;b) \cr & {\plus}\,\lambda e^{{{\minus} (\delta _{1} {\plus}m\delta _{3} )h}} \left[ {\mathop{\int}\nolimits_0^{u{\plus}c_{1} h} {\mathop{\sum}\limits_{i\,=\,0}^m {\left( {\matrix{ m \cr i \cr } } \right)} \right f^{{m\,{\minus}\,i}} (y)\phi _{{\delta _{{13}} ,i}} (u{\plus}c_{1} h\,{\minus}\,y;b)p(y)\, dy} } \right. \cr & \left. {{\plus}\mathop{\int}\nolimits_{u{\plus}c_{1} h}^\infty {f^{m} (y)w(u{\plus}c_{1} h,y\,{\minus}\,u\,{\minus}\,c_{1} h)p(y)\, dy } } \right] {\plus}{{o(h)} \over h}=0$$
Again, sending
 $$h\to0^{{\plus}} $$
and noting that the above equation only involves
$$h\to0^{{\plus}} $$
and noting that the above equation only involves
 $$\phi _{{\delta _{{13}} ,i}} ( \cdot ;b)$$
in the lower layer, we obtain (2.2) with
$$\phi _{{\delta _{{13}} ,i}} ( \cdot ;b)$$
in the lower layer, we obtain (2.2) with
 $$\phi '_{{L,\delta _{{13}} ,m}} (u;b)$$
being a right derivative. If we replace u by u−c
1
h in (A.1), then similar procedure reveals that
$$\phi '_{{L,\delta _{{13}} ,m}} (u;b)$$
being a right derivative. If we replace u by u−c
1
h in (A.1), then similar procedure reveals that
 $$\phi _{{\delta _{{13}} ,m}} (u;b)$$
is left-continuous in u for 0<u≤b and (2.2) also holds true with
$$\phi _{{\delta _{{13}} ,m}} (u;b)$$
is left-continuous in u for 0<u≤b and (2.2) also holds true with
 $\phi '_{{L,\delta _{{13}} ,m}} (u;b)$
being a left derivative.
$\phi '_{{L,\delta _{{13}} ,m}} (u;b)$
being a left derivative.
For u≥b, it can be easily seen that (A.1) (and hence (A.2)) is also applicable but with c
1 replaced by c
2. Therefore, following the same arguments as above, one can conclude that
 $$\phi _{{\delta _{{13}} ,m}} (u;b)$$
is continuous for u≥b. Further noting that, for u≥b
$$\phi _{{\delta _{{13}} ,m}} (u;b)$$
is continuous for u≥b. Further noting that, for u≥b
 $$\eqalignno {&\mathop{\int}\nolimits_0^u {f^{{m\,{\minus}\,i}} (y)\phi _{{\delta _{{13}} ,i}} (u\,{\minus}\,y;b)p(y)\, dy} \cr &=\mathop{\int}\nolimits_0^{u\,{\minus}\,b} {f^{{m\,{\minus}\,i}} (y)\phi _{{U,\delta _{{13}} ,i}} (u\,{\minus}\,y;b)p(y)\, dy} {\plus}\mathop{\int}\nolimits_{u\,{\minus}\,b}^u {f^{{m\,{\minus}\,i}} (y)\phi _{{L,\delta _{{13}} ,i}} (u\,{\minus}\,y;b)p(y)\, dy} $$
it is found that (2.3) is valid for both right and left derivatives of
 $\phi _{{U,\delta _{{13}} ,m}} ( \cdot ;b)$
. Finally, the continuity condition (2.4) is a direct consequence of the left-continuity of
$\phi _{{U,\delta _{{13}} ,m}} ( \cdot ;b)$
. Finally, the continuity condition (2.4) is a direct consequence of the left-continuity of
 $$\phi _{{\delta _{{13}} ,m}} (u;b)$$
at u=b in the lower layer and the right-continuity of
$$\phi _{{\delta _{{13}} ,m}} (u;b)$$
at u=b in the lower layer and the right-continuity of
 $$\phi _{{\delta _{{13}} ,m}} (u;b)$$
at u=b in the upper layer.□
$$\phi _{{\delta _{{13}} ,m}} (u;b)$$
at u=b in the upper layer.□
Proof of Theorem 2: The same method as in the proof of Theorem 1 of considering a small time interval (0,h] can be adopted. If the process
 $$\{ U_{b} (t)\} _{{t\, \geq \, 0}} $$
starts below the threshold level b, then it is possible that
$$\{ U_{b} (t)\} _{{t\, \geq \, 0}} $$
starts below the threshold level b, then it is possible that
 $D_{{\delta _{2} }} (\tau _{b} )=0$
(when the process
$D_{{\delta _{2} }} (\tau _{b} )=0$
(when the process
 $$\{ U_{b} (t)\} _{{t\, \geq \, 0}} $$
never reaches b before ruin). We first arrive at, for 0≤u<b
$$\{ U_{b} (t)\} _{{t\, \geq \, 0}} $$
never reaches b before ruin). We first arrive at, for 0≤u<b
 $$\eqalignno{ \phi _{{\delta _{{123}} ,n,m}} (u;b) = & \,(1\,{\minus}\,\lambda h)e^{{{\minus} (\delta _{1} {\plus}n\delta _{2} {\plus}m\delta _{3} )h}} \phi _{{\delta _{{123}} ,n,m}} (u{\plus}c_{1} h;b) \cr & {\plus}\,\lambda he^{{{\minus} (\delta _{1} {\plus}n\delta _{2} {\plus}m\delta _{3} )h}} \mathop{\int}\nolimits_0^{u{\plus}c_{1} h} {\mathop{\sum}\limits_{i\,=\,0}^m {\left( {\matrix{ m \cr i \cr } } \right)} } f^{{m\,{\minus}\,i}} (y)\phi _{{\delta _{{123}} ,n,i}} (u{\plus}c_{1} h\,{\minus}\,y;b)p(y)\, dy{\plus}o(h) $$
The above equation is almost identical to (A.1) in Theorem 1, except that the term
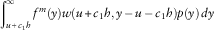 $\mathop{\int}\nolimits_{u{\plus}c_{1} h}^\infty {f^{m} (y)w(u{\plus}c_{1} h,y\,{\minus}\,u\,{\minus}\,c_{1} h)p(y)\, dy} $
is now absent. Following the arguments therein, one can see that
$\mathop{\int}\nolimits_{u{\plus}c_{1} h}^\infty {f^{m} (y)w(u{\plus}c_{1} h,y\,{\minus}\,u\,{\minus}\,c_{1} h)p(y)\, dy} $
is now absent. Following the arguments therein, one can see that
 $\phi _{{\delta _{{123}} ,n,m}} (u;b)$
is continuous in u for 0≤u≤b, and (2.5) holds true.
$\phi _{{\delta _{{123}} ,n,m}} (u;b)$
is continuous in u for 0≤u≤b, and (2.5) holds true.
On the other hand, if u≥b, dividends are paid continuously at rate α until the surplus falls below b. Denoting
 $\bar{s}_{{\bar{t} \! \mid \! \delta }} =(e^{{\delta t}} \,{\minus}\,1)/\delta $
as the actuarial symbol for the accumulated value of an annuity with rate $1 per unit time payable continuously for t time units under a force of interest δ, we have that, for u≥b
$\bar{s}_{{\bar{t} \! \mid \! \delta }} =(e^{{\delta t}} \,{\minus}\,1)/\delta $
as the actuarial symbol for the accumulated value of an annuity with rate $1 per unit time payable continuously for t time units under a force of interest δ, we have that, for u≥b
 $$\eqalignno{ \phi _{{\delta _{{123}} ,n,m}} (u;b) = &\, (1\,{\minus}\,\lambda h)e^{{{\minus} (\delta _{1} {\plus}n\delta _{2} {\plus}m\delta _{3} )h}} \mathop{\sum}\limits_{j=0}^n {\left( {\matrix{ n \cr j \cr } } \right)} \left( {\alpha \bar{s}_{{\bar{h} \mid \delta _{2} }} } \right)^{j} \phi _{{\delta _{{123}} ,n\,{\minus}\,j,m}} (u{\plus}c_{2} h;b) \cr & {\plus}\,\lambda he^{{{\minus} (\delta _{1} {\plus}n\delta _{2} {\plus}m\delta _{3} )h}} \left[ {\mathop{\int}\nolimits_0^{u{\plus}c_{2} h} {\mathop{\sum}\limits_{j=0}^n {\left( {\matrix{ n \cr j \cr } } \right)} } \left( {\alpha \bar{s}_{{\bar{h} \mid \delta _{2} }} } \right)^{j} \mathop{\sum}\limits_{i\,=\,0}^m {\left( {\matrix{ m \cr i \cr } } \right)} f^{{m\,{\minus}\,i}} (y)\phi _{{\delta _{{123}} ,n\,{\minus}\,j,i}} (u{\plus}c_{2} h\,{\minus}\,y;b)p(y)\, dy} \right. \cr & \left {\plus}\mathop{\int}\nolimits_{u{\plus}c_{2} h}^\infty {\left( {\alpha \bar{s}_{{\bar{h} \mid \delta _{2} }} } \right)^{n} } f^{m} (y)w(u{\plus}c_{2} h,y\,{\minus}\,u\,{\minus}\,c_{2} h)p(y)\, dy \right]{\plus}o(h) $$
Noting
 ${{\rm lim}}_{h\to0^{{\plus}} } \bar{s}_{{\bar{h} \mid \delta _{2} }} =0$
and the convention 00=1, we separate the contribution j=0 in the first summation term above and let
${{\rm lim}}_{h\to0^{{\plus}} } \bar{s}_{{\bar{h} \mid \delta _{2} }} =0$
and the convention 00=1, we separate the contribution j=0 in the first summation term above and let
 $$h\to0^{{\plus}} $$
to establish the right-continuity of
$$h\to0^{{\plus}} $$
to establish the right-continuity of
 $\phi _{{\delta _{{123}} ,n,m}} (u;b)$
for u≥b. As
$\phi _{{\delta _{{123}} ,n,m}} (u;b)$
for u≥b. As
 $$e^{{{\minus} (\delta _{1} {\plus}n\delta _{2} {\plus}m\delta _{3} )h}} =1\,{\minus}\,(\delta _{1} {\plus}n\delta _{2} {\plus}m\delta _{3} )h{\plus}o(h)$$
, rearranging (A.4) and then dividing by h yields, for u≥b
$$e^{{{\minus} (\delta _{1} {\plus}n\delta _{2} {\plus}m\delta _{3} )h}} =1\,{\minus}\,(\delta _{1} {\plus}n\delta _{2} {\plus}m\delta _{3} )h{\plus}o(h)$$
, rearranging (A.4) and then dividing by h yields, for u≥b
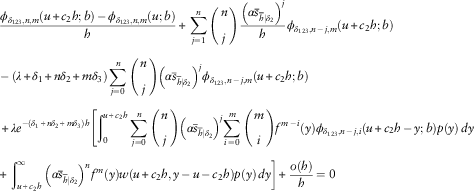 $$\eqalignno{ & {{\phi _{{\delta _{{123}} ,n,m}} (u{\plus}c_{2} h;b)\,{\minus}\,\phi _{{\delta _{{123}} ,n,m}} (u;b)} \over h}{\plus}\mathop{\sum}\limits_{j=1}^n {\left( {\matrix{ n \cr j \cr } } \right)} {{\left( {\alpha \bar{s}_{{\bar{h} \mid \delta _{2} }} } \right)^{j} } \over h}\phi _{{\delta _{{123}} ,n\,{\minus}\,j,m}} (u{\plus}c_{2} h;b) \cr & \,{\minus}\,(\lambda {\plus}\delta _{1} {\plus}n\delta _{2} {\plus}m\delta _{3} )\mathop{\sum}\limits_{j=0}^n {\left( {\matrix{ n \cr j \cr } } \right)} \left( {\alpha \bar{s}_{{\bar{h} \mid \delta _{2} }} } \right)^{j} \phi _{{\delta _{{123}} ,n\,{\minus}\,j,m}} (u{\plus}c_{2} h;b) \cr & \, {\plus}\lambda e^{{{\minus} (\delta _{1} {\plus}n\delta _{2} {\plus}m\delta _{3} )h}} \left[ {\mathop{\int}\nolimits_0^{u{\plus}c_{2} h} {\mathop{\sum}\limits_{j=0}^n {\left( {\matrix{ n \cr j \cr } } \right)} } } \right.\left( {\alpha \bar{s}_{{\bar{h} \mid \delta _{2} }} } \right)^{j} \mathop{\sum}\limits_{i\,=\,0}^m {\left( {\matrix{ m \cr i \cr } } \right)} f^{{m\,{\minus}\,i}} (y)\phi _{{\delta _{{123}} ,n\,{\minus}\,j,i}} (u{\plus}c_{2} h\,{\minus}\,y;b)p(y)\, dy \cr & \left. {{\plus}\mathop{\int}\nolimits_{u{\plus}c_{2} h}^\infty {\left( {\alpha \bar{s}_{{\bar{h} \mid \delta _{2} }} } \right)^{n} } f^{m} (y)w(u{\plus}c_{2} h,y\,{\minus}\,u\,{\minus}\,c_{2} h)p(y)\, dy} \right]{\plus}{{o(h)} \over h}=0 $$
Because
 ${{\rm lim}}_{h\to0^{{\plus}} } \bar{s}_{{\bar{h} \mid \delta _{2} }}\! /h=1$
and
${{\rm lim}}_{h\to0^{{\plus}} } \bar{s}_{{\bar{h} \mid \delta _{2} }}\! /h=1$
and
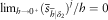 ${{\rm lim}}_{h\to0^{{\plus}} } (\bar{s}_{{\bar{h} \mid \delta _{2} }} )^{j} /h=0$
for j>1, taking the limit
${{\rm lim}}_{h\to0^{{\plus}} } (\bar{s}_{{\bar{h} \mid \delta _{2} }} )^{j} /h=0$
for j>1, taking the limit
 $$h\to0^{{\plus}} $$
in the above equation leads to the IDE (2.6), with
$$h\to0^{{\plus}} $$
in the above equation leads to the IDE (2.6), with
 $\phi '_{{U,\delta _{{123}} ,n,m}} (u;b)$
understood to be a right derivative. Next, for u>b, by assuming an initial surplus level of u−c
2
h instead in (A.4), we obtain the left-continuity of
$\phi '_{{U,\delta _{{123}} ,n,m}} (u;b)$
understood to be a right derivative. Next, for u>b, by assuming an initial surplus level of u−c
2
h instead in (A.4), we obtain the left-continuity of
 $\phi _{{U,\delta _{{123}} ,n,m}} (u;b)$
and that (2.6) is valid with
$\phi _{{U,\delta _{{123}} ,n,m}} (u;b)$
and that (2.6) is valid with
 $\phi '_{{U,\delta _{{123}} ,n,m}} (u;b)$
being a left derivative as well. Lastly, the continuity condition (2.7) follows in the same manner as in the proof of Theorem 1.□
$\phi '_{{U,\delta _{{123}} ,n,m}} (u;b)$
being a left derivative as well. Lastly, the continuity condition (2.7) follows in the same manner as in the proof of Theorem 1.□
Proof of Theorem 3: As the definition (1.6) contains the indicator
 $1_{{\{ \tau _{b} =\infty\} }} $
, sample paths for which a claim amount exceeds the surplus level just before its occurrence contribute nothing to
$1_{{\{ \tau _{b} =\infty\} }} $
, sample paths for which a claim amount exceeds the surplus level just before its occurrence contribute nothing to
 $$\varphi _{{\delta _{{23}} ,n,m}} (u;b)$$
. Again, by conditioning on the possible claim events within (0,h] for some small h, we have, for 0≤u<b
$$\varphi _{{\delta _{{23}} ,n,m}} (u;b)$$
. Again, by conditioning on the possible claim events within (0,h] for some small h, we have, for 0≤u<b
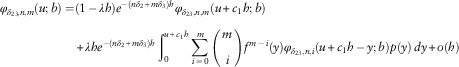 $$\eqalignno{ \varphi _{{\delta _{{23}} \!,n,m}} (u;b) =& (1\,{\minus}\,\lambda h)e^{{{\minus} (n\delta _{2} {\plus}m\delta _{3} )h}} \varphi _{{\delta _{{23}} ,n,m}} (u{\plus}c_{1} h;b) \cr & {\plus}\lambda he^{{{\minus} (n\delta _{2} {\plus}m\delta _{3} )h}} \mathop{\int}\nolimits_0^{u{\plus}c_{1} h} {\mathop{\sum}\limits_{i\,=\,0}^m {\left( {\matrix{ m \cr i \cr } } \right)} } f^{{m\,{\minus}\,i}} (y)\varphi _{{\delta _{{23}} ,n,i}} (u{\plus}c_{1} h\,{\minus}\,y;b)p(y)\, dy{\plus}o(h) $$
and, for u≥b
 $$\eqalignno{ \varphi _{{\delta _{{23}} ,n,m}} (u;b) =& (1\,{\minus}\,\lambda h)e^{{{\minus} (n\delta _{2} {\plus}m\delta _{3} )h}} \mathop{\sum}\limits_{j=0}^n {\left( {\matrix{ n \cr j \cr } } \right)} \left( {\alpha \bar{s}_{{\bar{h} \mid \delta _{2} }} } \right)^{j} \varphi _{{\delta _{{23}} ,n\,{\minus}\,j,m}} (u{\plus}c_{2} h;b) \cr \!& {\plus}\lambda he^{{{\minus} (n\delta _{2} {\plus}m\delta _{3} )h}} \mathop{\int}\nolimits_0^{u{\plus}c_{2} h}\! {\mathop{\sum}\limits_{j=0}^n {\left( {\matrix{ n \cr j \cr } } \right)} } \!\left( {\alpha \bar{s}_{{\bar{h} \mid \delta _{2} }} } \right)^{j} \mathop{\sum}\limits_{i\,=\,0}^m {\left( {\matrix{ m \cr i \cr } } \right)} f^{{m\,{\minus}\,i}} (y)\cr & \times \varphi _{{\delta _{{23}} \!,n\,{\minus}\,j,i}} (u{\plus}c_{2} h\, {\minus}\,y;b)p(y)\,dy {\plus}o(h) $$
While (A.5) is structurally identical to (A.3), (A.6) is like (A.4) except that the term with the penalty function is absent. Hence, the IDEs (2.8) and (2.9) together with the continuity condition (2.10) follow in the same manner as how Theorem 2 (and also Theorem 1) is proved.□
Proof of Lemma 2: For presentation purposes, in this proof we shall specify the dependence of the time of ruin on the initial surplus u by writing
 $\tau _{{u,b}} $
instead of
$\tau _{{u,b}} $
instead of
 $\tau _{b} $
. Moreover, we let
$\tau _{b} $
. Moreover, we let
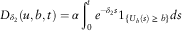 $D_{{\delta _{2} }} (u,b,t)=\alpha \mathop{\int}\nolimits_0^t {e^{{{\minus} \delta _{2} s}} 1_{{\{ U_{b} (s)\, \geq \, b\} }} \:ds} $
be the total discounted dividends paid until time t. Then, it is clear that
$D_{{\delta _{2} }} (u,b,t)=\alpha \mathop{\int}\nolimits_0^t {e^{{{\minus} \delta _{2} s}} 1_{{\{ U_{b} (s)\, \geq \, b\} }} \:ds} $
be the total discounted dividends paid until time t. Then, it is clear that
 $$D_{{\delta _{2} }} (u,b,t)$$
is increasing (i.e., non-decreasing) in both u and t, and the dividend variable defined via (1.2) shall be written as
$$D_{{\delta _{2} }} (u,b,t)$$
is increasing (i.e., non-decreasing) in both u and t, and the dividend variable defined via (1.2) shall be written as
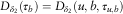 $D_{{\delta _{2} }} (\tau _{b} )=D_{{\delta _{2} }} (u,b,\tau _{{u,b}} )$
. In contrast, with
$D_{{\delta _{2} }} (\tau _{b} )=D_{{\delta _{2} }} (u,b,\tau _{{u,b}} )$
. In contrast, with
 $Z_{{\delta _{3} }} (t)=\mathop{\sum}\nolimits_{k\,=1\,}^{N(t)} {e^{{{\minus} \delta _{3} T_{k} }} f(Y_{k} )} $
being the aggregate discounted claim costs until time t, it is noted that
$Z_{{\delta _{3} }} (t)=\mathop{\sum}\nolimits_{k\,=1\,}^{N(t)} {e^{{{\minus} \delta _{3} T_{k} }} f(Y_{k} )} $
being the aggregate discounted claim costs until time t, it is noted that
 $Z_{{\delta _{3} }} (\tau _{{u,b}} )=\mathop{\sum}\nolimits_{k\,=1\,}^{N(\tau _{{u,b}} )} {e^{{{\minus} \delta _{3} T_{k} }} f(Y_{k} )} $
depends on u only via the ruin time
$Z_{{\delta _{3} }} (\tau _{{u,b}} )=\mathop{\sum}\nolimits_{k\,=1\,}^{N(\tau _{{u,b}} )} {e^{{{\minus} \delta _{3} T_{k} }} f(Y_{k} )} $
depends on u only via the ruin time
 $\tau _{{u,b}} $
. In this proof, the initial condition U
b
(0)=u will be omitted in related expectations and probabilities.
$\tau _{{u,b}} $
. In this proof, the initial condition U
b
(0)=u will be omitted in related expectations and probabilities.
Note that the ruin probability
 $\psi (u;b)={\rm Pr}\{ \tau _{{u,b}} \,\lt \, \infty\} $
is bounded by
$\psi (u;b)={\rm Pr}\{ \tau _{{u,b}} \,\lt \, \infty\} $
is bounded by
 $\psi (u;0)$
for which the net premium income is always c
2. Under the loading condition c
2>λE[Y
1], it is known from e.g. Kyprianou (Reference Kyprianou2013, theorem 4.3 and equation (9.16)) that
$\psi (u;0)$
for which the net premium income is always c
2. Under the loading condition c
2>λE[Y
1], it is known from e.g. Kyprianou (Reference Kyprianou2013, theorem 4.3 and equation (9.16)) that
 ${{\rm lim}}_{u\to\infty} \,\psi (u;0)=0$
. Therefore, one has that
${{\rm lim}}_{u\to\infty} \,\psi (u;0)=0$
. Therefore, one has that
 ${{\rm lim}}_{u\to\infty} \,\psi (u;b)=0$
, or equivalently
${{\rm lim}}_{u\to\infty} \,\psi (u;b)=0$
, or equivalently
 ${{\rm lim}}_{u\to\infty} \,{\rm Pr}\{ \tau _{{u,b}} =\infty\} = 1$
. Meanwhile, for every realisation of the aggregate claims process
${{\rm lim}}_{u\to\infty} \,{\rm Pr}\{ \tau _{{u,b}} =\infty\} = 1$
. Meanwhile, for every realisation of the aggregate claims process
 $$\{ S(t)\} _{{t\, \geq \, 0}} $$
, it is clear that
$$\{ S(t)\} _{{t\, \geq \, 0}} $$
, it is clear that
 $\tau _{{u,b}} $
is increasing in u and the sequence of sets
$\tau _{{u,b}} $
is increasing in u and the sequence of sets
 $\{ \{ \tau _{{u,b}} =\infty\} \} _{{u=1}}^{\infty} $
is increasing as well. This leads to
$\{ \{ \tau _{{u,b}} =\infty\} \} _{{u=1}}^{\infty} $
is increasing as well. This leads to
 ${{\rm lim}}_{u\to\infty} \, {\rm Pr}\{ \tau _{{u,b}} =\infty\} ={\rm Pr}\{ {{\rm lim}}_{u\to\infty} \{ \tau _{{u,b}} =\infty\} \} $
. Combining the above two results, we arrive at
${{\rm lim}}_{u\to\infty} \, {\rm Pr}\{ \tau _{{u,b}} =\infty\} ={\rm Pr}\{ {{\rm lim}}_{u\to\infty} \{ \tau _{{u,b}} =\infty\} \} $
. Combining the above two results, we arrive at
 ${\rm Pr}\{ {{\rm lim}}_{u\to\infty} \{ \tau _{{u,b}} =\infty\} \} =1$
, i.e. the event
${\rm Pr}\{ {{\rm lim}}_{u\to\infty} \{ \tau _{{u,b}} =\infty\} \} =1$
, i.e. the event
 ${{\rm lim}}_{u\to\infty} \{ \tau _{{u,b}} =\infty\} $
occurs a.s.. In other words,
${{\rm lim}}_{u\to\infty} \{ \tau _{{u,b}} =\infty\} $
occurs a.s.. In other words,
 $1_{{{{\rm lim}}_{u\to\infty} \{ \tau _{{u,b}} \,= \, \infty\} }} =1$
a.s.. Again, due to the fact that the set
$1_{{{{\rm lim}}_{u\to\infty} \{ \tau _{{u,b}} \,= \, \infty\} }} =1$
a.s.. Again, due to the fact that the set
 $\{ \tau _{{u,b}} =\infty\} $
is increasing in u, we have
$\{ \tau _{{u,b}} =\infty\} $
is increasing in u, we have
 $1_{{{{\rm lim}}_{u\to\infty} \{ \tau _{{u,b}} =\infty\} }} ={{\rm lim}}_{u\to\infty} \,1_{{\{ \tau _{{u,b}} =\infty\} }} $
, and the intermediate result
$1_{{{{\rm lim}}_{u\to\infty} \{ \tau _{{u,b}} =\infty\} }} ={{\rm lim}}_{u\to\infty} \,1_{{\{ \tau _{{u,b}} =\infty\} }} $
, and the intermediate result
 $$\mathop {{\rm lim}}\limits_{u\to\infty} 1_{{\{ \tau _{{u,b}}\, =\,\infty\} }} =1\quad {\rm a}{\rm .s}{\rm .}$$
follows. Next, we look at the limit of (1.6), namely
 $$\mathop {{\rm lim}}\limits_{u\to\infty} \,\varphi _{{\delta _{{23}} ,n,m}} (u;b)=\mathop {{\rm lim}}\limits_{u\to\infty} \,E[D_{{\delta _{2} }}^{n} (u,b,\tau _{{u,b}} )Z_{{\delta _{3} }}^{m} (\tau _{{u,b}} )1_{{\{ \tau _{{u,b}}\, =\,\infty\} }} ]$$
where
 $$n,m\in {\Bbb N}$$
. For any sample path of
$$n,m\in {\Bbb N}$$
. For any sample path of
 $$\{ S(t)\} _{{t\, \geq \, 0}} $$
, it is observed that the random variables
$$\{ S(t)\} _{{t\, \geq \, 0}} $$
, it is observed that the random variables
 $D_{{\delta _{2} }} (u,b,\tau _{{u,b}} ),\,Z_{{\delta _{3} }} (\tau _{{u,b}} )$
and
$D_{{\delta _{2} }} (u,b,\tau _{{u,b}} ),\,Z_{{\delta _{3} }} (\tau _{{u,b}} )$
and
 $1_{{\{ \tau _{{u,b}} \,=\,\infty\} }} $
are all non-negative and increasing in u. Applying the Monotone Convergence Theorem to change the order of limit and expectation leads to
$1_{{\{ \tau _{{u,b}} \,=\,\infty\} }} $
are all non-negative and increasing in u. Applying the Monotone Convergence Theorem to change the order of limit and expectation leads to
 $$\mathop {{\rm lim}}\limits_{u\to\infty} \,\varphi _{{\delta _{{23}} ,n,m}} (u;b)=E\left[ {\mathop {{\rm lim}}\limits_{u\to\infty} (D_{{\delta _{2} }}^{n} (u,b,\tau _{{u,b}} )Z_{{\delta _{3} }}^{m} (\tau _{{u,b}} )1_{{\{ \tau _{{u,b}} \,=\,\infty\} }} )} \right]$$
Because
 $D_{{\delta _{2} }}^{n} (u,b,\tau _{{u,b}} )Z_{{\delta _{3} }}^{m} (\tau _{{u,b}} )=D_{{\delta _{2} }}^{n} (u,b,\infty)Z_{{\delta _{3} }}^{m} (\infty)$
on the set
$D_{{\delta _{2} }}^{n} (u,b,\tau _{{u,b}} )Z_{{\delta _{3} }}^{m} (\tau _{{u,b}} )=D_{{\delta _{2} }}^{n} (u,b,\infty)Z_{{\delta _{3} }}^{m} (\infty)$
on the set
 $\{ \tau _{{u,b}} =\infty\} $
, the above equation can be rewritten as
$\{ \tau _{{u,b}} =\infty\} $
, the above equation can be rewritten as
 $$\mathop {{\rm lim}}\limits_{u\to\infty} \,\varphi _{{\delta _{{23}} ,n,m}} (u;b)=E\left[ {\mathop {{\rm lim}}\limits_{u\to\infty} (D_{{\delta _{2} }}^{n} (u,b,\infty)Z_{{\delta _{3} }}^{m} (\infty)1_{{\{ \tau _{{u,b}\,} =\,\infty\} }} )} \right]$$
Since N(t)→∞ a.s. as t→∞, we note that
 $Z_{{\delta _{3} }} (\infty)=\mathop{\sum}\nolimits_{k\,=1\,}^\infty {e^{{{\minus} \delta _{3} T_{k} }} f(Y_{k} )} $
a.s. which does not depend on u, and therefore
$Z_{{\delta _{3} }} (\infty)=\mathop{\sum}\nolimits_{k\,=1\,}^\infty {e^{{{\minus} \delta _{3} T_{k} }} f(Y_{k} )} $
a.s. which does not depend on u, and therefore
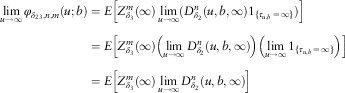 $$\eqalignno{ \mathop {{\rm lim}}\limits_{u\to\infty} \varphi _{{\delta _{{23}} ,n,m}} (u;b) & = E\left[ {Z_{{\delta _{3} }}^{m} (\infty)\mathop {{\rm lim}}\limits_{u\to\infty} (D_{{\delta _{2} }}^{n} (u,b,\infty)1_{{\{ \tau _{{u,b}}\, =\,\infty\} }} )} \right] \cr & = E\left[ {Z_{{\delta _{3} }}^{m} (\infty)\left( {\mathop {{\rm lim}}\limits_{u\to\infty} D_{{\delta _{2} }}^{n} (u,b,\infty)} \right)\left( {\mathop {{\rm lim}}\limits_{u\to\infty} 1_{{\{ \tau _{{u,b}} \,=\,\infty\} }} } \right)} \right] \cr & = E\left[ {Z_{{\delta _{3} }}^{m} (\infty)\mathop {{\rm lim}}\limits_{u\to\infty} D_{{\delta _{2} }}^{n} (u,b,\infty)} \right] $$
In the second equality above, we have used the fact that the limit of product is the product of limits as long as the individual limits exist. While the limit of
 $1_{{\{ \tau _{{u,b}} \,=\,\infty\} }} $
is given by (A.7), the limit
$1_{{\{ \tau _{{u,b}} \,=\,\infty\} }} $
is given by (A.7), the limit
 $${{\rm lim}}_{u\to\infty} D_{{\delta _{2} }} (u,b,\infty)$$
exists because
$${{\rm lim}}_{u\to\infty} D_{{\delta _{2} }} (u,b,\infty)$$
exists because
 $$D_{{\delta _{2} }} (u,b,\infty)$$
is increasing in u and bounded by α/δ
2.
$$D_{{\delta _{2} }} (u,b,\infty)$$
is increasing in u and bounded by α/δ
2.
Next, for any realisation of
 $$\{ S(t)\} _{{t\, \geq \, 0}} $$
, the event
$$\{ S(t)\} _{{t\, \geq \, 0}} $$
, the event
 $\{ U_{b} (s)\, \geq \, b\,{\rm for}\,{\rm all}\,s\, \geq \, 0\} $
(for
$\{ U_{b} (s)\, \geq \, b\,{\rm for}\,{\rm all}\,s\, \geq \, 0\} $
(for
 $$\{ U_{b} (t)\} _{{t\, \geq \, 0}} $$
starting with initial surplus u≥b) is equivalent to the event
$$\{ U_{b} (t)\} _{{t\, \geq \, 0}} $$
starting with initial surplus u≥b) is equivalent to the event
 $\{ \tau _{{u\,{\minus}\,b,0}} =\infty\} $
(for
$\{ \tau _{{u\,{\minus}\,b,0}} =\infty\} $
(for
 $$\{ U_{0} (t)\} _{{t\, \geq \, 0}} $$
starting with u−b). Since
$$\{ U_{0} (t)\} _{{t\, \geq \, 0}} $$
starting with u−b). Since
 ${{\rm lim}}_{u\to\infty\,} \psi (u\,{\minus}\,b;0)=0$
, using the same arguments leading to (A.7) yields
${{\rm lim}}_{u\to\infty\,} \psi (u\,{\minus}\,b;0)=0$
, using the same arguments leading to (A.7) yields
 ${{\rm lim}}_{u\to\infty} 1_{{\{ \tau _{{u\,{\minus}\,b,0}}\, =\,\infty\} }} =1$
a.s. and hence
${{\rm lim}}_{u\to\infty} 1_{{\{ \tau _{{u\,{\minus}\,b,0}}\, =\,\infty\} }} =1$
a.s. and hence
 ${{\rm lim}}_{u\to\infty} 1_{{\{ U_{b} (s)\, \geq \, b\,{\rm for}\,{\rm all}\,s\, \geq \, 0\} }} =1$
a.s.. By consolidating these observations, it is found that
${{\rm lim}}_{u\to\infty} 1_{{\{ U_{b} (s)\, \geq \, b\,{\rm for}\,{\rm all}\,s\, \geq \, 0\} }} =1$
a.s.. By consolidating these observations, it is found that
 $$\eqalignno{ \mathop {{\rm lim}}\limits_{u\to\infty} \varphi _{{\delta _{{23}} ,n,m}} (u;b) & = E\left[ {Z_{{\delta _{3} }}^{m} (\infty)\mathop {{\rm lim}}\limits_{u\to\infty} (D_{{\delta _{2} }}^{n} (u,b,\infty)1_{{\{ U_{b} (s)\, \geq \, b\,{\rm for}\,{\rm all}\,s\, \geq \, 0\} }} )} \right] \cr & = E\left[ {Z_{{\delta _{3} }}^{m} (\infty)\mathop {{\rm lim}}\limits_{u\to\infty} \left( {\left( {{\alpha \over {\delta _{2} }}} \right)^{n} 1_{{\{ U_{b} (s)\, \geq \, b\,{\rm for}\,{\rm all}\,s\, \geq \, 0\} }} } \right)} \right] \cr & = \left( {{\alpha \over {\delta _{2} }}} \right)^{n} E\left[ {\left( {\mathop{\sum}\limits_{k\,=1\,}^\infty {e^{{{\minus} \delta _{3} T_{k} }} f(Y_{k} )} } \right)^{m} } \right] $$
Note that we have also used the fact that
 $D_{{\delta _{2} }} (u,b,\infty)=\alpha \mathop{\int}\nolimits_0^\infty {e^{{{\minus} \delta _{2} s}} 1_{{\{ U_{b} (s)\, \geq \, b\} }} \:ds=\alpha /\delta _{2} } $
on the set
$D_{{\delta _{2} }} (u,b,\infty)=\alpha \mathop{\int}\nolimits_0^\infty {e^{{{\minus} \delta _{2} s}} 1_{{\{ U_{b} (s)\, \geq \, b\} }} \:ds=\alpha /\delta _{2} } $
on the set
 $\{ U_{b} (s)\, \geq \, b\,{\rm for}\,{\rm all}\,s\, \geq \, 0\} $
as well as
$\{ U_{b} (s)\, \geq \, b\,{\rm for}\,{\rm all}\,s\, \geq \, 0\} $
as well as
 $Z_{{\delta _{3} }} (\infty)=\mathop{\sum}\nolimits_{k\,=1\,}^\infty {e^{{{\minus} \delta _{3} T_{k} }} f(Y_{k} )} $
a.s. in the last two equalities. From the definition (2.11), the result (2.12) follows, from which it is clear that the right-hand side is finite if
$Z_{{\delta _{3} }} (\infty)=\mathop{\sum}\nolimits_{k\,=1\,}^\infty {e^{{{\minus} \delta _{3} T_{k} }} f(Y_{k} )} $
a.s. in the last two equalities. From the definition (2.11), the result (2.12) follows, from which it is clear that the right-hand side is finite if
 $$\theta _{{\delta _{3} ,m}} $$
is finite (and from Remark 6 a sufficient condition for this is that the mth moment of f(Y
1) is finite). □
$$\theta _{{\delta _{3} ,m}} $$
is finite (and from Remark 6 a sufficient condition for this is that the mth moment of f(Y
1) is finite). □
Proof of Lemma 3: Suppose that w(·, ·) is bounded by a constant W. Using the notations in the proof of Lemma 2, we have that, for
 $$n,m\in {\Bbb N}$$
 $$\eqalignno{ \mathop {{\rm lim}}\limits_{u\to\infty} \phi _{{\delta _{{123}} ,n,m}} (u;b) =& \mathop {{\rm lim}}\limits_{u\to\infty} E[e^{{{\minus} \delta _{1} \tau _{{u,b}} }} D_{{\delta _{2} }}^{n} (u,b,\tau _{{u,b}} )Z_{{\delta _{3} }}^{m} (\tau _{{u,b}} )w(U_{b} (\tau _{{u,b}}^{\,{\minus}\,} ), \!\! \mid \! \! U_{b} (\tau _{{u,b}} ) \! \! \mid \! )1_{{\{ \tau _{{u,b}} \,\lt \, \infty\} }} ] \cr & \leq W\mathop {{\rm lim}}\limits_{u\to\infty} E[D_{{\delta _{2} }}^{n} (u,b,\tau _{{u,b}} )Z_{{\delta _{3} }}^{m} (\tau _{{u,b}} )1_{{\{ \tau _{{u,b}} \,\lt \, \infty\} }} ] \cr & = W\mathop {{\rm lim}}\limits_{u\to\infty} (E[D_{{\delta _{2} }}^{n} (u,b,\tau _{{u,b}} )Z_{{\delta _{3} }}^{m} (\tau _{{u,b}} )]\,{\minus}\,E[D_{{\delta _{2} }}^{n} (u,b,\tau _{{u,b}} )Z_{{\delta _{3} }}^{m} (\tau _{{u,b}} )1_{{\{ \tau _{{u,b}} \,=\,\infty\} }} ]) $$
 $$\hskip -10pt= W\left( {\mathop {{\rm lim}}\limits_{u\to\infty} E[D_{{\delta _{2} }}^{n} (u,b,\tau _{{u,b}} )Z_{{\delta _{3} }}^{m} (\tau _{{u,b}} )]\,{\minus}\,\mathop {{\rm lim}}\limits_{u\to\infty} \varphi _{{\delta _{{23}} ,n,m}} (u;b)} \right)$$
One can apply Monotone Convergence Theorem to the first limit to yield
 $$\mathop {{\rm lim}}\limits_{u\to\infty} E[D_{{\delta _{2} }}^{n} (u,b,\tau _{{u,b}} )Z_{{\delta _{3} }}^{m} (\tau _{{u,b}} )]=E\left[ {\mathop {{\rm lim}}\limits_{u\to\infty} (D_{{\delta _{2} }}^{n} (u,b,\tau _{{u,b}} )Z_{{\delta _{3} }}^{m} (\tau _{{u,b}} ))} \right]=\mathop {{\rm lim}}\limits_{u\to\infty} \varphi _{{\delta _{{23}} \!,n,m}} (u;b)$$
where the last equality follows from (A.7) and (A.8). For a given
 $$m\in {\Bbb N}$$
, the limit
$$m\in {\Bbb N}$$
, the limit
 $${{\rm lim}}_{u\to\infty} \varphi _{{\delta _{{23}} ,n,m}} (u;b)$$
on the right-hand side is finite according to Lemma 2 since we assume that
$${{\rm lim}}_{u\to\infty} \varphi _{{\delta _{{23}} ,n,m}} (u;b)$$
on the right-hand side is finite according to Lemma 2 since we assume that
 $$\theta _{{\delta _{3} ,m}} $$
is finite. As both limits appearing in (A.10) are equal, one has that
$$\theta _{{\delta _{3} ,m}} $$
is finite. As both limits appearing in (A.10) are equal, one has that
 $${{\rm lim}}_{u\to\infty} \phi _{{\delta _{{123}} ,n,m}} (u;b)\leq 0$$
, which along with the non-negativity of
$${{\rm lim}}_{u\to\infty} \phi _{{\delta _{{123}} ,n,m}} (u;b)\leq 0$$
, which along with the non-negativity of
 $$\phi _{{\delta _{{123}} ,n,m}} (u;b)$$
results in (2.13). (Note that we require both
$$\phi _{{\delta _{{123}} ,n,m}} (u;b)$$
results in (2.13). (Note that we require both
 $E[D_{{\delta _{2} }}^{n} (u,b,\tau _{{u,b}} )Z_{{\delta _{3} }}^{m} (\tau _{{u,b}} )]$
and
$E[D_{{\delta _{2} }}^{n} (u,b,\tau _{{u,b}} )Z_{{\delta _{3} }}^{m} (\tau _{{u,b}} )]$
and
 $E[D_{{\delta _{2} }}^{n} (u,b,\tau _{{u,b}} )Z_{{\delta _{3} }}^{m} (\tau _{{u,b}} )1_{{\{ \tau _{{u,b}} \,= \, \infty\} }} ]$
to be finite in obtaining the equality (A.9). But this must be true as both expectations are increasing in u and converge to a finite limit.)□
$E[D_{{\delta _{2} }}^{n} (u,b,\tau _{{u,b}} )Z_{{\delta _{3} }}^{m} (\tau _{{u,b}} )1_{{\{ \tau _{{u,b}} \,= \, \infty\} }} ]$
to be finite in obtaining the equality (A.9). But this must be true as both expectations are increasing in u and converge to a finite limit.)□
Proof of Theorem 4: When m=0, the IDE (2.5) becomes, for 0<u<b
 $$c_{1} \phi '_{{L,\delta _{{12}}\! ,n}} (u;b)\,{\minus}\,(\lambda {\plus}\delta _{1} {\plus}n\delta _{2} )\phi _{{L,\delta _{{12}} ,n}} (u;b){\plus}\lambda \mathop{\int}\nolimits_0^u {\phi _{{L,\delta _{{12}} ,n}} (u\,{\minus}\,y;b)p(y)\, dy=0} $$
which is structurally identical to e.g. Gerber et al. (Reference Gerber, Shiu and Smith2006, equation (2.12)). Therefore, the solution form (3.13) along with (3.16) is a direct consequence of their equations (7.3) and (7.8).
Next, (3.14), (3.15), and (3.17) can be proved by induction on
 $$n\in {\Bbb N}^{\!{\plus}} $$
. To begin, we look at the case n=1. From (2.6), we have that, for u>b
$$n\in {\Bbb N}^{\!{\plus}} $$
. To begin, we look at the case n=1. From (2.6), we have that, for u>b
 $$\eqalignno{ & c_{2} \phi '_{{U,\delta _{{12}} ,1}} (u;b)\,{\minus}\,(\lambda {\plus}\delta _{1} {\plus}\delta _{2} )\phi _{{U,\delta _{{12}} ,1}} (u;b){\plus}\alpha \phi _{{U,\delta _{1} }} (u;b){\plus}\lambda \mathop{\int}\nolimits_0^{u\,{\minus}\,b} {\phi _{{U,\delta _{{12}} ,1}} (u\,{\minus}\,y;b)p(y)\, dy} \cr & \quad{\plus}\lambda \mathop{\int}\nolimits_{u\,{\minus}\,b}^u {\phi _{{L,\delta _{{12}} ,1}} (u\,{\minus}\,y;b)p(y)\, dy=0} $$
Using the density (3.1) and (3.13) with n=1 leads the last integral in (A.11) to
 $$\lambda \mathop{\int}\nolimits_{u\,{\minus}\,b}^u \phi _{{L,\delta _{{12}} ,1}} (u\,{\minus}\,y;b)p(y)\, dy=\lambda \mathop{\sum}\limits_{j=1}^{r{\plus}1} {\mathop{\sum}\limits_{k\,=1\,}^r {{{A_{{1,0,0,j}} q_{k} \mu _{k} } \over {\mu _{k} {\plus}\rho _{{1,0,j}} }}} } \left( {e^{{(\mu _{k} {\plus}\rho _{{1,0,j}} )b}} \,{\minus}\,1} \right)e^{{{\minus} \mu _{k} u}} $$
Because
 $(d/du{\plus}\mu _{k} )\mathop{\int}\nolimits_0^{u\,{\minus}\,b} {\phi _{{U,\delta _{{12}} ,1}} (u\,{\minus}\,y;b)e^{{{\minus} \mu _{k} y}} \, dy=\phi _{{U,\delta _{{12}} ,1}} (u;b)} $
, insertion of (3.1), (A.12), and
$(d/du{\plus}\mu _{k} )\mathop{\int}\nolimits_0^{u\,{\minus}\,b} {\phi _{{U,\delta _{{12}} ,1}} (u\,{\minus}\,y;b)e^{{{\minus} \mu _{k} y}} \, dy=\phi _{{U,\delta _{{12}} ,1}} (u;b)} $
, insertion of (3.1), (A.12), and
 $$\phi _{{U,\delta _{1} }} (u;b)$$
given in Lemma 4 into (A.11) followed by application of the operator
$$\phi _{{U,\delta _{1} }} (u;b)$$
given in Lemma 4 into (A.11) followed by application of the operator
 $\prod\nolimits_{k\,=1\,}^r {(d/du{\plus}\mu _{k} )} $
results in an (r+1)th order differential equation with constant coefficients satisfied by
$\prod\nolimits_{k\,=1\,}^r {(d/du{\plus}\mu _{k} )} $
results in an (r+1)th order differential equation with constant coefficients satisfied by
 $$\phi _{{U,\delta _{{12}} ,1}} ( \cdot ;b)$$
. Note that the non-homogeneous part of this differential equation involves the exponential terms
$$\phi _{{U,\delta _{{12}} ,1}} ( \cdot ;b)$$
. Note that the non-homogeneous part of this differential equation involves the exponential terms
 $$\{ e^{{\kappa _{{0,0,j}} u}} \} _{{j=1}}^{r} $$
. Let
$$\{ e^{{\kappa _{{0,0,j}} u}} \} _{{j=1}}^{r} $$
. Let
 $$\{ \kappa _{{1,0,j}} \} _{{j=1}}^{{r{\plus}1}} $$
be the roots of the characteristic equation of the homogeneous part. Later we will see that
$$\{ \kappa _{{1,0,j}} \} _{{j=1}}^{{r{\plus}1}} $$
be the roots of the characteristic equation of the homogeneous part. Later we will see that
 $$\{ \kappa _{{1,0,j}} \} _{{j=1}}^{{r{\plus}1}} $$
are really Lundberg’s roots defined via (3.2). Then, we arrive at the solution form
$$\{ \kappa _{{1,0,j}} \} _{{j=1}}^{{r{\plus}1}} $$
are really Lundberg’s roots defined via (3.2). Then, we arrive at the solution form
 $$\phi _{{U,\delta _{{12}} ,1}} (u;b)=\mathop{\sum}\limits_{j=1}^r {A_{{1,0,0,0,j}}^{{\asterisk}} e^{{\kappa _{{0,0,j}} u}} } {\plus}\mathop{\sum}\limits_{j=1}^{r{\plus}1} {A_{{1,0,1,0,j}}^{{\asterisk}} e^{{\kappa _{{1,0,j}} u}} } ,\quad \quad u \, \gt \, b$$
where
 $$A_{{1,0,i,0,j}}^{{\asterisk}} $$
’s are constants to be determined. Utilising (3.1), (3.8), and (A.13), we evaluate the first four terms in (A.11) as
$$A_{{1,0,i,0,j}}^{{\asterisk}} $$
’s are constants to be determined. Utilising (3.1), (3.8), and (A.13), we evaluate the first four terms in (A.11) as
 $$\eqalignno{ c_{2} & \phi '_{{U,\delta _{{12}} ,1}} (u;b)\,{\minus}\,(\lambda {\plus}\delta _{1} {\plus}\delta _{2} )\phi _{{U,\delta _{{12}}\! ,1}} (u;b){\plus}\alpha \phi _{{U,\delta _{1} }} (u;b){\plus}\lambda \mathop{\int}\nolimits_0^{u\,{\minus}\,b} {\phi _{{U,\delta _{{12}} ,1}} (u\,{\minus}\,y;b)p(y)\, dy} \cr & = c_{2} \left( {\mathop{\sum}\limits_{j=1}^r {A_{{1,0,0,0,j}}^{{\asterisk}} \kappa _{{0,0,j}} e^{{\kappa _{{0,0,j}} u}} } {\plus}\mathop{\sum}\limits_{j=1}^{r{\plus}1} {A_{{1,0,1,0,j}}^{{\asterisk}} \kappa _{{1,0,j}} e^{{\kappa _{{1,0,j}} u}} } } \right) \cr & \,{\minus}\,(\lambda {\plus}\delta _{1} {\plus}\delta _{2} )\left( {\mathop{\sum}\limits_{j=1}^r {A_{{1,0,0,0,j}}^{{\asterisk}} e^{{\kappa _{{0,0,j}} u}} } {\plus}\mathop{\sum}\limits_{j=1}^{r{\plus}1} {A_{{1,0,1,0,j}}^{{\asterisk}} e^{{\kappa _{{1,0,j}} u}} } } \right){\plus}\alpha \mathop{\sum}\limits_{j=1}^r {A_{{0,0,0,0,j}}^{{\asterisk}} e^{{\kappa _{{0,0,j}} u}} } \cr & {\plus}\,\lambda \mathop{\sum}\limits_{j=1}^r {\mathop{\sum}\limits_{k\,=1\,}^r {{{A_{{1,0,0,0,j}}^{{\asterisk}} q_{k} \mu _{k} } \over {\mu _{k} {\plus}\kappa _{{0,0,j}} }}(e^{{\kappa _{{0,0,j}} u}} \,{\minus}\,e^{{(\mu _{k} {\plus}\kappa _{{0,0,j}} )b}} e^{{{\minus} \mu _{k} u}} )} } {\plus}\lambda \mathop{\sum}\limits_{j=1}^{r{\plus}1} {\mathop{\sum}\limits_{k =1}^r {{{A_{{1,0,1,0,j}}^{{\asterisk}} q_{k} \mu _{k} } \over {\mu _{k} {\plus}\kappa _{{1,0,j}} }}(e^{{\kappa _{{1,0,j}} u}} \,{\minus}\,e^{{(\mu _{k} {\plus}\kappa _{{1,0,j}} )b}} e^{{{\minus} \mu _{k } u}} )} } $$
As the sum of (A.12) and (A.14) is 0 for all u>b due to (A.11), relationships among the unknown constants in (A.13) can be obtained by equating various exponential terms with 0. First, examining the coefficients of
 $e^{{\kappa _{{1,0,j}} u}} $
asserts that
$e^{{\kappa _{{1,0,j}} u}} $
asserts that
 $$\{ \kappa _{{1,0,j}} \} _{{j=1}}^{{r{\plus}1}} $$
are the roots of (3.2) when l=2, n=1, and m=0. Since
$$\{ \kappa _{{1,0,j}} \} _{{j=1}}^{{r{\plus}1}} $$
are the roots of (3.2) when l=2, n=1, and m=0. Since
 $\kappa _{{1,0,r{\plus}1}} \gt 0$
, application of the limiting condition (2.13) to (A.13) reveals that
$\kappa _{{1,0,r{\plus}1}} \gt 0$
, application of the limiting condition (2.13) to (A.13) reveals that
 $$A_{{1,0,1,0,r{\plus}1}}^{{\asterisk}} =0$$
(see Remark 9), and therefore we have proved (3.14) when n=1. Next, from the coefficients of
$$A_{{1,0,1,0,r{\plus}1}}^{{\asterisk}} =0$$
(see Remark 9), and therefore we have proved (3.14) when n=1. Next, from the coefficients of
 $e^{{\kappa _{{0,0,j}} u}} $
, we get
$e^{{\kappa _{{0,0,j}} u}} $
, we get
 $$c_{2} A_{{1,0,0,0,j}}^{{\asterisk}} \kappa _{{0,0,j}} \,{\minus}\,(\lambda {\plus}\delta _{1} {\plus}\delta _{2} )A_{{1,0,0,0,j}}^{{\asterisk}} {\plus}\alpha A_{{0,0,0,0,j}}^{{\asterisk}} {\plus}\lambda \mathop{\sum}\limits_{k=1}^r {{{A_{{1,0,0,0,j}}^{{\asterisk}} q_{k} \mu _{k } } \over {\mu _{k} {\plus}\kappa _{{0,0,j}} }}=0} ,\quad \quad j=1,2,\,\ldots\,,r$$
which leads to (3.15) when n=1 because each
 $\kappa _{{0,0,j}} $
satisfies (3.2) when l=2 and n=m=0. Lastly, the coefficients of
$\kappa _{{0,0,j}} $
satisfies (3.2) when l=2 and n=m=0. Lastly, the coefficients of
 $e^{{{\minus} \mu _{\kappa } u}} $
along with the use of
$e^{{{\minus} \mu _{\kappa } u}} $
along with the use of
 $$A_{{1,0,1,0,r{\plus}1}}^{{\asterisk}} =0$$
imply
$$A_{{1,0,1,0,r{\plus}1}}^{{\asterisk}} =0$$
imply
 $$\,{\minus}\lambda \mathop{\sum}\limits_{i\,=\,0}^1 {\mathop{\sum}\limits_{j=1}^r {{{A_{{1,0,i,0,j}}^{{\asterisk}} q_{k} \mu _{k} } \over {\mu _{k} {\plus}\kappa _{{i,0,j}} }}e^{{(\mu _{k} {\plus}\kappa _{{i,0,j}} )b}} } } {\plus}\lambda \mathop{\sum}\limits_{j=1}^{r{\plus}1} {{{A_{{1,0,0,j}} q_{k} \mu _{k} } \over {\mu _{k } {\plus}\rho _{{1,0,j}} }}(e^{{(\mu _{k} {\plus}\rho _{{1,0,j}} )b}} \,{\minus}\,1)=0} ,\quad \quad k =1,2,\,\ldots\,,r$$
One can use (3.16) when n=1 to simplify the above equation and observe that (3.17) holds true when n=1. Having shown that (3.14), (3.15), and (3.17) are true for n=1, mathematical induction can be applied to prove that they are also valid for all
 $$n\in {\Bbb N}^{\!{\plus}} $$
. Since the induction step is almost identical to the above proof, the details are omitted here. Finally, (3.18) is a result of the continuity condition (2.7) and the solutions (3.13) and (3.14). □
$$n\in {\Bbb N}^{\!{\plus}} $$
. Since the induction step is almost identical to the above proof, the details are omitted here. Finally, (3.18) is a result of the continuity condition (2.7) and the solutions (3.13) and (3.14). □
Proof of Theorem 5: It is instructive to note that the analysis of the IDE for the lower layer is identical to that in Theorem 4. Therefore, it is clear that (3.19) and (3.22) hold true. Moreover, once the solution (3.20) in the upper layer is proved (in what follows), (3.24) simply comes from the continuity condition (2.10).
Like the proof of Theorem 4, we shall focus on proving (3.20), (3.21), and (3.23) for n=1, as the induction step is essentially the same as this first step. When n=1 and m=0, (2.9) becomes, for u>b
 $$\eqalignno{ & c_{2} \varphi '_{{U,\delta _{2} ,1}} (u;b)\,{\minus}\,(\lambda {\plus}\delta _{2} )\varphi _{{U,\delta _{2} ,1}} (u;b){\plus}\alpha \varphi _{U} (u;b){\plus}\lambda \mathop{\int}\nolimits_0^{u\,{\minus}\,b} {\varphi _{{U,\delta _{2} ,1}} (u\,{\minus}\,y;b)p(y)\, dy} \cr & \quad{\plus}\lambda \mathop{\int}\nolimits_{u\,{\minus}\,b}^u \varphi _{{L,\delta _{2} ,1}} (u\,{\minus}\,y;b)p(y)\, dy=0 $$
Although the above IDE looks identical to (A.11), it contains the starting point
 $\varphi _{U} (u;b)$
(given in (3.12)) which involves an additional constant term compared to the starting point
$\varphi _{U} (u;b)$
(given in (3.12)) which involves an additional constant term compared to the starting point
 $\phi _{{U,\delta _{1} }} (u;b)$
(given in (3.8)) of (A.11). See Remark 5. Similar to the derivations of Theorem 4, application of the operator
$\phi _{{U,\delta _{1} }} (u;b)$
(given in (3.8)) of (A.11). See Remark 5. Similar to the derivations of Theorem 4, application of the operator
 $$\prod\nolimits_{k=1}^r {(d/du{\plus}\mu _{k} )} $$
leads (A.15) to an (r+1)th order differential equation with constant coefficients as well as some non-homogeneous terms involving a constant and the exponential terms
$$\prod\nolimits_{k=1}^r {(d/du{\plus}\mu _{k} )} $$
leads (A.15) to an (r+1)th order differential equation with constant coefficients as well as some non-homogeneous terms involving a constant and the exponential terms
 $\{ e^{{\kappa _{{0,0,j}}^{{\asterisk}} u}} \} _{{j=1}}^{r} $
. We shall see that the roots of the characteristic equation of the homogeneous part are the Lundberg’s roots
$\{ e^{{\kappa _{{0,0,j}}^{{\asterisk}} u}} \} _{{j=1}}^{r} $
. We shall see that the roots of the characteristic equation of the homogeneous part are the Lundberg’s roots
 $$\{ \kappa _{{1,0,j}}^{{\asterisk}} \} _{{j=1}}^{{r{\plus}1}} $$
, and hence the general solution of
$$\{ \kappa _{{1,0,j}}^{{\asterisk}} \} _{{j=1}}^{{r{\plus}1}} $$
, and hence the general solution of
 $\varphi _{{U,\delta _{2} ,1}} (u;b)$
is
$\varphi _{{U,\delta _{2} ,1}} (u;b)$
is
 $$\varphi _{{U,\delta _{2} ,1}} (u;b)=\mathop{\sum}\limits_{j=1}^r {C_{{1,0,0,0,j}}^{{\asterisk}} e^{{\kappa _{{0,0,j}}^{{\asterisk}} u}} } {\plus}\mathop{\sum}\limits_{j=1}^{r{\plus}1} {C_{{1,0,1,0,j}}^{{\asterisk}} e^{{\kappa _{{1,0,j}}^{{\asterisk}} u}} } {\plus}E_{{1,0}} ,\quad \quad u\, \gt \, b$$
for some constants
 $$C_{{1,0,0,0,j}}^{{\asterisk}} $$
’s,
$$C_{{1,0,0,0,j}}^{{\asterisk}} $$
’s,
 $$C_{{1,0,1,0,j}}^{{\asterisk}} $$
’s, and E
1,0. Substitution of (3.1), (3.12), (3.19) with n=1, and (A.16) into the left-hand side of (A.15) followed by straightforward calculations yields
$$C_{{1,0,1,0,j}}^{{\asterisk}} $$
’s, and E
1,0. Substitution of (3.1), (3.12), (3.19) with n=1, and (A.16) into the left-hand side of (A.15) followed by straightforward calculations yields
 $$\eqalignno{ 0=\,& c_{2} \left( {\mathop{\sum}\limits_{j=1}^r C_{{1,0,0,0,j}}^{{\asterisk}} \kappa _{{0,0,j}}^{{\asterisk}} e^{{\kappa _{{0,0,j}}^{{\asterisk}} u}} {\plus}\mathop{\sum}\limits_{j=1}^{r{\plus}1} C_{{1,0,1,0,j}}^{{\asterisk}} \kappa _{{1,0,j}}^{{\asterisk}} e^{{\kappa _{{1,0,j}}^{{\asterisk}} u}} } \right) \cr & \,{\minus}\,(\lambda {\plus}\delta _{2} )\left( {\mathop{\sum}\limits_{j=1}^r C_{{1,0,0,0,j}}^{{\asterisk}} e^{{\kappa _{{0,0,j}}^{{\asterisk}} u}} {\plus}\mathop{\sum}\limits_{j=1}^{r{\plus}1} C_{{1,0,1,0,j}}^{{\asterisk}} e^{{\kappa _{{1,0,j}}^{{\asterisk}} u}} {\plus}E_{{1,0}} } \right){\plus}\alpha \left( {\mathop{\sum}\limits_{j=1}^r C_{{0,0,0,0,j}}^{{\asterisk}} e^{{\kappa _{{0,0,j}}^{{\asterisk}} u}} {\plus}1} \right) \cr & {\plus}\, \lambda \mathop{\sum}\limits_{j=1}^r \mathop{\sum}\limits_{k\,=1\,}^r {{C_{{1,0,0,0,j}}^{{\asterisk}} q_{k} \mu _{k} } \over {\mu _{k} {\plus}\kappa _{{0,0,j}}^{{\asterisk}} }}\left( {e^{{\kappa _{{0,0,j}}^{{\asterisk}} u}} \,{\minus}\,e^{{(\mu _{k} {\plus}\kappa _{{0,0,j}}^{{\asterisk}} )b}} e^{{{\minus} \mu _{k} u}} } \right) \cr & {\plus}\, \lambda \mathop{\sum}\limits_{j=1}^{r{\plus}1} \mathop{\sum}\limits_{k\,=1\,}^r {{C_{{1,0,1,0,j}}^{{\asterisk}} q_{k} \mu _{k} } \over {\mu _{k} {\plus}\kappa _{{1,0,j}}^{{\asterisk}} }}\left( {e^{{\kappa _{{1,0,j}}^{{\asterisk}} u}} \,{\minus}\,e^{{(\mu _{k} {\plus}\kappa _{{1,0,j}}^{{\asterisk}} )b}} e^{{{\minus} \mu _{k} u}} } \right){\plus}\lambda E_{{1,0}} \mathop{\sum}\limits_{k\,=1\,}^r q_{k} (1\,{\minus}\,e^{{\mu _{k} b}} e^{{{\minus} \mu _{k} u}} ) \cr & {\plus}\, \lambda \mathop{\sum}\limits_{j=1}^{r{\plus}1} \mathop{\sum}\limits_{k\,=1\,}^r {{C_{{1,0,0,j}} q_{k} \mu _{k} } \over {\rho _{{1,0,j}}^{{\asterisk}} {\plus}\mu _{k} }}\left( {e^{{(\mu _{k} {\plus}\rho _{{1,0,j}}^{{\asterisk}} )b}} \,{\minus}\,1} \right)e^{{{\minus} \mu _{k} u}} $$
First, one confirms that
 $\{ \kappa _{{1,0,j}}^{{\asterisk}} \} _{{j=1}}^{{r{\plus}1}} $
are the roots of (3.2) when l=2, n=1, and m=δ
1=0 by equating the coefficients of
$\{ \kappa _{{1,0,j}}^{{\asterisk}} \} _{{j=1}}^{{r{\plus}1}} $
are the roots of (3.2) when l=2, n=1, and m=δ
1=0 by equating the coefficients of
 $e^{{\kappa _{{1,0,j}}^{{\asterisk}} u}} $
with 0. Noting that
$e^{{\kappa _{{1,0,j}}^{{\asterisk}} u}} $
with 0. Noting that
 $\kappa _{{1,0,r{\plus}1}}^{{\asterisk}} \, \gt \,0$
, the boundedness of
$\kappa _{{1,0,r{\plus}1}}^{{\asterisk}} \, \gt \,0$
, the boundedness of
 $\varphi _{{U,\delta _{2} ,1}} (u;b)$
as u→∞ according to Lemma 2 means that
$\varphi _{{U,\delta _{2} ,1}} (u;b)$
as u→∞ according to Lemma 2 means that
 $$C_{{1,0,1,0,r{\plus}1}}^{{\asterisk}} =0$$
. Second, the constant term implies E
1,0=α/δ
2, which must be the case because of
$$C_{{1,0,1,0,r{\plus}1}}^{{\asterisk}} =0$$
. Second, the constant term implies E
1,0=α/δ
2, which must be the case because of
 $E_{{1,0}} ={{\rm lim}}_{u\to\infty} \,\varphi _{{\delta _{{23}} ,1,0}} (u)$
and Lemma 2. Thus, the solution form (A.16) reduces to (3.20) when n=1. Finally, using the coefficients of
$E_{{1,0}} ={{\rm lim}}_{u\to\infty} \,\varphi _{{\delta _{{23}} ,1,0}} (u)$
and Lemma 2. Thus, the solution form (A.16) reduces to (3.20) when n=1. Finally, using the coefficients of
 $e^{{\kappa _{{0,0,j}}^{{\asterisk}} u}} $
and
$e^{{\kappa _{{0,0,j}}^{{\asterisk}} u}} $
and
 $e^{{{\minus} \mu _{k} u}} $
, respectively, proves that (3.21) and (3.23) are true for n=1 in the same manner as (3.15) and (3.17) when n=1 are shown. The induction step of the proof of (3.20), (3.21), and (3.23) is omitted.□
$e^{{{\minus} \mu _{k} u}} $
, respectively, proves that (3.21) and (3.23) are true for n=1 in the same manner as (3.15) and (3.17) when n=1 are shown. The induction step of the proof of (3.20), (3.21), and (3.23) is omitted.□
Proof of Theorem 6: We begin by recalling from Remark 4 that
 $\phi _{{\delta _{{13}} ,1}} (u;b)=\phi _{{L,\delta _{{13}} ,1}} (u;b)$
in the lower layer satisfies the same IDE as the counterpart under a dividend barrier strategy. As a result, some results in Cheung et al. (Reference Cheung, Liu and Woo2015, theorem 6) are applicable. In particular, (3.25), (3.27), and (3.29) directly follow from equations (29)–(31) therein. Therefore, it is sufficient to look at the IDE in the upper layer. From (2.3), it is given by, for u>b
$\phi _{{\delta _{{13}} ,1}} (u;b)=\phi _{{L,\delta _{{13}} ,1}} (u;b)$
in the lower layer satisfies the same IDE as the counterpart under a dividend barrier strategy. As a result, some results in Cheung et al. (Reference Cheung, Liu and Woo2015, theorem 6) are applicable. In particular, (3.25), (3.27), and (3.29) directly follow from equations (29)–(31) therein. Therefore, it is sufficient to look at the IDE in the upper layer. From (2.3), it is given by, for u>b
 $$\eqalignno{ & c_{2} \phi '_{{U,\delta _{{13}} ,1}} (u;b)\,{\minus}\,(\lambda {\plus}\delta _{1} {\plus}\delta _{3} )\phi _{{U,\delta _{{13}} ,1}} (u;b){\plus}\lambda \mathop{\int}\nolimits_0^{u\,{\minus}\,b} {\phi _{{U,\delta _{{13}} ,1}} (u\,{\minus}\,y;b)p(y)\, dy} {\plus}\lambda \mathop{\int}\nolimits_{u\,{\minus}\,b}^u {\phi _{{L,\delta _{{13}} ,1}} } (u\,{\minus}\,y;b)p(y)\, dy \cr & {\plus}\lambda \mathop{\int}\nolimits_0^{u\,{\minus}\,b} {y\phi _{{U,\delta _{1} }} } (u\,{\minus}\,y;b)p(y)\, dy{\plus}\lambda \mathop{\int}\nolimits_{u\,{\minus}\,b}^u {y\phi _{{L,\delta _{1} }} (u\,{\minus}\,y;b)p(y)\, dy} {\plus}\lambda \mathop{\int}\nolimits_u^\infty {yw(y\,{\minus}\,u)p(y)\, dy=0} $$
Using (3.1), (3.7), (3.8), and (3.25), the last four integrals in (A.18) are evaluated as
 $$\lambda \mathop{\int}\nolimits_{u\,{\minus}\,b}^u {\phi _{{L,\delta _{{13}} ,1}} (u\,{\minus}\,y;b)p(y)\, dy} =\lambda \mathop{\sum}\limits_{i\,=\,0}^1 {\mathop{\sum}\limits_{j=1}^{r{\plus}1} {\mathop{\sum}\limits_{k =1}^r {{{A_{{0,1,i,j}} q_{k} \mu _{k} } \over {\mu _{k} {\plus}\rho _{{0,i,j}} }}(e^{{(\mu _{k} {\plus}\rho _{{0,i,j}} )b}} \,{\minus}\,1)e^{{{\minus} \mu _{k} u}} } } } $$
 $$\eqalignno{ \lambda \mathop{\int}\nolimits_0^{u\,{\minus}\,b} {y\phi _{{U,\delta _{1} }} (u\,{\minus}\,y;b)p(y)\, dy} & =\lambda \mathop{\sum}\limits_{j=1}^r {\mathop{\sum}\limits_{k\,=1\,}^r {A_{{0,0,0,0,j}}^{{\asterisk}} q_{k} \mu _{k} \left[ {{1 \over {(\mu _{k} {\plus}\kappa _{{0,0,j}} )^{2} }}e^{{\kappa _{{0,0,j}} u}} \,{\minus}\,{1 \over {\mu _{k} {\plus}\kappa _{{0,0,j}} }}e^{{(\mu _{k} {\plus}\kappa _{{0,0,j}} )b}} ue^{{{\minus} \mu _{k} u}} } \right.} } \cr & \quad \left. {{\plus}\left( {{b \over {\mu _{k} {\plus}\kappa _{{0,0,j}} }}\,{\minus}\,{1 \over {(\mu _{k} {\plus}\kappa _{{0,0,j}} )^{2} }}} \right)e^{{(\mu _{k} {\plus}\kappa _{{0,0,j}} )b}} e^{{{\minus} \mu _{k} u}} } \right] $$
 $$\eqalignno{ \lambda \mathop{\int}\nolimits_{u\,{\minus}\,b}^u {y\phi _{{L,\delta _{1} }} (u\,{\minus}\,y;b)p(y)\, dy} =& \,\lambda \mathop{\sum}\limits_{j=1}^{r{\plus}1} {\mathop{\sum}\limits_{k\,=1\,}^r {A_{{0,0,0,j}} q_{k} \mu _{k} \left \{ {1 \over {\mu _{k} {\plus}\rho _{{0,0,j}} }}(e^{{(\mu _{k} {\plus}\rho _{{0,0,j}} )b}} \,{\minus}\,1)ue^{{{\minus} \mu _{k} u}} } }\right}} \cr & \left {\plus}\left[ {{\minus}{b \over {\mu _{k} {\plus}\rho _{{0,0,j}} }}e^{{(\mu _{k} {\plus}\rho _{{0,0,j}} )b}} {\plus}{1 \over {(\mu _{k} {\plus}\rho _{{0,0,j}} )^{2} }}(e^{{(\mu _{k} {\plus}\rho _{{0,0,j}} )b}} \,{\minus}\,1)} \right]e^{{{\minus} \mu _{k} u}} \right \} \left $$
and
 $$\lambda \mathop{\int}\nolimits_u^\infty {yw(y\,{\minus}\,u)p(y)\, dy} =\lambda \mathop{\sum}\limits_{k\,=1\,}^r {q_{k} \mu _{k} \tilde{w}(\mu _{k} )ue^{{{\minus} \mu _{k} u}} } {\plus}\lambda \mathop{\sum}\limits_{k\,=1\,}^r {q_{k} \mu _{k} {\cal T}_{{\mu _{k} }}^{2} w(0)e^{{{\minus} \mu _{k} u}} } $$
Applying the operator
 $\prod\nolimits_{k\,=1\,}^r {(d/du{\plus}\mu _{k} )} $
to (A.18) yields an (r+1)th order differential equation with constant coefficients, and the non-homogeneous terms involve the exponential terms
$\prod\nolimits_{k\,=1\,}^r {(d/du{\plus}\mu _{k} )} $
to (A.18) yields an (r+1)th order differential equation with constant coefficients, and the non-homogeneous terms involve the exponential terms
 $\{ e^{{\kappa _{{0,0,j}} u}} \} _{{j=1}}^{r} $
and
$\{ e^{{\kappa _{{0,0,j}} u}} \} _{{j=1}}^{r} $
and
 $$\{ e^{{{\minus} \mu _{k} u}} \} _{{k\,=1\,}}^{r} $$
. As the Lundberg’s roots
$$\{ e^{{{\minus} \mu _{k} u}} \} _{{k\,=1\,}}^{r} $$
. As the Lundberg’s roots
 $\{ \kappa _{{0,1,j}} \} _{{j=1}}^{{r{\plus}1}} $
will be shown to satisfy the characteristic equation of the homogeneous part, we arrive at the solution form
$\{ \kappa _{{0,1,j}} \} _{{j=1}}^{{r{\plus}1}} $
will be shown to satisfy the characteristic equation of the homogeneous part, we arrive at the solution form
 $$\phi _{{U,\delta _{{13}} ,1}} (u;b)=\mathop{\sum}\limits_{j=1}^r {A_{{0,1,0,0,j}}^{{\asterisk}} e^{{\kappa _{{0,0,j}} u}} } {\plus}\mathop{\sum}\limits_{j=1}^{r{\plus}1} {A_{{0,1,0,1,j}}^{{\asterisk}} e^{{\kappa _{{0,1,j}} u}} } {\plus}\mathop{\sum}\limits_{k\,=1\,}^r {B_{{0,1,0,k}}^{{\asterisk}} e^{{{\minus} \mu _{k} u}} } ,\quad \quad u\, \gt \, b$$
for some constants
 $$A_{{0,1,0,i,j}}^{{\asterisk}} $$
’s and
$$A_{{0,1,0,i,j}}^{{\asterisk}} $$
’s and
 $$B_{{0,1,0,k}}^{{\asterisk}} $$
’s. With (3.1) and (A.23), the first three terms in (A.18) are found to be
$$B_{{0,1,0,k}}^{{\asterisk}} $$
’s. With (3.1) and (A.23), the first three terms in (A.18) are found to be
 $$\eqalignno{ & c_{2} \phi '_{{U,\delta _{{13}} ,1}} (u;b)\,{\minus}\,(\lambda {\plus}\delta _{1} {\plus}\delta _{3} )\phi _{{U,\delta _{{13}} ,1}} (u;b){\plus}\lambda \mathop{\int}\nolimits_0^{u\,{\minus}\,b} {\phi _{{U,\delta _{{13}} ,1}} (u\,{\minus}\,y;b)p(y)\, dy} $$
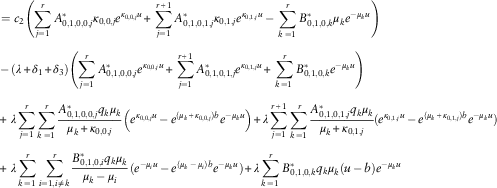 $$\eqalignno{ & = c_{2} \left( {\mathop{\sum}\limits_{j=1}^r {A_{{0,1,0,0,j}}^{{\asterisk}} \kappa _{{0,0,j}} e^{{\kappa _{{0,0,j}} u}} } {\plus}\mathop{\sum}\limits_{j=1}^{r{\plus}1} {A_{{0,1,0,1,j}}^{{\asterisk}} \kappa _{{0,1,j}} e^{{\kappa _{{0,1,j}} u}} } \,{\minus}\,\mathop{\sum}\limits_{k\,=1\,}^r {B_{{0,1,0,k}}^{{\asterisk}} \mu _{k} e^{{{\minus} \mu _{k} u}} } } \right) \cr & \,{\minus}\,(\lambda {\plus}\delta _{1} {\plus}\delta _{3} )\left( {\mathop{\sum}\limits_{j=1}^r {A_{{0,1,0,0,j}}^{{\asterisk}} e^{{\kappa _{{0,0,j}} u}} } {\plus}\mathop{\sum}\limits_{j=1}^{r{\plus}1} {A_{{0,1,0,1,j}}^{{\asterisk}} e^{{\kappa _{{0,1,j}} u}} } {\plus}\mathop{\sum}\limits_{k\,=1\,}^r {B_{{0,1,0,k}}^{{\asterisk}} e^{{{\minus} \mu _{k} u}} } } \right) \cr & {\plus}\, \lambda \mathop{\sum}\limits_{j=1}^r {\mathop{\sum}\limits_{k\,=1\,}^r {{{A_{{0,1,0,0,j}}^{{\asterisk}} q_{k} \mu _{k} } \over {\mu _{k} {\plus}\kappa _{{0,0,j}} }}\left( {e^{{\kappa _{{0,0,j}} u}} \,{\minus}\,e^{{(\mu _{k} {\plus}\kappa _{{0,0,j}} )b}} e^{{{\minus} \mu _{k} u}} } \right)} } {\plus}\lambda \mathop{\sum}\limits_{j=1}^{r{\plus}1} {\mathop{\sum}\limits_{k\,=1\,}^r {{{A_{{0,1,0,1,j}}^{{\asterisk}} q_{k} \mu _{k} } \over {\mu _{k} {\plus}\kappa _{{0,1,j}} }}} } (e^{{\kappa _{{0,1,j}} u}} \,{\minus}\,e^{{(\mu _{k} {\plus}\kappa _{{0,1,j}} )b}} e^{{{\minus} \mu _{k} u}} ) \cr & {\plus}\, \lambda \mathop{\sum}\limits_{k\,=1\,}^r {\mathop{\sum}\limits_{i=1,i\,\ne\,k}^r {{{B_{{0,1,0,i}}^{{\asterisk}} q_{k} \mu _{k} } \over {\mu _{k} \,{\minus}\,\mu _{i} }}(e^{{{\minus} \mu _{i} u}} \,{\minus}\,e^{{(\mu _{k} \,{\minus}\,\mu _{i} )b}} e^{{{\minus} \mu _{k} u}} )} } {\plus}\lambda \mathop{\sum}\limits_{k\,=1\,}^r {B_{{0,1,0,k}}^{{\asterisk}} q_{k} \mu _{k} (u\,{\minus}\,b)e^{{{\minus} \mu _{k} u}} } $$
Owing to (A.18), the sum of (A.19)–(A.22) and (A.24) is identical to 0. From the coefficients of
 $$e^{{\kappa _{{0,1,j}} u}} $$
, we know that
$$e^{{\kappa _{{0,1,j}} u}} $$
, we know that
 $\{ \kappa _{{0,1,j}} \} _{{j=1}}^{{r{\plus}1}} $
are the roots of (3.2) when l=2, n=0, and m=1. As
$\{ \kappa _{{0,1,j}} \} _{{j=1}}^{{r{\plus}1}} $
are the roots of (3.2) when l=2, n=0, and m=1. As
 $\kappa _{{0,1,r{\plus}1}} \,\gt \,0$
, the limiting condition (2.13) implies
$\kappa _{{0,1,r{\plus}1}} \,\gt \,0$
, the limiting condition (2.13) implies
 $$A_{{0,1,0,1,r{\plus}1}}^{{\asterisk}} =0$$
. Next, comparing the coefficients of
$$A_{{0,1,0,1,r{\plus}1}}^{{\asterisk}} =0$$
. Next, comparing the coefficients of
 $$ue^{{{\minus} \mu _{k} u}} $$
leads to
$$ue^{{{\minus} \mu _{k} u}} $$
leads to
 $$\eqalignno{ & \lambda B_{{0,1,0,k}}^{{\asterisk}} q_{k} \mu _{k} \,{\minus}\,\lambda \mathop{\sum}\limits_{j=1}^r {{{A_{{0,0,0,0,j}}^{{\asterisk}} q_{k} \mu _{k} } \over {\mu _{k} {\plus}\kappa _{{0,0,j}} }}e^{{(\mu _{k} {\plus}\kappa _{{0,0,j}} )b}} } {\plus}\lambda \mathop{\sum}\limits_{j=1}^{r{\plus}1} {{{A_{{0,0,0,j}} q_{k} \mu _{k} } \over {\mu _{k} {\plus}\rho _{{0,0,j}} }}(e^{{(\mu _{k} {\plus}\rho _{{0,0,j}} )b}} \,{\minus}\,1){\plus}\lambda q_{k} \mu _{k} \tilde{w}(\mu _{k} )=0} , \cr & \quad \quad \quad \quad \quad \quad \quad \quad \quad \quad \quad \quad \quad \quad \quad \quad \quad \quad \quad \quad \quad \quad \quad \quad \quad \quad \quad \quad \quad \quad \quad \quad k=1,2,\,\ldots\,,r $$
Rearrangements give
 $$\eqalignno{B_{{0,1,0,k}}^{{\asterisk}} =\left( {\mathop{\sum}\limits_{j=1}^{r{\plus}1} {{{A_{{0,0,0,j}} } \over {\mu _{k} {\plus}\rho _{{0,0,j}} }}\,{\minus}\,\tilde{w}(\mu _{k} )} } \right){\plus}\left( {\mathop{\sum}\limits_{j=1}^r {{{A_{{0,0,0,0,j}}^{{\asterisk}} } \over {\mu _{k} {\plus}\kappa _{{0,0,j}} }}e^{{\kappa _{{0,0,j}} b}} } \,{\minus}\,\mathop{\sum}\limits_{j=1}^{r{\plus}1} {{{A_{{0,0,0,j}} } \over {\mu _{k} {\plus}\rho _{{0,0,j}} }}e^{{\rho _{{0,0,j}} b}} } } \right)e^{{\mu _{k} b}} =0,\; \cr k=1,2,\,\ldots\,,r$$
thanks to (3.9) and (3.10). Hence, (A.23) reduces to (3.26). Utilising the coefficients of
 $e^{{\kappa _{{0,0,j}} u}} $
, one has
$e^{{\kappa _{{0,0,j}} u}} $
, one has
 $$c_{2} A_{{0,1,0,0,j}}^{{\asterisk}} \kappa _{{0,0,j}} \,{\minus}\,(\lambda {\plus}\delta _{1} {\plus}\delta _{3} )A_{{0,1,0,0,j}}^{{\asterisk}} {\plus}\lambda \mathop{\sum}\limits_{k\,=1\,}^r {{{A_{{0,1,0,0,j}}^{{\asterisk}} q_{k} \mu _{k} } \over {\mu _{k} {\plus}\kappa _{{0,0,j}} }}} {\plus}\lambda \mathop{\sum}\limits_{k\,=1\,}^r {{{A_{{0,0,0,0,j}}^{{\asterisk}} q_{k} \mu _{k} } \over {(\mu _{k} {\plus}\kappa _{{0,0,j}} )^{2} }}=0} ,\quad \quad j=1,2,\,\ldots\,,r$$
which results in (3.28) since each
 $\kappa _{{0,0,j}} $
satisfies the Lundberg’s equation (3.2) when l=2 and n=m=0. Lastly, equating the coefficients of
$\kappa _{{0,0,j}} $
satisfies the Lundberg’s equation (3.2) when l=2 and n=m=0. Lastly, equating the coefficients of
 $$e^{{{\minus} \mu _{k} u}} $$
results in
$$e^{{{\minus} \mu _{k} u}} $$
results in
 $$\eqalignno{ & \,{\minus}\,\lambda \mathop{\sum}\limits_{i\,=\,0}^1 \mathop{\sum}\limits_{j=1}^r {{A_{{0,1,0,i,j}}^{{\asterisk}} q_{k} \mu _{k} } \over {\mu _{k} {\plus}\kappa _{{0,i,j}} }}e^{{(\mu _{k} {\plus}\kappa _{{0,i,j}} )b}} {\plus}\lambda \mathop{\sum}\limits_{i\,=\,0}^1 {\mathop{\sum}\limits_{j=1}^{r{\plus}1} {{{A_{{0,1,i,j}} q_{k} \mu _{k} } \over {\mu _{k} {\plus}\rho _{{0,i,j}} }}(e^{{(\mu _{k} {\plus}\rho _{{0,i,j}} )b}} \,{\minus}\,1)} } \cr & {\plus}\,\lambda \mathop{\sum}\limits_{j=1}^r {A_{{0,0,0,0,j}}^{{\asterisk}} q_{k} \mu _{k} \left( {{b \over {\mu _{k} {\plus}\kappa _{{0,0,j}} }}\,{\minus}\,{1 \over {(\mu _{k} {\plus}\kappa _{{0,0,j}} )^{2} }}} \right)e^{{(\mu _{k} {\plus}\kappa _{{0,0,j}} )b}} } \cr & {\plus}\,\lambda \mathop{\sum}\limits_{j=1}^{r{\plus}1} {A_{{0,0,0,j}} q_{k} \mu _{k} \left[ {\,{\minus}\,{b \over {\mu _{k} {\plus}\rho _{{0,0,j}} }}e^{{(\mu _{k} {\plus}\rho _{{0,0,j}} )b}} {\plus}{1 \over {(\mu _{k} {\plus}\rho _{{0,0,j}} )^{2} }}(e^{{(\mu _{k} {\plus}\rho _{{0,0,j}} )b}} \,{\minus}\,1)} \right]} \cr & {\plus}\,\lambda q_{k} \mu _{k} {\cal T}_{{\mu _{k} }}^{2} w(0)=0,\quad \quad k=1,2,\,\ldots\,,r $$
With the help of (3.10) and (3.29), simplifications of the above equation yield (3.30). The remaining formula (3.31) comes from the continuity condition (2.4).□


