


INTRODUCTION
Archaeologists often face choices when sampling archaeological materials for radiocarbon (14C) dating. Charcoal, wood, and bone are the most commonly analyzed material when dating archaeological contexts. Human bones when 14C dated are usually expected to date closely to the event of burial and thus provide an estimate for the usage of the archaeological site, provided no food reservoir age exists. However, 14C ages of bones must be evaluated carefully with respect to potential contamination and treatment efficiency. Bone is not a perfectly closed system to the carbon exchange. When buried in soil for centuries or millennia, bones are exposed to humic acids, a potential source of exogenous carbon. The age offset from the accurate 14C age is dependent on the geochemistry of the burial, the age of the bones, their preservation, and the age of exogenous carbon. Numerous treatment methods have been designed to remove such contamination. A variety of approaches appeared over the decades (for an overview see Herrando-Pérez Reference Herrando-Pérez2021). The most common are the Longin method (Longin Reference Longin1971) and ultrafiltration (Brown et al. Reference Brown, Nelson, Vogel and Southon1988), which are often modified by laboratories (Piotrowska and Goslar Reference Piotrowska and Goslar2002; Brock et al. Reference Brock, Ramsey and Higham2007; Hajdas et al. Reference Hajdas, Michczynski, Bonani, Wacker and Furrer2009; Brock et al. Reference Brock, Higham and Bronk Ramsey2010; Wood Reference Wood2015). Other methods involve separation and dating of specific bone components such as peptides using a ninhydrin reaction with amino acids (Nelson Reference Nelson1991) or a chromatographic separation of hydroxyproline (McCullagh et al. Reference McCullagh, Marom and Hedges2010; Marom et al. Reference Marom, McCullagh, Higham, Sinitsyn and Hedges2012; Deviese et al. Reference Deviese, Comeskey, McCullagh, Bronk Ramsey and Higham2018). Intercomparisons performed between various laboratories (Scott et al. Reference Scott, Cook and Naysmith2010) are a way to test the different methods. Limited comparisons are often carried out as part of research projects (Fiedel et al. Reference Fiedel, Southon, Taylor, Kuzmin, Street, Higham, van der Plicht, Nadeau and Nawalade-Chavan2013; Huels et al. Reference Huels, van der Plicht, Brock, Matzerath and Chivall2017; Kuzmin et al. Reference Kuzmin, Fiedel, Street, Reimer, Boudin, van der Plicht, Panov and Hodgins2018; Quarta et al. Reference Quarta, Molnár, Hajdas, Calcagnile, Major and Jull2021).
The treatment of wood for radiocarbon dating can be either performed by acid-base-acid protocol (ABA or AAA) or separation of cellulose (Brock et al. Reference Brock, Higham and Bronk Ramsey2010; Nemec et al. Reference Nemec, Wacker, Hajdas and Gaggeler2010a; Southon and Magana Reference Southon and Magana2010; Hogg et al. Reference Hogg, Turney, Palmer, Southon, Kromer, Ramsey, Boswijk, Fenwick, Noronha, Staff, Friedrich, Reynard, Guetter, Wacker and Jones2013; Hajdas et al. Reference Hajdas, Hendriks, Fontana and Monegato2017). The treatment is chosen depending on sample size and preservation of cellulose. Applications such as high-resolution radiocarbon dating of large, well preserved wood fragments, for example for calibration purpose or environmental studies of trees, involve cellulose separation. However, waterlogged/wet wood has little cellulose left (Hajdas et al. Reference Hajdas, Hendriks, Fontana and Monegato2017) and samples smaller than 10 mg (dry), even well preserved but ones, have little prospect to provide sufficient amount of cellulose. Such samples are therefore only treated with ABA i.e., as whole wood sample.
In this study we analyze commonly available archaeological materials—animal bone, wood, and human bone—from a site in southern Siberia. In order to understand the chronology of events on site, it is essential to develop a 14C chronology. Moreover, most burial pits contain coffin wood and animal bones from meat offerings for the dead. This provides an opportunity to study potential differences between 14C ages of different types of material. For this purpose, nine burials with sets of samples containing wood, human, and animal bones were chosen for 14C analysis by AMS.
The preparation for 14C dating of bones has been extensively discussed in the literature (Higham et al. Reference Higham, Jacobi and Ramsey2006; Fuller et al. Reference Fuller, Fahrni, Harris, Farrell, Coltrain, Gerhart, Ward, Taylor and Southon2014; Herrando-Pérez Reference Herrando-Pérez2021). The most common discussion is dedicated old bones yielding 14C dates which are younger than expected (e.g., Higham et al. Reference Higham, Jacobi and Ramsey2006). However, occasionally ages of relatively young bones appear to be affected in a similar way (Heinemeier et al. Reference Heinemeier, Schjerling, Heinemeier, Magnusson and Kjaer2013; Rubinetti et al. Reference Rubinetti, Hajdas, Taricco, Alessio, Isella, Giustetto and Boano2020). While comparing results of different material pretreatments, possible offsets due to reservoir ages due to marine and fresh water components of the diet (Sveinbjörnsdóttir et al. Reference Sveinbjörnsdóttir, Heinemeier, Arneborg, Lynnerup, Ólafsson and Zoëga2010) should be considered. Also, there is a possibility of the “old wood” effect, when 14C dating of cremated bones and associated context samples (Olsen et al. Reference Olsen, Heinemeier, Hornstrup, Bennike and Thrane2013). Our goal was to compare the effect of two bone pretreatment protocols, differing in terms of chemical preparation, but each included an ultrafiltration step. We also compared the results of dating two sets of wood samples—subjected to standard ABA preparation and separation of cellulose. Here we present the results obtained using different preparation techniques and discuss consequences for the detailed chronology of the Tunnug 1 site.
MATERIAL AND STUDY SITE
The joint Russian-Swiss excavation project at Tunnug 1 in Tuva Republic was kicked off through a preliminary survey in 2017. A site in the floodplain of the Uyuk River was identified (Figure 1), analyzed by means of remote sensing data and ultimately visited.
The site location (indicated with a white spot) in the Uyuk Valley in southern Siberia, Tuva Republic, Russian Federation.

During this first field research campaign, a large Early Iron Age burial mound in the Uyuk Valley in southern Siberia was meticulously mapped by means of photogrammetry and small test excavations provided a first idea of the chronological setting of the site (Caspari et al. Reference Caspari, Sadykov, Blochin and Hajdas2018). A massive stone mound with several dozen buried individuals, many of whom died a violent death, was uncovered in 2019 (Milella et al. Reference Milella, Caspari, Kapinus, Sadykov, Blochin, Malyutina, Keller, Schlager, Szidat, Alterauge and Lösch2021). The 14C dates from larch wood recovered from the test excavations indicated a date for the construction of the burial mound in the 9th century BCE, this was later confirmed through additional 14C dates in combination with dendrochronology (wiggle matching) (Caspari et al. Reference Caspari, Sadykov, Blochin, Bolliger and Szidat2020a). Despite a large number of monumental burial mounds in the Uyuk Valley dating to the Early Iron Age (Caspari Reference Caspari2020; Caspari et al. Reference Caspari, Blochin, Sadykov and Balz2020b), few are chronologically situated in the Late Bronze Age Early Iron Age transition and are relevant to understanding the economic and cultural shifts happening in the first part of the first millennium BCE (Sadykov et al. Reference Sadykov, Caspari and Blochin2020).
The analysis of the burial mound’s immediate periphery through remote sensing and geophysical surveys showed that the burial mound is not an isolated architectural site but rather surrounded by dozens of smaller ritual and burial structures (Caspari et al. Reference Caspari, Sadykov, Blochin, Buess, Nieberle and Balz2019). Already in 2018 an amorphous barrow was identified in the southern periphery, under which numerous burial pits were located (Sadykov et al. Reference Sadykov, Caspari and Blochin2019). Most of them date to the 2nd–4th century CE and belong to the Kokel culture (Milella et al. Reference Milella, Caspari, Kapinus, Sadykov, Blochin, Malyutina, Keller, Schlager, Szidat, Alterauge and Lösch2021; Sadykov et al. Reference Sadykov, Caspari, Blochin, Lösch, Kapinus and Milella2021). These burial pits contain partially preserved wooden coffins, well-preserved human bones, as well as meat offerings remaining in the form of animal bones. Figure 2 provides an overview over the archaeological structures in the southern periphery from which the samples for this study stem.
The southern periphery of the Tunnug 1 site: numbers indicate the archaeological structures; the black outline marks the boundaries of the amorphous stone mound; black labels indicate where the samples stem from. Samples are numbered and labelled with W (wood), H (human bones), and A (animal bones).

Initial samples of human bone and wood were radiocarbon dated by LARA-Bern laboratory as a part of previous studies (Milella et al. Reference Milella, Caspari, Kapinus, Sadykov, Blochin, Malyutina, Keller, Schlager, Szidat, Alterauge and Lösch2021). The material selected for radiocarbon dating for this study came from nine burial pits under a large amorphous stone accumulation in the southern periphery of the Tunnug 1 site. 14C dating was performed based on 32 bone samples (14 samples from animal bones and 18 samples from human bones) as well as 22 wood samples (11 of which were in the form of cellulose).
METHODS
All the steps and details of each of the pretreatment methods used are summarized in Table 1. We used two different preparation protocols for the bone material UF1 and UF2. Wood samples were treated following a standard acid-base-acid (ABA) protocol or using cellulose extraction (BABAB) (Nemec et al. Reference Nemec, Wacker, Hajdas and Gaggeler2010a).
Summary of preparation steps. For bone samples, two ultrafiltration protocols were used (UF1, UF2), preceded by a modified Longin’s method; for wood, standard protocol (ABA) and pretreatment with cellulose extraction (BABAB) were applied. RT = room temperature (20°C).

Preparation of Bones
Radiocarbon analysis of osteological material is performed on extracted gelatine. The first step of preliminary chemical preparation was the same for all samples and included cleaning in an ultrasonic bath in demineralised water (2×15 min), drying, then grinding in metal mortars, pulverizing and subsequently sieving on metal sieves (<710 µm).
Aliquots of a few milligrams of original bone were wrapped in Sn boats to obtain the carbon and nitrogen quantities (%C, %N, C/Nat) with the Elemental Analyzer (Vario MicroCube, Elementar), which was calibrated using Acetanilide as a reference material. The levels of carbon and nitrogen (%C and %N) in raw bones were in the order of ca. 15–18% and 4–6%, respectively, in each case suggesting good collagen preservation (DeNiro Reference DeNiro1985; Ambrose Reference Ambrose1990; van Klinken Reference van Klinken1999).
Every sample of bone powder was divided into two, in order to compare different gelatinisation protocols. Some of the samples were too small so in those cases we left just one—there are no comparable results for A18, A21, A24 and A32 samples. Finally, 32 subsamples of bone were tested—18 subsamples of human bone and 14 subsamples of animal bone.
Two sets of samples were subjected to the pretreatment protocol based on a modified Longin’s method (Longin Reference Longin1971; Arslanov and Svezhentsev Reference Arslanov and Svezhentsev1993), combined with ultrafiltration. All the samples containing ∼1 g of powder <710 µm were placed in 50 mL Falcon tubes. These steps include the following order: demineralisation, alkali treatment, gelatinisation, filtration and ultrafiltration. Batch one which contained 18 samples, underwent treatment UF1 and batch 2 with 14 samples underwent treatment UF2 (Table 2).
Results for 14C comparison of UF1, UF2, W1, and W2 batches of samples, with mean values, from nine areas of the Tunnug 1 site. Sample yield and mg C (target); weight percent of C and N in original bones as well as C/N atomic ratios (C/Nat) for gelatine samples. Previous results from Milella et al. (Reference Milella, Caspari, Kapinus, Sadykov, Blochin, Malyutina, Keller, Schlager, Szidat, Alterauge and Lösch2021). Sample lost during pretreatment marked with an asterisk (*).

Batch 1 (UF1) was treated with 0.5 M HCl for a period of minimum 20 mins at room temperature to remove the mineral fraction. When no bubbles were visible in the solution, the reaction was considered complete. In most cases, the time required for full demineralisation was longer and ranged from one to two hours. After rinsing with ultrapure water, the samples were treated with base-sodium hydroxide (0.1 M NaOH, 30 mins, room temperature). Next, they were rinsed with ultrapure water to neutral pH and then with 0.001 M HCl. The next step was gelatinisation in an acidic solution (HCl, pH=2) in 100°C for at least 17 hr.
Batch 2 (UF2) was prepared according to second protocol. The first step of demineralisation was performed with 1.1 M HCl for 2 hr at room temperature. That step was repeated three times to ensure that all of the mineral fraction had reacted. Next, the samples were left overnight in ultrapure water with a drop of acid. The next day, after rinsing with ultrapure water to neutral pH, the samples were treated with 0.1 M NaOH for 30 min at room temperature to remove humic acids and rinsed again. Then the samples were treated with 1.1 M HCl, then rinsed with ultrapure water and then with 0.001 M HCl. The gelatinisation step was performed for 20 hr at 60°C (pH=3). All the gelatinised samples were subsequently subjected to filtration through precleaned Millex Glasfaser filters. All gelatine sample fractions were placed in Millipore Amicon Ultra-15 ultrafiltration tube, precleaned following the protocol of Brock et al. (Reference Brock, Ramsey and Higham2007). Subsequently, the samples were centrifuged at 4400 rpm for 5–20 min to remove the fraction <30 kD to collect the heavy-molecule fraction >30 kD (Hajdas et al. Reference Hajdas, Michczynski, Bonani, Wacker and Furrer2009). Then, purified gelatine samples were freeze-dried (Alpha 1-2 LD plus, Martin Christ).
Preparation of Wood
11 wood samples (Table 2) were divided into two subsets, to obtain 22 subsamples. One set of 11 subsamples was subjected to ABA—acid-base-acid (or AAA—acid-alkali-acid) preparation, used since the 1950s (de Vries and Barendsen Reference de Vries and Barendsen1954) and now widespread in radiocarbon laboratories. An acid-base-acid preparation of was carried out at 60°C, as follows: 0.5 M HCl for 1 hr for removing carbonate contaminants; after rinsing with ultrapure water, a bath in 0.1 M NaOH for 1 hr dissolved humic acids; next, after rinsing with ultrapure water, 0.5 M HCl was applied for 1 hr, to remove a possible contamination with modern carbon; a final step was rinsing with ultrapure water to neutral pH. Hereafter we will refer to this set as “ABA.”
The second set of wood subsamples was converted into cellulose, to compare the results. The set of wood samples was treated according to standard ETH protocol, called BABAB (Nemec et al. Reference Nemec, Wacker, Hajdas and Gaggeler2010a) with base, acid, base (1 M NaOH, overnight; 1 M HCl, 0.5 hr; 1 M NaOH, 1.5 hr), at 60°C. Next, the samples were briefly (10 min, RT) exposed to 1 M HCl and then a solution of 5 mL of 0.6 M NaClO2 and 200 µL of 1 M HCl was added to every sample. Next step was rinsing the samples. Some of them were very tough to rinse after NaOH, some of them dissolved partially in alkali solution and W34 (ETH-105167) dissolved completely. The samples needed to be centrifuged while rinsing (2500 rpm, 3 min). Every sample of wood and cellulose was freeze-dried after chemical preparation.
After chemical pretreatment both UF1 and UF2 gelatine batches as well as ABA and Cellulose sets were subjected to graphite preparation using an AGE-3 system, equipped with an elemental analyzer VarioMicroCube by Elementar (Nemec et al. Reference Nemec, Wacker and Gäggeler2010b; Wacker et al. Reference Wacker, Nemec and Bourquin2010). Then the samples were subjected to AMS dating.
AMS Analysis and Radiocarbon Calibration
The measurements were performed at the ETH Laboratory of Ion Beam Physics in Zurich with the AMS system MICADAS (Synal et al. Reference Synal, Stocker and Suter2007), using oxalic acid (OXA II, SRM4990C{NIST}) for standard normalization and correction for isotope fractionation. Radiocarbon of pairs of treatment were evaluated. Coherent (2 sigma agreement) ages were combined and calibrated using OxCal v4.4.4 (Ramsey Reference Ramsey2021) and an IntCal20 calibration data (Reimer et al. Reference Reimer, Austin, Bard, Bayliss, Blackwell, Bronk Ramsey, Butzin, Cheng, Edwards, Friedrich, Grootes, Guilderson, Hajdas, Heaton, Hogg, Hughen, Kromer, Manning, Muscheler, Palmer, Pearson, van der Plicht, Reimer, Richards, Scott, Southon, Turney, Wacker, Adolphi, Büntgen, Capano, Fahrni, Fogtmann-Schulz, Friedrich, Köhler, Kudsk, Miyake, Olsen, Reinig, Sakamoto, Sookdeo and Talamo2020). In addition in order to summarize the calibrated ages obtained in this study a Kernel Density Estimation (KDE) model function was used (Ramsey Reference Ramsey2017).
RESULTS AND DISCUSSION
The measurement results of radiocarbon dating of this study, partially compiled with the previous results are listed in Table 2.
As mentioned in the “Preparation of Bones” section, the material for samples A18, A21, A24 and A32 was not available for repeated analysis and one sample of wood (W34) provided an insufficient amount of cellulose.
A comparison of ages obtained for various materials and methods showed that wood was more difficult to prepare than the bones, and human bones provided more consistent results than the animal bones. Six pairs of ABA and cellulose ages agreed within 2σ. The treatment with UF1 and UF2 resulted in coherent ages (2σ) for 9 human bones and 4 animal bones.
There is an interesting case of a very old animal bone A17 (ETH-105149) which provided coherent results for UF1 and UF2 that could be combined to 4194 ± 19 BP. The ages of wood pairs ranged in (1710–1886) ± 20 BP. This range is much wider than the ages of all bones (1753–1820) ± 17 BP. This is most likely due to the fact that the central archaeological structure under the amorphous stone accumulation was disturbed with a deep robber’s pit at its center. The presence of water on the site made the documentation of the lower layers of the pit of structure 17 difficult. The old animal bone might have been part of a deeper soil layer dating to a time before the site experienced a surge in anthropogenic activity. The disturbance in combination with the high groundwater level might have caused these lower layers to mix.
For most of the samples, the UF1 and UF2 gelatine batches both gave satisfactory results in terms of the C/N atomic ratios (3.2–3.3). Sample A18 (ETH-105152) revealed a higher C/Nat ratio (3.5) and sample A21 (ETH-105156) was clearly an outlier with the C/Nat value of 2.6.I In both cases, these are animal bones and the 14C ages are older than the majority, centered between 1750-1820 BP. Both samples were subjected only to UF1 preparation and it is difficult to say if UF2 would improve the result.
Although most of the bones showed high N% (∼5%), the gelatine yield, based on >30kDa ultrafiltered fraction, is between 1–13%, which provides information about the degree of preservation (van Klinken Reference van Klinken1999). For example, H34, despite the content of N=5.12% and C=16.57%, revealed a low gelatine yield in both UF1 and UF2 protocols (1 and 3%, respectively). A similar situation occurred with many other bone samples, for example H17, H22 or A24—they showed right content of C and N, also C/Nat ratio was adequate but the sample yield was low after both pretreatment procedures. The wood samples also showed poor preservation of cellulose and only ABA treatment of whole wood resulted in high yield. For example, W17 ABA preparation resulted in 70% sample yield and Cellulose preparation—only in 17%. Similarly, W18_3 after ABA and Cellulose yielded 50% and 4% results, respectively, while the content of cellulose should reach 40–45% in coniferous species and 38–49% in deciduous species (Rowell Reference Rowell2005). Such was the case with most of wood samples (see Table 2).
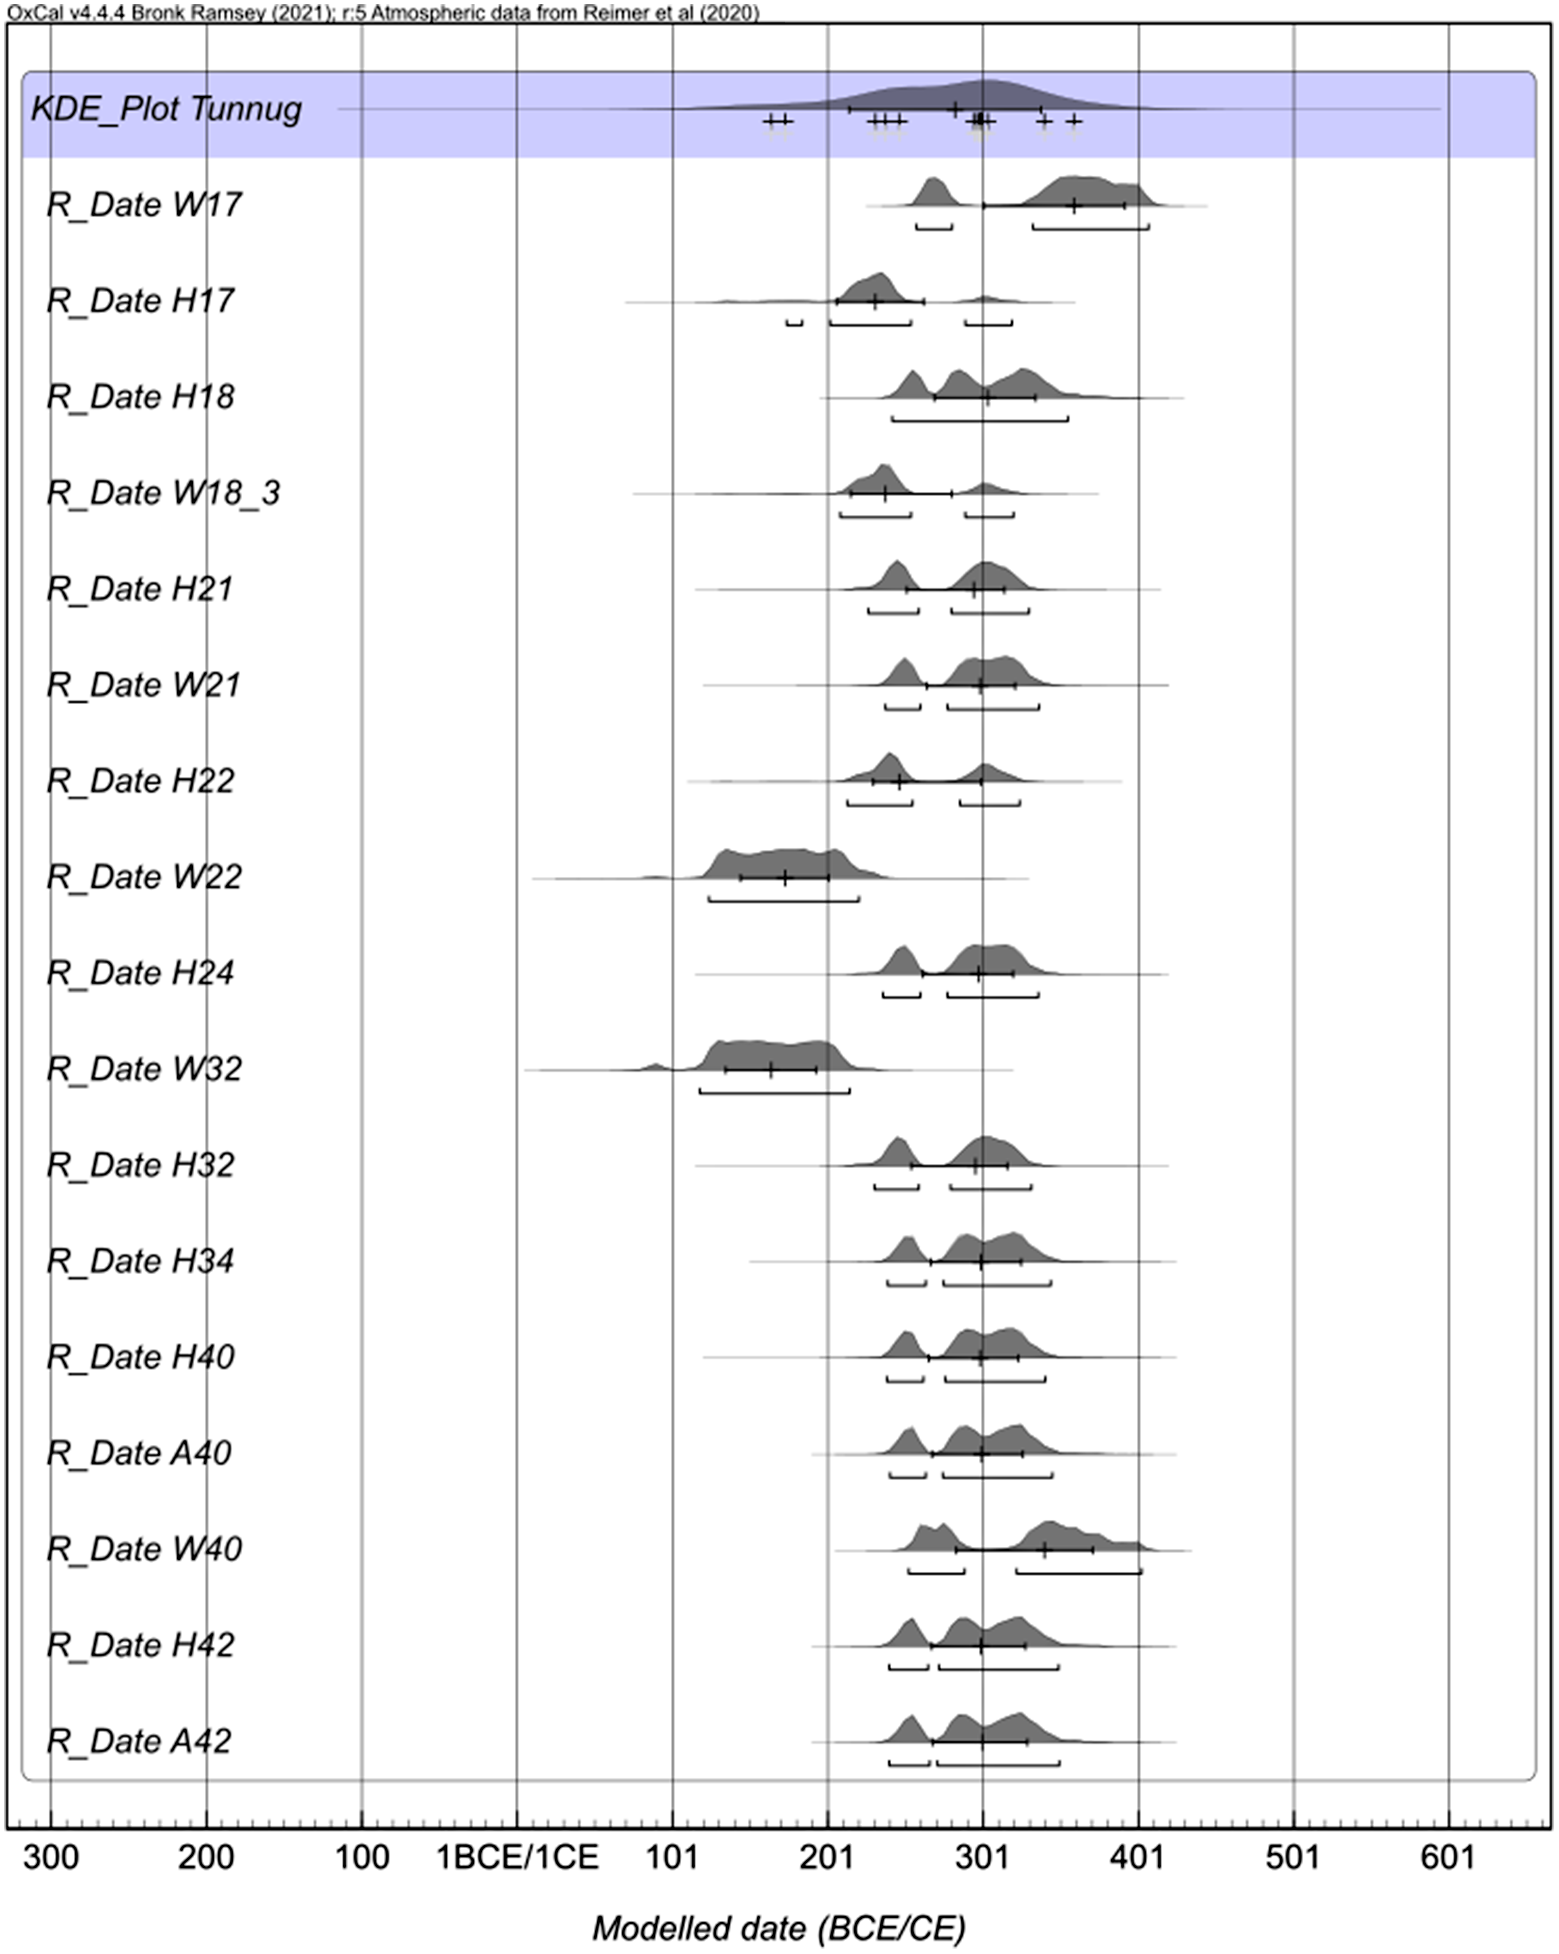
Only the combined (i.e., coherent within 2 sigma) ages were calibrated with the exception of the animal bone A17 (ETH-105150) which is a clear outlier. The calibration program OxCal 4.4.4 (Ramsey Reference Ramsey2021) was used with the INTCAL20 calibration data set (Reimer et al. Reference Reimer, Austin, Bard, Bayliss, Blackwell, Bronk Ramsey, Butzin, Cheng, Edwards, Friedrich, Grootes, Guilderson, Hajdas, Heaton, Hogg, Hughen, Kromer, Manning, Muscheler, Palmer, Pearson, van der Plicht, Reimer, Richards, Scott, Southon, Turney, Wacker, Adolphi, Büntgen, Capano, Fahrni, Fogtmann-Schulz, Friedrich, Köhler, Kudsk, Miyake, Olsen, Reinig, Sakamoto, Sookdeo and Talamo2020). The compilation of calibration plots is presented in Figure 3. In the next step the significantly older wood samples W22 and W32 were excluded and the KDE model was applied as shown in Figure 4. The KDE model considers the shape of the calibration curve while estimating the distribution of the events. The pool of radiocarbon ages obtained mostly on bones dates most of the monuments of the southern periphery of Tunnug 1 between the 2nd and 4th centuries CE, the date established by Milella et al. (Reference Milella, Caspari, Kapinus, Sadykov, Blochin, Malyutina, Keller, Schlager, Szidat, Alterauge and Lösch2021).
Multiple plot of calibrated radiocarbon ages obtained on human bones (H), animal bones (A), and wood (W). The sample numbers correspond to the archaeological structure. Ages of paired preparations (UF1 and UF2 for bones and ABA and Cellulose for wood) were combined when coherent (agreement at 2σ level).
Plot showing the Kernel Density estimation model (KDE) for the Tunnug 1 data set obtained with OxCal 4.4.4. and INTCAL20 calibration curve: (A) this study; (B) this study combined with data from Milella et al. (Reference Milella, Caspari, Kapinus, Sadykov, Blochin, Malyutina, Keller, Schlager, Szidat, Alterauge and Lösch2021). The gray solid curve (and light gray shading) shows unmodelled summed probability distributions (SPD), the blue solid curve and dark shaded area correspond to the Kernel Density results, with blue bands showing confidence interval around the kernel density estimate. The light shaded area corresponds to the sum distribution (Ramsey Reference Ramsey2017). Red crosses are combined 14C ages (Table 2, this study) and black/gray crosses show the median values of the calibrated likelihoods.
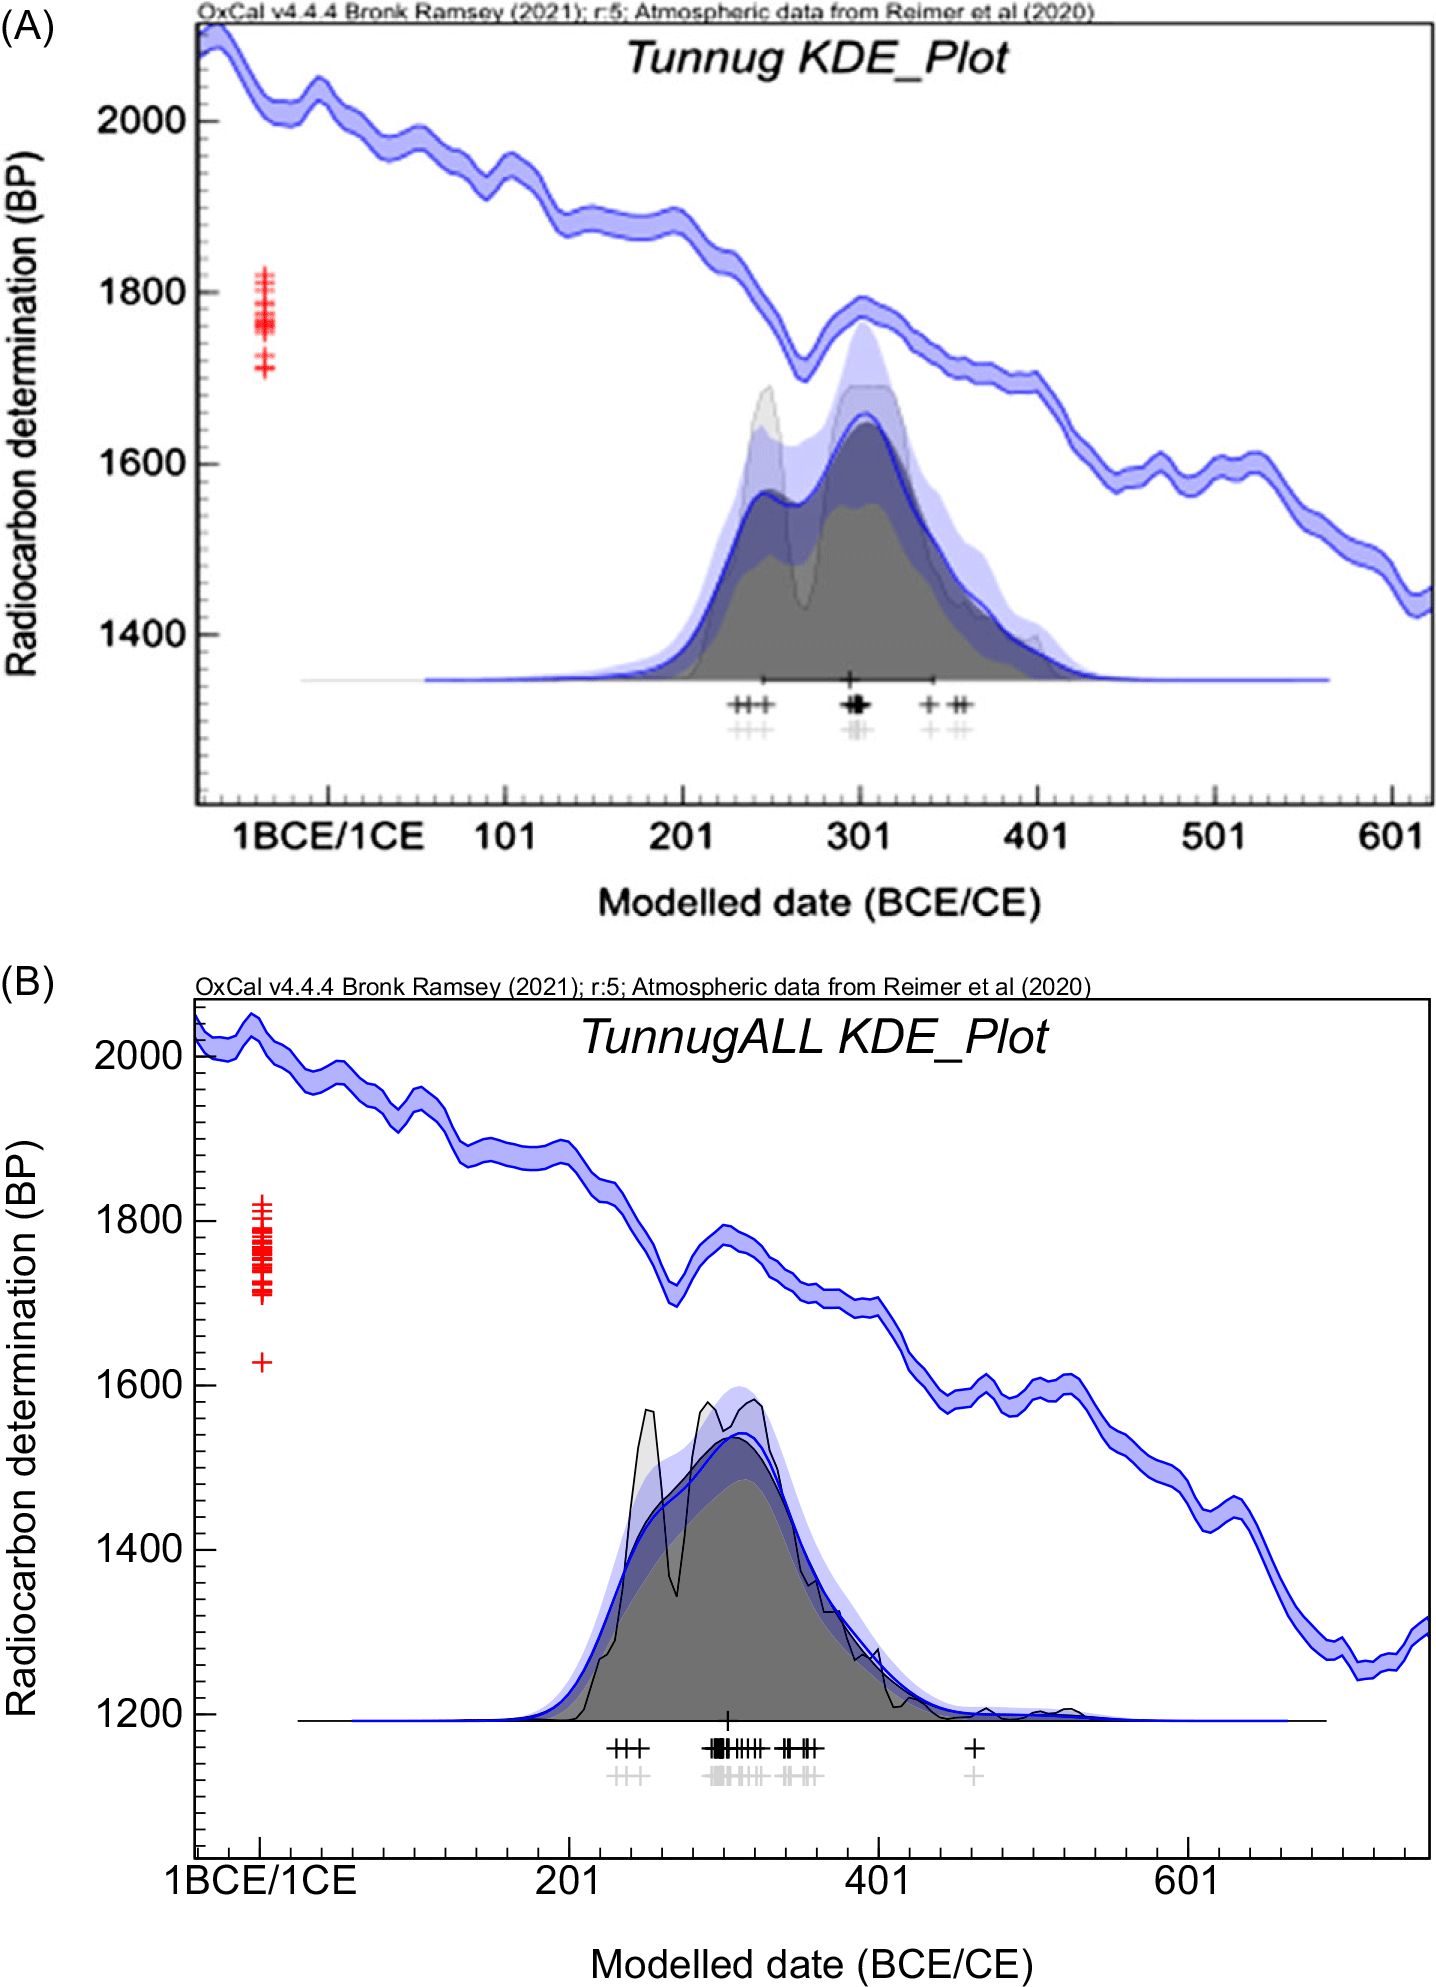
A representation of all the data (this study and Milella et al. Reference Milella, Caspari, Kapinus, Sadykov, Blochin, Malyutina, Keller, Schlager, Szidat, Alterauge and Lösch2021) by a KDE model (Figure 4B) strengthens the conclusion of the rather short time interval between 200 and 400 CE, centered at 300 CE representations. A more precise calendar age might be prevented by the prominent wiggle on the calibration curve. Moreover, it might be noted that a sufficient pool of data is helpful when the possible outliers are present but not explained such as the old animal bone A17. The excellent agreement with the results of the radiocarbon dating by the Bern LARA laboratory demonstrates that modified ultrafiltration methods are comparable. The UF method applied by LARA lab (Szidat et al. Reference Szidat, Vogel, Gubler and Lösch2017) to the Tunnug 1 bones has a significantly longer demineralisation step i.e., 60 hr as compared to max 2 hr in UF1/UF2. Indeed, the results of LARA show less scatter, which could be due to this step, or because all the bones were human bones. This study observed that animal bones in Tunnug 1 result in larger scatter.
Another observation is the difficulty to date wood. Some samples such as W42 dissolved during both treatments (ABA and Cellulose) and some, such as W34, survived ABA. One must note that the poor quality of decomposed wood is not striking from visual observation. In our study, ABA preparation provided at least as reliable results as Cellulose preparation. Such finding is important because decomposed, low-quality wood, is often encountered in archaeological material and application of ABA preparation is the only possibility. Moreover, ABA preparation is easier to carry out, and consumes less time and chemicals (especially NaClO2, which is poisonous and carcinogenic) than BABAB preparation.
CONCLUSIONS
The main goal of our study was to evaluate the reliability of treatment methods. The original task of testing the bone treatment against the ages obtained on wood became impossible due to the poor cellulose preservation. Although ABA and Cellulose BABAB treatment of wood samples returned consistent results for the majority of samples, the BABAB preparation turned out to be less efficient than ABA, due to the low material yield after chemical preparation. The cellulose obtained was also of poor yield which resulted in a shift in the measurement result. We conclude that ABA is the effective method when dating poorly preserved wood. The preparation of bones provided a more coherent picture. The results obtained by two modified ultrafiltration methods in this study suggested equal effectiveness in terms of the C/Nat values and gelatine purity. The critically evaluated paired ages of bones and wood support the chronology established by LARA laboratory and date the Kokel burials in the southern periphery of Tunnug 1 between 200 and 400 CE.
ACKNOWLEDGMENTS
Publication supported under the Excellence Initiative—Research University, The Silesian University of Technology, 2019 (03/FSW18/0003-04/2019). F. Pawełczyk would like to thank the staff of the ETH Laboratory of Ion Beam Physics in Zurich for their kind welcome, valuable tips and help at every stage of the works. Field research was conducted as a joint expedition of the Institute of the History of Material Culture of the Russian Academy of Sciences, the Russian Geographical Society (project “Expedition Tunnug”) and the Swiss ArchaeoExploration. The excavation project is conducted with the financial and logistical help of the Russian Geographical Society (N 53/04/2019) and financial help of Dr F. Paulsen, the Society for the Exploration of EurAsia and the Russian Ministry of Culture (project No. 656-01-1-41/12-18 and N 1205/12-20). Post-excavation works for T. Sadykov and J. Blochin were carried out within the framework of the Program of Fundamental Scientific Research of the Russian Academy of Sciences, State Assignment No. 0184-2019-0011. G. Caspari was funded by the Swiss National Science Foundation, grant number P400PG_190982.


 Open access