


Introduction and geological setting
Deception Island is one of the most active volcanoes in Antarctica and, jointly with Mount Erebus, one of the two volcanoes to have produced the most recent eruptions (Smellie et al. Reference Smellie, Panter and Geyer2021). After several eruptions in historical times, the most recent ones occurred in 1967, 1969 and 1970, damaging two of the existing scientific stations as well as producing geomorphological changes in several sectors of the island (Smellie & López-Martínez Reference Smellie, López-Martínez, López-Martínez, Smellie, Thomson and Thomson2002). This Quaternary active volcano is situated in the south-western part of the Bransfield Basin, which is a young marginal basin (< 1.4 Ma) between the Antarctic Peninsula and the South Shetland Islands (Fig. 1a,b; Lawver et al. Reference Lawver, Keller, Fisk, Strelin and Taylor1995). Deception Island is part of a volcanic ridge associated with the extensional structure of the Bransfield Basin, being a consequence of back-arc extension linked to the subduction of the Phoenix Plate beneath the Antarctic Plate (Barker Reference Barker1982, González-Ferrán Reference González-Ferrán1985, Barker & Austin Reference Barker and Austin1994, Galindo-Zaldivar et al. Reference Galindo-Zaldivar, Jabaloy, Maldonado and Sanz de Galdeano1996, McCarron & Larter Reference McCarron and Larter1998, González-Casado et al. Reference González-Casado, Giner-Robles and López-Martínez2000). Along with Deception Island (Fig. 1c), nearby volcanic islands such as Penguin and Bridgeman islands also exhibit Quaternary magmatism related to rifting (Birkenmajer et al. Reference Birkenmajer, Soliani and Kawashita1990, Gràcia et al. Reference Gràcia, Canals, Farrán, Prieto, Sorribas and Team1996, Reference Gràcia, Canals, Farrán, Sorribas and Pallàs1997, Haase et al. Reference Haase, Beier, Fretzdorff, Smellie and Garbe-Schönberg2012).
a. Regional tectonic framework of the Scotia Arc and north-western Antarctic Peninsula region. The Bransfield Trough area is marked by the box. b. Tectonic and geographical location of Deception Island along the spreading axis of the Bransfield Trough (modified from Grad et al. Reference Grad, Guterch and Sroda1992, Barker & Austin Reference Barker and Austin1994, Rey et al. Reference Rey, Somoza, Martinez-Frías, Benito, Martín-Alfageme, Nicholson, Hein, Biihn and Dasgupta1997). c. Simplified geological sketch map of Deception Island (modified from Smellie & López-Martínez Reference Smellie, López-Martínez, López-Martínez, Smellie, Thomson and Thomson2000, Smellie Reference Smellie2001).
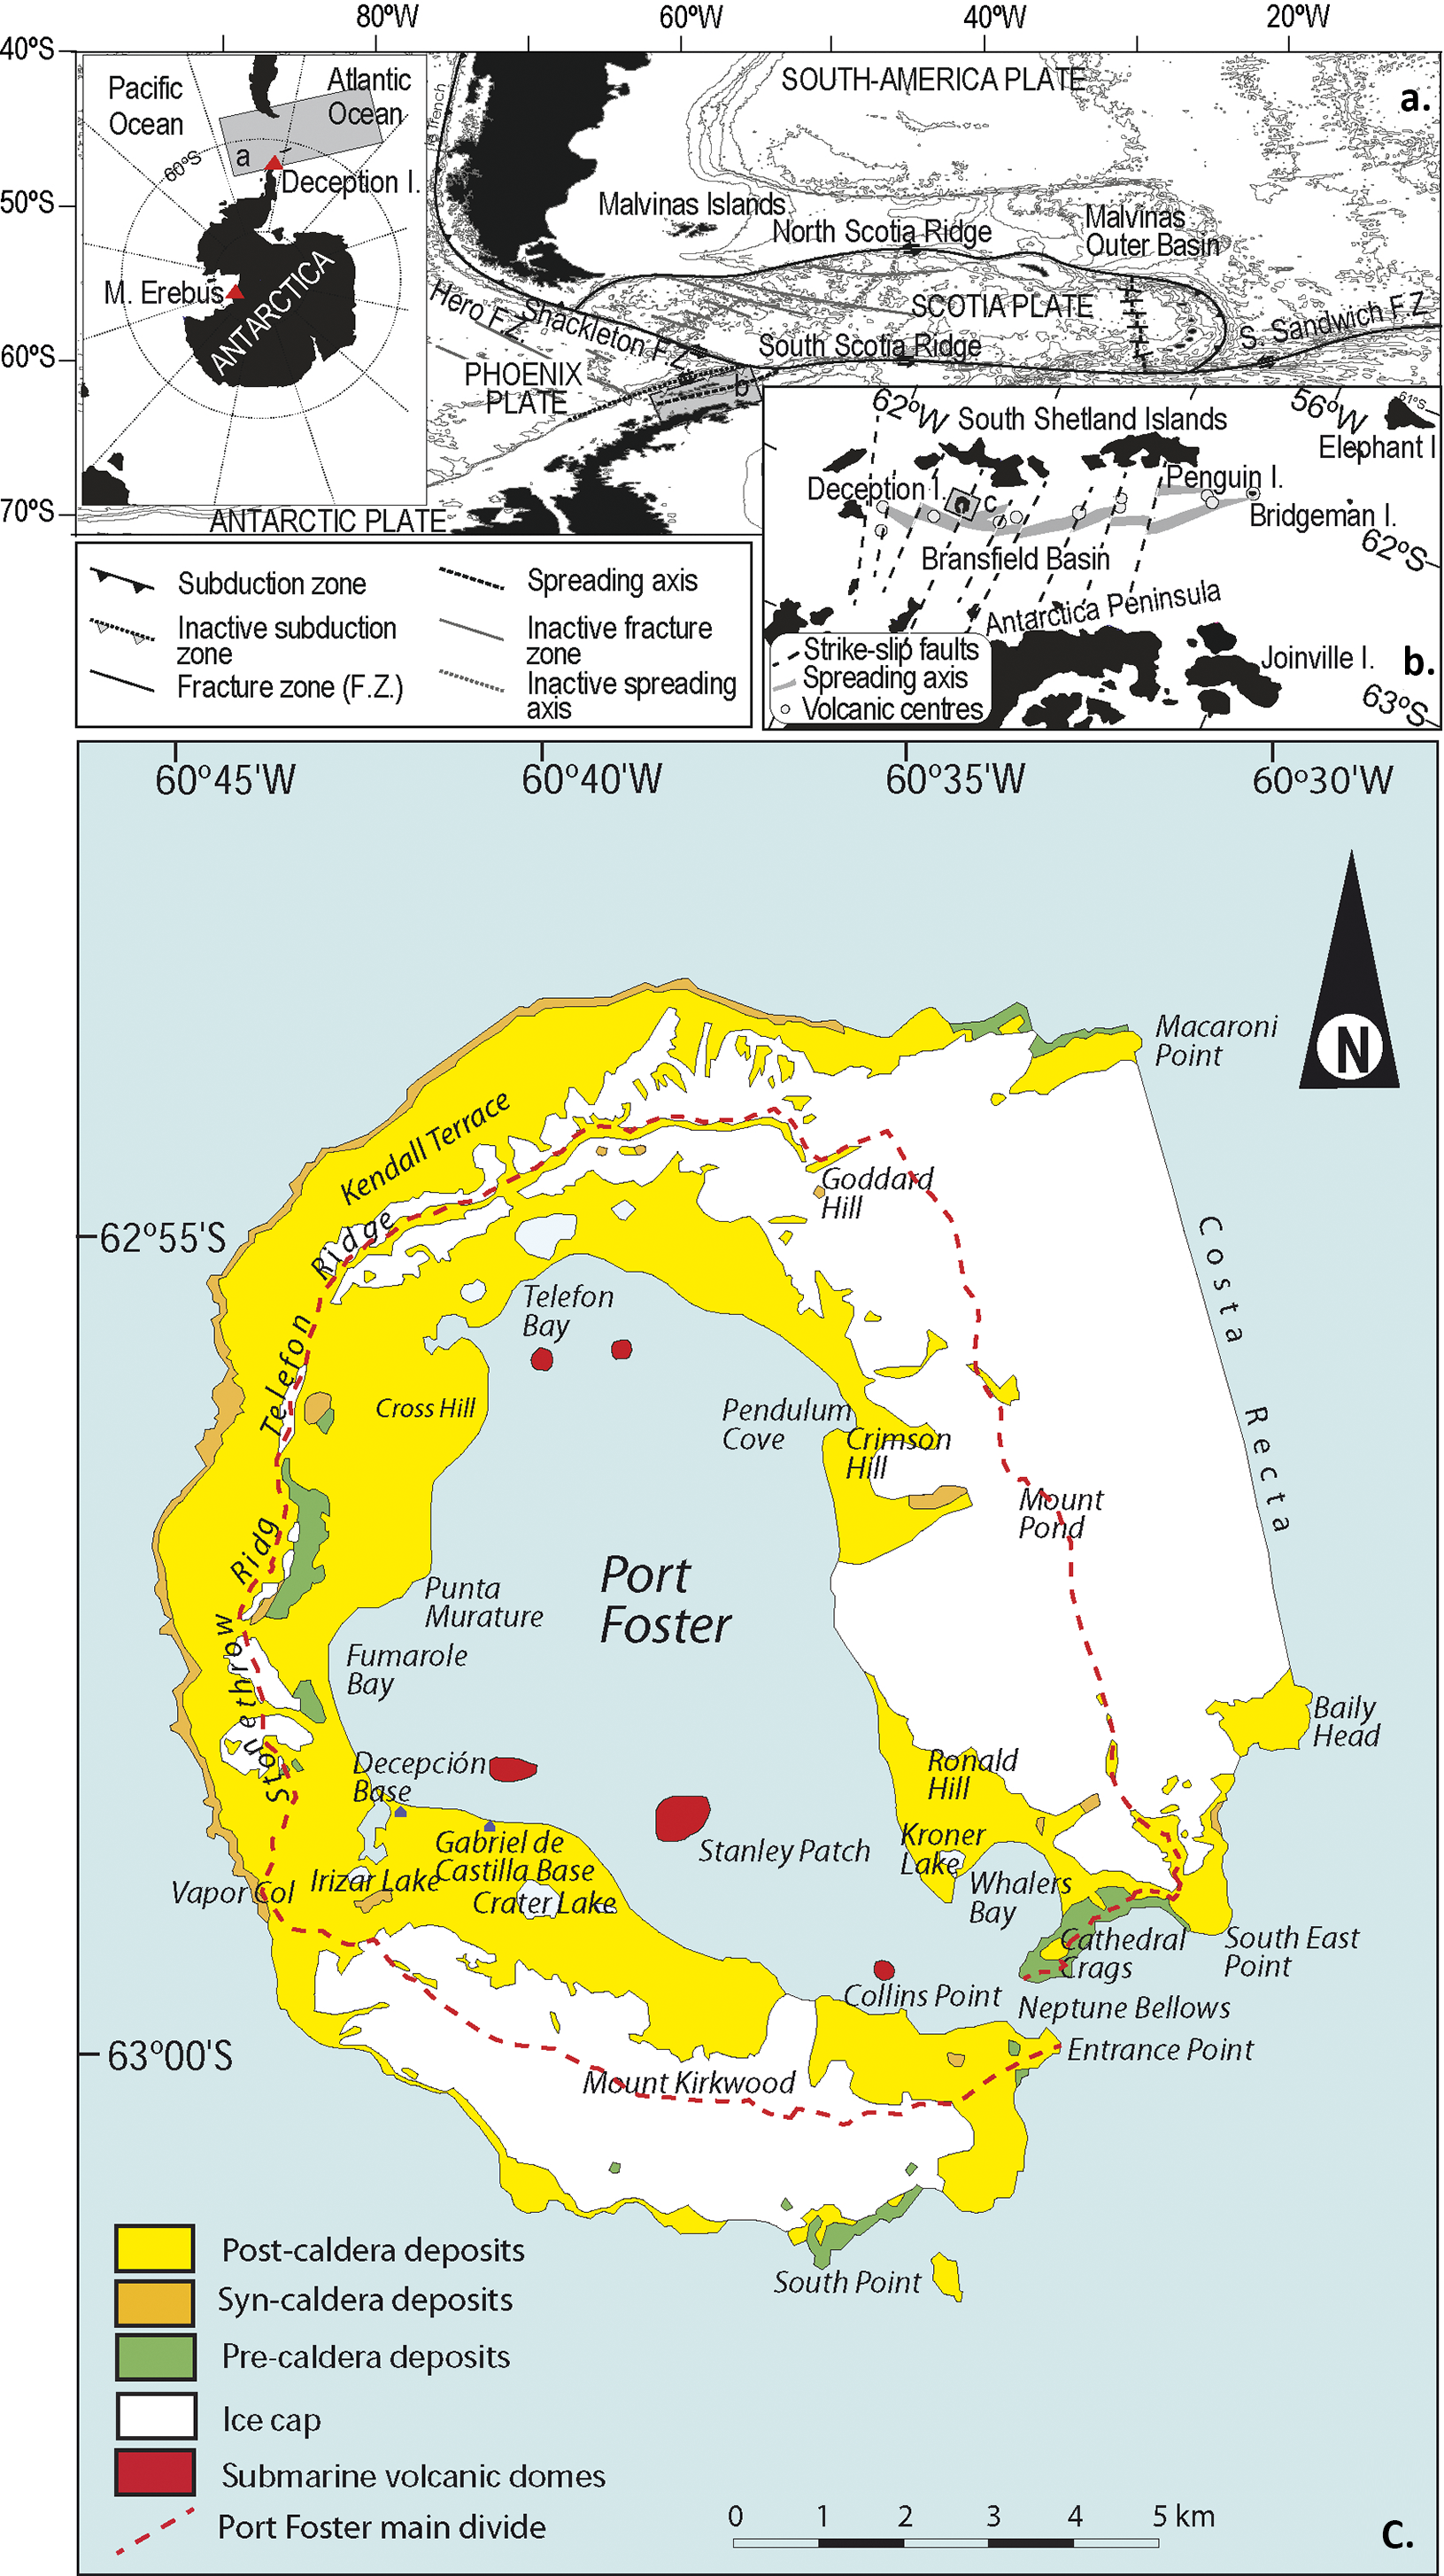
Deception Island is the onshore expression of a volcanic edifice with a basal diameter of ~30 km and a maximum height of 539 m above sea level in Mount Pond. It forms a horseshoe-shaped island around a 7 × 10 km caldera flooded by the sea, known as Port Foster (Fig. 1; Smellie Reference Smellie1988, Smellie & López-Martínez Reference Smellie, López-Martínez, López-Martínez, Smellie, Thomson and Thomson2002, Barclay et al. Reference Barclay, Wilcock and Ibáñez2009). Deception Island has thick ice cover that is mainly located in the eastern and south-western sectors, restricting the extent of rocky outcrops where observations can be made. Magnetic polarity and K-Ar data indicate that the exposed rocks are younger than 0.75 Ma and that the subaerial portion of the island was constructed primarily over the last 0.2 Ma (Valencio et al. Reference Valencio, Mendía and Vilas1979, Keller et al. Reference Keller, Fisk, White and Birkenmajer1992).
The volcanic evolution of Deception Island is divided into three key phases: pre-, syn- and post-caldera (Smellie Reference Smellie2001). The pre-caldera phase saw the formation of a subaerial volcanic shield and multiple coalesced shoaling seamounts, represented by the Basaltic Shield Formation. The syn-caldera phase was marked by the caldera’s collapse, depositing pyroclastic deposits from the Outer Coast Tuff Formation, which forms an almost continuous outcrop along the island’s outer part. These formations constitute the so-called Port Foster Group (Smellie Reference Smellie2001, Reference Smellie, López-Martínez, Smellie, Thomson and Thomson2002). The caldera collapse event has been dated to be between 8300 (Oliva-Urcía et al. Reference Oliva-Urcía, Gil-Peña, Maestro, López-Martínez, Galindo-Zaldívar and Soto2015) and 3980 (Antoniades et al. Reference Antoniades, Giralt, Geyer, Álvarez-Valero, Pla-Rabes and Granados2018) bce. Post-caldera volcanism includes over 70 eruptive vents scattered across the island, with more than 30 eruptions occurring during the Holocene, including over 20 in the past 2 centuries (Orheim Reference Orheim1972, López-Martínez et al. Reference López-Martínez, Smellie, Thomson and Thomson2002). These vents, primarily associated with phreatomagmatic eruptions, deposited pyroclastic sediments over pre- and syn-caldera deposits (Fig. 1d; Smellie Reference Smellie2001, Reference Smellie, López-Martínez, Smellie, Thomson and Thomson2002, Pedrazzi et al. Reference Pedrazzi, Németh, Geyer, Álvarez-Valero, Aguirre-Díaz and Bartolini2018). These post-caldera units have been named by Smellie (Reference Smellie2001, Reference Smellie, López-Martínez, Smellie, Thomson and Thomson2002) as the Mount Pond Group.
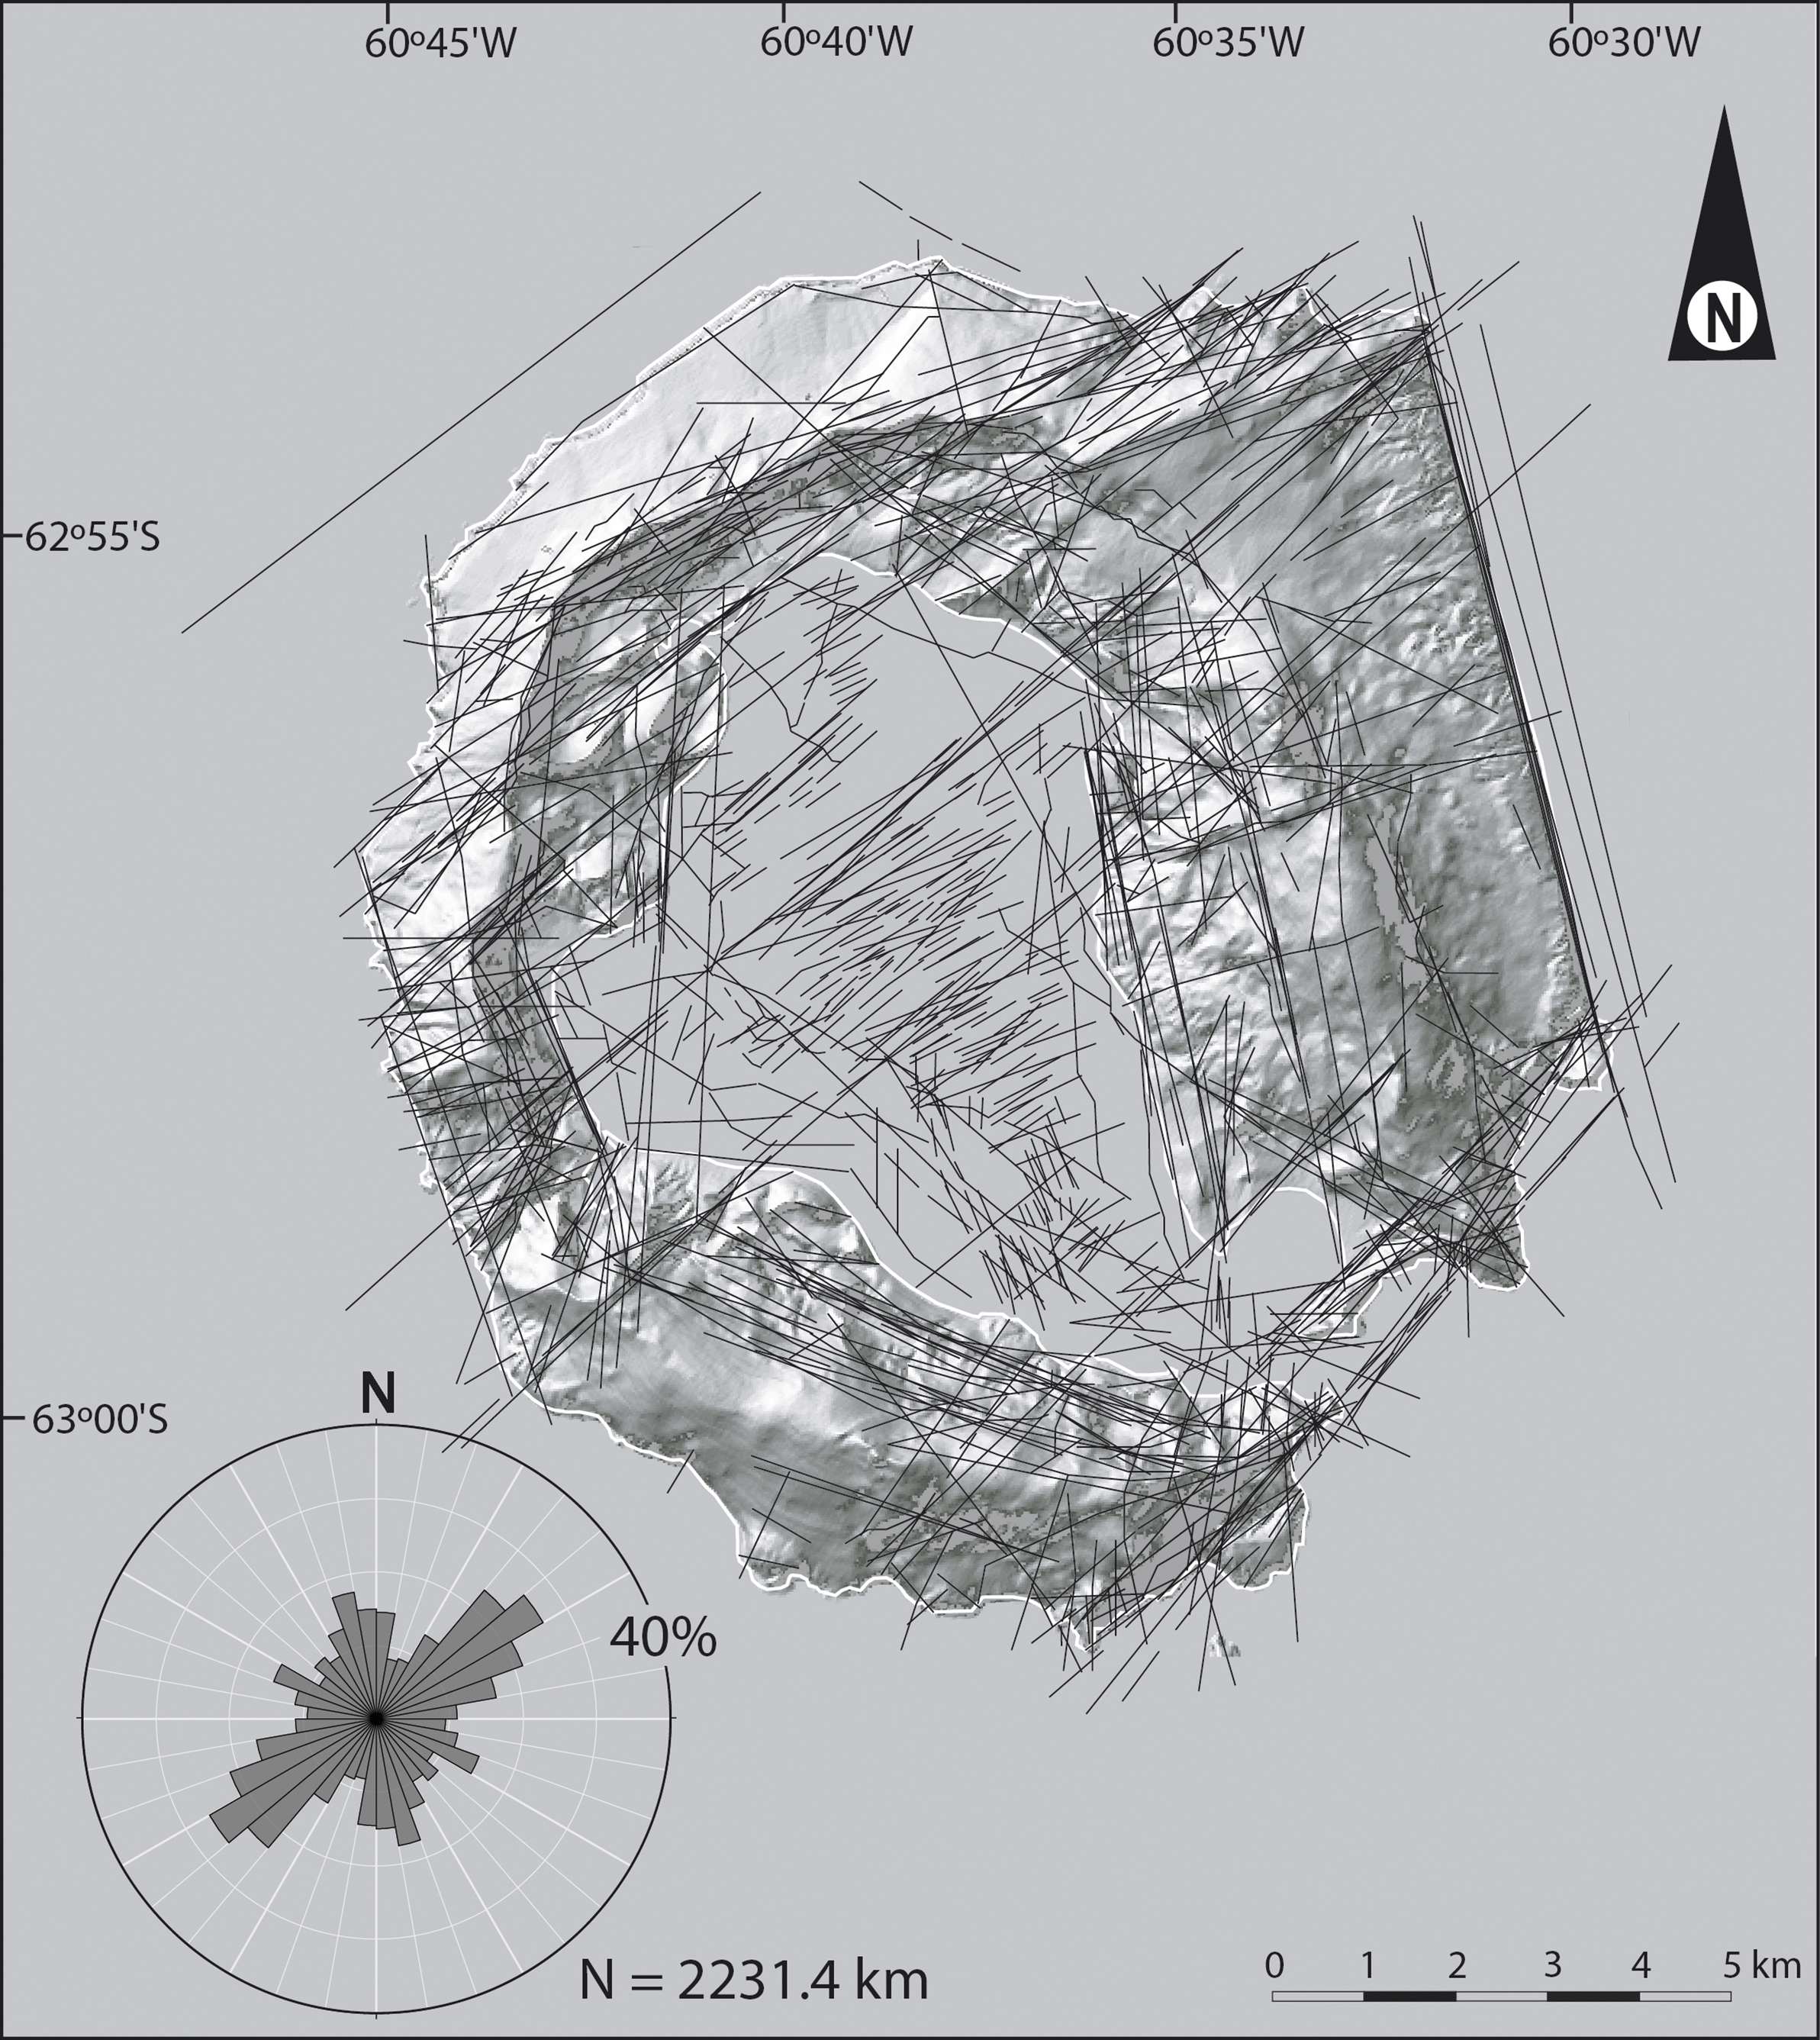
The caldera formation seems to be conditioned by a combination of regional tectonic and volcano-induced stresses (Smellie & López-Martínez Reference Smellie, López-Martínez, López-Martínez, Smellie, Thomson and Thomson2002). The combination of these processes has led to the development of a series of discontinuities that, associated with volcanic activity, have generated fractures and various morphostructural features. A good number of lineaments have been represented in the maps, schemes and figures of some of the many existing publications on the geology, geophysics and geomorphology of Deception Island. However, it seems that not all of these various authors have used similar criteria to identify the lineaments, resulting in a complex and confusing network when all of the lineaments identified in the various publications are represented together (Fig. 2).
Joint representation in a single map of all of the lineaments proposed by the various authors mentioned in the text and analysed in this study, obtained from aerial photography, satellite images, digital terrain models and field data. The rose diagram shows the length-weighted orientations of all of the lineaments. The outer circle represents 40% of the data and N indicates the total length of all lineaments.
The aim of this paper is to analyse the proposals of these various authors, as well as our own data, in order to obtain a synthetic image of the tectonic-volcanic lineaments of Deception Island. The proposed map also considers other existing geophysical, geological and morphostructural evidence and identifies which of the existing lineaments should be considered unequivocally connected to the tectonic and volcanic evolution of Deception Island, including the caldera formation.
Data and methodology of the structural analysis
The basic information for this study comes from previous works published by various authors from 1961 to the present, among which the most recent study analysing the fracturing directions of Deception Island was carried out in 2021. These studies have focused on the qualitative and quantitative description of the morphostructural elements observed on Deception Island. The characterized morphostructural elements are located both in the emerged area of Deception Island and in the submerged part of its inner bay (Port Foster), and they mainly consist of lineaments, fractures (faults, joints and dykes), volcanic buildings and areas of fumarolic activity and thermal anomalies. Information related to this topic has been compiled from 40 articles. The lineament and fracturing data were analysed using statistical software (Grapher v.7.01870 by Golden Software, Inc., 2007; and Stereonet v.8 by R. Allmendinger, 2013) to establish frequency orientation diagrams in the form of rose diagrams and smoothed frequency curves. The smoothed frequency curves were prepared using the technique proposed by Wise & McCrory (Reference Wise and McCrory1982) to eliminate the intrinsic dispersion of lineament orientations due to the methodology used in their determination, utilizing the concept of moving average windows to better determine the mode of each dataset. In the case of lineaments, the rose diagrams have been weighted according to their length, so that longer lineaments have greater representativeness.
Identified lineaments
The study of the lineaments identified on Deception Island consisted of the compilation and extraction of the traces of possible fractures or other morphotectonic discontinuities existing in previous cartographies. The review revealed that the information used for the creation of the maps comes from three sources: 1) geological observations and measurements on data collected from the island’s surface during reconnaissance itineraries (Hawkes Reference Hawkes1961, González-Ferrán & Katsui Reference González-Ferrán and Katsui1970, Dalziel et al. Reference Dalziel, Birkenmajer, Mpodozis, Ramos and Thomson1989, Martí et al. Reference Martí, Baraldo and Rey1990, Reference Martí, Vila, Rey, McGuire, Jones and Neuberg1996, Reference Martí, Geyer and Aguirre-Diaz2013, Birkenmajer Reference Birkenmajer1992, Reference Birkenmajer1995, Baraldo Reference Baraldo1999, Baraldo & Rinaldi Reference Baraldo and Rinaldi2000, López-Martínez et al. Reference López-Martínez, Serrano, Rey, Smellie, López-Martínez, Smellie, Thomson and Thomson2000, Smellie & López-Martínez Reference Smellie, López-Martínez, López-Martínez, Smellie, Thomson and Thomson2000, Pérez-López et al. Reference Pérez-López, Giner-Robles, Martínez-Díaz, Rodríguez-Pascua, Bejar, Paredes, González-Casado, Cooper, Barrett, Stagg, Storey, Stump and Wise2007, Reference Pérez-López, Giner-Robles, Béjar, Rodríguez-Pascua, Martínez-Díaz, Paredes and González-Casado2008), 2) the analysis of satellite images, digital terrain models and aerial photographs that provided a synoptic view of the terrain and enabled the identification of physiographical lineaments (Martí et al. Reference Martí, Vila, Rey, McGuire, Jones and Neuberg1996, Baraldo Reference Baraldo1999, Baraldo & Rinaldi Reference Baraldo and Rinaldi2000, López-Martínez et al. Reference López-Martínez, Serrano, Rey, Smellie, López-Martínez, Smellie, Thomson and Thomson2000, Smellie & López-Martínez Reference Smellie, López-Martínez, López-Martínez, Smellie, Thomson and Thomson2000, Paredes et al. Reference Paredes, Pérez-Lopez, Giner-Robles, de la Vega, García-García and Gumiel2006, Reference Paredes, De la Vega, Pérez-López, Giner-Robles and Martínez-Díaz2007, Pérez-López et al., Reference Pérez-López, Giner-Robles, Martínez-Díaz, Rodríguez-Pascua, Bejar, Paredes, González-Casado, Cooper, Barrett, Stagg, Storey, Stump and Wise2007, Reference Pérez-López, Giner-Robles, Béjar, Rodríguez-Pascua, Martínez-Díaz, Paredes and González-Casado2008, Dunaev et al. Reference Dunaev, Bryantseva and Kuznetsov2021) and 3) geophysical interpretations and recordings using magnetic, gravimetric and seismic techniques, as well as geochemical prospecting campaigns on land and at sea (Martí et al. Reference Martí, Baraldo and Rey1990, Reference Martí, Vila, Rey, McGuire, Jones and Neuberg1996, Rey et al. Reference Rey, De Andrés and Fernández-López1990, Reference Rey, Somoza, Hernández-Molina and López-Martínez1992, Reference Rey, Somoza and Martínez-Frías1995, Reference Rey, Somoza, Martinez-Frías, Benito, Martín-Alfageme, Nicholson, Hein, Biihn and Dasgupta1997, Reference Rey, Maestro, Somoza, Smellie, López-Martínez, Smellie, Thomson and Thomson2002, Carbó et al. Reference Carbó, Muñoz-Martín, Dávila, Catalán and García2001, Navarro et al. Reference Navarro, Vélez, Camacho and Vieira2002, Somoza et al. Reference Somoza, Martinez-Frías, Smellie, Rey and Maestro2004, Muñoz-Martin et al. Reference Muñoz-Martín, Catalán, Martín-Dávila and Carbó2005, Catalán et al. Reference Catalán, Martos, Galindo-Zaldívar and Funaki2014, Pueyo et al. Reference Pueyo, Gil Imaz, Gil-Peña, Maestro, Galindo-Zaldívar and López-Martínez2014, Belyaev et al. Reference Belyaev, Huertas, Navarro, Amaya-Vías, de la Paz and Sparaventi2024). In some cases, the lineaments mapped in the analysed articles come from the combination of several of the sources described (Rey et al. Reference Rey, De Andrés and Fernández-López1990, Reference Rey, Somoza and Martínez-Frías1995, Reference Rey, Somoza, Martinez-Frías, Benito, Martín-Alfageme, Nicholson, Hein, Biihn and Dasgupta1997, Reference Rey, Maestro, Somoza, Smellie, López-Martínez, Smellie, Thomson and Thomson2002, Vila et al. Reference Vila, Martí, Ortiz, García and Correig1992, González-Casado et al. Reference González-Casado, López-Martínez, Giner, Durán and Gumiel1999, Somoza et al. Reference Somoza, Martinez-Frías, Smellie, Rey and Maestro2004, Paredes et al. Reference Paredes, Pérez-Lopez, Giner-Robles, de la Vega, García-García and Gumiel2006, Reference Paredes, De la Vega, Pérez-López, Giner-Robles and Martínez-Díaz2007, Bonatto et al. Reference Bonatto, Badi, Bidone, Caselli, Bengoa and Ibañez2007, Maestro et al. Reference Maestro, Somoza, Rey, Martínez-Frías and López-Martínez2007, Berrocoso et al. Reference Berrocoso, Torrecillas, Jigena and Fernández-Ros2012, Pedrera et al. Reference Pedrera, Ruiz-Constán, Heredia, Galindo-Zaldívar, Bohoyo and Marín-Lechado2012, Martí et al. Reference Martí, Geyer and Aguirre-Diaz2013, Torrecillas et al. Reference Torrecillas, Berrocoso, Felpeto, Torrecillas and García2013, Bartolini et al. Reference Bartolini, Geyer, Martí, Pedrazzi and Aguirre-Díaz2014, Lopes et al. Reference Lopes, Caselli, Machado, Barata, Platz, Massironi, Byrne and Hiesinger2015, Muniz et al. Reference Muniz, Anjos, Cardoso, Rosa, Vieira and Marotta2018, Álvarez-Valero et al. Reference Álvarez-Valero, Gisbert, Aulinas, Geyer, Kereszturi and Polo-Sánchez2020, Hopfenblatt et al. Reference Hopfenblatt, Geyer, Aulinas, Álvarez-Valero, Gisbert and Kereszturi2021, Jiménez-Morales Reference Jiménez-Morales2021). Before discussing the results obtained from the analysis of this information, it is important to highlight the characteristics and limitations of each procedure used by the various authors to determine the lineaments.
On the one hand, the fractures identified in outcrops in the field often have a lateral continuity that is difficult to determine due to reasons such as them being covered by later deposits, fault planes curving as they cross geological units with different rheological behaviours (Woodcock & Fischer Reference Woodcock and Fischer1986) or faults arranged en echelon (or staggered), relayed or anastomosed depending on how the slip is distributed based on the rheological conditions and the total stress that needs to be accommodated (Davis & Reynolds Reference Davis and Reynolds1996). These factors lead to a high degree of subjectivity in extending tectonic structures beyond where they are clearly observed, which must be considered in any analysis.
On the other hand, although lineaments observed in satellite images, digital terrain models and aerial photographs sometimes correspond to identifiable faults, fractures or dykes in the field, there are many situations in which these features cannot be located in the studied areas due to the level of detail in the observations. The tectonic significance of the lineaments has been much debated, and two trends can be distinguished from discussions of this: 1) lineaments are linear discontinuities directly related to faults and fractures, excluding other phenomena (Cazabat Reference Cazabat1975), and 2) lineaments are linear discontinuities with a composite nature, associated with landscape morphological elements and various tectonic phenomena (Chukwu-Ike & Norman Reference Chukwu-Ike and Norwan1977, Scanvic Reference Scanvic1989). This second definition is likely to be more accurate, as there is usually a clear relationship between the linear feature and the terrain morphology. However, identifying lineaments with discontinuities or geological structures occurs only occasionally (Cortés et al. Reference Cortés, Maestro, Soriano and Casas1998, Reference Cortés, Soriano, Maestro and Casas2003). Some lineaments, especially large ones, represent surface manifestations of diverse structural elements along their paths, grouping together fractures, topographical depressions and boundaries of lithological or structural domains (Scanvic Reference Scanvic1989).
Finally, the results of data analysis from geophysical methods enable the identification of gradient changes in gravimetric and magnetic anomalies, which help define lineaments, lithological contacts and potential faults at the crustal level, delimiting first-order structures. In addition, the interpretation of high-resolution seismic profiles helps to establish the most relevant tectonic structures affecting the more recent units, and when a significant grid of seismic profiles is available, the length, direction and offset of faults can be reliably determined.
The lineaments defined by various authors have been vectorized from the published images. The resulting vector file is analysed using an automatic exploration program (DXFLINES developed by R. Merinero, unpublished). The exploration program used reads vectorial format files, scanning first along the x-axis and then along the y-axis, following the sequence in which the lines were drawn. The program generates a file including for each line the (x, y) coordinates of its ends, its length in metres and its angle in degrees reckoned clockwise positive from north. The projection and coordinate system used in our analysis is UTM Zone 20S and WGS84 datum.
Fracture study
There are few studies in which systematic measurements of fractures affecting the volcanic units on Deception Island have been conducted (Maestro et al. Reference Maestro, Somoza, Rey, Martínez-Frías and López-Martínez2007, Paredes et al. Reference Paredes, De la Vega, Pérez-López, Giner-Robles and Martínez-Díaz2007, Pérez-López et al. Reference Pérez-López, Giner-Robles, Martínez-Díaz, Rodríguez-Pascua, Bejar, Paredes, González-Casado, Cooper, Barrett, Stagg, Storey, Stump and Wise2007, Reference Pérez-López, Giner-Robles, Béjar, Rodríguez-Pascua, Martínez-Díaz, Paredes and González-Casado2008). The brittle structures measured can be classified into three categories according to the relative displacement between the blocks on either side: i) joints, where no relative movement between the blocks occurs, for which the direction, dip and dip direction of the joint planes were considered, 2) dykes, related to the intrusion of basic rocks along fracture planes, for which the direction, dip and dip direction of the fracture planes through which the igneous material ascended were measured, and 3) faults, where the blocks slide relative to each other. Due to the lithological characteristics of the volcanic rocks outcropping on Deception Island, faults were characterized solely according to four parameters: fault plane direction, dip, dip direction and sense of movement, as slickensides are difficult to observe on the fault planes.
Correlation between lineaments and fractures measured in the field
Visually, a comparison can be made between the different frequency curves that show the orientations of the lineaments determined by various authors, as well as the fracture data (faults, joints and dykes) measured in different outcrops located within the different volcanic units that constitute Deception Island. To minimize the subjective effect of visual comparison, a correlation analysis was also performed to determine the relationship between the different frequency curves of the lineament orientations. For this, Spearman’s correlation (rs ) was used, as it is one of the most commonly used methods to assess the relationship between two variables whose data do not follow a normal distribution (Sheskin Reference Sheskin2000, Chok Reference Chok2010). Furthermore, Spearman’s correlation enables the use of data ranks instead of the raw data, meaning that the correlation between the different smoothed frequency curves obtained from the weighted data of the lineament directions could be calculated.
Spearman’s correlation is defined by Equation 1:
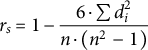 $$\begin{align}{r}_s=1-\frac{6\cdot \sum {d}_i^2}{n\cdot \left({n}^2\right.-\left.1\right)}\end{align}$$
where d is the difference in the frequency ranks between the two variables being compared, which have the same direction, and n is the number of data pairs (in this case, directions), which in our case come to 180 (from 0° to 180°, 0° = 180°). Spearman’s correlation coefficient varies between -1 and 1, and it allows us to determine the direction and strength of the correlation. If we have a correlation coefficient between -1 and < 0, there is a negative correlation between the analysed variables; if the correlation coefficient varies between > 0 and 1, the correlation is positive; and if the coefficient is 0, there is no correlation. In our analysis, only positive correlations were considered. To determine the strength of the correlation, we applied the distribution proposed by Kuckartz et al. (Reference Kuckartz, Rädiker, Ebert and Schehl2013), who established the following intervals for rs values: between 0.0 and < 0.1, there is no correlation; between 0.1 and < 0.3, there is a weak correlation; between 0.3 and < 0.5, the correlation is moderate; between 0.5 and < 0.7, the correlation is strong; and between 0.7 and 1.0, the correlation is very strong. In this study, only correlations that varied between moderate and very strong were considered (Table I).
Spearman’s correlation coefficient values for the different variables analysed in this study: 1) fractures measured in the rocky outcrops of Deception Island (normal, reverse, dextral and sinistral faults, diaclases and dykes) and 2) lineaments proposed by the various authors analysed in this study based on the interpretation of aerial photographs, satellite images, digital terrain models and field data. If the correlation coefficient varies between -1 and < 0 then the correlation between the variables is negative; if the correlation coefficient varies between > 0 and 1 then the correlation between the variables is positive; and if the coefficient is 0 then there is no correlation. For correlation coefficient values between 0.0 and < 0.1, there is no correlation; for correlation coefficient values between 0.1 and < 0.3, there is weak correlation; for correlation coefficient values between 0.3 and < 0.5, the correlation is moderate; for correlation coefficient values between 0.5 and < 0.7, the correlation is strong; and for correlation coefficient values between 0.7 and 1.0, the correlation is very strong. In this study, only moderate (orange), strong (yellow) and very strong (green) positive correlation ratios have been considered.

Distribution of heated ground, fumaroles, volcanic structures and earthquake epicentres
Volcanic structures, fumaroles and heated ground have been mapped based on existing information from various works (López-Martínez et al. Reference López-Martínez, Ramos, Criado, Serrano and Nicolás1996, Reference López-Martínez, Serrano, Rey, Smellie, López-Martínez, Smellie, Thomson and Thomson2000, Smellie & López-Martínez Reference Smellie, López-Martínez, López-Martínez, Smellie, Thomson and Thomson2000, Somoza et al. Reference Somoza, Martinez-Frías, Smellie, Rey and Maestro2004, Caselli et al. Reference Caselli, Badi, Bonatto, Bengoa, Agusto, Bidone and Ibáñez2007, Martí et al. Reference Martí, Geyer and Aguirre-Diaz2013, Pedrazzi et al. Reference Pedrazzi, Kereszturi, Lobo, Geyer and Calle2020, Hopfenblatt et al. Reference Hopfenblatt, Geyer, Aulinas, Álvarez-Valero, Gisbert and Kereszturi2021). In addition to the main volcanic structure and the caldera, there are many smaller volcanic features, such as tuff cones, tuff rings and ash cones. Most cones and craters are located inside the caldera, where their original shapes can be reconstructed and mapped. The areas with the highest concentration of craters are around Telefon Bay and along the northern slope of Mount Kirkwood ridge. In the Telefon Bay area, craters that originated during the 1967 and 1970 eruptions are well preserved, with some of them being occupied by lakes. Some noticeable depressions and scarps, of varying sizes, discernible in several places within the glaciers, have been interpreted as subglacial structural features. The most notable are those approximately parallel to the main divide of the island, located on both sides of Mount Pond (López-Martínez et al. Reference López-Martínez, Serrano, Rey, Smellie, López-Martínez, Smellie, Thomson and Thomson2000), particularly to the east of Goddard Hill and on the western side of Mount Pond. These depressions, with diameters ranging from 100 to 300 m, have margins that are locally indistinct, and the ice cracks in their vicinity are subparallel to their edges. López-Martínez & Serrano (Reference López-Martínez, Serrano, López-Martínez, Smellie, Thomson and Thomson2002) interpreted these depressions as the result of recent or even ongoing thermal activity beneath the ice.
Thermal anomalies can be observed in various locations on the island, where fumaroles, hot soils or deposits from fumarolic activity are present. Most evidence of thermal activity is found along the coast of Port Foster. However, fumaroles are also present to the north of Mount Pond, north of Whalers Bay, north-west of Decepción Base (Argentina) and on the western slopes of Stonethrow Ridge, west of Fumarole Bay. The highest temperatures recorded (~108°C) were measured in Fumarole Bay (López-Martínez et al. Reference López-Martínez, Ramos, Criado, Serrano and Nicolás1996, Reference López-Martínez, Serrano, Rey, Smellie, López-Martínez, Smellie, Thomson and Thomson2000, Villegas et al. Reference Villegas, Caselli and García1997, Smellie & López-Martínez Reference Smellie, López-Martínez, López-Martínez, Smellie, Thomson and Thomson2000, Caselli et al. Reference Caselli, dos Santos Afonso and Agusto2004, Kusakabe et al. Reference Kusakabe, Nagao, Ohba, Seo, Park, Lee and Park2009).
Although seismic monitoring of the Deception Island volcano began in the 1950s, it was abandoned after the 1967–1970 eruptions. It was not until 1994 that the Andalusian Institute of Geophysics (University of Granada, Spain) began to systematically study the seismic activity (e.g. Almendros et al. Reference Almendros, Ibáñez, Alguacil, Del Pezzo and Ortiz1997, Reference Almendros, Ibáñez, Alguacil and Del Pezzo1999, Reference Almendros, Carmona, Jiménez-Morales, Díaz-Moreno and Lorenzo2018, Reference Almendros, Wilcock, Soule, Teixidó, Vizcaíno and Ardanaz2020), which was continued by the Spanish National Geographical Institute (IGN) from 2022. Initially, seismic monitoring was limited to summer periods (December–February), until a permanent station was deployed in 2008 (e.g. Carmona et al. Reference Carmona, Almendros, Martín, Cortés, Alguacil and Moreno2014). Over the last 3 decades, Deception Island’s volcanic seismicity has shown a continuous background of long-period events and tremors, related to the activity of the shallow hydrothermal system (Carmona et al. Reference Carmona, Almendros, Martín, Serrano, Stich and Ibáñez2012). This situation defines the latent state of the volcano. However, seismic activity has intensified on at least three recent occasions: in 1992 (Ortiz et al. Reference Ortiz, García, Aparicio, Blanco, Felpeto, Del-Rey and Ricci1997), in 1999 (Ibáñez et al. Reference Ibáñez, Carmona, Almendros, Saccorotti, Del Pezzo, Abril and Ortiz2003) and in 2015 (Almendros et al. Reference Almendros, Carmona, Jiménez-Morales, Díaz-Moreno and Lorenzo2018). These activities were characterized by an increase in the number and energy of seismic events and the appearance of a large number of volcano-tectonic earthquakes caused by fractures within the volcanic edifice. Epicentre data from the years 1999 and 2015 were published by Moreno-Vacas & Almendros (Reference Moreno-Vacas and Almendros2021), and data from 1999 and 2009–2020 were provided by the Andalusian Institute of Geophysics (University of Granada; Carmona et al. Reference Carmona, Almendros, Martín, Serrano, Stich and Ibáñez2012, Almendros et al. Reference Almendros, Carmona, Jiménez-Morales, Díaz-Moreno and Lorenzo2018), with additional data provided by the IGN from 2022 to 2024.
All of these elements, including also volcanic structures, fumaroles, heated ground and earthquake epicentres, were digitized in a Geographical Information System program. This information was then used to create a density map to observe the general pattern and to highlight preferred directions. Density maps were estimated using a two-dimensional, symmetric Gaussian kernel density method (e.g. Kiyosugi et al. Reference Kiyosugi, Connor, Wetmore, Ferwerda, Germa, Connor and Hintz2012, Mazzarini et al. Reference Mazzarini, Le Corvec, Isola and Favalli2016). Kernel density estimation is a non-parametric way to estimate the probability density function of features within a region around those features. The density map was generated using ArcGIS Pro software and was determined according to Equation 2:
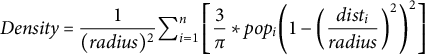 $$\begin{align}Density=\frac{1}{(radius)^2}{\sum}_{i=1}^n\left[\frac{3}{\pi}\ast po{p}_i{\left(1-{\left(\frac{dis{t}_i}{radius}\right)}^2\right)}^2\right]\end{align}$$
where i = 1,…,n are the input points within the radius of the location (x, y), popi is the population field value of point i, and disti is the distance between point i and the location (x, y). The cell size for the output raster dataset is the shorter of the width or height of the output extent in the output spatial reference, divided by 250. Finally, a specific variable bandwidth value was calculated for the input dataset using a spatial variant of Silverman’s rule of thumb (Silverman Reference Silverman1986), which is robust for outlier points. ArcGIS applies Equation 3 to calculate the bandwidth:
 $$\begin{align}Bandwidth=0.9\ast \mathit{\min}\left( SD,\sqrt{\frac{1}{\mathit{\ln}(2)}}\ast {D}_m\right)\ast {n}^{-0.2}\end{align}$$
where Dm is the (weighted) median distance from the (weighted) mean centre, n is the number of points and SD is the standard distance.
Results
The analysis includes the distribution of volcanic edifices, locations with evidence of thermal and geochemical anomalies related to heated ground and fumaroles, earthquake epicentres, linear elements identified in aerial photographs, satellite images and in the digital terrain model and fractures measured in rock outcrops. This has allowed us to characterize the preferred orientations in which these features are distributed, both on the emerged surface of Deception Island and in its submerged part in Port Foster and the surrounding areas in the Bransfield Strait.
Lineaments identified on Deception Island
A total of 40 scientific publications have been analysed that, although in many cases not as their primary goal, include maps or schemes of lineaments or determine the existence of linear structures controlling the physiography and structure of Deception Island. For a detailed analysis, these works have been grouped into three categories based on the methodology used to determine the lineaments: 1) mapping of lineaments based on geological observations and fracturing data taken from rock outcrops on the island, as well as interpretations from satellite images, digital terrain models and aerial photographs conducted by the authors without relying on prior data (Hawkes Reference Hawkes1961, González-Ferrán & Katsui Reference González-Ferrán and Katsui1970, Dalziel et al. Reference Dalziel, Birkenmajer, Mpodozis, Ramos and Thomson1989, Martí et al. Reference Martí, Baraldo and Rey1990, Reference Martí, Vila, Rey, McGuire, Jones and Neuberg1996, Reference Martí, Geyer and Aguirre-Diaz2013, Birkenmajer Reference Birkenmajer1992, Baraldo Reference Baraldo1999, López-Martínez et al. Reference López-Martínez, Serrano, Rey, Smellie, López-Martínez, Smellie, Thomson and Thomson2000, Smellie & López-Martínez Reference Smellie, López-Martínez, López-Martínez, Smellie, Thomson and Thomson2000, Paredes et al. Reference Paredes, Pérez-Lopez, Giner-Robles, de la Vega, García-García and Gumiel2006, Reference Paredes, De la Vega, Pérez-López, Giner-Robles and Martínez-Díaz2007, Dunaev et al. Reference Dunaev, Bryantseva and Kuznetsov2021), 2) cartographies of linear structures based on the interpretation of geophysical data (Rey et al. Reference Rey, De Andrés and Fernández-López1990, Reference Rey, Somoza, Hernández-Molina and López-Martínez1992, Reference Rey, Maestro, Somoza, Smellie, López-Martínez, Smellie, Thomson and Thomson2002, Carbó et al. Reference Carbó, Muñoz-Martín, Dávila, Catalán and García2001, Navarro et al. Reference Navarro, Vélez, Camacho and Vieira2002, Muñoz-Martín et al. Reference Muñoz-Martín, Catalán, Martín-Dávila and Carbó2005, Catalán et al. Reference Catalán, Martos, Galindo-Zaldívar and Funaki2014, Pueyo et al. Reference Pueyo, Gil Imaz, Gil-Peña, Maestro, Galindo-Zaldívar and López-Martínez2014) and 3) distributions of chemical elements in sediments or on the sea surface in Port Foster (Rey et al. Reference Rey, Somoza, Martinez-Frías, Benito, Martín-Alfageme, Nicholson, Hein, Biihn and Dasgupta1997, Somoza et al. Reference Somoza, Martinez-Frías, Smellie, Rey and Maestro2004, Belyaev et al. Reference Belyaev, Huertas, Navarro, Amaya-Vías, de la Paz and Sparaventi2024). The rest of the studies analysed compile information from previous publications, so the data that they provide would be repetitive and have not been used in this study.
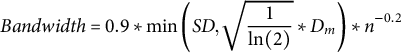
Considering their direction and length, the lineaments determined on Deception Island and mapped in the various scientific papers analysed in this study exhibit three preferred directions: N050E, N110E and N170E (Fig. 2). The cartographies by Hawkes (Reference Hawkes1961), González-Ferrán & Katsui (Reference González-Ferrán and Katsui1970) and Birkenmajer (Reference Birkenmajer1992) focus on morphostructural features related to the collapse of the volcanic edifice, emphasizing concentric and radial structures to the caldera (Fig. 3). Hawkes (Reference Hawkes1961) presents an absolute maximum in orientation N115E and three relative maxima in orientations N025E, N050E and N165E; González-Ferrán & Katsui (Reference González-Ferrán and Katsui1970) show an absolute maximum of direction N165E and three relative maxima of direction N005E, N055E and N095E; and Birkenmajer (Reference Birkenmajer1992) displays two absolute maxima of direction N165E and N005E and two relative maxima of direction N035E and N085E.
Separate mapping of the lineaments proposed by the 12 different papers analysed in this study, obtained from aerial photography, satellite images, digital terrain models and field data. The rose diagrams show the length-weighted orientations of the lineaments represented. The outer circle represents 40% of the data and N indicates the total length of the data.
Dalziel et al. (Reference Dalziel, Birkenmajer, Mpodozis, Ramos and Thomson1989) identified a set of lineaments showing a main direction, N045E, and a secondary one, N115E (Fig. 3). Martí et al. (Reference Martí, Baraldo and Rey1990), based on field data, photointerpretation and seismic profiles obtained in Port Foster interpreted by Rey et al. (Reference Rey, De Andrés and Fernández-López1990), determine the existence of a main lineament direction, N050E, and three secondary directions, N005E, N105E and N155E (Fig. 3). Later, these same authors modify their interpretations: Martí et al. (Reference Martí, Vila, Rey, McGuire, Jones and Neuberg1996) establish a main direction, N065E, and three secondary orientations, N045E, N115E and N175E (Fig. 3); and Martí et al. (Reference Martí, Geyer and Aguirre-Diaz2013) present two main sub-perpendicular lineament directions, N055E and N165E, and a secondary orientation, N115E (Fig. 3). Baraldo (Reference Baraldo1999), in his morphostructural interpretation, which also simplifies the information on fault orientations obtained by Rey et al. (Reference Rey, Somoza, Hernández-Molina and López-Martínez1992) in Port Foster from seismic profiles, establishes two main lineament directions, N045E and N165E (Fig. 3). López-Martínez et al. (Reference López-Martínez, Serrano, Rey, Smellie, López-Martínez, Smellie, Thomson and Thomson2000) and Smellie & López-Martínez (Reference López-Martínez, Serrano, Rey, Smellie, López-Martínez, Smellie, Thomson and Thomson2000), in their geomorphological and geological maps at 1:25 000 scale of the island, respectively, represent the same main faults affecting the different emerged volcanic units of Deception Island, and, the first of the two mentioned maps also incorporates information from Port Foster, based on Rey et al.’s (Reference Rey, Somoza, Hernández-Molina and López-Martínez1992) seismic profile interpretation, establishing a main lineament orientation, N055E, and a secondary sub-perpendicular direction, N140E (Fig. 3). Paredes et al. (Reference Paredes, Pérez-Lopez, Giner-Robles, de la Vega, García-García and Gumiel2006) conducted a detailed mapping of linear elements identified through morphometric analysis of the digital elevation model of both the emerged zone and Port Foster, obtaining two main directions, N085E and N175E, and two secondary directions, N065E and N115E (Fig. 3). Paredes et al. (Reference Paredes, De la Vega, Pérez-López, Giner-Robles and Martínez-Díaz2007) reinterpreted the information from their previous work, and, by synthesizing bibliographic work from various authors, conducting morphometric analysis of the relief and processing aerial images, they established the existence of a main lineament direction, N055E, and three secondary orientations, N115E, N135E, and N165E (Fig. 3). Finally, Dunaev et al. (Reference Dunaev, Bryantseva and Kuznetsov2021) conducted a structural-geomorphological interpretation using satellite imagery, bathymetric and topographic data and bibliographic data on the geological-geomorphological structure and geophysical investigations of the island. They established a number of lineaments with two main directions, N045E and N165E, and two secondary directions, N065E and N145E (Fig. 3).
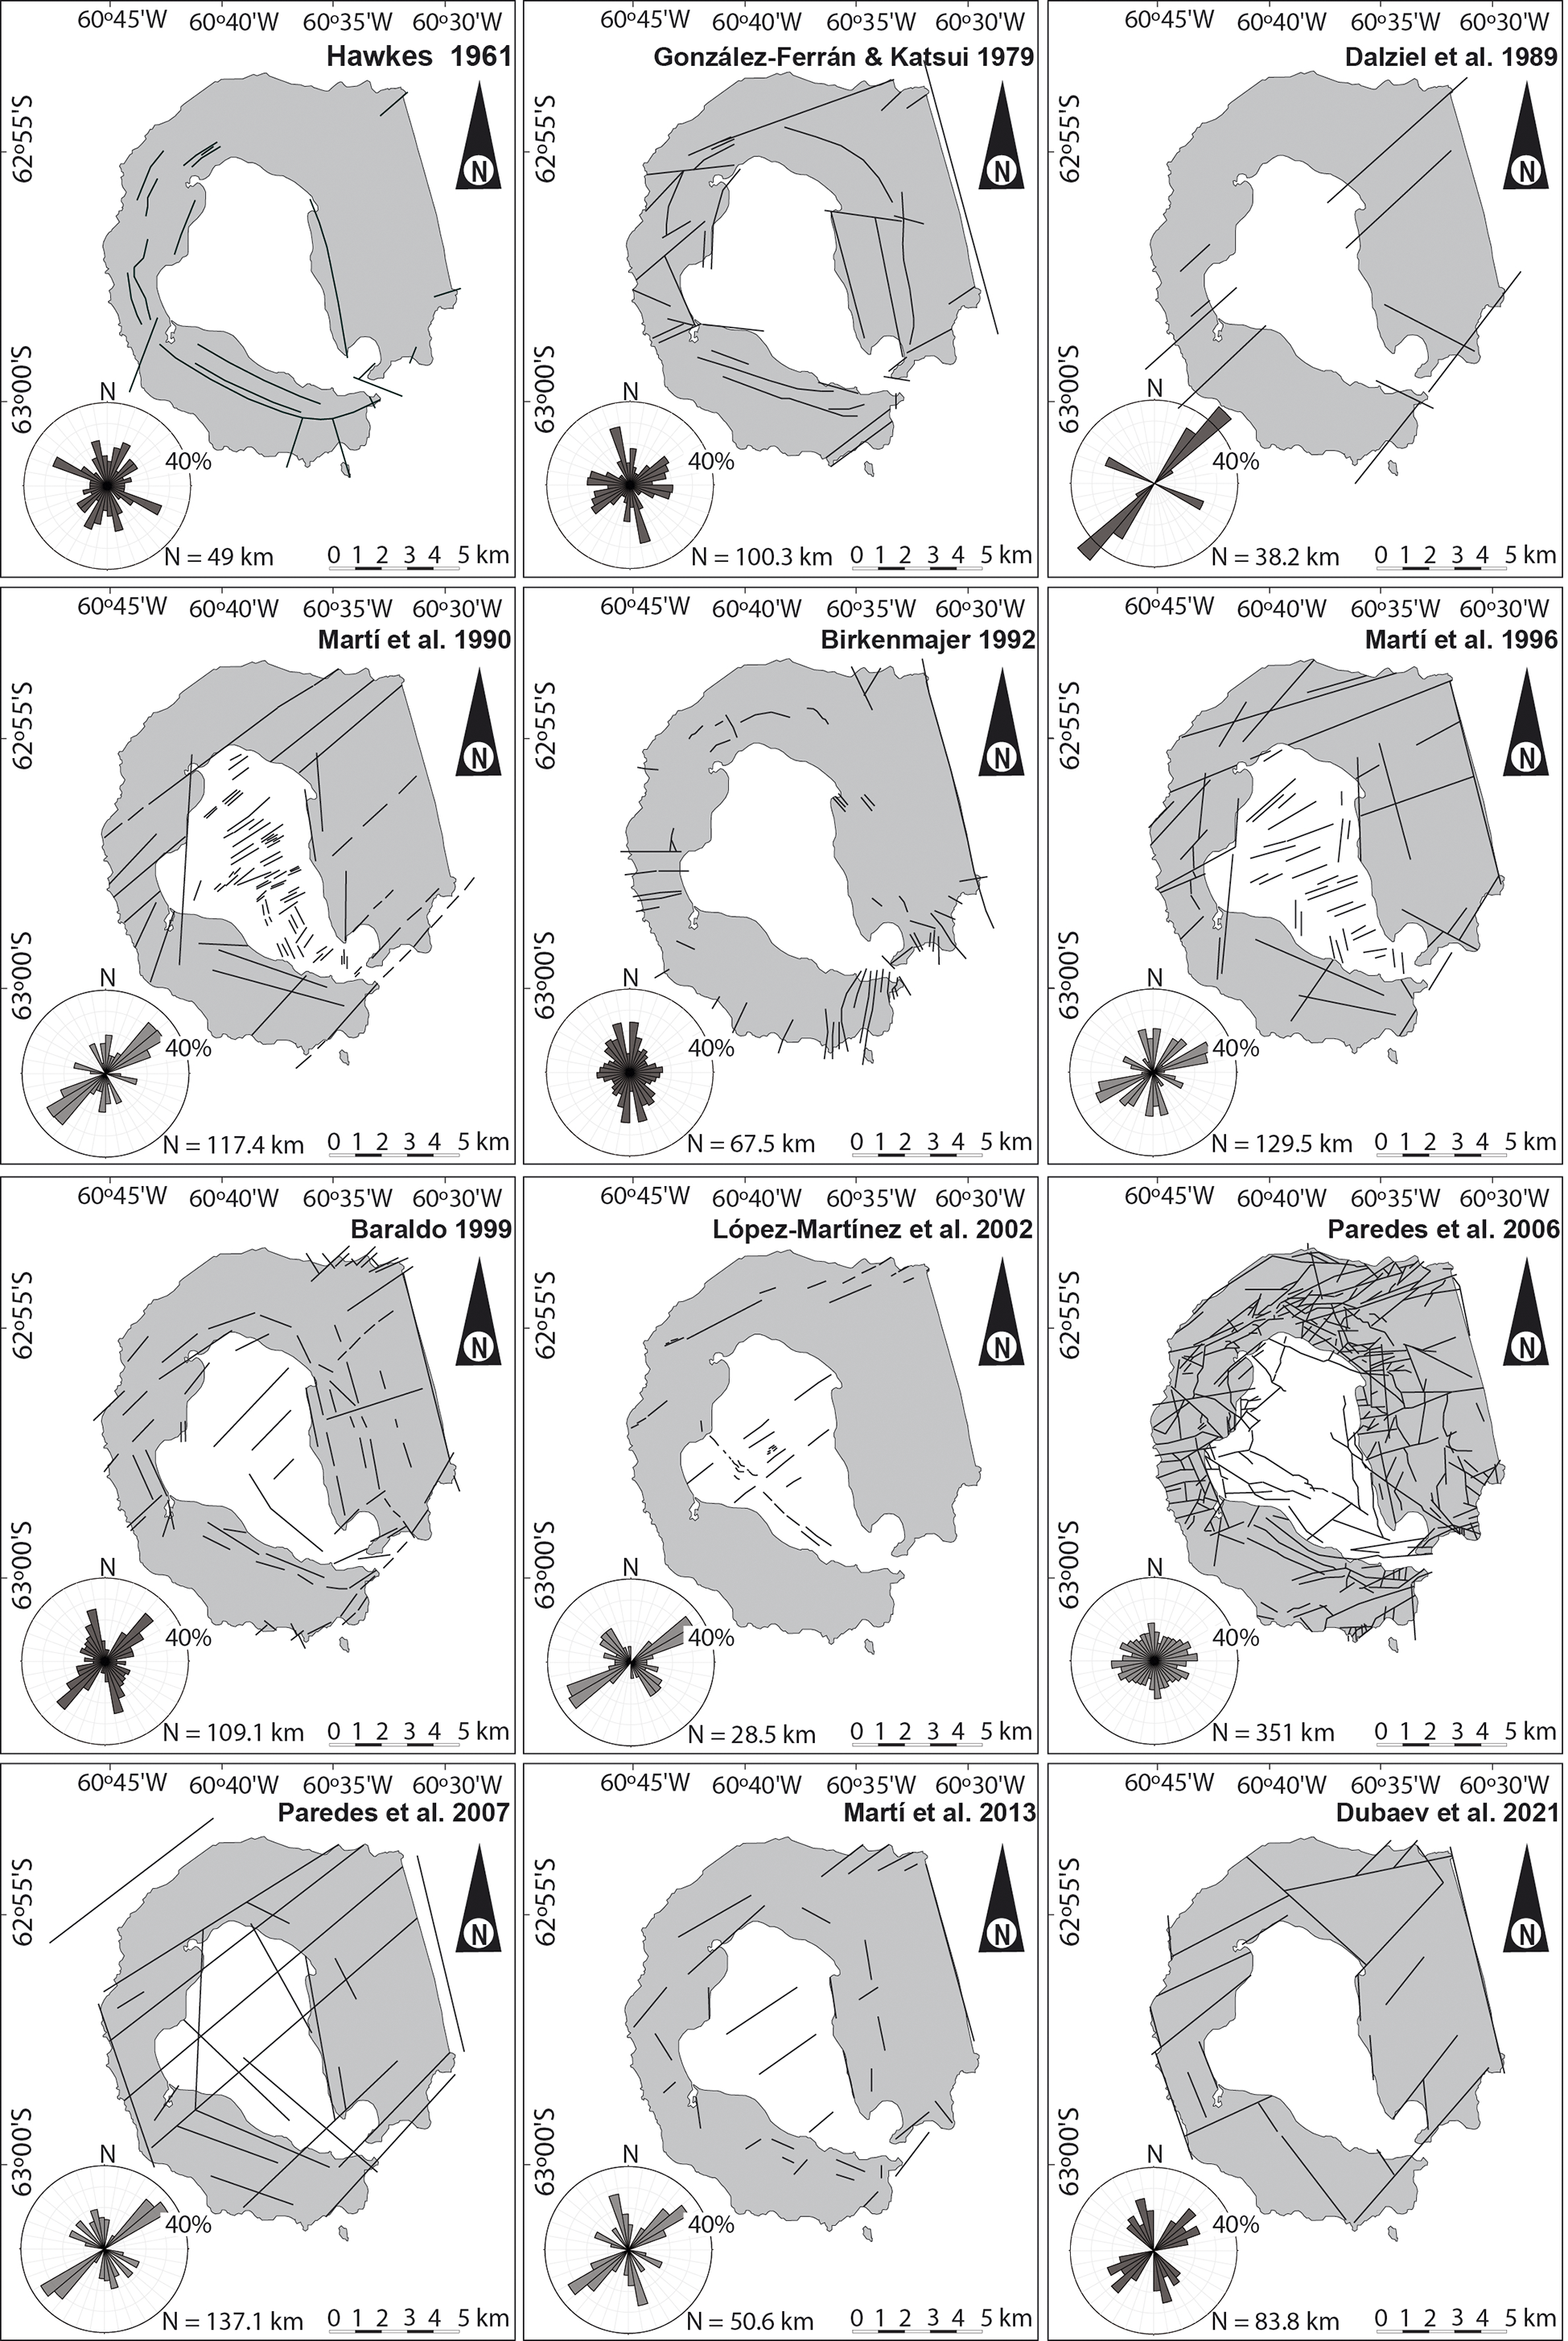
From a visual point of view, it is possible to compare the different frequency curves representing the orientations of lineaments determined by the various authors analysed in this study. As previously mentioned, these lineaments have been defined based on geological observations and fracture data collected from rock outcrops on the island, as well as from interpretations of satellite images, aerial photographs and digital elevation models. It has been observed that, although in general the mapped lineaments do not exactly coincide in the same locations (see Figs 2 & 3), there are some matches in the orientations defined by the various authors who mapped them. The lineaments defined by Dalziel et al. (Reference Dalziel, Birkenmajer, Mpodozis, Ramos and Thomson1989), Martí et al. (Reference Martí, Baraldo and Rey1990, Reference Martí, Geyer and Aguirre-Diaz2013), Baraldo (Reference Baraldo1999), Paredes et al. (Reference Paredes, De la Vega, Pérez-López, Giner-Robles and Martínez-Díaz2007) and Dunaev et al. (Reference Dunaev, Bryantseva and Kuznetsov2021) present similar directional distributions, although with variations in frequencies, showing a primary orientation with a mean value of N050E, and two secondary orientations, N115E and N165E (Fig. 4a). However, the rest of the lineament maps analysed exhibit different orientation patterns, with González-Ferrán & Katsui (Reference González-Ferrán and Katsui1970), Martí et al. (Reference Martí, Vila, Rey, McGuire, Jones and Neuberg1996) and López-Martínez et al. (Reference López-Martínez, Serrano, Rey, Smellie, López-Martínez, Smellie, Thomson and Thomson2000) showing only a common main orientation of approximately N060E (Fig. 4b).
Smoothed frequency curves showing the orientation of the lineaments identified on Deception Island by a. Dalziel et al. (Reference Dalziel, Birkenmajer, Mpodozis, Ramos and Thomson1989), Martí et al. (Reference Martí, Baraldo and Rey1990), Baraldo (Reference Baraldo1999), Paredes et al. (Reference Paredes, De la Vega, Pérez-López, Giner-Robles and Martínez-Díaz2007), Martí et al. (Reference Martí, Geyer and Aguirre-Diaz2013) and Dunaev et al. (Reference Dunaev, Bryantseva and Kuznetsov2021) and b. González-Ferrán et al. (Reference González-Ferrán and Katsui1970), Martí et al. (Reference Martí, Vila, Rey, McGuire, Jones and Neuberg1996) and López-Martínez et al. (Reference López-Martínez, Smellie, Thomson and Thomson2002).
The data obtained from the application of Spearman’s correlation to compare the weighted curves generally show weak correlations between them (see Table I), with only the relationships between the lineament directions identified by Martí et al. (Reference Martí, Baraldo and Rey1990, Reference Martí, Geyer and Aguirre-Diaz2013), Baraldo (Reference Baraldo1999), Paredes et al. (Reference Paredes, De la Vega, Pérez-López, Giner-Robles and Martínez-Díaz2007) and Dunaev et al. (Reference Dunaev, Bryantseva and Kuznetsov2021) showing very strong correlation values, thus corroborating the visual analysis of the frequency curves. Strong correlation values were also obtained between the lineaments defined by Baraldo (Reference Baraldo1999) with Martí et al. (Reference Martí, Baraldo and Rey1990) and López-Martínez et al. (Reference López-Martínez, Serrano, Rey, Smellie, López-Martínez, Smellie, Thomson and Thomson2000); Dunaev et al. (Reference Dunaev, Bryantseva and Kuznetsov2021) with Paredes et al. (Reference Paredes, De la Vega, Pérez-López, Giner-Robles and Martínez-Díaz2007); and González-Ferrán & Katsui (Reference González-Ferrán and Katsui1970) with Paredes et al. (Reference Paredes, Pérez-Lopez, Giner-Robles, de la Vega, García-García and Gumiel2006) and Martí et al. (Reference Martí, Geyer and Aguirre-Diaz2013) (Table I). Finally, moderate correlations were found between the orientations of the lineaments defined by Baraldo (Reference Baraldo1999) with González-Ferrán & Katsui (Reference González-Ferrán and Katsui1970), Dalziel et al. (Reference Dalziel, Birkenmajer, Mpodozis, Ramos and Thomson1989) and Martí et al. (Reference Martí, Vila, Rey, McGuire, Jones and Neuberg1996); Dalziel et al. (Reference Dalziel, Birkenmajer, Mpodozis, Ramos and Thomson1989) with Hawkes (Reference Hawkes1961), López-Martínez et al. (Reference López-Martínez, Serrano, Rey, Smellie, López-Martínez, Smellie, Thomson and Thomson2000) and Paredes et al. (Reference Paredes, De la Vega, Pérez-López, Giner-Robles and Martínez-Díaz2007); and Dubaev et al. (2021) with González-Ferrán & Katsui (Reference González-Ferrán and Katsui1970) and López-Martínez et al. (Reference López-Martínez, Serrano, Rey, Smellie, López-Martínez, Smellie, Thomson and Thomson2000) (Table I).
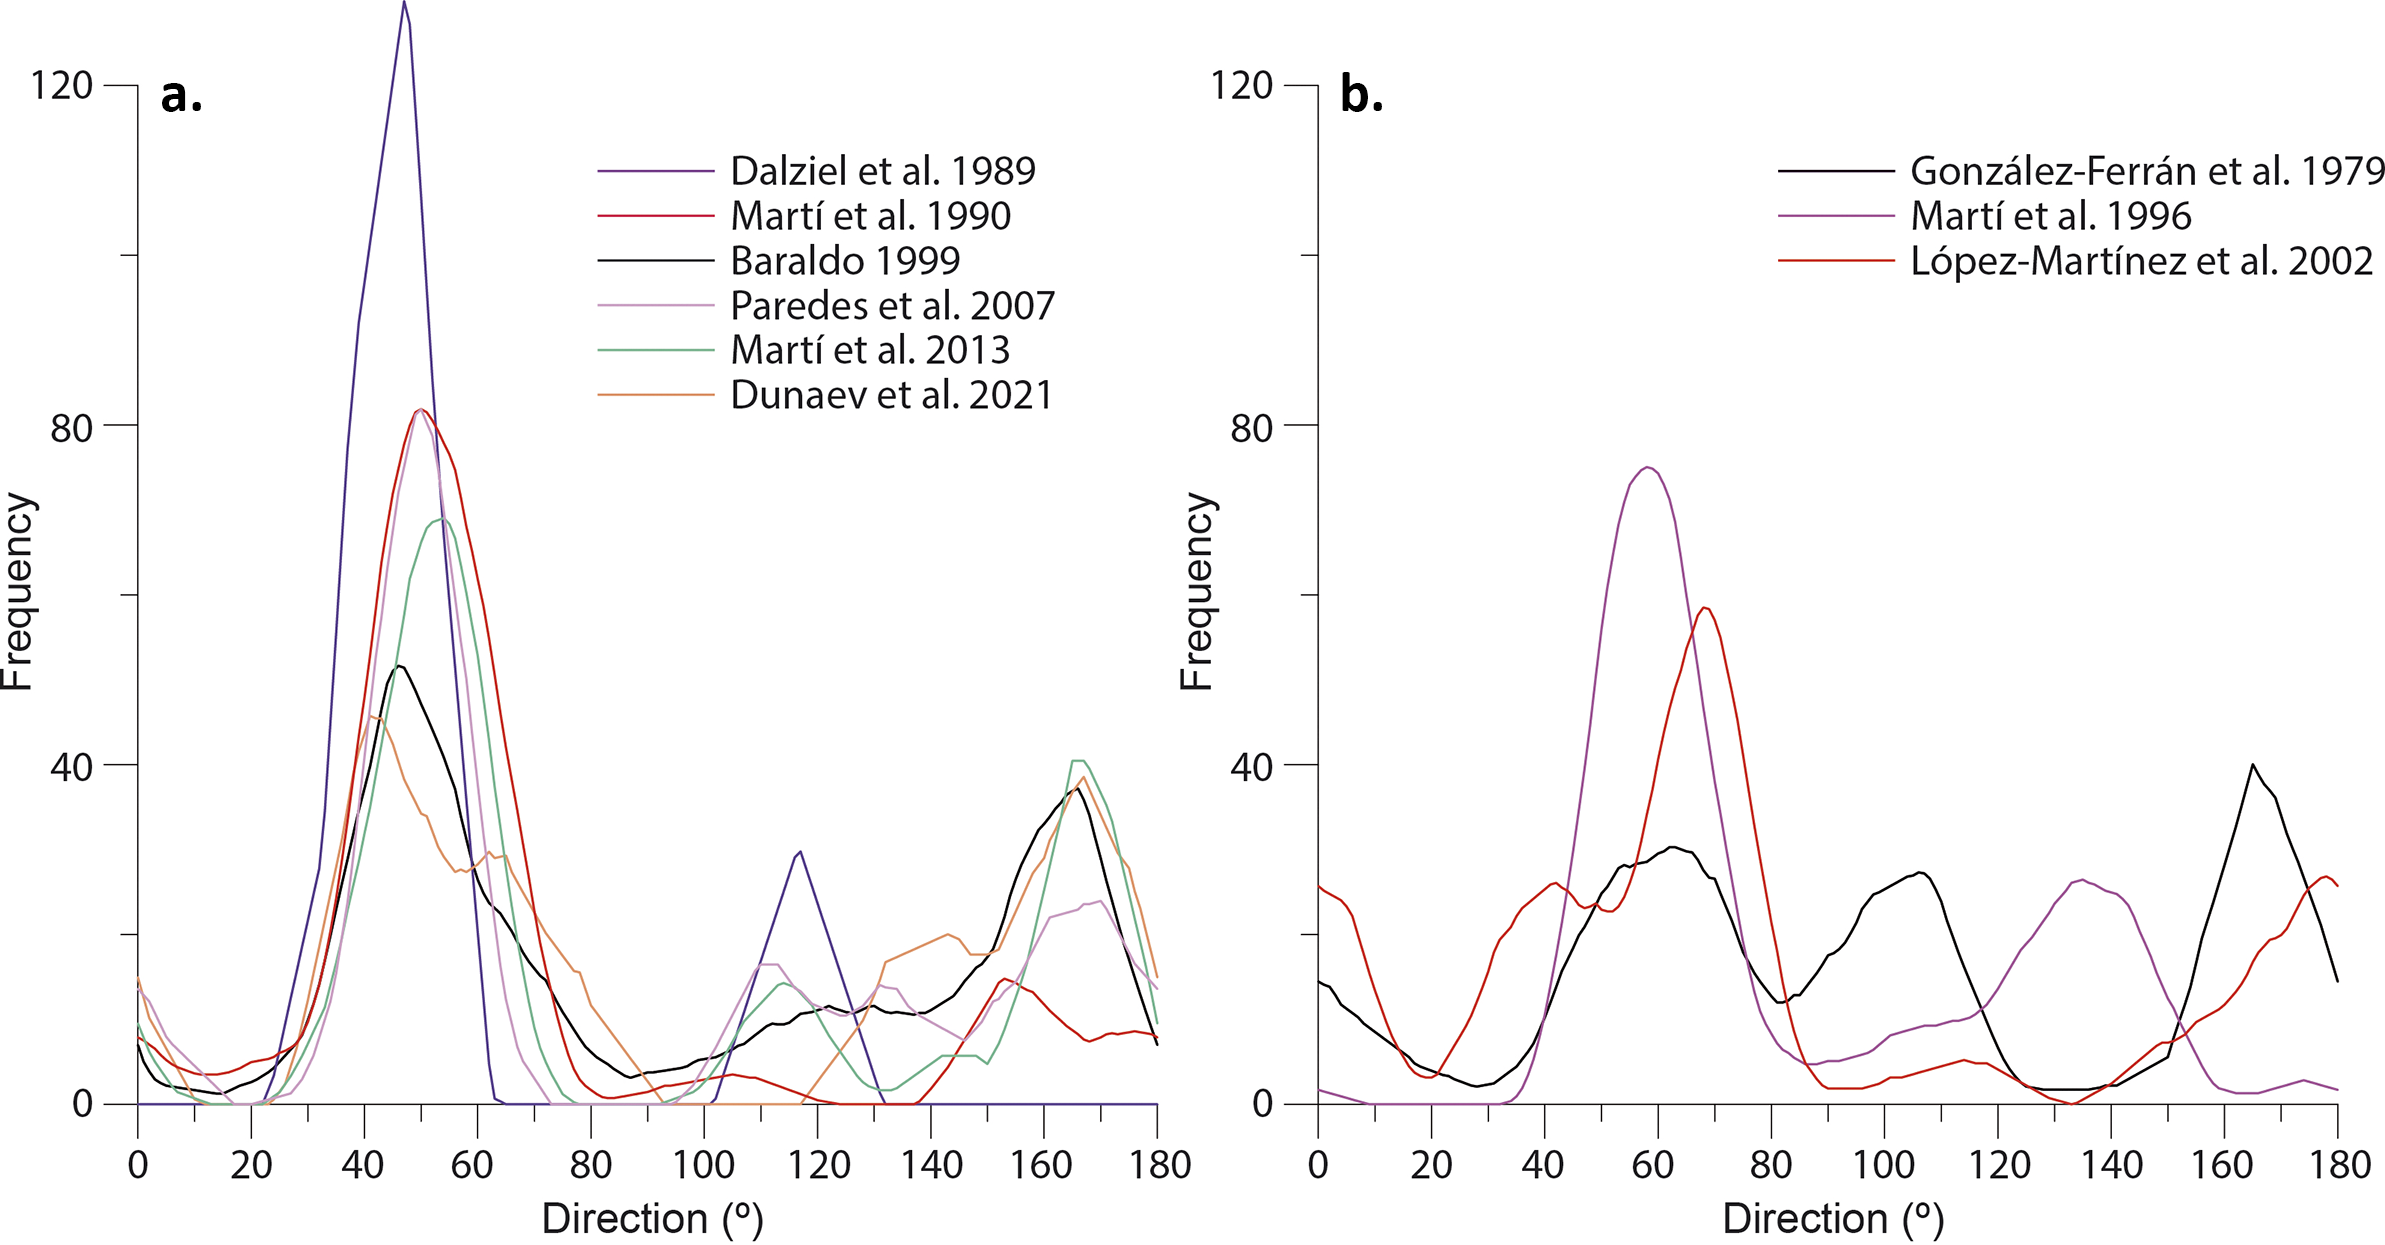
From the analysis of geophysical data obtained on the island, the existence of linear structures has also been determined. Gravimetric surveys conducted in Port Foster (Carbó et al. Reference Carbó, Muñoz-Martín, Dávila, Catalán and García2001, Navarro et al. Reference Navarro, Vélez, Camacho and Vieira2002, Muñoz-Martín et al. Reference Muñoz-Martín, Catalán, Martín-Dávila and Carbó2005) show an anomaly pattern with a NE-SW-orientated axis of minimum gravimetric values, bounded to the south and north by two axes of positive gravimetric anomalies. These elongated anomalies are further intersected by another NE-SW axis of minimum gravimetric values. Based on this distribution of anomalies, a number of fracturing directions have been inferred, showing three preferred orientations (Fig. 5a): 1) NW-SE, between Punta Murature and the southern part of Fumarole Bay, from the eastern part of Telefon Bay to Pendulum Cove and from northern Whalers Bay crossing the Neptunes Bellows, 2) NE-SW, from Punta Murature to the northern sector of Pendulum Cove, south of Fumarole Bay, along both margins of Irizar Lake and from the coastal area in front of Mount Kirkwood to Ronald Hill, and 3) N-S, from Punta Murature to Telefon Ridge. From the study of magnetic anomalies (Muñoz-Martín et al. Reference Muñoz-Martín, Catalán, Martín-Dávila and Carbó2005, Catalán et al. Reference Catalán, Martos, Galindo-Zaldívar and Funaki2014), a NE-SW maximum is observed north of the island, extending along the northern sector of Telefon Ridge, bounding the southern part of Kendall Terrace, to Macaroni Point (Fig. 5b). Pueyo et al. (Reference Pueyo, Gil Imaz, Gil-Peña, Maestro, Galindo-Zaldívar and López-Martínez2014) interpreted the existence of a series of tectonic features based on an anisotropy of magnetic susceptibility (AMS) study of samples collected from various post-caldera units of Deception Island. This study determined that the AMS values are not compatible with the tilting of the emplacement surface of the volcanic flows. This incompatibility can be resolved through tilting processes related to caldera collapse and non-coaxial tilting relative to the emplacement surface, associated with tilting directions compatible with the tectonic regime of the island. This AMS analysis has enabled the detection of both tilted volcanic units and areas of the island unaffected by post-emplacement tilting. A series of faults responsible for these tilting processes, which are not currently observable because they are covered by more recent volcanic deposits, have been defined. NE-SW structures have been identified, bounding the northern and southern sectors of Fumarole Bay and extending towards Pendulum Cove, near Gabriel de Castilla Base (Spain), and from Collins Point to Ronald Hill and the crest of Mount Pond, with a NW-SE direction from Punta Murature to the northern coast of the island, parallel to the crest of Mount Kirkwood near the coast of Port Foster, and from South East Point to Ronald Point. A N-S-orientated fault from Ronald Hill to Crimson Hill is also described (Fig. 5c).
Mapping of fracture zones interpreted from a. Bouguer gravity anomalies (Carbó et al. Reference Carbó, Muñoz-Martín, Dávila, Catalán and García2001, Navarro et al. Reference Navarro, Vélez, Camacho and Vieira2002, Muñoz-Martín et al. Reference Muñoz-Martín, Catalán, Martín-Dávila and Carbó2005), b. magnetic anomalies (Muñoz-Martín et al. Reference Muñoz-Martín, Catalán, Martín-Dávila and Carbó2005, Catalán et al. Reference Catalán, Martos, Galindo-Zaldívar and Funaki2014) and c. tilting of volcanic units established from anisotropy of magnetic susceptibility (AMS) analysis (Pueyo et al. Reference Pueyo, Gil Imaz, Gil-Peña, Maestro, Galindo-Zaldívar and López-Martínez2014).
Based on reflection seismic surveys conducted in 1987–1988 and 1988–1989 applying Geopulse and Sparker acquisition systems, the main tectonic structures affecting the fill units of Port Foster were characterized (Rey et al. Reference Rey, De Andrés and Fernández-López1990, Reference Rey, Somoza, Hernández-Molina and López-Martínez1992, Reference Rey, Somoza and Martínez-Frías1995, Reference Rey, Maestro, Somoza, Smellie, López-Martínez, Smellie, Thomson and Thomson2002). These studies determined the existence of an extensional fault with a NE-SW orientation, located between Fumarole Bay and Pendulum Cove, which presents a displacement of ~250 m. Parallel to this structure, a set of conjugate normal faults develop, affecting the most recent depositional units, giving the bay a horsts and grabens structure. Rey et al. (Reference Rey, Somoza, Hernández-Molina and López-Martínez1992) and López-Martínez et al. (Reference López-Martínez, Serrano, Rey, Smellie, López-Martínez, Smellie, Thomson and Thomson2000) mapped another NW-SE normal fault, sub-perpendicular to the main structure, located in the western part of Port Foster, extending from Punta Murature to the vicinity of Collins Point.
Finally, studies focused on the geochemistry of bottom sediments and surface waters (0.5–1.0 m depth) in Port Foster have found evidence of the distribution of certain elements following very defined trends, which these authors relate to the existence of volcanic cones, mounds and vents formed in association with normal extensional faults that facilitate the ascent of hydrothermal fluids enriched in these elements. Rey et al. (Reference Rey, Somoza, Martinez-Frías, Benito, Martín-Alfageme, Nicholson, Hein, Biihn and Dasgupta1997, Reference Rey, Maestro, Somoza, Smellie, López-Martínez, Smellie, Thomson and Thomson2002) and Somoza et al. (Reference Somoza, Martinez-Frías, Smellie, Rey and Maestro2004) show a preferred distribution on the seafloor, with sediments rich in Mn, Fe and Eu distributed in a NW-SE direction from Punta Murature to Collins Point, and those with high As and Ba contents distributed in a NE-SW direction from Fumarole Bay to the north of Pendulum Cove. Belyaev et al. (Reference Belyaev, Huertas, Navarro, Amaya-Vías, de la Paz and Sparaventi2024) measured trace metals, greenhouse gases and inorganic nutrients in the surface waters of Port Foster during January–February 2021. This study, despite lacking a uniform sampling distribution across Port Foster’s surface, shows a certain trend in the distribution of the analysed nutrients (NO3- and NH4+), exhibiting a NE-SW orientation. NO3- shows a preferred distribution from the coast near Gabriel de Castilla Base (Spain) to the vicinity of Ronald Hill, whereas NH4+ extends from east to west of Telefon Bay, from Cross Hill to the north of Pendulum Cove. These authors suggest that these nutrients are products of biochemical processes related to hydrothermal inputs.
Fracturing analysis
The fracturing data regarding the volcanic rocks of Deception Island were obtained during four field campaigns carried out in 2001 (Maestro et al. Reference Maestro, Somoza, Rey, Martínez-Frías and López-Martínez2007) and in 2004, 2005 and 2007 (Paredes et al. Reference Paredes, Pérez-Lopez, Giner-Robles, de la Vega, García-García and Gumiel2006, Pérez-López et al. Reference Pérez-López, Giner-Robles, Martínez-Díaz, Rodríguez-Pascua, Bejar, Paredes, González-Casado, Cooper, Barrett, Stagg, Storey, Stump and Wise2007, Reference Pérez-López, Giner-Robles, Béjar, Rodríguez-Pascua, Martínez-Díaz, Paredes and González-Casado2008). A total of 27 measurement stations were assessed, with six located in pre-caldera units and the rest in post-caldera units (Fig. 6). A total of 673 fracture planes were measured, of which 450 are faults, 190 are joints and 33 are basaltic dykes (Fig. 7). In general, these fractures exhibit dips ranging from 7° to 90°, with a modal value of 84° and a mean value of 72°. The fractures measured in the field display a somewhat radial distribution, although two sub-perpendicular preferred directions, N020E and N128E, are in evidence (Fig. 8a). Additionally, considering the fracture directions measured at each of the stations, there is significant heterogeneity in the preferred orientations between stations, with no constant preferred direction recurring across all of them, even at stations that are relatively close to one another (e.g. stations 13, 14, 15, 16, 17, 18, 19 and 20).
. a. Simplified geological sketch map of Deception Island (modified from Smellie & López-Martínez Reference Smellie, López-Martínez, López-Martínez, Smellie, Thomson and Thomson2000, Smellie Reference Smellie2001) and locations of the fracture sites. Rose diagrams show the orientation of fractures at the outcrop scale (outer circle represents 40%). N is the number of fractures measured at each site. b. Rose diagrams indicating the orientation frequency for all measured fractures.

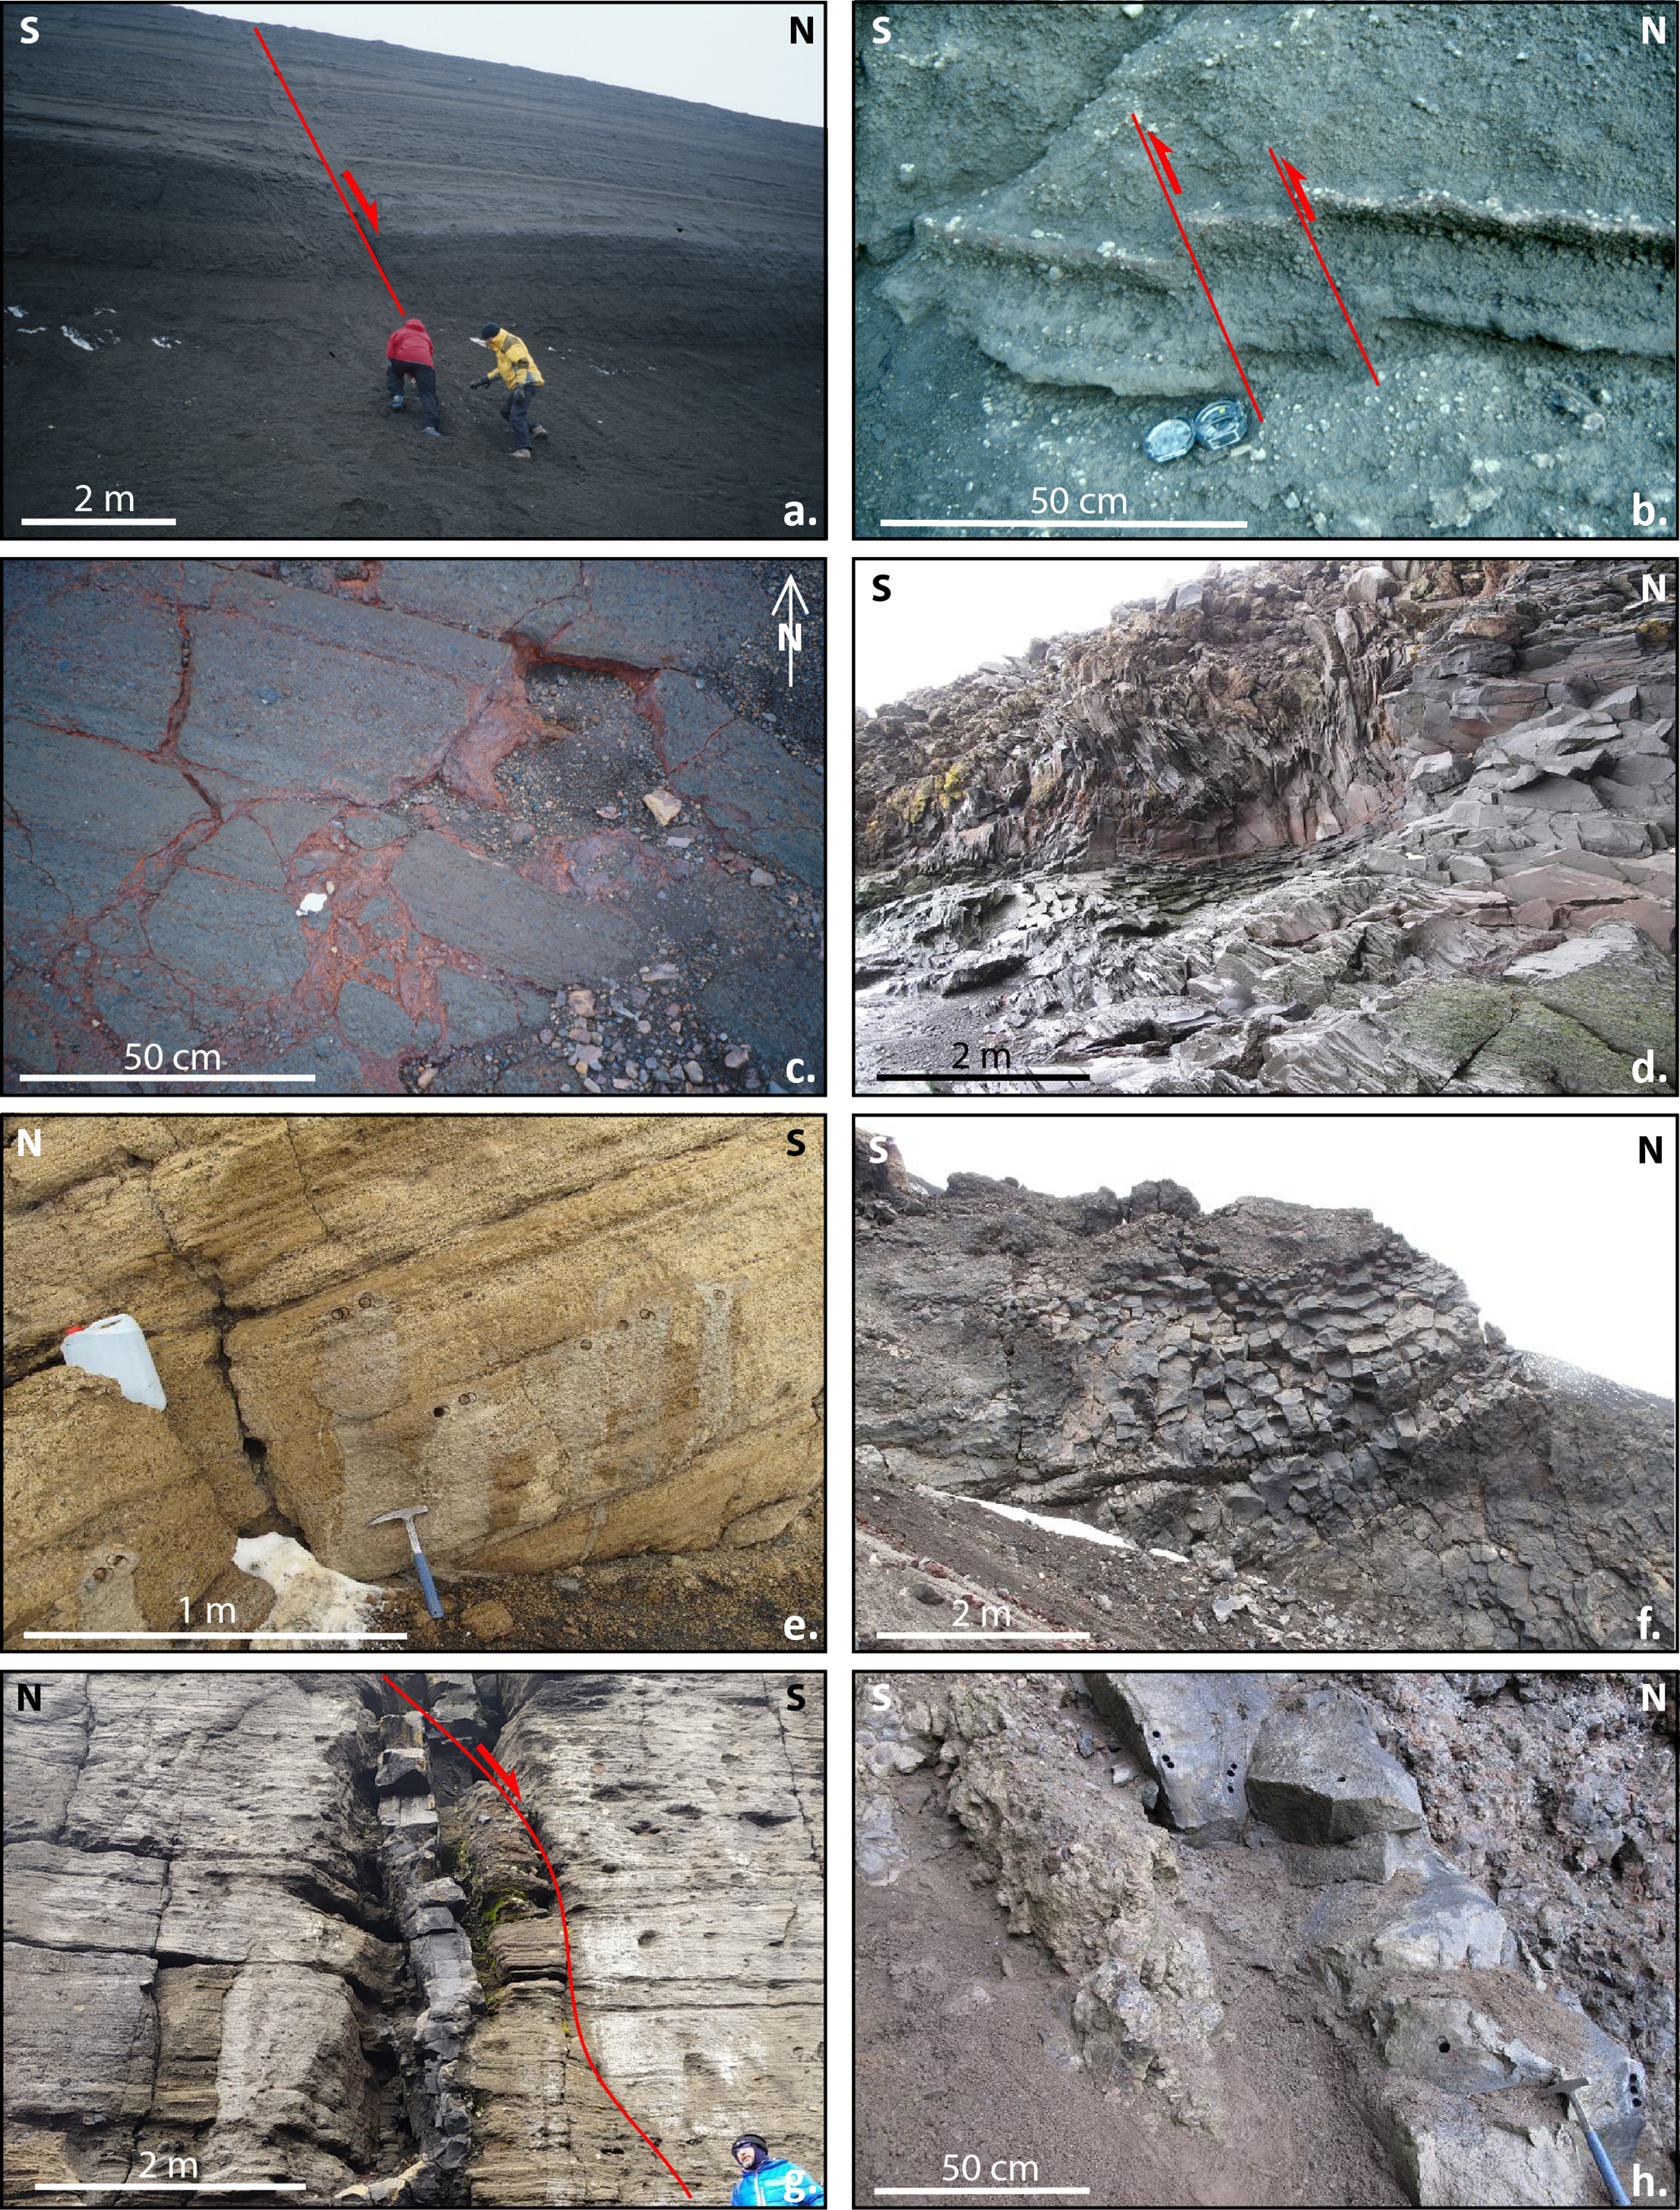
Examples of the different types of fractures affecting the volcanic units of Deception Island. a. Normal fault affecting the pyroclastic deposits of the Pendulum Cove Formation in the vicinity of Punta Murature. b. Reverse faults affecting the Pendulum Cove Formation units north of Punta Murature. c. Joints with mineralization in the Pendulum Cove Formation north of Punta Murature. d. Joints affecting the Kendall Terrace Member units between Gabriel de Castilla Base and Collins Point. e. Joints affecting the Baily Head Formation units in the vicinity of Whalers Bay. f. Columnar disjunction affecting a dyke intruding Kendall Terrace Member units at Telefon Ridge. g. Dyke intruding into the Baily Head Formation units in the Irizar Lake area, later affected by a normal fault. h. Dyke affecting the Fumarole Bay Formation units in the Stonethrow Ridge area.
Smoothed frequency curves showing the orientation for all measured a. fractures, b. faults, c. joints and d. dykes.

Regarding the different types of fracture planes, the faults exhibit centimetre- to metre-scale displacements, primarily with a normal component (347 faults), followed by faults with a reverse component (86 faults) and strike-slip faults (17 faults). These exhibit two preferred directions: N015E and N128E (Fig. 8b). The normal faults have dips ranging from 7° to 89°, with a modal value of 85° and a mean value of 71°. Their orientations are N015E, N060E and N130E (Fig. 8b). The reverse faults have dips ranging from 11° to 90°, with a modal value of 45° and a mean value of 62°. They exhibit two main orientations, N040E and N118E, and two secondary orientations, N095E and N150E (Fig. 8b). The strike-slip faults (9 sinistral and 8 dextral) have dips ranging from 55° to 89°, with a modal value of 88° and a mean value of 81°. Their main orientation is N010E, with two secondary orientations, N040E and N110E (Fig. 8b). The joints exhibit dips ranging from 25° to 90°, with a modal value of 89° and a mean value of 75°. The main orientation is N032E, with three secondary directions, N078E, N098E and N135E (Fig. 8c). Finally, the dykes, which have thicknesses ranging from centimetres to metres, exhibit dips between 69° and 88°, with a modal value of 84° and a mean value of 80°. Their main direction is N035E, with two secondary orientations, N075E and N163E (Fig. 8d).
Visual analysis of the frequency curves of the different types of fractures analysed indicates a certain similarity in some of the fracture directions (Fig. 8). A correlation can be observed between the orientations of dykes and joints at approximately N040E, N078E and N098E, whereas no similarity is found between the orientations of these structures and the faults in general. However, when dividing the faults into different types based on their sense of motion (normal, reverse and strike-slip faults), a relationship is noted in the preferred direction of the normal and dextral faults orientated at N010E and the dykes, joints and reverse and sinistral faults orientated at N040E (Fig. 8). When analysing the values obtained by applying Spearman’s correlation to the frequency curves of the differentiated fracture types (Table I), it is observed that dykes and sinistral faults show a very strong correlation, that diaclases and reverse faults, as well as normal faults and dextral faults, show strong correlations and that diaclases, dykes and sinistral faults show a moderate correlation.
Relationship between fracture directions measured in the field and identified lineaments
A correlation analysis has also been carried out to determine the relationship between the frequency curves of directions of the different types of fractures analysed (faults, joints and dykes) and the lineaments identified by the various authors considered in this study. Comparing the frequency curves obtained from the orientations of fractures measured in the field and the lineaments defined on Deception Island reveals no similarity, with maxima frequency values in fracture orientations corresponding to minima frequency values in lineament orientations (Fig. 9).
Smoothed frequency curves showing the orientation of all lineaments and fractures measured in rock outcrops on Deception Island published by the various authors analysed in this study.
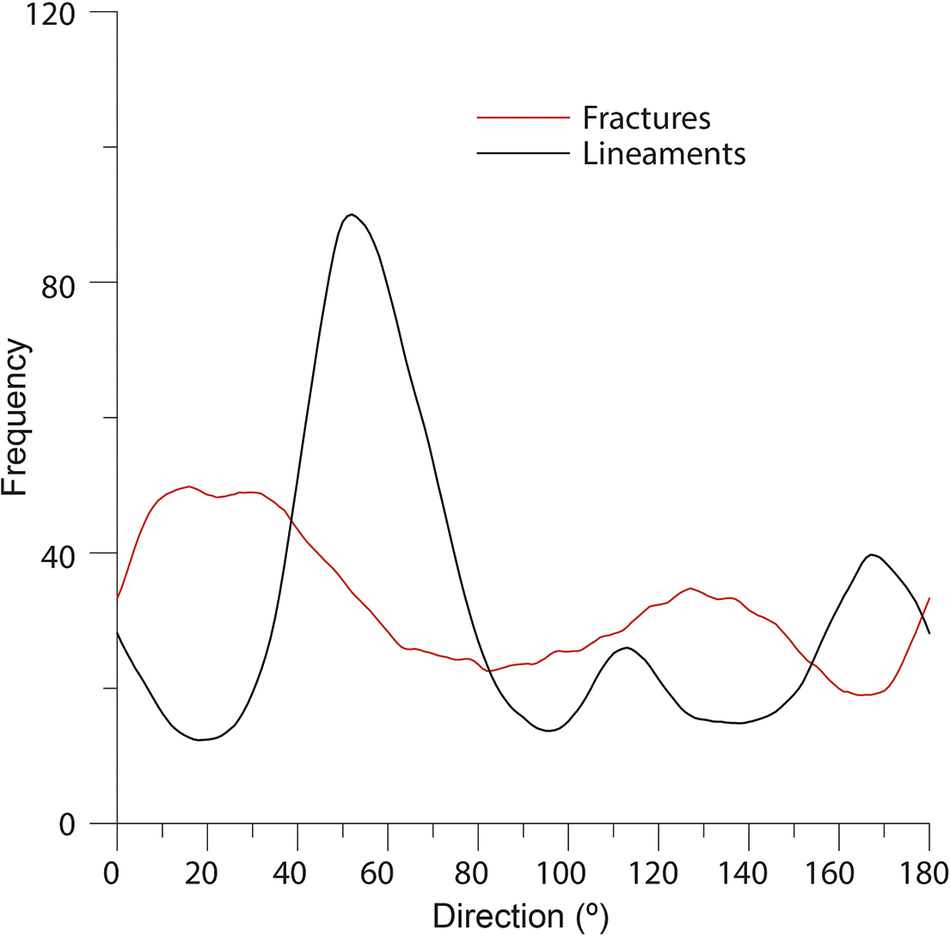
The Spearman’s correlation values between the fractures and the lineaments show no or weak correlation, or, in several cases, even negative correlation (Table I). Considering only the positive correlation indices with moderate to very strong correlation strength, it can be observed that there is a very strong correlation between the directions of reverse faults and the orientations of lineaments proposed by Dalziel et al. (Reference Dalziel, Birkenmajer, Mpodozis, Ramos and Thomson1989) and between the sinistral faults and lineaments mapped by Martí et al. (Reference Martí, Baraldo and Rey1990) (Table I). Strong correlations are found between the directions of the dykes and the lineaments mapped by Martí et al. (Reference Martí, Baraldo and Rey1990, Reference Martí, Vila, Rey, McGuire, Jones and Neuberg1996), as well as between the directions of the sinistral faults and the lineaments identified by Martí et al. (Reference Martí, Vila, Rey, McGuire, Jones and Neuberg1996) (Table I). Finally, moderate correlations exist between the orientations of the joints and the lineaments mapped by Dalziel et al. (Reference Dalziel, Birkenmajer, Mpodozis, Ramos and Thomson1989), between the directions of the dykes and the lineaments proposed by Dalziel et al. (Reference Dalziel, Birkenmajer, Mpodozis, Ramos and Thomson1989) and Dunaev et al. (Reference Dunaev, Bryantseva and Kuznetsov2021), between the orientations of reverse faults and the lineaments identified by Hawkes (Reference Hawkes1961) and between the directions of sinistral faults and the lineaments mapped by Hawkes (Reference Hawkes1961), Dalziel et al. (Reference Dalziel, Birkenmajer, Mpodozis, Ramos and Thomson1989), Martí et al. (Reference Martí, Geyer and Aguirre-Diaz2013), Paredes et al. (Reference Paredes, De la Vega, Pérez-López, Giner-Robles and Martínez-Díaz2007) and Dunaev et al. (Reference Dunaev, Bryantseva and Kuznetsov2021) (Table I).
Distribution of heated ground, fumaroles, volcanic edifices and earthquake epicentres
Hydrothermal flows originating from volcanic processes are channelled to the surface through fractures. Evidence of these flows includes the development of heated ground and fumaroles on the surface, which are therefore preferentially located along fractures. On Deception Island, a series of specific areas showing the presence of these thermal anomalies, catalogued as fumaroles, evidence of fumarolic activity and heated ground, have been mapped in the same way by López-Martínez et al. (Reference López-Martínez, Serrano, Rey, Smellie, López-Martínez, Smellie, Thomson and Thomson2000) and Smellie & López-Martínez (Reference López-Martínez, Serrano, Rey, Smellie, López-Martínez, Smellie, Thomson and Thomson2000). A total of 38 such locations have been identified, primarily distributed along the coast of the island’s inner bay, mainly in the areas of Fumarole Bay, Punta Murature, Telefon Bay, Pendulum Cove and Whalers Bay (Figs 10a & 11). Thermal anomalies have also been observed in some sectors of the glacier cap that covers the eastern flank of the island, north-east of Ronald Hill and north of Mount Pond (Fig. 10a). It is possible that such thermal anomalies may exist in other places, but the thick ice cover, as mentioned earlier, which extends mainly over the eastern and south-western sectors of the island, prevents their observation. Additionally, the analysis includes thermal anomaly data from the sea surface in Port Foster, obtained in December 2000 during the HYDRODEC-2000 cruise (Somoza et al. Reference Somoza, Martinez-Frías, Smellie, Rey and Maestro2004), when temperatures up to 17°C were detected (Fig. 10a). Similar sea-surface thermal anomalies were observed by Dykes et al. (Reference Dykes, Sturz and Gray2001) in the same area in November 2000, where temperatures between 7°C and 15°C were recorded. The distribution of these thermal anomaly zones shows a preferred NE-SW orientation, extending from Fumarole Bay to Pendulum Cove (Fig. 10a). Additionally, two N-S-orientated alignments can be distinguished, one extending from Punta Murature up to the north of Cross Hill and the other extending from the central part of Port Foster up to the north of Telefon Bay, as well as an E-W orientation from Pendulum Cove to the glacier ridge north of Mount Pond and a NW-SE orientation from Ronald Hill up to Whalers Bay (Fig. 10a).
Distribution maps of areas of a. thermal anomalies (heated ground and fumaroles) (López-Martínez et al. Reference López-Martínez, Serrano, Rey, Smellie, López-Martínez, Smellie, Thomson and Thomson2000, Smellie & López-Martínez Reference Smellie, López-Martínez, López-Martínez, Smellie, Thomson and Thomson2000, Somoza et al. Reference Somoza, Martinez-Frías, Smellie, Rey and Maestro2004), b. central zone of well-preserved and inferred volcanic edifices (López-Martínez et al. Reference López-Martínez, Serrano, Rey, Smellie, López-Martínez, Smellie, Thomson and Thomson2000, Smellie & López-Martínez Reference Smellie, López-Martínez, López-Martínez, Smellie, Thomson and Thomson2000, Barclay et al. Reference Barclay, Wilcock and Ibáñez2009, Pedrazzi et al. Reference Pedrazzi, Kereszturi, Lobo, Geyer and Calle2020, Geyer et al. Reference Geyer, Pedrazzi, Almendros, Berrocoso, López-Martínez, Maestro, Smellie, Panter and Geyer2021) and c. earthquake epicentres (Andalusian Institute of Geophysics, University of Granada and IGN, 1999, 2009–2020 and 2022–2024). Contour maps of the density of these elements have also been made. The isoline values represent the density calculated as the number of elements per square kilometre using a two-dimensional and symmetric Gaussian kernel density method.

Examples of different areas where thermal anomalies are evident on Deception Island: a. fumaroles on Whalers Bay beach; b. fumaroles on Pendulum Cove beach; c. temperature measurement on heated ground in the Fumarole Bay area; and d. bubbles in the water column in the Fumarole Bay area related to heated seepages.

Furthermore, the construction and development of volcanic edifices are generally associated with the expulsion of magma through structural discontinuities in the upper crust. Magma migration is controlled by changes in the stress field related to tectonic processes, and it occurs along fractures or crustal discontinuities (Delaney et al. Reference Delaney, Pollard, Ziony and McKee1986, Dahm Reference Dahm2000, Gudmundsson & Philipp Reference Gudmundsson and Philipp2006, Gaffney et al. Reference Gaffney, Damjanac and Valantine2007, Pedrera et al. 2011, Rivalta et al. Reference Rivalta, Taisne, Bunger and Katz2015). The monogenetic volcanoes that developed after the caldera collapse on the emerged part of Deception Island and in the Port Foster area have been mapped based on works by López-Martínez et al. (Reference López-Martínez, Serrano, Rey, Smellie, López-Martínez, Smellie, Thomson and Thomson2000), Smellie & López-Martínez (Reference López-Martínez, Serrano, Rey, Smellie, López-Martínez, Smellie, Thomson and Thomson2000) and Pedrazzi et al. (Reference Pedrazzi, Kereszturi, Lobo, Geyer and Calle2020) (Fig. 10b). Additionally, the submarine volcanic morphologies around Deception Island identified in publications by Barclay et al. (Reference Barclay, Wilcock and Ibáñez2009) and Geyer et al. (Reference Geyer, Pedrazzi, Almendros, Berrocoso, López-Martínez, Maestro, Smellie, Panter and Geyer2021) have been mapped (Fig. 10b). A total of 260 monogenetic volcanic morphologies have been distinguished, some of which are well preserved, while others have been inferred (Fig. 12). Some of these inferred morphologies, as previously mentioned in the ‘Data and methodology of the structural analysis’ section, are subglacial circular depressions that affect the glacier located on the eastern flank of the main volcanic cone constituting the island (López-Martínez et al. Reference López-Martínez, Serrano, Rey, Smellie, López-Martínez, Smellie, Thomson and Thomson2000). The distribution of volcanic edifices shows a preferred N060E orientation, which extends both in the submerged area around the island and in the emerged zone, arranged along two parallel lineaments (Fig. 10b). The southernmost lineament extends from the western sector of Bransfield Basin through New Rock Island, reaching Crater Lake, passing through the Stanley Patch volcanic edifice, continuing to Mount Pond and extending once again to the eastern sector of Bransfield Basin. The second lineament is located further north, extending from the western sector of Bransfield Basin, passing along the northern coast of Telefon Bay and continuing through Goddard Hill to the eastern sector of Bransfield Basin. A NW-SE trend is also observed along the crest of Mount Kirkwood, as well as two N-S alignments, one along the eastern coast of Port Foster, from Kroner Lake to Crimson Hill, and the other to the east of Mount Pond crest.
Examples of different well-preserved volcanic edifices on Deception Island: a. volcanic edifice south-east of Crater Lake; b. Crater Lake volcanic edifice; c. volcanic edifice north-west of Crater Lake; d. group of volcanic edifices around Irizar Lake; e. volcanic edifices west of Telefon Bay; and f. volcanic edifice east of Telefon Bay.

Volcano-tectonic earthquakes are caused by shear or tensile fractures during magma movement from depth to the Earth’s surface through conduits and dykes (Zobin Reference Zobin and Meyers2014). These earthquakes occur within and around the volcanic edifice and reflect the interaction of two general geological processes: magma migration towards the surface from the crustal and mantle magmatic reservoirs and tectonic activity in the crust. The alignment of earthquake epicentres helps us to define the trace of the faults that generated them. A total of 1561 epicentres have been located on Deception Island and its nearby surroundings between 1999, 2009–2020 and 2022–2024, as recorded by the Andalusian Institute of Geophysics (University of Granada) and the IGN (Fig. 10c). These earthquakes are of low magnitude, with a maximum value of 3.0 and a modal value of 1.4. Due to their low magnitude and the fact that a one-dimensional velocity model was used to determine their depth, there is significant uncertainty in their depth estimation, with most hypocentres being shallow, located within the first 3 km of the crust. The epicentres are widely distributed across the island, but they are primarily concentrated along an axis running mainly west to east across the island from Fumarole Bay to Mount Pond, with an orientation of N070E (Fig. 10c).
Discussion
Correlation between the lineaments identified by various authors
Looking at the set of analysed pairs of variables corresponding to the directions defined by the various authors studied, only 10% show very strong correlation values. Considering the studies with a very strong correlation value (Martí et al. Reference Martí, Baraldo and Rey1990, Reference Martí, Geyer and Aguirre-Diaz2013, Baraldo Reference Baraldo1999, Paredes et al. Reference Paredes, De la Vega, Pérez-López, Giner-Robles and Martínez-Díaz2007, Dunaev et al. Reference Dunaev, Bryantseva and Kuznetsov2021), it can be determined that these authors relied on similar morphological features to establish the lineaments. They coincided in the methods and approaches used in their analyses, as morphometric data obtained from topographical analysis and aerial and satellite image processing predominated over field-based mapping of tectonic structures. The cases studied that present a strong to moderate correlation suggest a general tendency in which certain lineament directions tend to correlate due to their similarity; however, not all defined orientations show such similarity. It is especially noteworthy that the lineament directions defined by Birkenmajer (Reference Birkenmajer1992) do not correlate with the lineaments mapped by the other authors, as almost all correlation values obtained were negative (Table I). This may suggest that this study takes a very different geological approach or analyses different variables from the other studies.
The lineaments mapped by the various authors analysed show, in general, only a low number of very strong correlations. This suggests that there are other factors - not only geological - that influence the directions of the lineaments established by the various authors. These factors include personal interpretation, image resolution (which may limit or affect the perception of geological details), image scale (which affects the amount of visible information), prior knowledge of the geological context of the region and the use of data from previous studies (which can influence how lineaments are interpreted). Finally, there is the issue of the drawing criteria that each interpreter uses to define what constitutes a lineament, which may vary. Some authors may have focused only on observing fractures affecting rock units, whereas others may have included broader features such as lithological variations, coastlines, or lineations of volcanic cones. Other factors such as the environmental conditions of the analysed images (e.g. lighting and shadows) can also affect the perception of terrain features, influencing how lineaments are drawn. Cognitive biases such as prior prejudices or expectations can skew interpretations. The software used for visualization and analysis can also affect interpretation, and aesthetic aspects of the visual representation may influence how lineaments are presented, perhaps due to a prioritization of visual clarity over geological accuracy.
Origin and chronology of fractures in a volcanic setting
Fracture development within and around igneous intrusions is highly complex due to the formation mechanisms of these rocks. Three main types of fractures have been defined that may affect igneous rocks (Senger et al. Reference Senger, Buckley, Chevallier, Fagereng, Galland and Kurz2015): 1) fractures developed by the emplacement of molten rock into the host rock, 2) post-emplacement fractures, affecting the intrusion and developed during the crystallization and rapid cooling process upon exposure, and 3) fractures unrelated to the intrusion, associated with tectonic stresses acting after the consolidation of the igneous rock.
Fractures developed during emplacement, also called ‘inflation fractures’ (Kattenhorn & Schaefer Reference Kattenhorn and Schaefer2008), develop during the intrusion because the magma is over-pressurized when emplaced (Lister & Kerr Reference Lister and Kerr1991, Rubin Reference Rubin1995). This leads to the rupture of the host rock both on a local scale (Delaney & Pollard Reference Delaney and Pollard1981, Delaney et al. Reference Delaney, Pollard, Ziony and McKee1986, Meriaux et al. Reference Meriaux, Lister, Lyakhovsky and Agnon1999, Abdelmalak et al. Reference Abdelmalak, Mourgues, Galland and Bureau2012, Schofield et al. Reference Schofield, Brown, Magee and Stevenson2012, Galland & Scheibert Reference Galland and Scheibert2013) and on a regional scale (Rubin & Pollard Reference Rubin and Pollard1988, Jackson & Pollard Reference Jackson and Pollard1990).
Post-emplacement fractures, also known as ‘cooling fractures’ (Kattenhorn & Schaefer Reference Kattenhorn and Schaefer2008), form in intrusive rock due to thermal contraction during cooling (Hetényi et al. Reference Hetényi, Taisne, Garel, Médard, Bosshard and Mattsson2012). Magma cooling begins at the edges while the interior remains molten, generating stresses capable of creating joints as the rock solidifies. Many of the fracture sets generated under these cooling conditions tend to have a geometric relationship with the lines and planes of magmatic flow and are called ‘primary fracture systems’ (Balk Reference Balk1937). In these cases, some are perpendicular to the flow; others are parallel to the flow planes; others are parallel to the flow planes but perpendicular to the edges of the magmatic body; some are oblique, arranged in shear planes; and, finally, some develop columnar structures.
Lastly, tectonic fractures form due to tectonic forces unrelated to the intrusion. These fractures may affect intrusive rocks (if the tectonic regime is post-emplacement) or the host rock (if the tectonic regime acts both before and after the emplacement). The stress field can generate new fracture planes, following a pattern determined by the rock’s rheological properties, or reactivate pre-existing discontinuities, which is extremely common in rocks (Bott Reference Bott1959, Jaeger Reference Jaeger1960). As such discontinuities may adopt any spatial orientation, reactivated fractures do not necessarily form a system aligned with the symmetry of the stress axes.
Additionally, in our study area, the effects of regional-scale fracturing on Deception Island related to the volcanic edifice collapse process, which resulted in the formation of the caldera that defines the island’s current morphology, must be considered. These fractures affect pre-caldera units. Caldera formation may result from crustal bulging due to inflation of a magma chamber or, conversely, from bulging due to deflation of a magma chamber (Holohan et al. Reference Holohan, Troll, Walter, Münn, McDonnell and Shipton2005). Pre-caldera bulging due to chamber inflation generates a subordinate pattern of radial and concentric fractures. Radial fractures are extensional and propagate outward from the dome’s centre, whereas associated concentric fractures initially form as inward-dipping reverse faults, although high stresses at the dome’s summit may cause their reactivation with a normal component (Walter & Troll Reference Walter and Troll2001). If the caldera originates from magma chamber deflation, the subsiding rock mass accommodates along concentric reverse, vertical or outward-dipping faults (Anderson Reference Anderson1936, Komuro Reference Komuro1987, Branney Reference Branney1995, Acocella et al. Reference Acocella, Cifelli and Funiciello2000, Roche et al. Reference Roche, Druitt and Merle2000, Walter & Troll Reference Walter and Troll2001). Radial faults do not form during this collapse. A concentric extension zone forms at the caldera’s periphery and is accommodated by vertical- to inward-dipping normal faults. If preceded by a dome phase, deflation-induced collapse leads to the closure of radial fractures, with possible reverse reactivation of inward-dipping dome-phase faults (Troll et al. Reference Troll, Walter and Schmincke2002).
There are a wide range of fracturing mechanisms that have acted during the evolution of Deception Island and have overlapped throughout the geodynamic evolution of the island. Therefore, it is exceedingly difficult to discriminate between those fractures related to the processes of intrusion, cooling and consolidation from those of tectonic origin or due to the collapse of the volcanic edifice.
The preferred orientation of dykes and sinistral faults analysed in this study is consistent with the orientation of the main extensional structures defined in the Bransfield Basin (Gràcia et al. Reference Gràcia, Canals, Farrán, Prieto, Sorribas and Team1996, Lawver et al. Reference Lawver, Sloan, Barker, Ghidella, Von Herzen and Keller1996, Prieto et al. Reference Prieto, Canals, Ercilla and de Batist1998). In some cases, these structures exhibit a certain sinistral motion component, reflected in the bathymetry, where an en echelon pattern and a slightly sigmoidal shape of the main volcanic ridges are observed. This is also consistent with a slight sinistral deformation component superimposed on the general normal extension of the basin (Gràcia et al. Reference Gràcia, Canals, Farrán, Prieto, Sorribas and Team1996). The preferred direction of the normal and reverse faults could be related to the extrusion mechanisms of volcanic rocks or could result from the collapse of the volcanic edifice. The sinistral and dextral movements of some structures may be related to the reactivation of reverse and normal faults and joints under the current NE-SW compressive stress field (González-Casado et al. Reference González-Casado, Giner-Robles and López-Martínez2000, Maestro et al. Reference Maestro, Somoza, Rey, Martínez-Frías and López-Martínez2007, Reference Maestro, López-Martínez, Galindo-Zaldívar, Bohoyo and Mink2014, Pérez-López et al. Reference Pérez-López, Giner-Robles, Martínez-Díaz, Rodríguez-Pascua, Bejar, Paredes, González-Casado, Cooper, Barrett, Stagg, Storey, Stump and Wise2007, Reference Pérez-López, Giner-Robles, Béjar, Rodríguez-Pascua, Martínez-Díaz, Paredes and González-Casado2008).
Lineations and their relationship with geomorphological features
In general, the delineation of lineaments is somewhat subjective, as has been shown in this study, and the lineament maps analysed differ in some cases from one interpreter to another in aspects such as orientation, location and dimension. Aspects related to the direction of the lineaments have been analysed in previous sections of this paper, both concerning the structural maps published by the various authors considered in this study and their relationship with the fracture data measured in the field. Differences in the location of the lineaments can be explained by considering factors such as the tone, texture and shading of the satellite images, aerial photographs or digital terrain models used for their determination, which may limit how accurately the physical reality is reproduced. Finally, the differences in the length of the drawn lineaments are more difficult to explain considering that, methodologically, the lineaments should be constrained to the area where they are clearly identifiable. Extrapolating their length beyond where they are observed should be avoided, as some of the lineaments analysed in this work, mapped by some authors, even extend to areas where there is no information, being covered by water.
Synthesis of the most frequent lineament directions and their geographical locations based on the analysis of the cartography of the total number of lineaments proposed by the various authors analysed in this study.
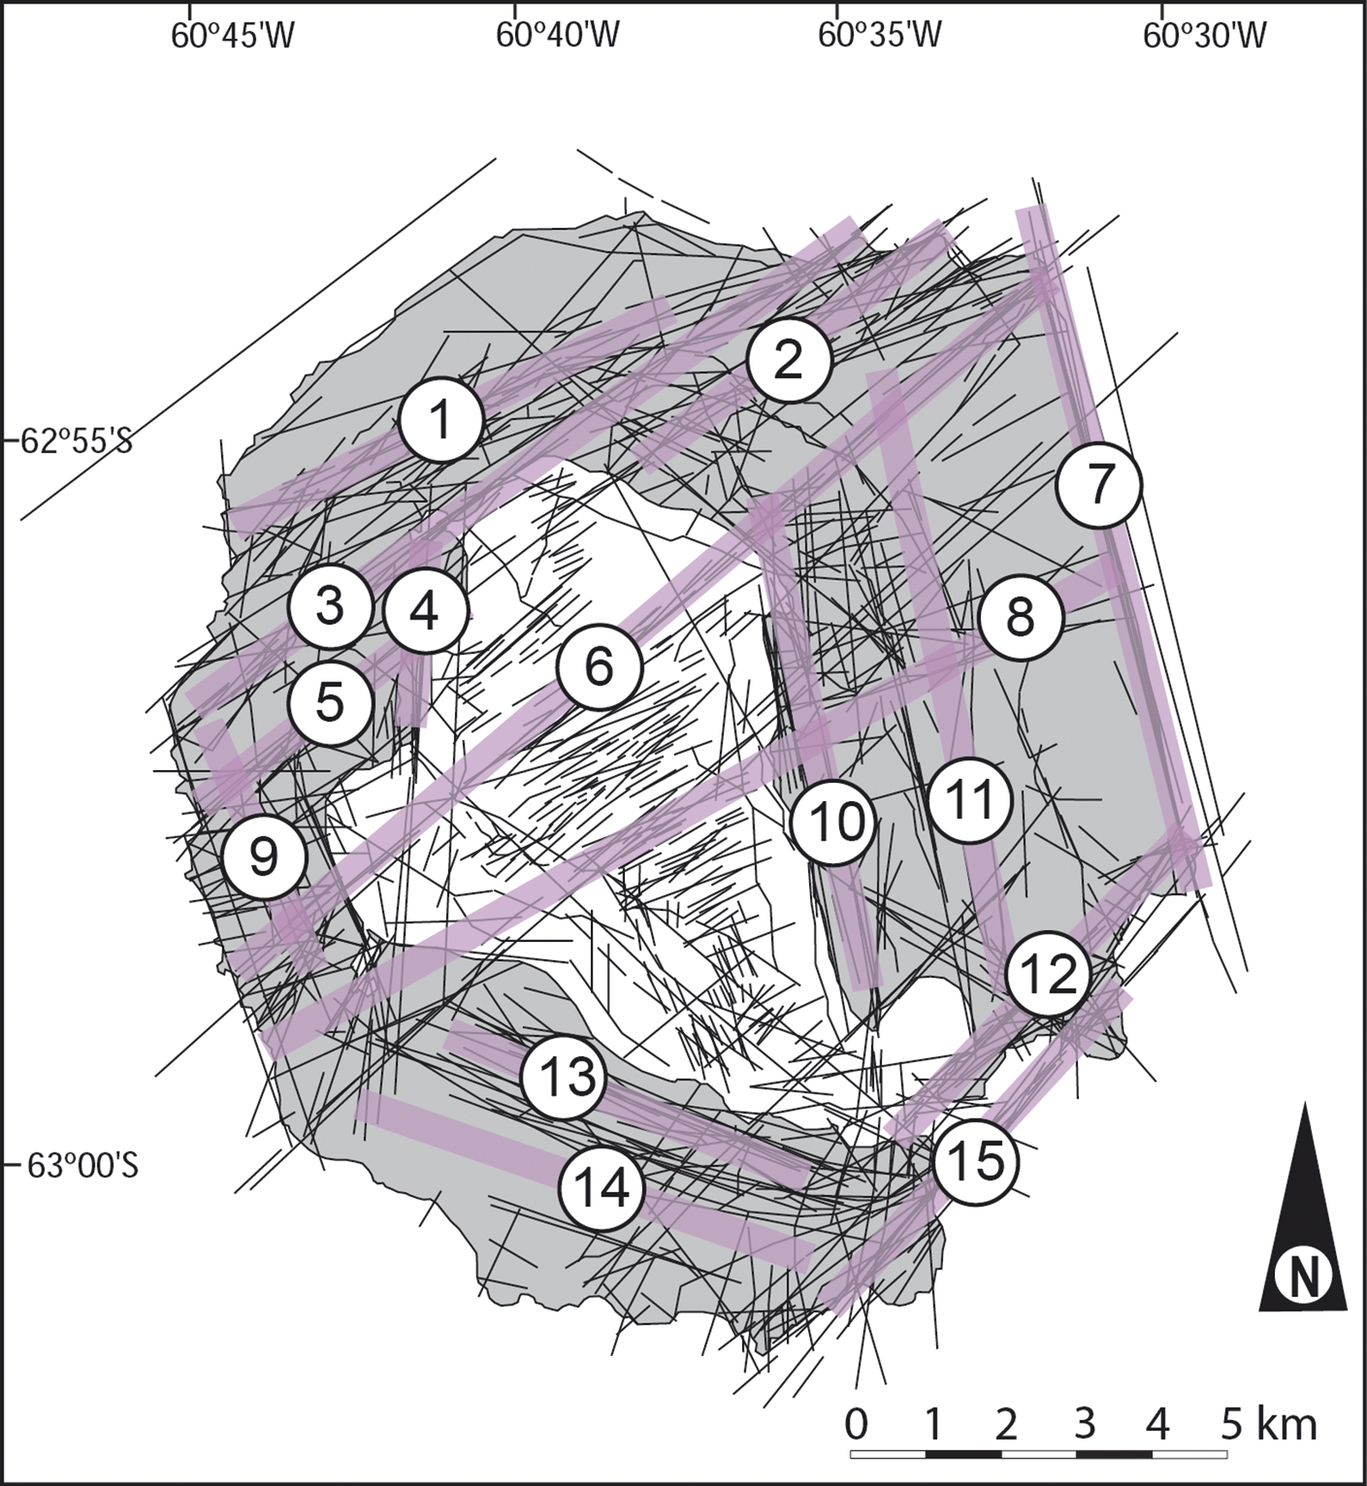
As shown in Fig. 2 and previously discussed, when representing the lineaments identified on Deception Island by the various authors who have mapped them, they generally do not coincide geographically. However, it is possible to identify areas where their density and orientation are very similar, forming bands that, in some cases, can be related to major tectonic or volcanic morphological features. Fifteen linear features with lengths ranging from 3.6 to 14.3 km, which are common to several of the lineament maps studied (Fig. 13), have been identified as follows:
-
• Lineament 1, the eastern sectors of lineaments 2 and 3 and the central part of lineament 6 correlate with faults observed in the field and with major faults detected in high-resolution off-shore seismic records within Port Foster (see Fig. 3; Rey et al. Reference Rey, Somoza, Hernández-Molina and López-Martínez1992, Reference Rey, Maestro, Somoza, Smellie, López-Martínez, Smellie, Thomson and Thomson2002, López-Martínez et al. Reference López-Martínez, Serrano, Rey, Smellie, López-Martínez, Smellie, Thomson and Thomson2000), as well as with one of the main trends defined by the gravimetric and magnetic anomalies described by Navarro et al. (Reference Navarro, Vélez, Camacho and Vieira2002) and Catalán et al. (Reference Catalán, Martos, Galindo-Zaldívar and Funaki2014) (Fig. 4), respectively. Furthermore, the main trends of the thermal anomalies are both on the emerged part of Deception Island and within Port Foster (López-Martínez et al. Reference López-Martínez, Ramos, Criado, Serrano and Nicolás1996, Reference López-Martínez, Serrano, Rey, Smellie, López-Martínez, Smellie, Thomson and Thomson2000, Somoza et al. Reference Somoza, Martinez-Frías, Smellie, Rey and Maestro2004) (Fig. 8a), as well as regarding the distribution of Ba- and As-enriched sediments in Port Foster (Rey et al. Reference Rey, Somoza, Martinez-Frías, Benito, Martín-Alfageme, Nicholson, Hein, Biihn and Dasgupta1997, Reference Rey, Maestro, Somoza, Smellie, López-Martínez, Smellie, Thomson and Thomson2002, Somoza et al. Reference Somoza, Martinez-Frías, Smellie, Rey and Maestro2004). These lineaments have a NE-SW orientation and lengths ranging from 5.2 to 14.3 km.
-
• Lineament 4 is related to the orientation of a gravimetric anomaly identified by Carbó et al. (Reference Carbó, Muñoz-Martín, Dávila, Catalán and García2001) and Muñoz-Martín et al. (Reference Muñoz-Martín, Catalán, Martín-Dávila and Carbó2005) (Fig. 4a) and to one of the trends of thermal anomalies and volcanic edifices that extends from Murature Point to Cross Hill (Fig. 8a,b; López-Martínez et al. Reference López-Martínez, Serrano, Rey, Smellie, López-Martínez, Smellie, Thomson and Thomson2000). It has a NNE-SSW orientation and a length of 2.5 km.
-
• The central and western sectors of lineament 3 and lineaments 5, 8, 10 and 13 are associated with the orientation of a magnetic anomaly identified by Muñoz-Martín et al. (Reference Muñoz-Martín, Catalán, Martín-Dávila and Carbó2005) (Fig. 4b), with the tectonic structures inferred from AMS tilt values, which imply tilting of the units (Fig. 4c; Pueyo et al. Reference Pueyo, Gil Imaz, Gil-Peña, Maestro, Galindo-Zaldívar and López-Martínez2014), and with the distribution of volcanic edifices described on Deception Island on both the emerged and submerged parts (Fig. 8b; López-Martínez et al. Reference López-Martínez, Serrano, Rey, Smellie, López-Martínez, Smellie, Thomson and Thomson2000). Their orientations are NE-SW (lineaments 3, 5 and 8), NNW-SSE (lineament 10) and NE-SW (lineament 13), with lengths ranging from 4.4 to 13.1 km.
-
• Lineaments 1, 9, 11 and 14, the western sector of lineament 12 and the central sector of lineament 15 correspond to the main divide of Port Foster, which has a subcircular morphology throughout Deception Island and corresponds to the caldera rim (Fig. 1). Their dimensions range from 3.6 to 6.5 km.
-
• Lineament 7 is associated with the so-called Costa Recta on the eastern sector of Deception Island (Fig. 1). It has a length of 9.4 km, although the actual length of the coastline is 7.3 km, and it has a NNW-SSE orientation. The linear shape of the Costa Recta has traditionally been explained according to two hypotheses. The first refers to tectonic control (Rey et al. Reference Rey, Somoza, Martinez-Frías, Cacho and Serrat1996, Pérez-López et al. Reference Pérez-López, Fernández-Ibáñez, Martínez-Díaz, Paredes, Giner and Caselli2004, Fernández-Ibáñez et al. Reference Fernández-Ibáñez, Pérez-López, Martínez-Díaz, Paredes, Giner-Robles, Caselli and Ibáñez2005), whereby the rectilinear morphology of this sector is interpreted as the expression of the retreat of a scarp of a submarine fault with a normal component. The second hypothesis highlights the relevance of glacier and littoral dynamics (López-Martínez & Serrano Reference López-Martínez, Serrano, López-Martínez, Smellie, Thomson and Thomson2002), proposing a balance between material supplied by the glacier and that removed by coastal dynamics. Based on existing bathymetric data (see Fig. 8; Barclay et al. Reference Barclay, Wilcock and Ibáñez2009), no morphological features resembling a rectilinear scarp are observed in the submerged part of this sector that could indicate the presence of a normal fault. Furthermore, there is no evidence of the existence of such a fracture in the outcrops located at both ends of the Costa Recta, at Macaroni Point and Baily Head, respectively. On the other hand, if we consider the oceanographical dynamics of the surface currents circulating in the Bransfield Basin, the presence of two currents has been described: the Transitional Zonal Water influenced by the Bellingshausen Sea and the Transitional Zonal Water influenced by the Weddell Sea (Tokarczyk Reference Tokarczyk1987, García et al. Reference Garcıa, López, Sospedra, Espino, Gràcia and Morrison1994). The Transitional Zonal Water influenced by the Bellingshausen Sea occupies the northern part of the basin and propagates north-eastwards along the South Shetland Islands and passes south of Deception Island. Frey et al. (Reference Frey, Krechik, Gordey, Gladyshev, Churin, Drozd and Osadchiev2023) identified the inflow of water between Deception and Livingston islands, coming from the Transitional Zonal Water influenced by the Bellingshausen Sea, which circulates parallel to the Costa Recta. Therefore, as proposed by López-Martínez & Serrano (Reference López-Martínez, Serrano, López-Martínez, Smellie, Thomson and Thomson2002), a probable explanation for this is that the linear shape of the Costa Recta results from a combination of glacier protection by two headlands resistant to erosion and marine erosion at the glacier front, rather than being a feature of tectonic origin.
-
• Lineament 8 is associated with the main structural trend where a significant number of epicentres are concentrated, as well as with faults observed in high-resolution seismic records obtained within Port Foster (Fig. 3; Rey et al. Reference Rey, Somoza, Hernández-Molina and López-Martínez1992, 2002, López-Martínez et al. Reference López-Martínez, Serrano, Rey, Smellie, López-Martínez, Smellie, Thomson and Thomson2000) and tectonic structures inferred from AMS tilt values, which imply tilting of the units (Fig. 4c; Pueyo et al., Reference Pueyo, Gil Imaz, Gil-Peña, Maestro, Galindo-Zaldívar and López-Martínez2014). It has a NE-SW orientation and a length of 13.1 km.
Lineaments showing evidence of tectonic and volcanic origin
Based on the above information, this study proposes a mapping of lineaments with clear evidence of geological significance, for which we have limited ourselves to identifying those elements that exhibit clear tectonic and/or volcanic control, restricting their length to what has been observed in field studies or inferred from geophysical data. These lineaments, sometimes with a curved morphology, have been grouped into three types: 1) tectonic origin, 2) volcanic origin related to the collapse of the main edifice of Deception Island and the development of the caldera and 3) volcanic origin related to the subsequent evolution of the caldera and the formation of secondary volcanic edifices (Fig. 14).
Proposed mapping of the lineaments on Deception Island based on morphological features clearly related to the tecto-volcanic activity of the island. Four types of morphostructural features have been defined: faults with morphological expression or inferred from indirect information (seismic activity), caldera boundaries and lineaments related to alignments of volcanic edifices, heated ground and fumaroles. Landsat 8 image of 20 February 2020 with 30 m spatial resolution.
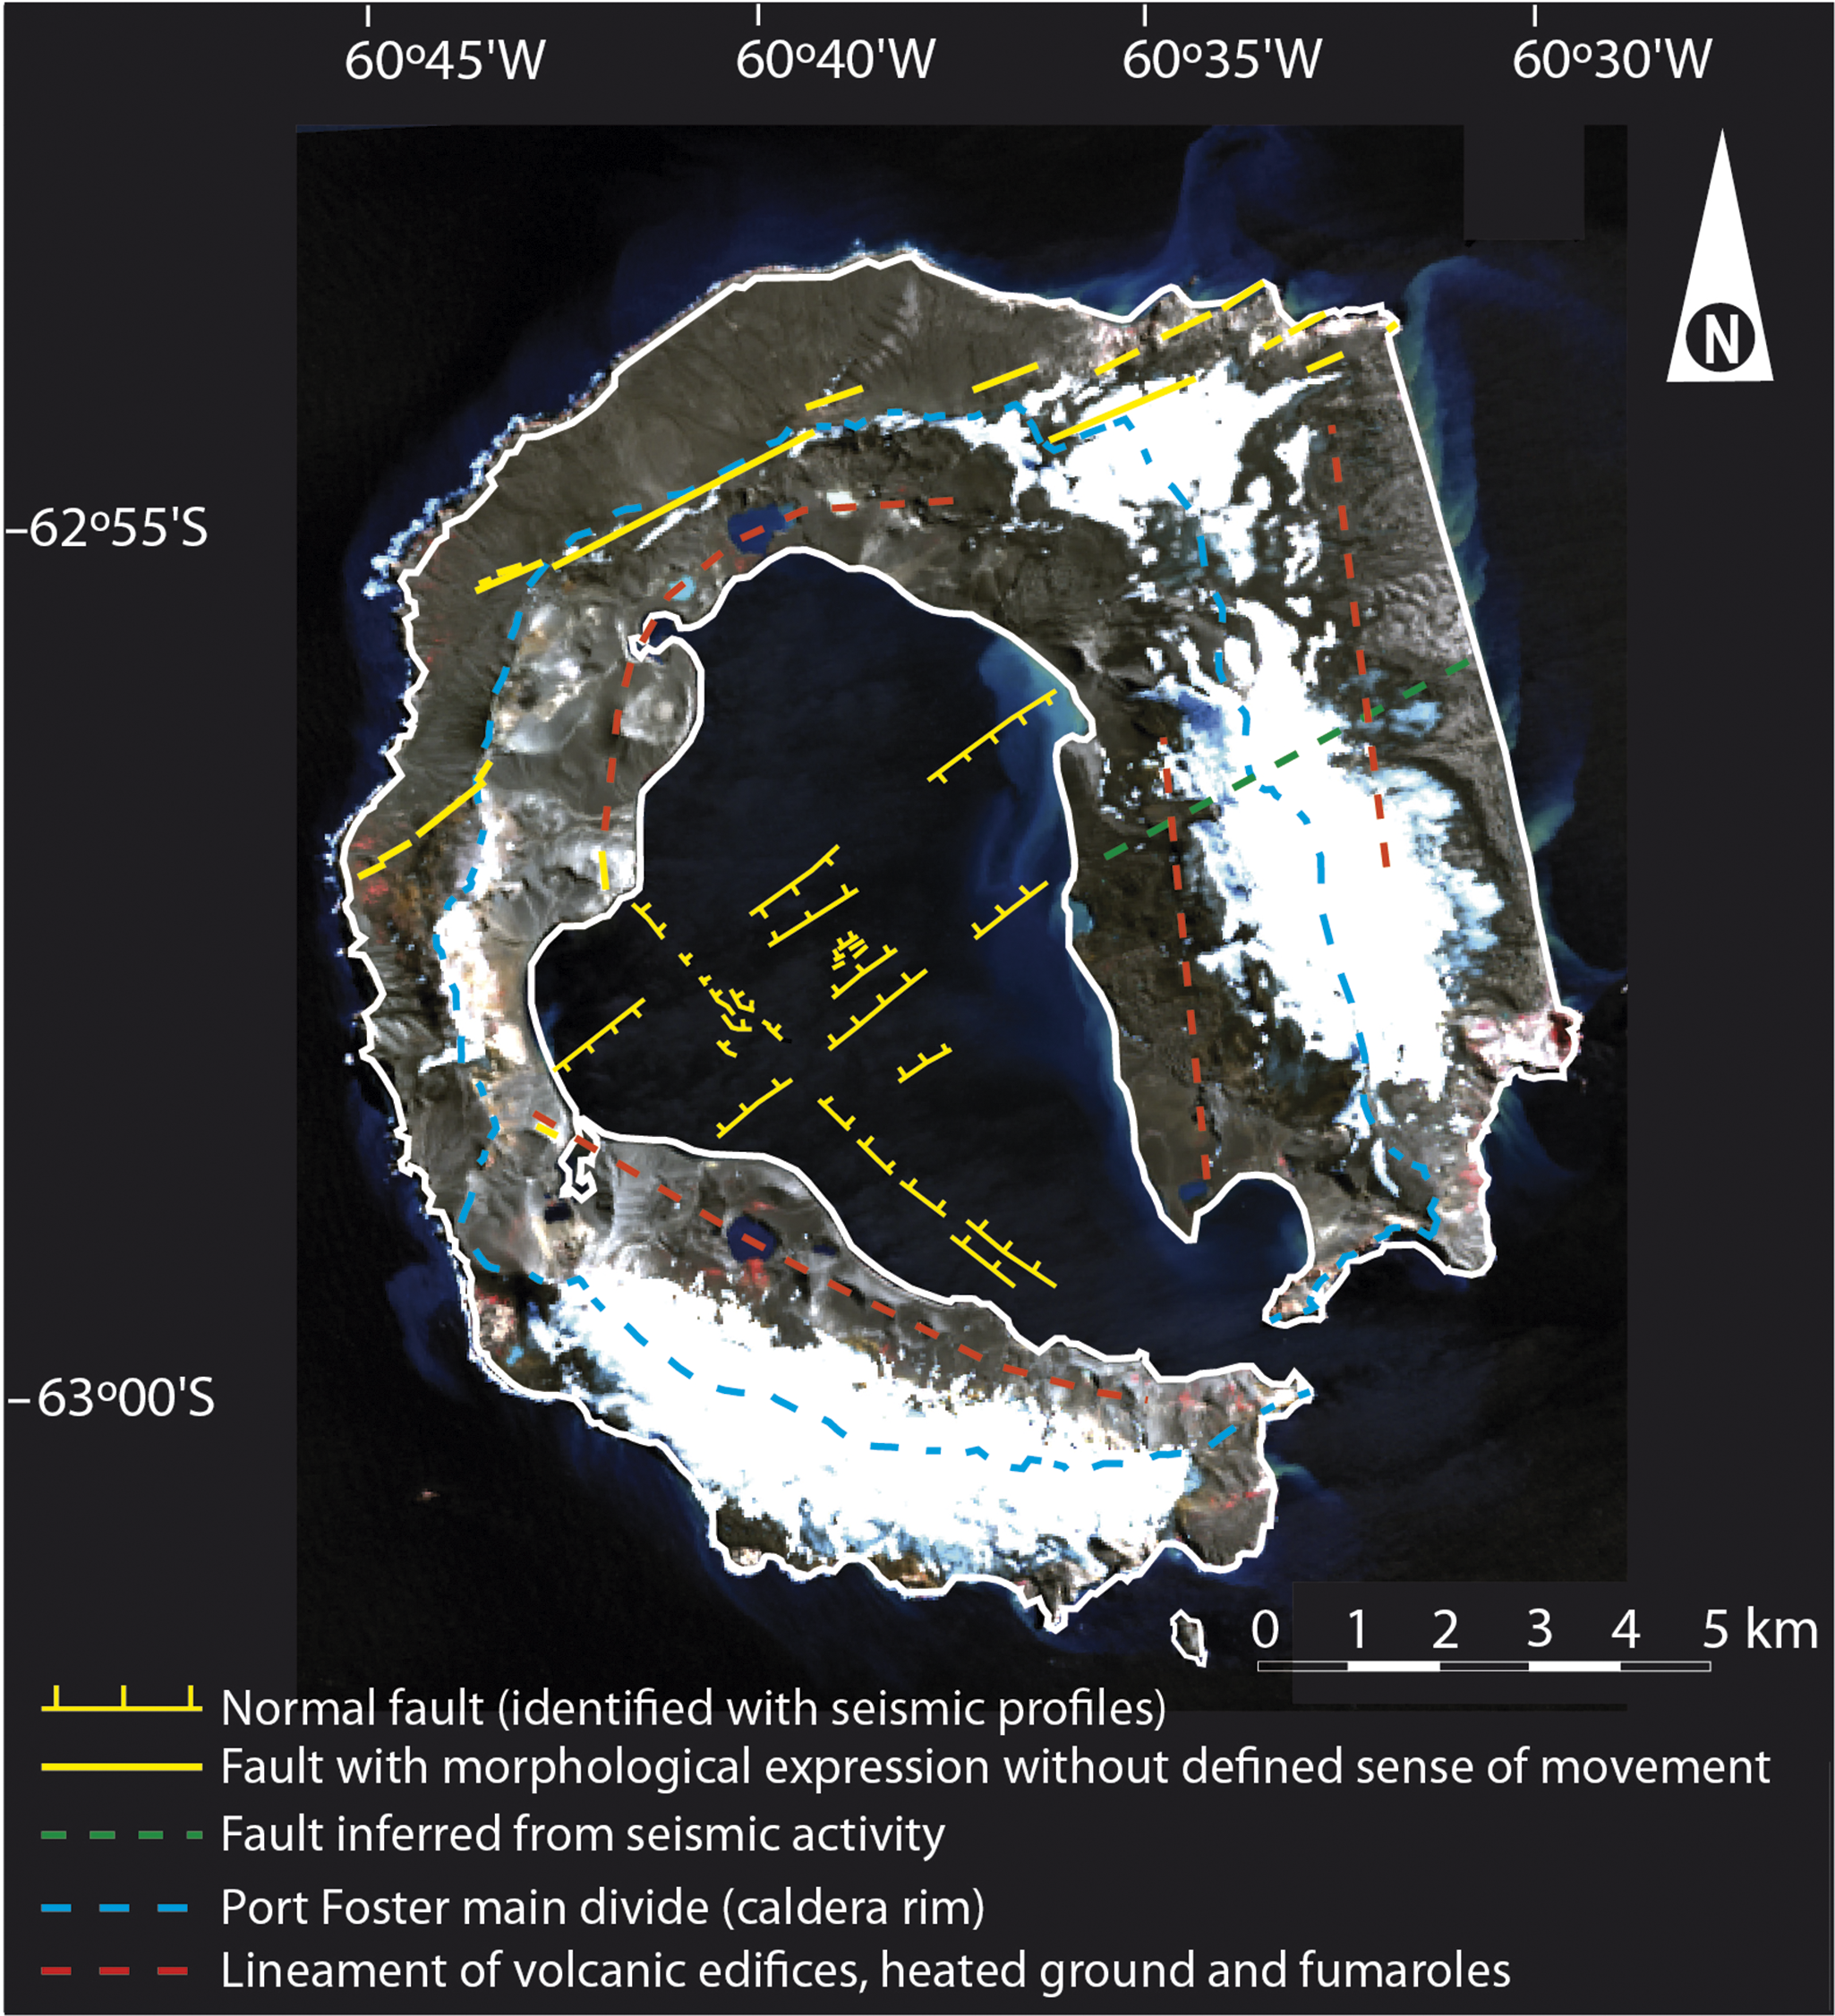
The lineaments of tectonic origin have a NE-SW orientation. They are mainly observed in the central and northern sectors of the emergent part of Deception Island, affecting the deposits that fill Port Foster. Their orientation is clearly related to the main structural trend that shapes the morphology of the Bransfield Basin, whose axis presents an orientation of N055–060E (Gràcia et al. Reference Gràcia, Canals, Farrán, Prieto, Sorribas and Team1996), locally intersected by transverse structures that act as transfer faults (N135–165E; Barker & Austin Reference Barker and Austin1994, Prieto et al. Reference Prieto, Canals, Ercilla and de Batist1998). These NE-SW-trending faults observed in the Bransfield Basin are primarily characterized by normal faulting (Gràcia et al. Reference Gràcia, Canals, Farrán, Prieto, Sorribas and Team1996), as evidenced by high-resolution seismic profiles in Port Foster (López-Martínez et al. Reference López-Martínez, Serrano, Rey, Smellie, López-Martínez, Smellie, Thomson and Thomson2000, Rey et al. Reference Rey, Maestro, Somoza, Smellie, López-Martínez, Smellie, Thomson and Thomson2002). However, considering the slightly sigmoidal shape of the main volcanic ridges east of Deception Island and the presence of small pull-apart basins, a minor component of left-lateral strike-slip deformation, superimposed on the general extensional regime of the basin, is also consistent (Gràcia et al. Reference Gràcia, Canals, Farrán, Prieto, Sorribas and Team1996). This left-lateral strike-slip component is manifested in the stepped morphology of the coastline observed in the north-eastern sector of Deception Island, around Macaroni Point, as well as in the areas of Goddard Hill and Mount Pond, where the trace of the Port Foster main divide is offset left laterally (Fig. 14; López-Martínez et al. Reference López-Martínez, Serrano, Rey, Smellie, López-Martínez, Smellie, Thomson and Thomson2000).
The boundary of the caldera structure, which developed following the collapse of the main edifice of Deception Island, defines a ring structure surrounding the entire island, marking the Port Foster main divide. This topographical boundary separates the subsided area from the undisturbed volcanic zone. Around this boundary, a series of faults can also be distinguished, distributed concentrically around the caldera boundary, delimiting the collapse in a stepped manner towards the caldera floor, with the flat central area representing the deepest part of Port Foster. These faults delimiting the collapse have served as conduits for magma and hot fluids to reach the surface, leading to the development of secondary volcanic edifices, with recent eruptions dated from the 18th century to 1970 (López-Martínez et al. Reference López-Martínez, Smellie, Thomson and Thomson2002), and areas with fumaroles and heated ground. Three stepped levels produced by the collapse process can be distinguished: 1) the Port Foster main divide, extending along the island’s highest areas, starting at Entrance Point and continuing through Mount Kirkwood, Vapour Col, Stonethrow Ridge, Telefon Ridge, Goddard Hill and Mount Pond and ending at Cathedral Crags, 2) the lineaments where the main secondary volcanic edifices, heated ground and fumaroles are located, extending through Collins Point, Irizar Lake, Fumarole Bay, Punta Murature, Cross Hill and the eastern sector of Telefon Bay and from Crimson Hill to Kroner Lake, and 3) a NW-SE-trending lineament in Port Foster, which is a normal fault with a dip plane towards the north-east, identified from the interpretation of high-resolution seismic profiles (López-Martínez et al. Reference López-Martínez, Serrano, Rey, Smellie, López-Martínez, Smellie, Thomson and Thomson2000, Rey et al. Reference Rey, Somoza, Hernández-Molina and López-Martínez1992, Reference Rey, Maestro, Somoza, Smellie, López-Martínez, Smellie, Thomson and Thomson2002), extending from Collins Point to Punta Murature, where several volcanic edifices have been identified (López-Martínez et al. Reference López-Martínez, Serrano, Rey, Smellie, López-Martínez, Smellie, Thomson and Thomson2000), including the one called Stanley Patch (Hopfenblatt et al. Reference Hopfenblatt, Geyer, Aulinas, Álvarez-Valero, Gisbert and Kereszturi2021).
Final remarks and conclusions
The identification and mapping of the significant morphostructural elements under tectonic and/or volcanic control and being supported by field observations and/or geophysical evidence may help to clarify the different existing proposals and contribute to future research efforts to improve the knowledge of the Deception Island volcano structure.
After a detailed review of the morphostructure of Deception Island based on both existing scientific literature and our own data, we analysed the various lineament maps and schemes created by different authors through the interpretation of aerial photographs, satellite images, digital terrain models and field measurements of brittle structures. Considering their direction and length, the lineaments determined on Deception Island exhibit three preferred directions: NE-SW, ESE-WSW and SSE-NNW. On the other hand, the fractures measured in the field generally show a radial distribution, although there are two preferred directions: NNE-SSW and SE-NW. Regarding the different types of fracture planes, the faults exhibit two preferred directions: NNE-SSW and SE-NW. The normal faults show NNE-SSW, NE-SW and SE-NW directions. The reverse faults exhibit two main orientations, NE-SW and ESE-WNW, and two secondary orientations, E-W and SE-NW. The strike-slip faults show a main N-S orientation, with two secondary orientations, NE-SW and ESE-WNW. The joints exhibit a main orientation, which is NE-SW, with three secondary directions, ENE-WSW, E-W and SE-NW. Finally, the dykes show a NE-SW main direction, with two secondary orientations, ENE-WSW and SE-NW.
This comparative study revealed significant disparities in the results obtained, with substantial differences in the location, direction and extent of the mapped lineaments. These differences may be attributed, among other factors, to subjective biases and the criteria used in personal interpretation, the resolution and scale of the images employed and the prior knowledge of the geological regional context.
Lineament analysis has proven to be a very useful tool for studying tectonic fracturing in many areas. The problem of applying this methodology to volcanic islands is their complex evolution. The growth of volcanic islands is marked by a series of constructive episodes, such as the emplacement of molten rock in the host rock and the processes of crystallization and rapid cooling after exposure, as well as destructive ones, such as large-scale flank collapse, caldera collapse and fluvial and coastal erosion, which makes it difficult to establish a clear relationship between tectonic fracture trends and the identified lineaments. Of course, this uncertainty is solved by carrying out field studies to determine which are the macroscale structures that define the lineaments, enabling us to determine their origin. For this purpose, we have used the detailed geological and geomorphological maps of Deception Island published by the British Antarctic Survey, which provide valuable context and help us to interpret the lineaments in relation to tectonic and volcanic structures (López-Martínez et al. Reference López-Martínez, Serrano, Rey, Smellie, López-Martínez, Smellie, Thomson and Thomson2000, Smellie & López-Martínez Reference Smellie, López-Martínez, López-Martínez, Smellie, Thomson and Thomson2000).
Taking both factors into account and acknowledging that the previously existing lineament maps have often been used by other researchers in their work and served as the basis for their conclusions, we propose the coherency morphostructural map of Fig. 14, which represents elements with clear evidence of origin due to tecto-volcanic processes, based both on field observations and geophysical data. This morphostructural map shows the main lineaments, which generally show as straight lines but sometimes have a curved morphology, which are related to:
-
i) Tectonic origin, with NE-SW and SE-NW orientation. The NE-SW-orientated lineaments correlate with the normal faults observed in the high-resolution seismic profiles obtained at Port Foster and with the one described in the Bransfield Basin, where it has been observed that they occasionally present a minor component of left-lateral strike-slip deformation. The SE-NW-orientated lineaments can be correlated with transverse structures described in the Bransfield Basin that act as transfer faults.
-
ii) Volcanic origin related to the collapse of Deception Island’s main edifice and the development of the caldera, defining a ring structure surrounding the entire island, marking the Port Foster main divide and a series of faults distributed concentrically, which have served as conduits for magma and hot fluids to reach the surface.
-
iii) Volcanic origin associated with the subsequent evolution of the caldera, including the formation of secondary volcanic edifices, some of them from eruptions in historical times, the presence of thermal anomalies related to heated ground and fumaroles and a NW-SE-trending lineament in Port Foster, which is a normal fault with a dip plane towards the north-east, identified from the interpretation of high-resolution seismic profiles.
Acknowledgements
We thank E. Carmona and J. Almendros (IAG, University of Granada) and R. Abella (IGN, Madrid) for providing some geophysical data and J. Galindo and A. Pedrera for their insightful comments that helped to improve the quality of this paper. This work represents a contribution to the CSIC PTI, Polar Zone Observatory (PTI-POLARCSIC).
Financial support
This work has been funded in the framework of the Spanish Ministry of Science, Innovation and Universities projects TEMPERATE (PID2021-126495NB-C32) and GEOCHEM (PID2021-125778OB-I00).
Competing interests
The authors declare none.
Author contributions
All authors contributed to the design and implementation of the research, to the analysis of the results and to the writing of the manuscript.


 Open access