


1. INTRODUCTION
Glacier surges are short periodic episodes of rapid glacier flow that are driven by internal instabilities and bracketed by longer periods of slow flow (Meier and Post, Reference Meier and Post1969). While much research has focused on understanding surging mechanisms (Meier and Post, Reference Meier and Post1969; Raymond, Reference Raymond1987; Harrison and Post, Reference Harrison and Post2003; Qiu, Reference Qiu2017), surge dynamics are not yet fully understood, partially due to a lack of repeat observations of multiple surge events for the same glacier. In addition, surging behavior varies widely between glaciers, and even for repeat surges of the same glacier (Harrison and others, Reference Harrison, Echelmeyer, Chacho, Raymond and Benedict1994; Björnsson and others, Reference Björnsson, Pálsson, Sigurđsson and Flowers2003).
Although <1% of glaciers worldwide exhibit surge behavior (Sevestre and Benn, Reference Sevestre and Benn2015), Alaska and western Canada are home to 113 confirmed surge-type glaciers, the third highest number after Svalbard and Pamirs (Post, Reference Post1969; Clarke and others, Reference Clarke, Schmok, Ommanney and Collins1986; Kotlyakov and others, Reference Kotlyakov, Williams and Ferrigno2010; Sevestre and Benn, Reference Sevestre and Benn2015). In the Canadian portion of the St. Elias Mountains, ~6.4% of 2356 glaciers are surge-type (Clarke and others, Reference Clarke, Schmok, Ommanney and Collins1986). The Yukon hosts surge-type glaciers with a wide variety of dynamic characteristics, including surge phases of up to several years and 12–50+ year repeat intervals (e.g. Donjek and Lowell Glaciers: Bevington and Copland, Reference Bevington and Copland2014; Abe and others, Reference Abe, Furuya and Sakakibara2016; Steele Glacier: Clarke and others, Reference Clarke, Schmok, Ommanney and Collins1986) and slow surges with surge phases that last several decades and surge speeds <50 m a−1 (e.g. Trapridge Glacier: Clarke and Blake, Reference Clarke and Blake1991; unnamed Glacier: De Paoli and Flowers, Reference De Paoli and Flowers2009). Many of the glaciers in this region are classified as polythermal (Jarvis and Clarke, Reference Jarvis and Clarke1975) and overlay soft basal sediments (Clarke and others, Reference Clarke, Schmok, Ommanney and Collins1986; Harrison and Post, Reference Harrison and Post2003; Crompton and Flowers, Reference Crompton and Flowers2016; Crompton and others, Reference Crompton, Flowers and Stead2018). Both these aspects have been suggested to be conducive to surge behavior (Hamilton and Dowdeswell, Reference Hamilton and Dowdeswell1996; Jiskoot and others, Reference Jiskoot, Murray and Boyle2000; Truffer and others, Reference Truffer, Harrison and Echelmeyer2000). Glaciers with polythermal regimes typically exhibit slower surge development with lower peak velocities and longer surge intervals than their temperate counterparts (Clarke and Collins, Reference Clarke and Collins1984; Murray and others, Reference Murray, Strozzi, Luckman, Jiskoot and Christakos2003; Frappé and Clarke, Reference Frappé and Clarke2007). Therefore, fewer repeat surge events have been observed for polythermal glaciers, limiting the understanding of surge mechanisms and initiation triggers (Murray and others, Reference Murray, Strozzi, Luckman, Jiskoot and Christakos2003; Bevington and Copland, Reference Bevington and Copland2014), structural development, speed-up magnitudes and advance patterns (Jiskoot and others, Reference Jiskoot, Pedersen and Murray2001; King and others, Reference King, Hambrey, Irvine-Fynn and Holt2015; Quincey and others, Reference Quincey, Glasser, Cook and Luckman2015; Herreid and Truffer, Reference Herreid and Truffer2016), glacial land system development (Schomacker and others, Reference Schomacker, Benediktsson and Ingólfsson2014) and climate controls on surging (Eisen and other, Reference Eisen, Harrison and Raymond2001; Jiskoot and Juhlin, Reference Jiskoot and Juhlin2009; Flowers and others, Reference Flowers, Roux, Pimentel and Schoof2011).
Surges are thought to initiate when a buildup of ice in a reservoir zone steepens the local surface slope at the dynamic balance line, or the location through which mass moves to the receiving zone but experiences no net elevation change (Dolgoushin and Osipova, Reference Dolgoushin and Osipova1975), until it reaches a critical basal shear stress. When the slope-steepening increases the gravitational driving stress above the critical basal shear stress, the subglacial hydrologic system rapidly evolves and surging occurs (Meier and Post, Reference Meier and Post1969; Raymond, Reference Raymond1987). In the classic surge cycle a surge will propagate down glacier from a reservoir zone where mass has built-up (Meier and Post, Reference Meier and Post1969). This type of surging has been observed at several surge-type glaciers in Yukon-Alaska, including Bering (Roush and others, Reference Roush, Lingle, Guritz and Fatland2003), Trapridge (Clarke and others, Reference Clarke and Collins1984; Frappé and Clarke, Reference Frappé and Clarke2007) and Variegated (Kamb and others, Reference Kamb1985) Glaciers, as well various glaciers in Svalbard (Murray and others, Reference Murray, Dowdeswell, Drewry and Frearson1998, Reference Murray2000; Dowdeswell and Benham, Reference Dowdeswell and Benham2003; Sund and others, Reference Sund, Eiken, Hagen and Kääb2009; Mansell and others, Reference Mansell, Luckman and Murray2012), East Greenland (Jiskoot and Juhlin, Reference Jiskoot and Juhlin2009) and the Karakoram (Quincey and others, Reference Quincey, Glasser, Cook and Luckman2015). However, some tidewater glacier surges in Svalbard have been observed to propagate up-glacier (Rolstad and others, Reference Rolstad, Amlien, Hagen and Lundén1997; Luckman and others, Reference Luckman, Murray and Strozzi2002; Dowdeswell and Benham, Reference Dowdeswell and Benham2003; Murray and others, Reference Murray, Strozzi, Luckman, Jiskoot and Christakos2003; Dunse and others, Reference Dunse2015; Flink and others, Reference Flink2015; Sevestre and others, Reference Sevestre2018). Up-glacier surge propagation has been observed elsewhere as well, including at Sabche Glacier, Nepal (Lovell and others, Reference Lovell, Carr and Stokes2018). Both up- and down-glacier surge propagation has also been observed, such as at Sortebræ in Greenland (Murray and others, Reference Murray, Strozzi, Luckman, Pritchard and Jiskoot2002).
Mass redistribution through increased ice flow is a key characteristic of surging (Meier and Post, Reference Meier and Post1969). Surge events cause a short-term redistribution of mass from the reservoir zone, across the dynamic balance line (Dolgoushin and Osipova, Reference Dolgoushin and Osipova1975), into the receiving zone (Meier and Post, Reference Meier and Post1969). Long-term changes in climate and associated glacier mass balance can cause glaciers to either become or cease to be of surge-type, or alter the number of surges within a region (Dowdeswell and others, Reference Dowdeswell, Hodgkins, Nuttall, Hagen and Hamilton1995; Copland and others, Reference Copland2011) or the individual glacier surge recurrence interval (Eisen and others, Reference Eisen, Harrison and Raymond2001). As such, it is critical that the mass balance of glaciers prior to and during surge events and the location of the dynamic balance line with respect to the equilibrium line altitude are well understood.
To better understand mechanisms of and controls on glacier surging, we reconstruct all surge events of Donjek Glacier from 1935 to present using aerial photography and satellite image archives. The primary goal of this analysis is to test the hypothesis by Abe and others (Reference Abe, Furuya and Sakakibara2016) that a valley constriction ~20 km from the terminus controls the surging of the glacier by causing ice to locally thicken. For this purpose, we measure long-term changes in terminus position, surface velocity, ice elevation and surface slope, and temporally constrain the velocity patterns before, during, and after surge events in 2000–2002 and 2012–2014. These measurements provide information concerning the drivers of surge initiation and termination and enable the quantification of mass movement during surge events. Finally, we compare the surge kinematics, including the dynamic balance line location, reservoir and receiving zone length, and elevation change, to other glaciers around the world.
2. STUDY REGION
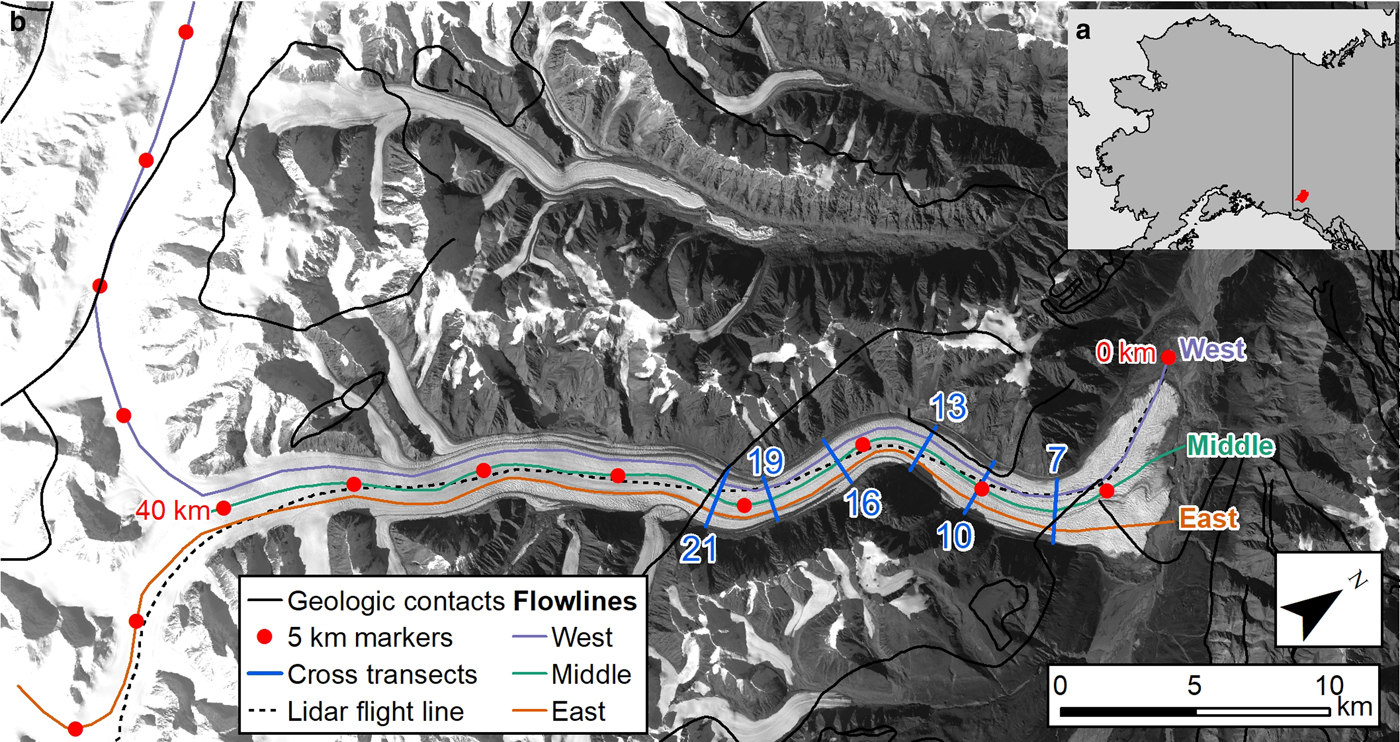
Donjek Glacier (61°11′14″ N, 139°31′30″ W; Fig. 1) is located in the St. Elias Mountains of southwest Yukon. In 2010, the glacier was 65 km long and had an area of 448 km2 (RGI Consortium, 2017). Using a WorldView digital elevation model (DEM) from 2013 and the RGI outline, we find that the glacier surface elevations range from ~1000 m a.s.l. at the terminus to 4507 m a.s.l. at the peak of Mount Walsh. In the 21st century the late-summer snowline has gradually increased in elevation from ~2430 m a.s.l. in 2004 to ~2550 m a.s.l. in 2017, as measured in repeat Landsat imagery. Larsen and others (Reference Larsen2015) found that Donjek Glacier had an area-averaged negative mass balance of −0.29 m w.e. a−1, or −0.13 Gt a−1, between May 2000 and May 2012.
Donjek Glacier flowlines and location (61°11′ N, 139°32′ W). (a) Donjek location in southern Yukon, Canada indicated in red. (b) Tributary flowlines for the west (purple line), middle (green line) and east (orange line). We show the LiDAR flight line flown by Operation IceBridge (black dashed line), glacier transects (blue lines), geologic contacts (Yukon Geological Survey, 2018; black solid line) and 5 km markers (red dots). In 2017, the snowline was located at the 40 km marker. Base image from 23 September 2017.
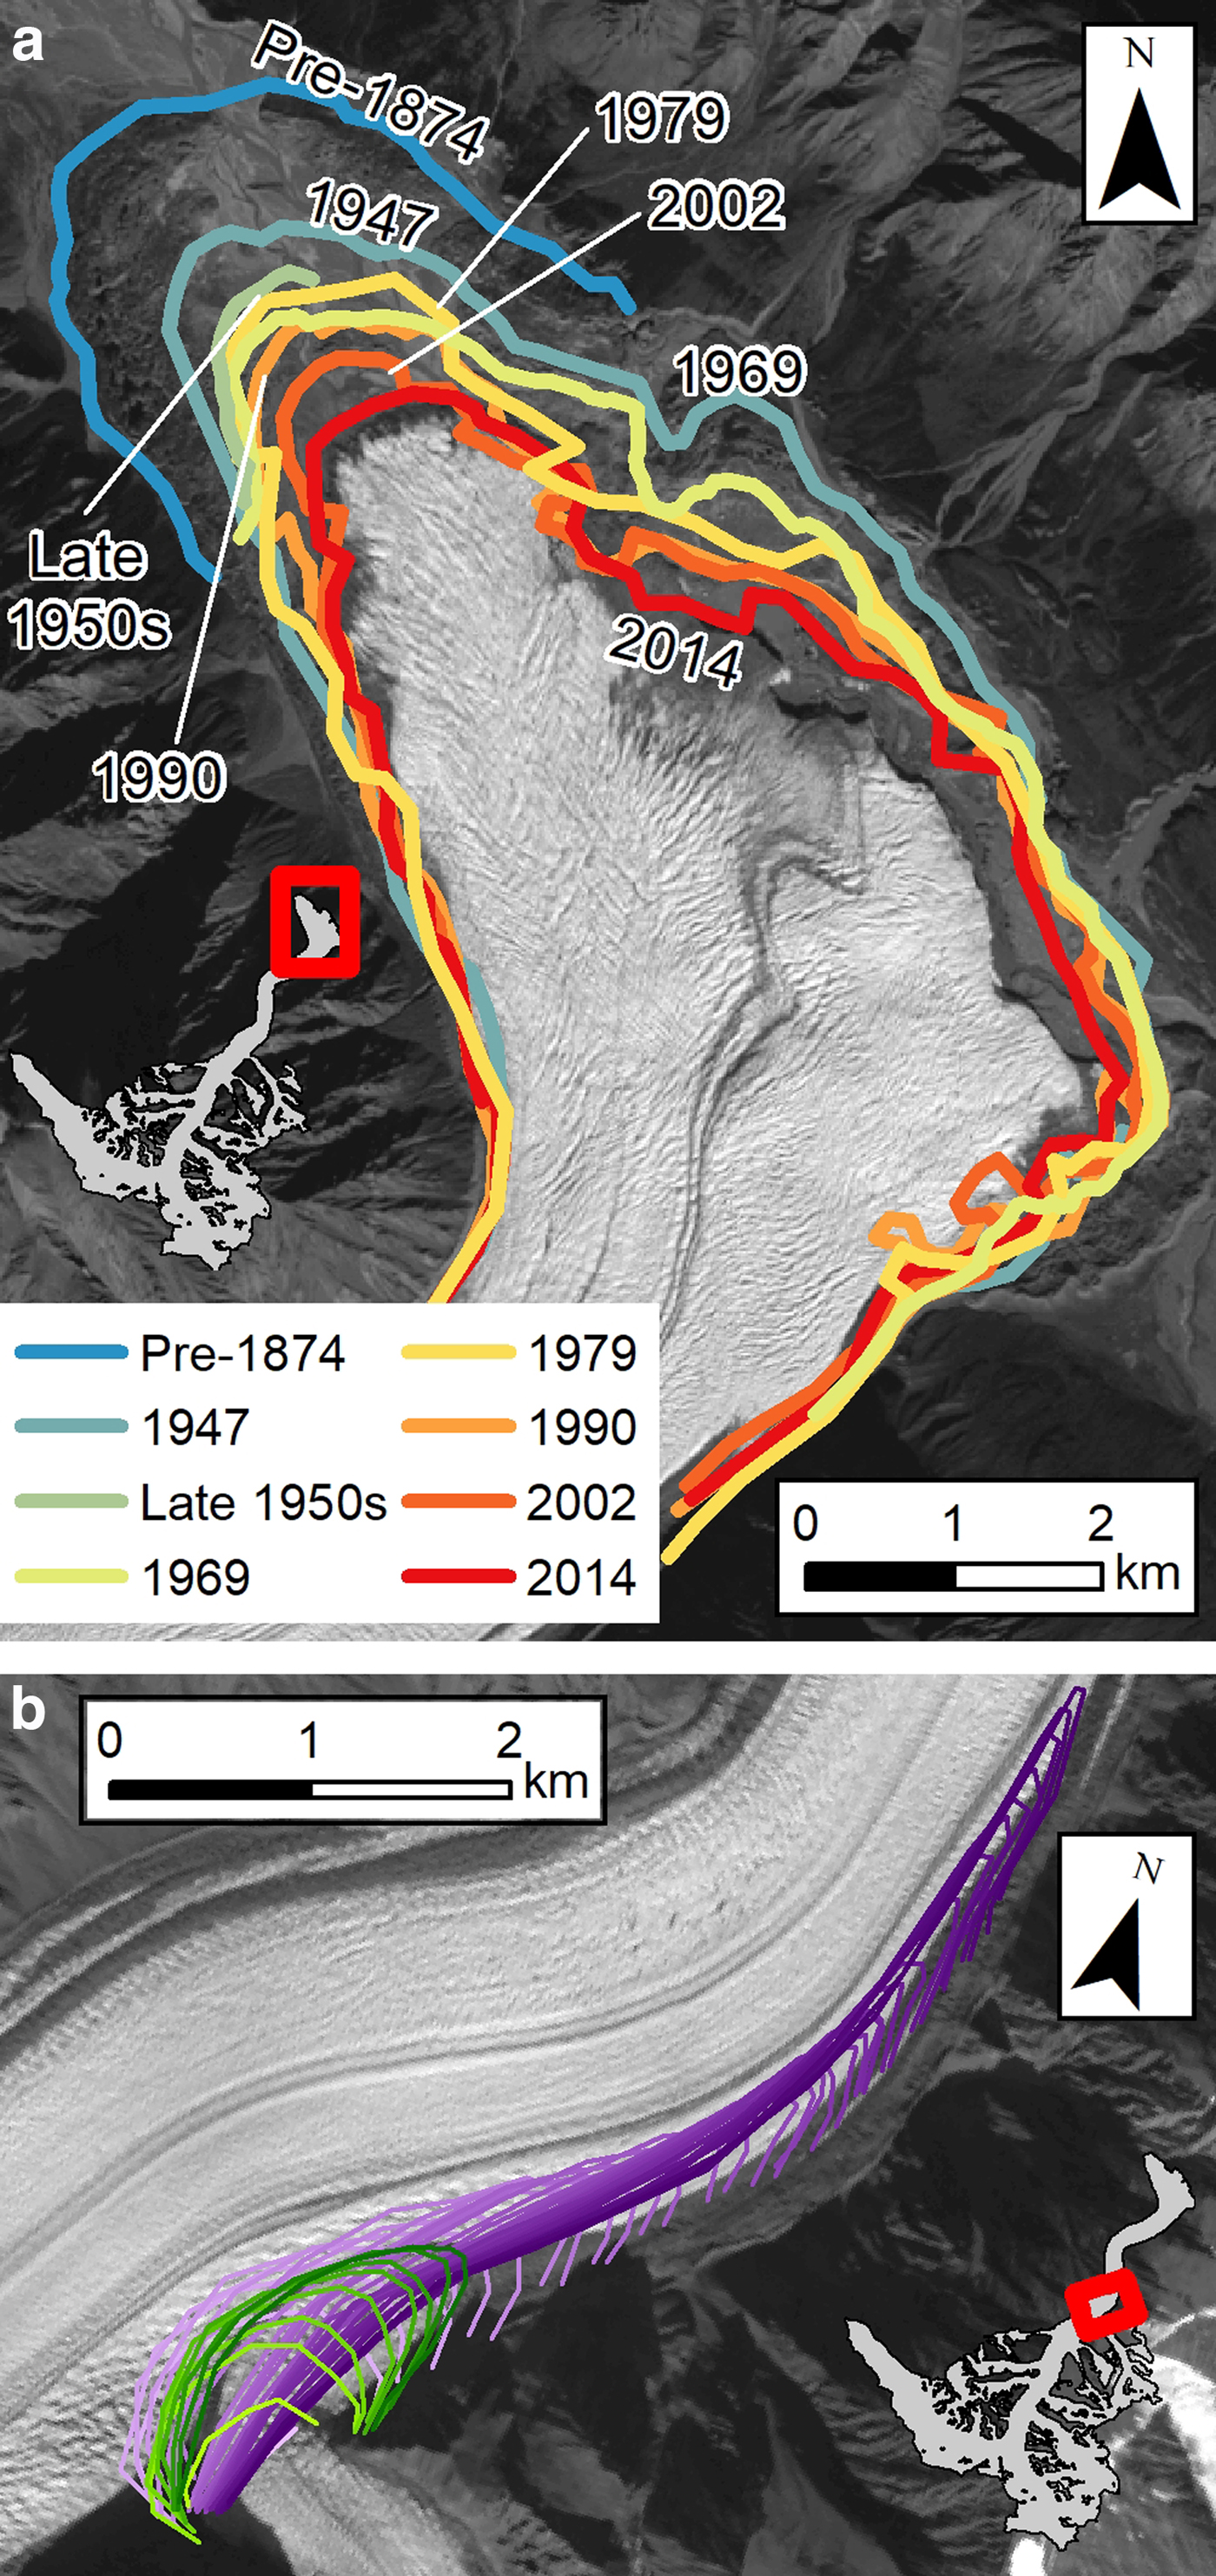
Denton and Stuiver (Reference Denton and Stuiver1966) used C14 age dating to determine that Donjek Glacier receded from Kluane Lake (35 km to the northeast) ~9800 years ago and its youngest major neoglacial advance occurred pre-1874 (Fig. 2). Previous research on Donjek Glacier has recorded six surge events since 1935, namely in 1935, 1978, 1969, 1989, 2001 and 2013 (Denton and Stuiver, Reference Denton and Stuiver1966; Johnson and others, Reference Johnson1972a, Reference Johnson1972b; Clarke and Holdsworth, Reference Clarke, Holdsworth, Williams and Ferrigno2002; Abe and others, Reference Abe, Furuya and Sakakibara2016). Since at least 1874 Donjek Glacier has periodically dammed the Donjek River during surge events, each time culminating in a post-surge outburst flood that endangers downstream infrastructure along the Alaska Highway (Clarke and Mathews, Reference Clarke and Mathews1981). The most recent surge of Donjek, in 2013, caused the terminus to increase in area by nearly 2 km2 and move at a rate of ~3 m d−1 over the lowest 5 km (Abe and others, Reference Abe, Furuya and Sakakibara2016).
Donjek Glacier maximum surge extent. (a) Most advanced terminus position after each surge event from 1847 (little ice age extent; dark blue) to 2014 (dark red). Base image from 23 September 2017 panchromatic band (Landsat 8). (b) Extent of the Donjek Glacier tributary after 1974 (purple) and 2010 (green) surge events. Tributary extent digitized from 1972 (light purple) to 2009 (dark purple) and 2010 (light green) to 2017 (dark green). Base image from 18 May 2017.
3. METHODS
3.1. Maximum surge terminus position mapping
We used aerial photographs and satellite imagery to reconstruct the timing of surge events since 1937 and to digitize past terminus extents (Table 1). Terminus positions were manually mapped from georeferenced images in a geographic information system. Vertical aerial photographs from 1947 were originally acquired by the Royal Canadian Air Force and obtained from the Canadian National Air Photo Library (Ottawa) and Yukon Energy, Mines, and Resources Library (Whitehorse). Vertical and oblique photos from the collections of Bradford Washburn and Austin Post provided coverage from the 1930s and 1960s, respectively (Table 1). We used two WorldView-2 images (Table 1) to manually georectify vertical aerial photographs with at least eight tie points each. The root mean square error of the georectified images ranged from 17.2 to 114 m. We used 99 Landsat 2–8 images from Earth Explorer (https://earthexplorer.usgs.gov) to map terminus position change during surge events from 1977 to 1979, 1988 to 1990, 2000 to 2002 and 2012 to 2014 surge events. Four scenes of the entire Landsat record were used to delineate maximum terminus position after the four most recent surge events (Table 1). We conservatively estimate our maximum uncertainty to be 2 pixel lengths or 120 m for Landsat 2, 60 m for Landsat 5 and 30 m for Landsat 7 and 8.
Aerial photographs and images used for terminus delineation in this study
UAF, University of Alaska Fairbanks Elmer E. Rasmuson Library; Yukon EMR, Yukon Energy, Mines, and Resources Library, Whitehorse; NAPL, National Air Photo Library, Ottawa; ASF, Alaska Satellite Facility; EE, United States Geological Survey Earth Explorer; PGC, Polar Geospatial Center at University of Minnesota.
3.2. Elevation extraction and elevation change mapping
We created or obtained DEMs for 2000 to 2017 from Operation IceBridge (OIB) LiDAR swaths, Satellite Pour l'Observation de la Terre 5 (SPOT-5), WorldView and Advanced Spaceborne Thermal Emissions and Reflection Radiometer (ASTER; Table 2). The LiDAR tracks from 2000, 2012 and 2016 were downloaded from the National Snow and Ice Data Center (https://nsidc.org/icebridge/portal), and down-sampled to 8 m resolution for comparison with other datasets. The 2000 OIB fixed LiDAR flight line deviated slightly from the glacier centerline, so we used the location of this line for comparisons with other swath LiDAR datasets (Fig. 1). The 2000 OIB LiDAR flight made elevation measurements every ~1.75 m beneath the flight path. The 2012 and 2016 OIB datasets cover a swath width of ~500 m perpendicular to the flight path with a spatial resolution of one point per ~0.4 m2. All LiDAR swaths were down-sampled to 8 m resolution for comparison with other datasets. We downloaded one SPOT 5 DEM from the SPIRIT Project (https://theia-landsat.cnes.fr) with an uncertainty of ±6 m (Korona and others, Reference Korona, Berthier, Bernard, Rémy and Thouvenot2009) from 13 September 2007 at 40 m spatial resolution. We obtained 2 m-resolution DEMs derived from WorldView stereo pairs from the University of Minnesota Polar Geospatial Center (PGC), with an estimated 3 m vertical accuracy (Noh and Howat, Reference Noh and Howat2015). We mosaicked the individual WorldView DEMs from 10 August and 27 September 2013 (hereby referred to as the August/September 2013 DEM, down-sampled to 8 m spatial resolution), captured during the 2012–2014 surge event, to create a more spatially extensive DEM of the glacier. These DEM strips do not overlap; thus, we are unable to quantify the potential aliasing of melt and/or glacier flow on the accuracy of these measurements. Finally, we made DEMs from ASTER imagery using the software package MMASTER at 10 m vertical uncertainty and 30 m horizontal resolution for 2001, 2002 and 2003 (Girod and others, Reference Girod, Nuth, Kääb, McNabb and Galland2017). We vertically co-registered SPOT and ASTER DEMs to the WorldView DEMs using overlapping bedrock elevations. All DEMs were then smoothed using a 300 m moving window to better visualize the data without removing large-scale patterns. We assumed that pixel uncertainties are independent (i.e. random error) and there is no systematic bias in the change in height. The area-averaged elevation uncertainties were calculated as  $1.96\sigma /\sqrt {L/C} $ (height change) or $1.96\sigma A/\sqrt {A/C^2} $ (volume change) where σ is the std dev. for on ice measurements. In these equations A is the area of coverage, L is the length of coverage and C is the autocorrelation length (500 m; Howat and others, Reference Howat, Smith, Joughin and Scambos2008; McNabb and others, 2019). We calculated volume change by multiplying the profile average elevation change by the glacier zone area.
Elevation data sources for ice surface change
3.4 Ice velocity mapping
We used Landsat 7 and 8 panchromatic images (Band 8) from Earth Explorer and Radarsat-2 amplitude images to measure glacier velocity (Table 3). After manually inspecting optical images for cloud cover, we used the Ames Stereo Pipeline to cross correlate panchromatic scenes to measure ice displacement (Shean and others, Reference Shean2016) using the Extreme Science and Engineering Discovery Environment computing resources (Towns and others, Reference Towns2014). We used a custom Python script (Derek Mueller, pers. comm.) to convert RADARSAT-2 ultrafine wide (~2.2 m resolution) level-0 raw data to amplitude images. We then processed image pairs acquired in subsequent 24-day orbits using the AMES stereo pipeline (Shean and others, Reference Shean2016). Landsat 1, 2, and 5 scenes were visually assessed using manual feature tracking (e.g. on looped moraines) to observe glacier velocity increase (decrease) at the start (end) of a surge event as automated velocity mapping yielded results with high uncertainties. We correlated every image without major cloud cover for each year, and smoothed the resulting velocity profiles using a moving window of 300 m (Fig. 1). To assess the precision of our measurements, we measured the apparent motion over nonglacierized terrain (i.e. static objects) for each velocity map. First, we discarded values above 1800 m a−1, which we considered indicative of false matches (e.g. due to variations in snow cover), as these exceeded the highest glacier motion measured during the study period. We then computed the mean apparent velocity of the remaining area surrounding Donjek Glacier that is not currently glacierized to obtain uncertainty estimates ranging from 17.0 to 155.1 m a−1 (Table 3).
Landsat (L) 5, 7, 8, and Radarsat-2 (R2) scenes used to determine glacier velocities with associated uncertainty measured by movement of surrounding nonglacierized terrain

Date format is dd/mm/yyyy.
4. RESULTS
4.1. Surge initiation, termination and timing
Surge initiation can be measured by terminus advance, velocity increase, crevasse formation and/or surface elevation change (Meier and Post, Reference Meier and Post1969; Raymond, Reference Raymond1987; Sund and others, Reference Sund, Eiken, Hagen and Kääb2009) each with a different date and uncertainty range. We quantified the surge initiation of Donjek Glacier by the first record of terminus advance or up-glacier velocity increase. Similarly, surge termination was defined by the first terminus retreat or velocity decrease. We consider the terminus to have advanced (retreated) when the glacier area increased (decreased) outside the terminus delineation uncertainty. We are not able to discern why or how the terminus retreated although possible mechanisms include ice melt, increasing debris cover appearing as bedrock or moraine material in satellite imagery, or if ice was melted or carried away by Donjek River. We report uncertainties in surge timing based on velocity and terminus position change where the uncertainty in active or quiescent phase length is due to satellite image availability. Based on our analysis of historical aerial photography and satellite imagery, we independently confirmed that surge events took place during the years ~1935 (Denton and Stuiver, Reference Denton and Stuiver1966), ~late-1950s, ~1969, 1978 (Clarke and Holdsworth, Reference Clarke, Holdsworth, Williams and Ferrigno2002), 1989, 2001 and 2013 (Abe and others, Reference Abe, Furuya and Sakakibara2016).
The 1937 oblique photograph from Bradford Washburn shows glacial morphology consistent with a recent surge, independently confirming an observation of an ~1935 surge event by Johnson and others (Reference Johnson1972a). We additionally observed geomorphology consistent with an active surge phase in 1947 aerial photographs from the Royal Canadian Air Force (e.g. debris-free, advancing margin and small push moraines), suggesting that a surge initiated sometime within 2 years prior to 1947. While Johnson (Reference Johnson1972a) states there was a surge in 1961, examination of glacial geomorphic features (e.g. push moraines) in Austin Post's oblique photographs from 1961 suggest that a surge event had recently occurred but that the glacier was not actively surging at that time.
The 1977–1979 surge event was characterized by an increase in glacier velocity, followed by an active phase of ~2–3 years before the velocity decreased and terminus retreated. The surge initiated when the up-glacier velocity increased between 11 June and 28 July 1977 in the lower 21 km of the glacier (Fig. 3; Table 2). The terminus then began to advance between 28 July and 17 August 1977 (Fig. 3). The terminus began to retreat and the ice velocity returned to quiescent values between 28 August 1979 and 12 May 1980 (Fig. 3; Table 2). The active phase of the 1977–1979 surge therefore lasted 2.08–2.92 years.
Surge timing. Surge characteristics are shown for the 1977–1979, 1988–1990, 2000–2002 and 2012–2014 surge events. Periods of terminus advance (red), when the up-glacier velocity is first observed to increase (medium blue), peak observed velocity (dark blue), when velocity is first observed to decrease (cyan), when the velocity returns to quiescent levels (gray) and terminus retreat (light red) are shown. The temporal width of bars is indicating the temporal uncertainty of the observation, bookended by two satellite observations. Years 1–4 on the x-axis indicate the year of the surge (e.g. year 1 of the 1977–1979 surge event is 1977, year 3 is 1979).
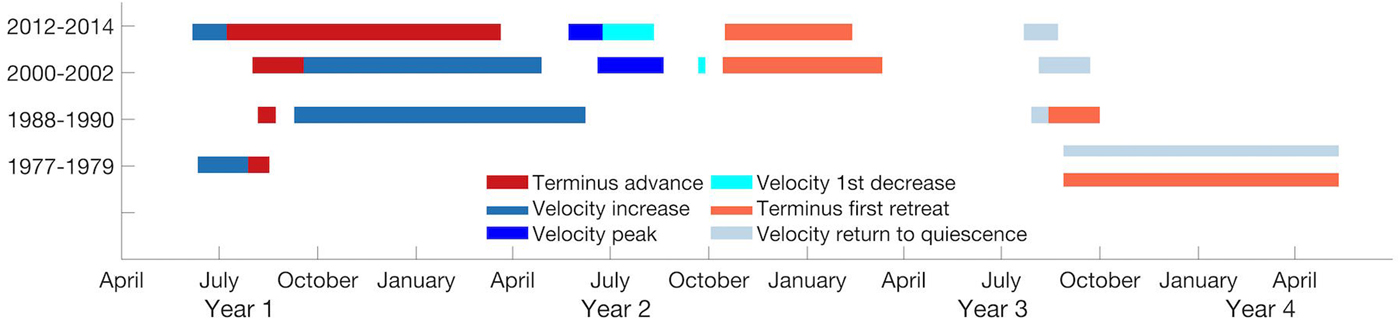
The 1988–1990 surge event started with terminus advance followed by velocity increase up-glacier and an active phase of ~2 years before the velocity decreased and finally the terminus retreated. The event initiated when the terminus began to advance between 6 and 23 August 1988 (Fig. 3; Table 4). The up-glacier velocity began to increase following terminus advance, between 9 September 1988 and 8 June 1989 (Fig. 3). We measured a peak velocity of 850 ± 76 m a−1 between 8 June 1989 and 11 August 1989; however, Landsat images are not available to provide more temporally constrained velocity observations, so we are not confident this was the maximum velocity for the surge event. Velocity measurements from 1988 to 1990 show that the surge event was limited to a velocity increase in the lower 21 km of the glacier. The velocity data suggest the glacier had returned to its quiescent phase between 29 July and 14 August 1990 and the terminus began to retreat between 6 August and 1 October 1990 (Fig. 3; Table 4). The active phase of the 1988–1990 surge therefore lasted 1.97–2.15 years.
Date of transition between active (A) and quiescent (Q) phases for Donjek Glacier, based on changes in terminus position and velocity

Date format is dd/mm/yyyy. Uncertainties in earlier years due to image availability.
The 2000–2002 surge event began with terminus advance followed by an increase in up-glacier velocities and an active phase of ~2 years. The surge ended when the terminus began to retreat then the glacier velocities returned to quiescence. The active phase started with a small advance of the glacier terminus along the middle and eastern segments between 1 August and 18 September 2000 (Fig. 3; Table 4). We first observed up-glacier velocity increase between 18 September 2000 and 28 April 2001 (Figs 3, 4), when the velocity approximately doubled over the entire ~15 km up-glacier from the terminus (Fig. 4). Velocities then increased by an order of magnitude in the lowest 18 km from 16 May to 19 July 2001 compared to quiescence (Figs 3, 4). However, velocities did not peak until 19 July to 20 August 2001 (Figs 3, 4). The 2001 surge termination started with a decrease in ice motion between 21 and 28 September 2001 (Fig. 3). The decrease in velocity was particularly pronounced 8–10 km from the terminus, where velocities decreased by as much as 50% along the middle flowline. We then observed terminus retreat between 14 October 2001 and 23 March 2002 (Fig. 3). However, velocities did not return to quiescent values (<100 m a−1 at the terminus) until 5 August to 22 September 2002 (Figs 3, 4; Table 4). The active phase of the 2000–2002 surge event therefore lasted 1.87–2.14 years (Table 4).
Surge velocity. (a–c) Active surge phase velocity for the east, middle and west flowlines (locations on Fig. 1) during the 2000–2002 surge event. Dates for a–c are given below c. (d–f) Active surge phase velocity for the east, middle and west flowline for the 2012–2014 surge event. Dates for d–f are given below f. Velocity profiles are shown from blue (beginning of surge) to red (end of surge). Extent of the reservoir zone indicted by black dashed lines at 8 and 21 km from the terminus. Dates are presented in the YYYYMMDD format.
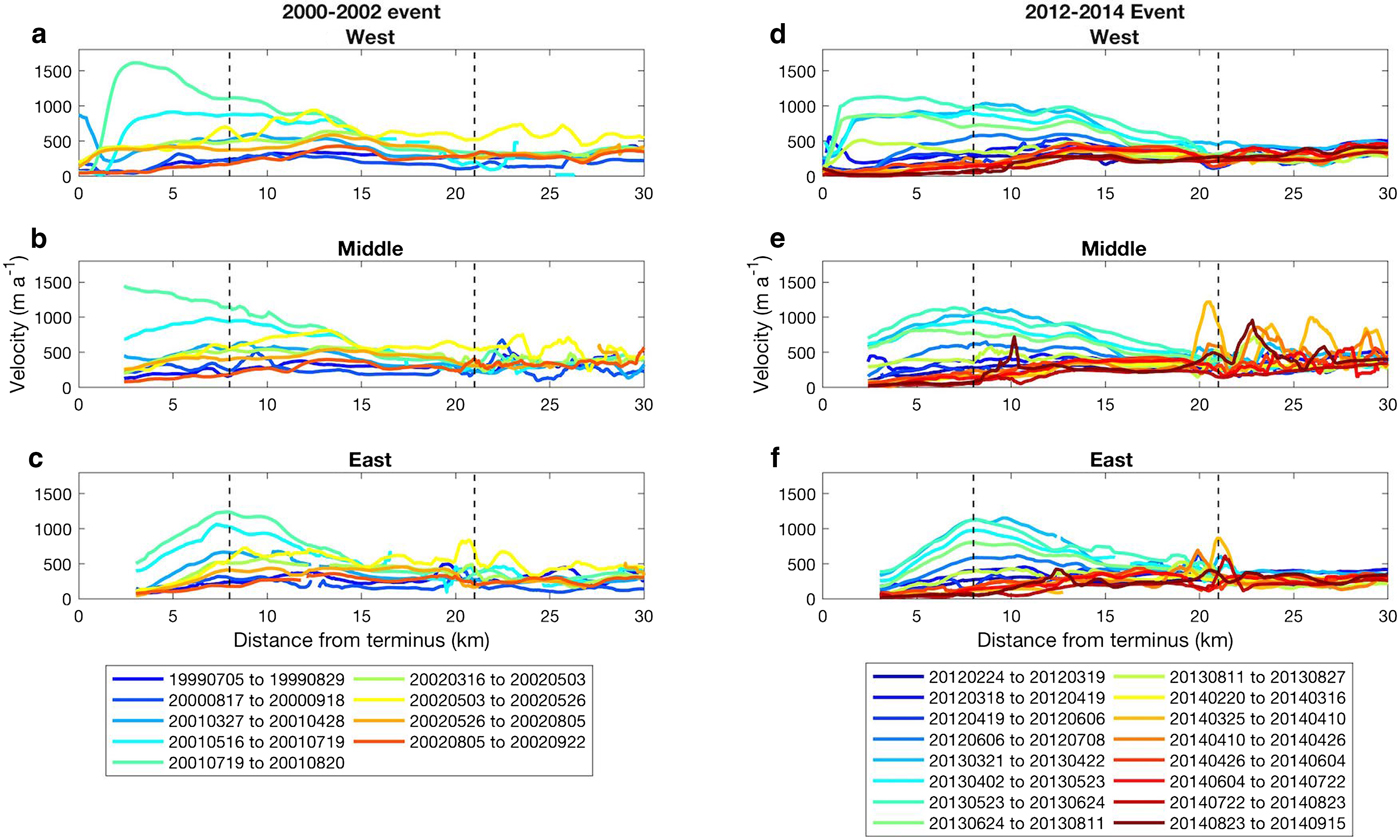
The 2012–2014 surge event initiated when up-glacier glacier velocities increased followed by terminus advance and an active phase of ~1.5 years. This was followed by a decrease in glacier velocities and finally terminus retreat to mark full surge termination. The first indicator of the 2012–2014 surge event occurred between 6 June and 8 July 2012 (Figs 3–5; Table 4) as velocity increased by as much as ~200% within the entire zone up to 15 km from the terminus. The terminus began to advance between 8 July 2012 and 21 March 2013 (Figs 3, 4). However, we did not measure velocities an order of magnitude greater than quiescence until 21 March to 22 April 2013 (Fig. 3). Velocities peaked during the 2012–2014 surge event between 23 May and 24 June 2013 (Figs 3–5). We first observed a decrease in velocity between 24 June and 11 August 2013 in the lowest 21 km of Donjek (Fig. 3). The last period of observed velocities at least an order of magnitude above quiescent velocities was 11 August to 27 August 2013 (Fig. 3). Over the next year, velocity decreased until it returned to a quiescent rate between 22 July and 23 August 2014 (Figs 3–5). We first observed terminus retreat between 16 October 2013 and 12 February 2014 (Fig. 3; Table 4). The active phase of the 2012–2014 surge therefore lasted 1.28–1.69 years (Table 4).
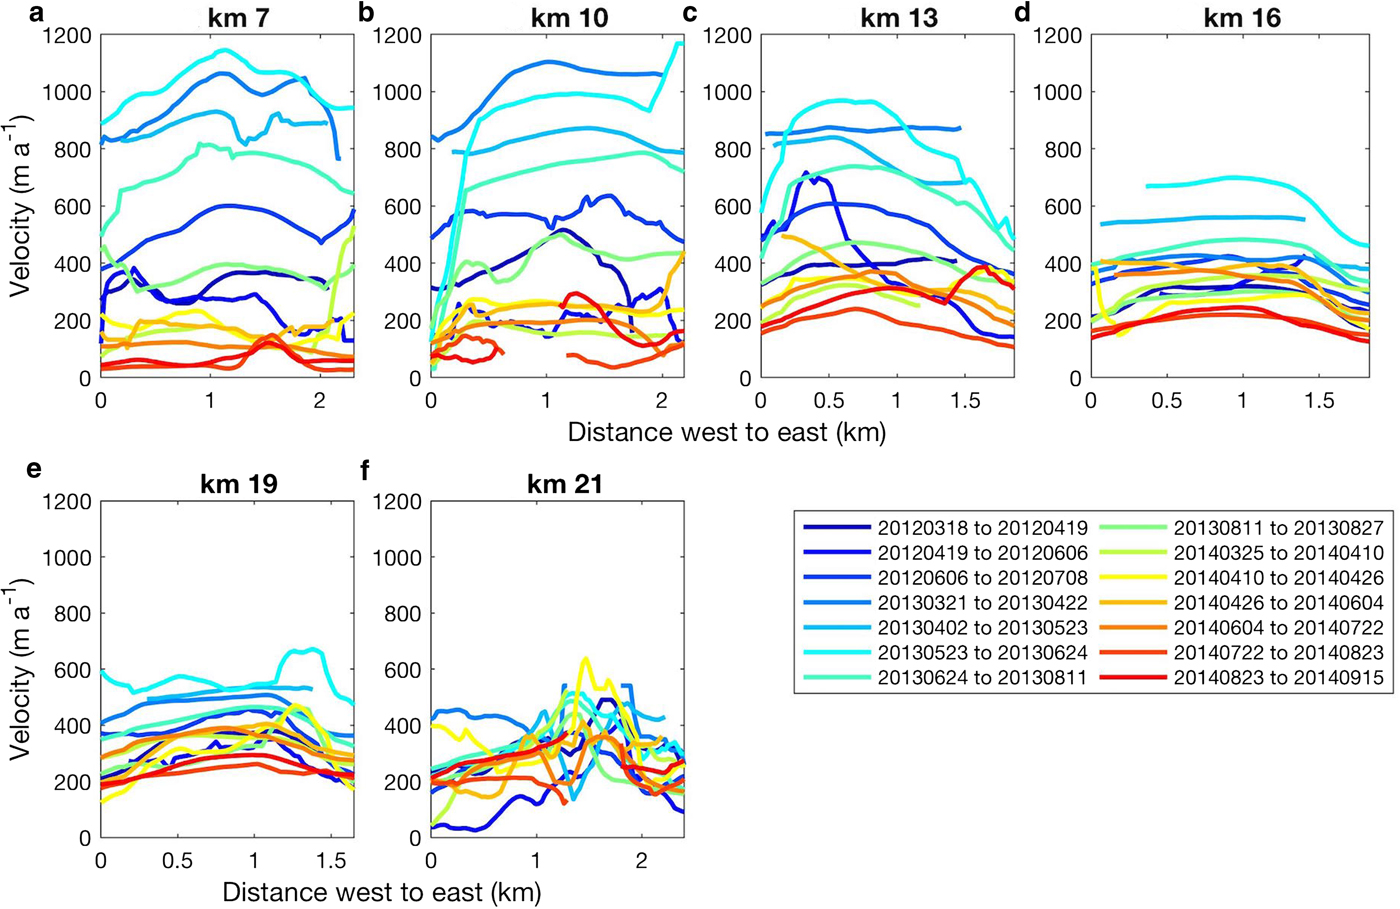
2012–2014 surge transects. (a–f) Velocity transects before, during and after surge event are shown, position of each transect shown in Figure 1, all velocities flow into page. Line color transitions from dark blue to dark red as the surge progresses.
In contrast to previous studies (Clarke and Holdsworth, Reference Clarke, Holdsworth, Williams and Ferrigno2002; Abe and others, Reference Abe, Furuya and Sakakibara2016) on Donjek Glacier we find that the active surge phase duration is between 1.28 and 2.15 years, and the quiescent phase duration between 9.0 and 10.17 years, for the well-defined events since the 1970s (Table 4). The surge recurrence interval was ~12 years between the first four observed surges (~1935, ~1947, late-1950s and ~1969), ~10 years between the following three (~1969, 1977–1979 and 1988–1990) and again ~12 years between each of the last three surge events (1988–1990, 2000–2002 and 2012–2014).
4.2. Changes in maximum surge extent
The terminus of Donjek Glacier retreated by ~2.5 km between the pre-1874 Little Ice Age terminal moraines and its most recently advanced surge extent in May 2014. The rate of retreat has varied across the glacier terminus, with the fastest retreat rate of 18 m a−1 over 140 years occurring along the northwest terminus (Fig. 2). Between the maximum extent of the 1947 and 2014 surges, Donjek retreated by 1.5 km at the northwestern terminus, at a mean rate of 22 m a−1. The eastern terminus of Donjek has changed less through time, retreating at most 490 m between 1947 and 2014 (Fig. 2a). Between the maximum extents of two most recent surges, in 2002 and 2014, the entire terminus retreated by an average of 32 m a−1. In general, the magnitude of terminus advance during surges has progressively decreased over time. An exception to this pattern is the 1978 surge event, during which the terminus advanced up to 200 m further than the 1969 surge event.
The only tributary of Donjek Glacier that is known to surge enters the eastern side of the main valley at a distance ~23 km upstream of the terminus (Fig. 2b). We confirm two surges of the tributary in 1974 and 2010 from looped moraines in the main trunk of Donjek Glacier in Landsat imagery (Clarke and Holdsworth, Reference Clarke, Holdsworth, Williams and Ferrigno2002; Abe and others, Reference Abe, Furuya and Sakakibara2016). From 1973 to 1975 the tributary advanced 640 m into the trunk of Donjek Glacier (Fig. 2b), in 2010 it had advanced 220 m into the trunk and by 2011 it had advanced an additional 270 m into the trunk. The ice then flowed toward the terminus at an average rate of 50 m a−1 (Fig. 2b).
4.3. Velocity patterns
The highest surge velocities always occurred in the lower 10 km of Donjek Glacier, with increases up to two orders of magnitude from quiescence, while upstream of 15 km only a doubling or tripling of surge velocity relative to quiescence was observed (Figs 4, 5). In 2001 a maximum velocity of 1700 m a−1 occurred within 3 km of the terminus and in 2013 a maximum of 1150 m a−1 occurred 8 km upstream of the terminus (Fig. 4). The 2000–2002 surge velocities were generally higher than the 2012–2014 surge velocities, and near the western end of the terminus they were almost double those in 2012–2014 (Fig. 4).
Following surge initiation, velocities begin to rapidly increase below 16 km from the terminus (Figs 4a–f). When a surge terminated and the velocity in the lower 21 km of the glacier returned to that of quiescence (average ~130 m a−1), we observed velocities between 21 and 30 km from the terminus to remain constant or slightly increase when compared to the surge phase (Fig. 4). We were unable to reliably measure velocities ≳30 km from the terminus due to transient snow cover, particularly in the accumulation zone >40 km from the terminus. Velocities were elevated across the width of the glacier during surges (Fig. 5). Some profiles in the lower 13 km of the glacier appeared to have a slight parabolic shape with faster flow in the middle, but above 16 km velocity cross-sections showed nearly constant ice motion across the glacier width (Fig. 5). At 21 km from the terminus, velocities across the glacier width remained fairly constant throughout the surge event at ~300 m a−1 (ranging from ~200 to ~600 m a−1; Fig. 5f).
4.4. Elevation and slope changes
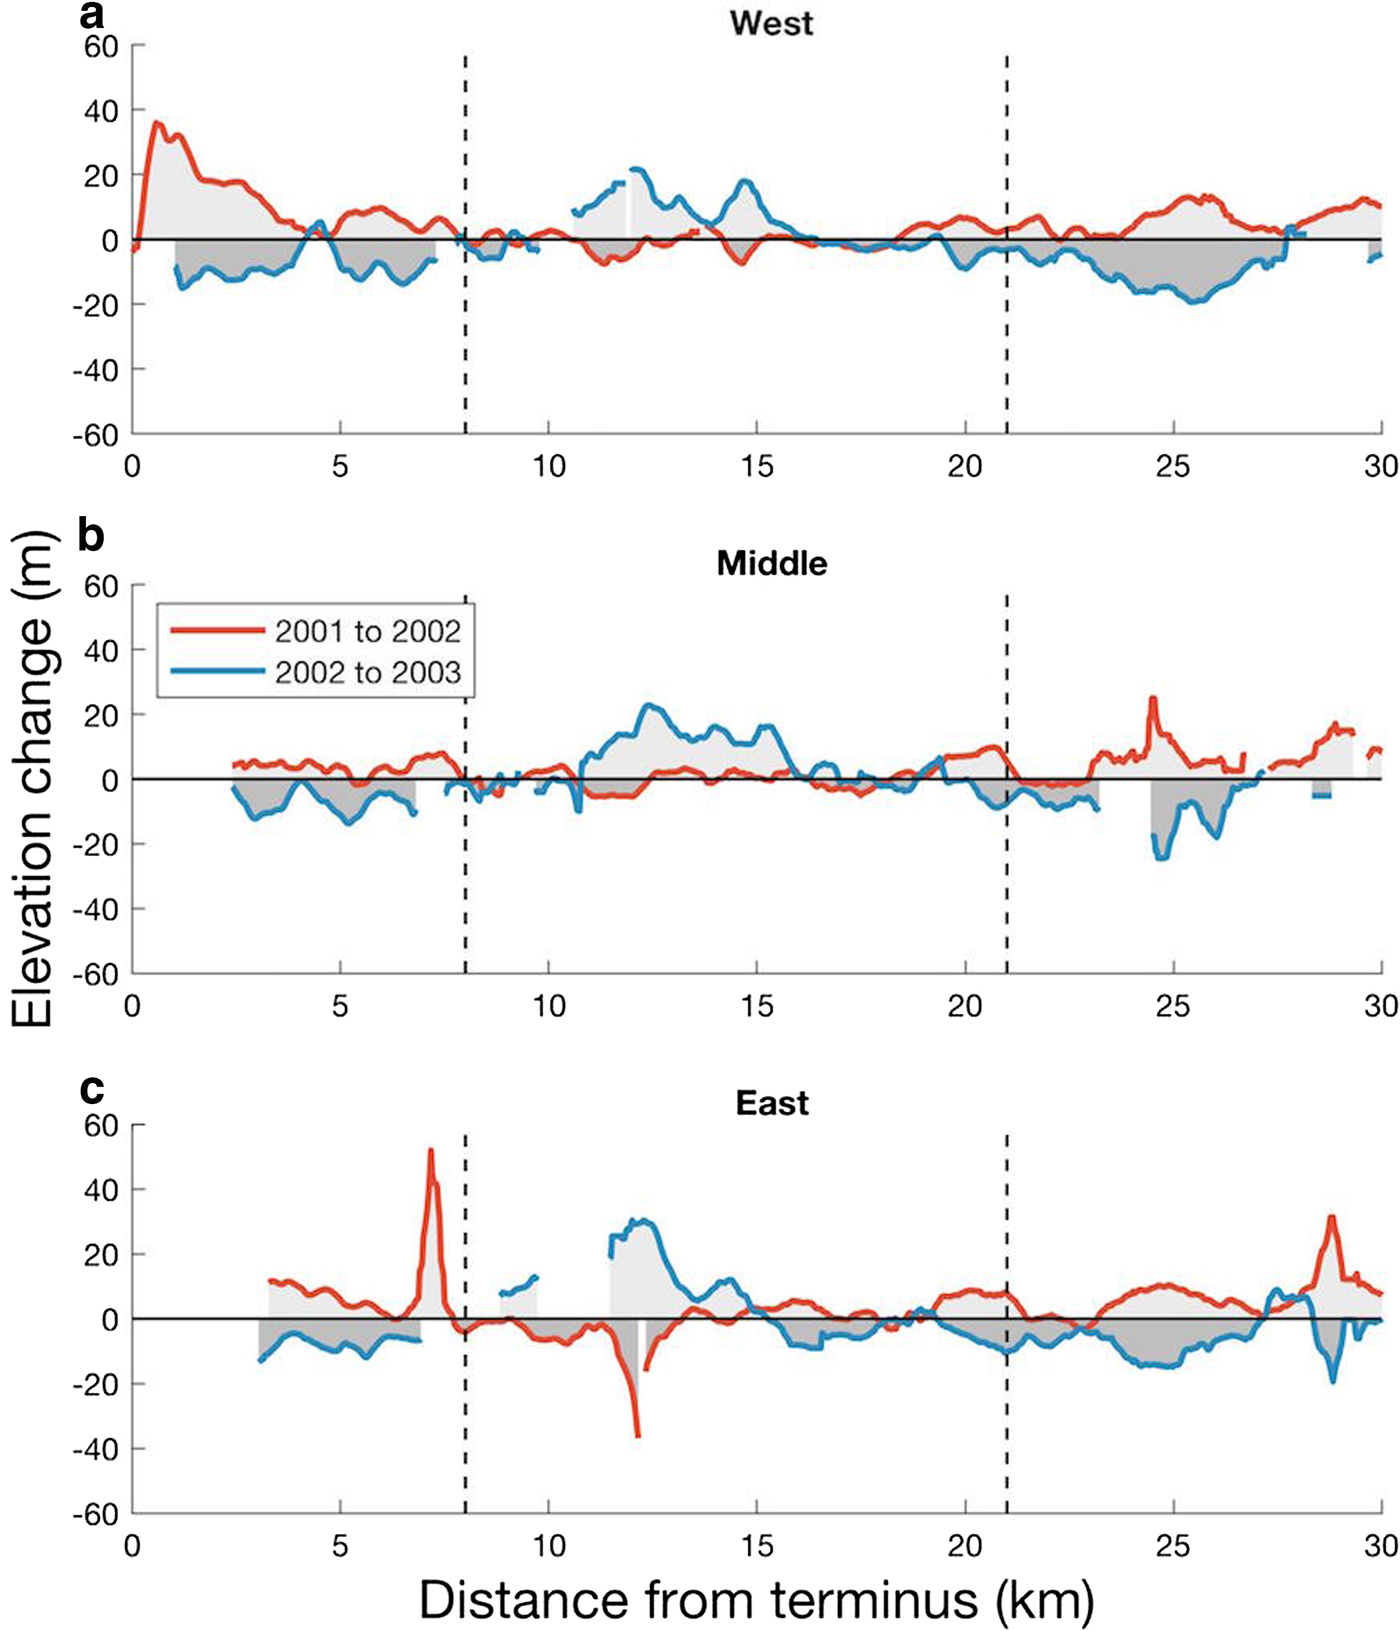
During the 2000–2002 and 2012–2014 surges of Donjek Glacier, changes in surface elevation suggest a net movement of ice mass from a 13 km-long reservoir zone (between 8 and 21 km from the terminus, representing an area of 28.6 km2) to an 8 km-long receiving zone (including the advanced terminus; area of 16.0 km2; Fig. 6). During the second half of the 2000–2002 surge, we observe a redistributed of ice toward the terminus between 28 September 2001 and 26 May 2002. During this period, the surface elevation of the reservoir zone (11 and 16 km from the terminus) lowered by an average of 1.33 ± 8.6 m and locally as much as 37 ± 14 m, while the surface elevation of the receiving zone rose by an average of 1.8 ± 2.6 m and locally as much as 52 ± 14 m (Fig. 6). This does not represent the total mass displaced by the surge event, as the surge initiated before our first elevation observation in 2001 (Fig. 6).
2000–2002 surge event elevation change. (a–c) Elevation change for each flowline from 28 September 2001 to 26 May 2002 and 26 May 2002 to 1 August 2003. Extent of the reservoir zone indicted by black dashed lines at 8 km (dynamic balance line) and 21 km from the terminus.
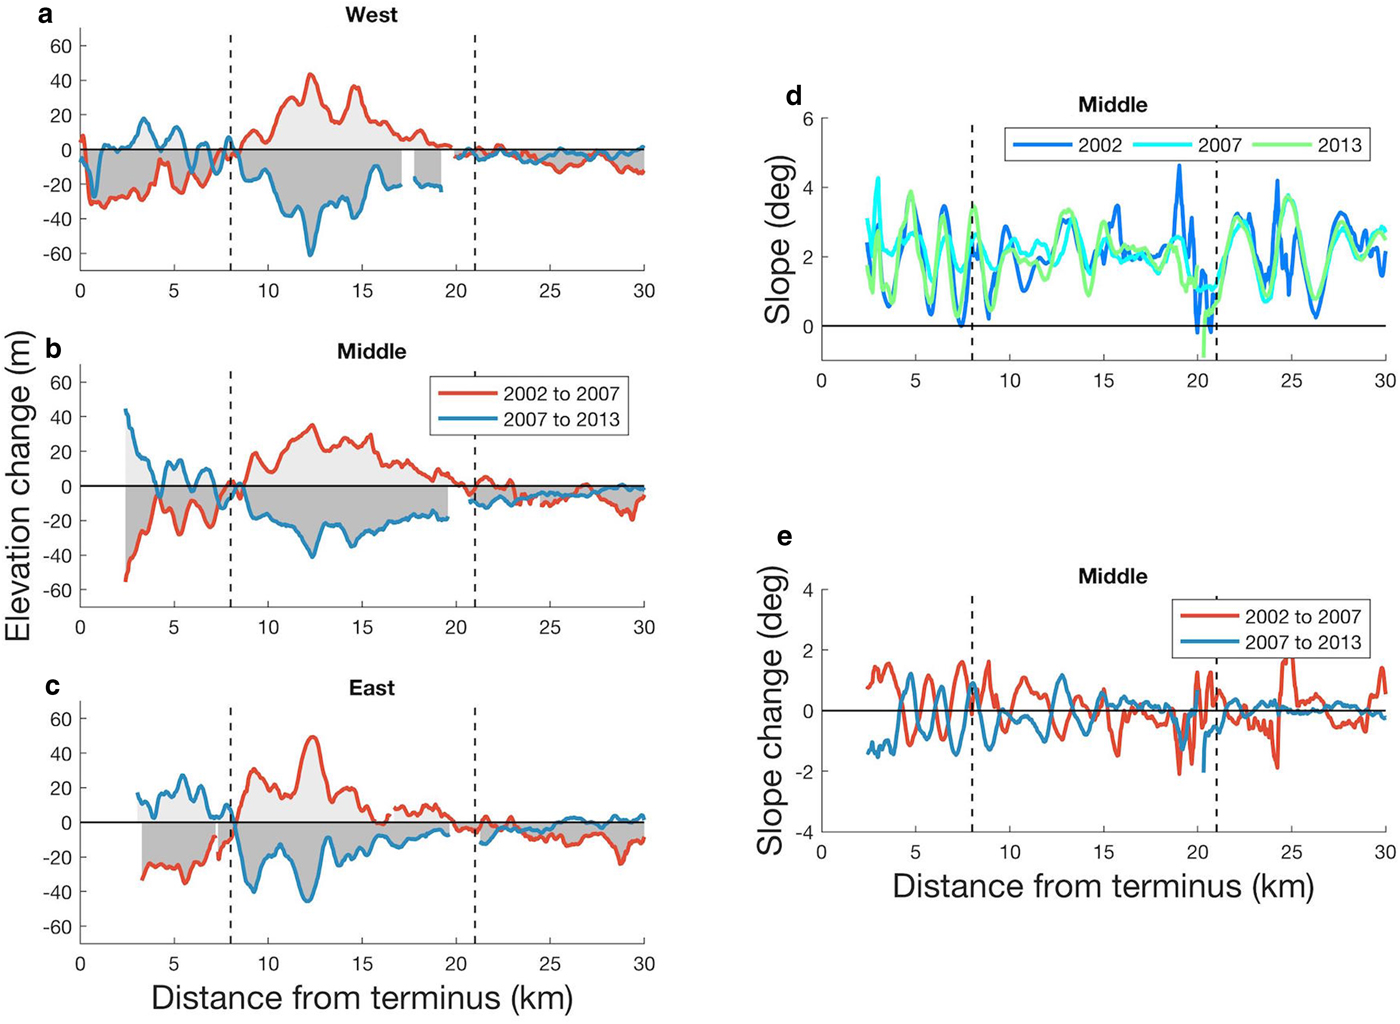
During the 2002–2007 quiescent phase, we observed a thickening of 14.8 ± 3.5 m (~0.423 ± 0.061 km3) in the reservoir zone and a thinning of 20 ± 5.7 m (~0.32 ± 0.059 km3) in the receiving zone (Figs 7a–c, 8). From 2007 to 2013, which encompasses ~5 years of quiescence and most of a surge event, the reservoir zone lowered by an average of 21.3 ± 2.0 m (~0.609 ± 0.035 km3) and the receiving zone thickened by an average of 5.8 ± 3.3 m (~0.092 ± 0.034 km3; Figs 7a–c, 8). The receiving zone thickening does include some terminus retreat from 2007 to 2013 along the western flowline (Figs 7, 8). Surface elevation changes were subtler up-glacier from the reservoir zone: from 21 to 30 km, the ice surface lowered by an average of 3.5 ± 1.7 m from 2007 to 2013 (Fig. 7). Drainage of the reservoir zone and filling of the receiving zone were not uniform across the glacier during this time period. From 2007 to 2013, we observed a maximum ice elevation increase of 44 ± 6.7 m at the terminus along the middle flowline and a maximum lowering of 61 ± 6.7 m at 12.2 km up-glacier along the west flowline.
The 2013 surge slope and elevation changes. (a–c) Elevation change for each flowline from 26 May 2002 to 13 September 2007 (red) and 22 May 2012 to August/September 2013 mosaic (blue). (d) Absolute slope of the middle profile for 26 May 2002 (dark blue), 13 September 2007 (medium blue) and the August/September 2013 mosaic (light blue). (e) Slope difference for middle flowline on 26 May 2000 to 13 September 2007 (red) and 22 May 2012 to the August/September 2013 mosaic (blue). Extent of the reservoir zone indicated by black dashed lines at 8 (dynamic balance line) and 21 km from the terminus. Note that elevation and slope changes have been smoothed with a 0.3 km moving window.
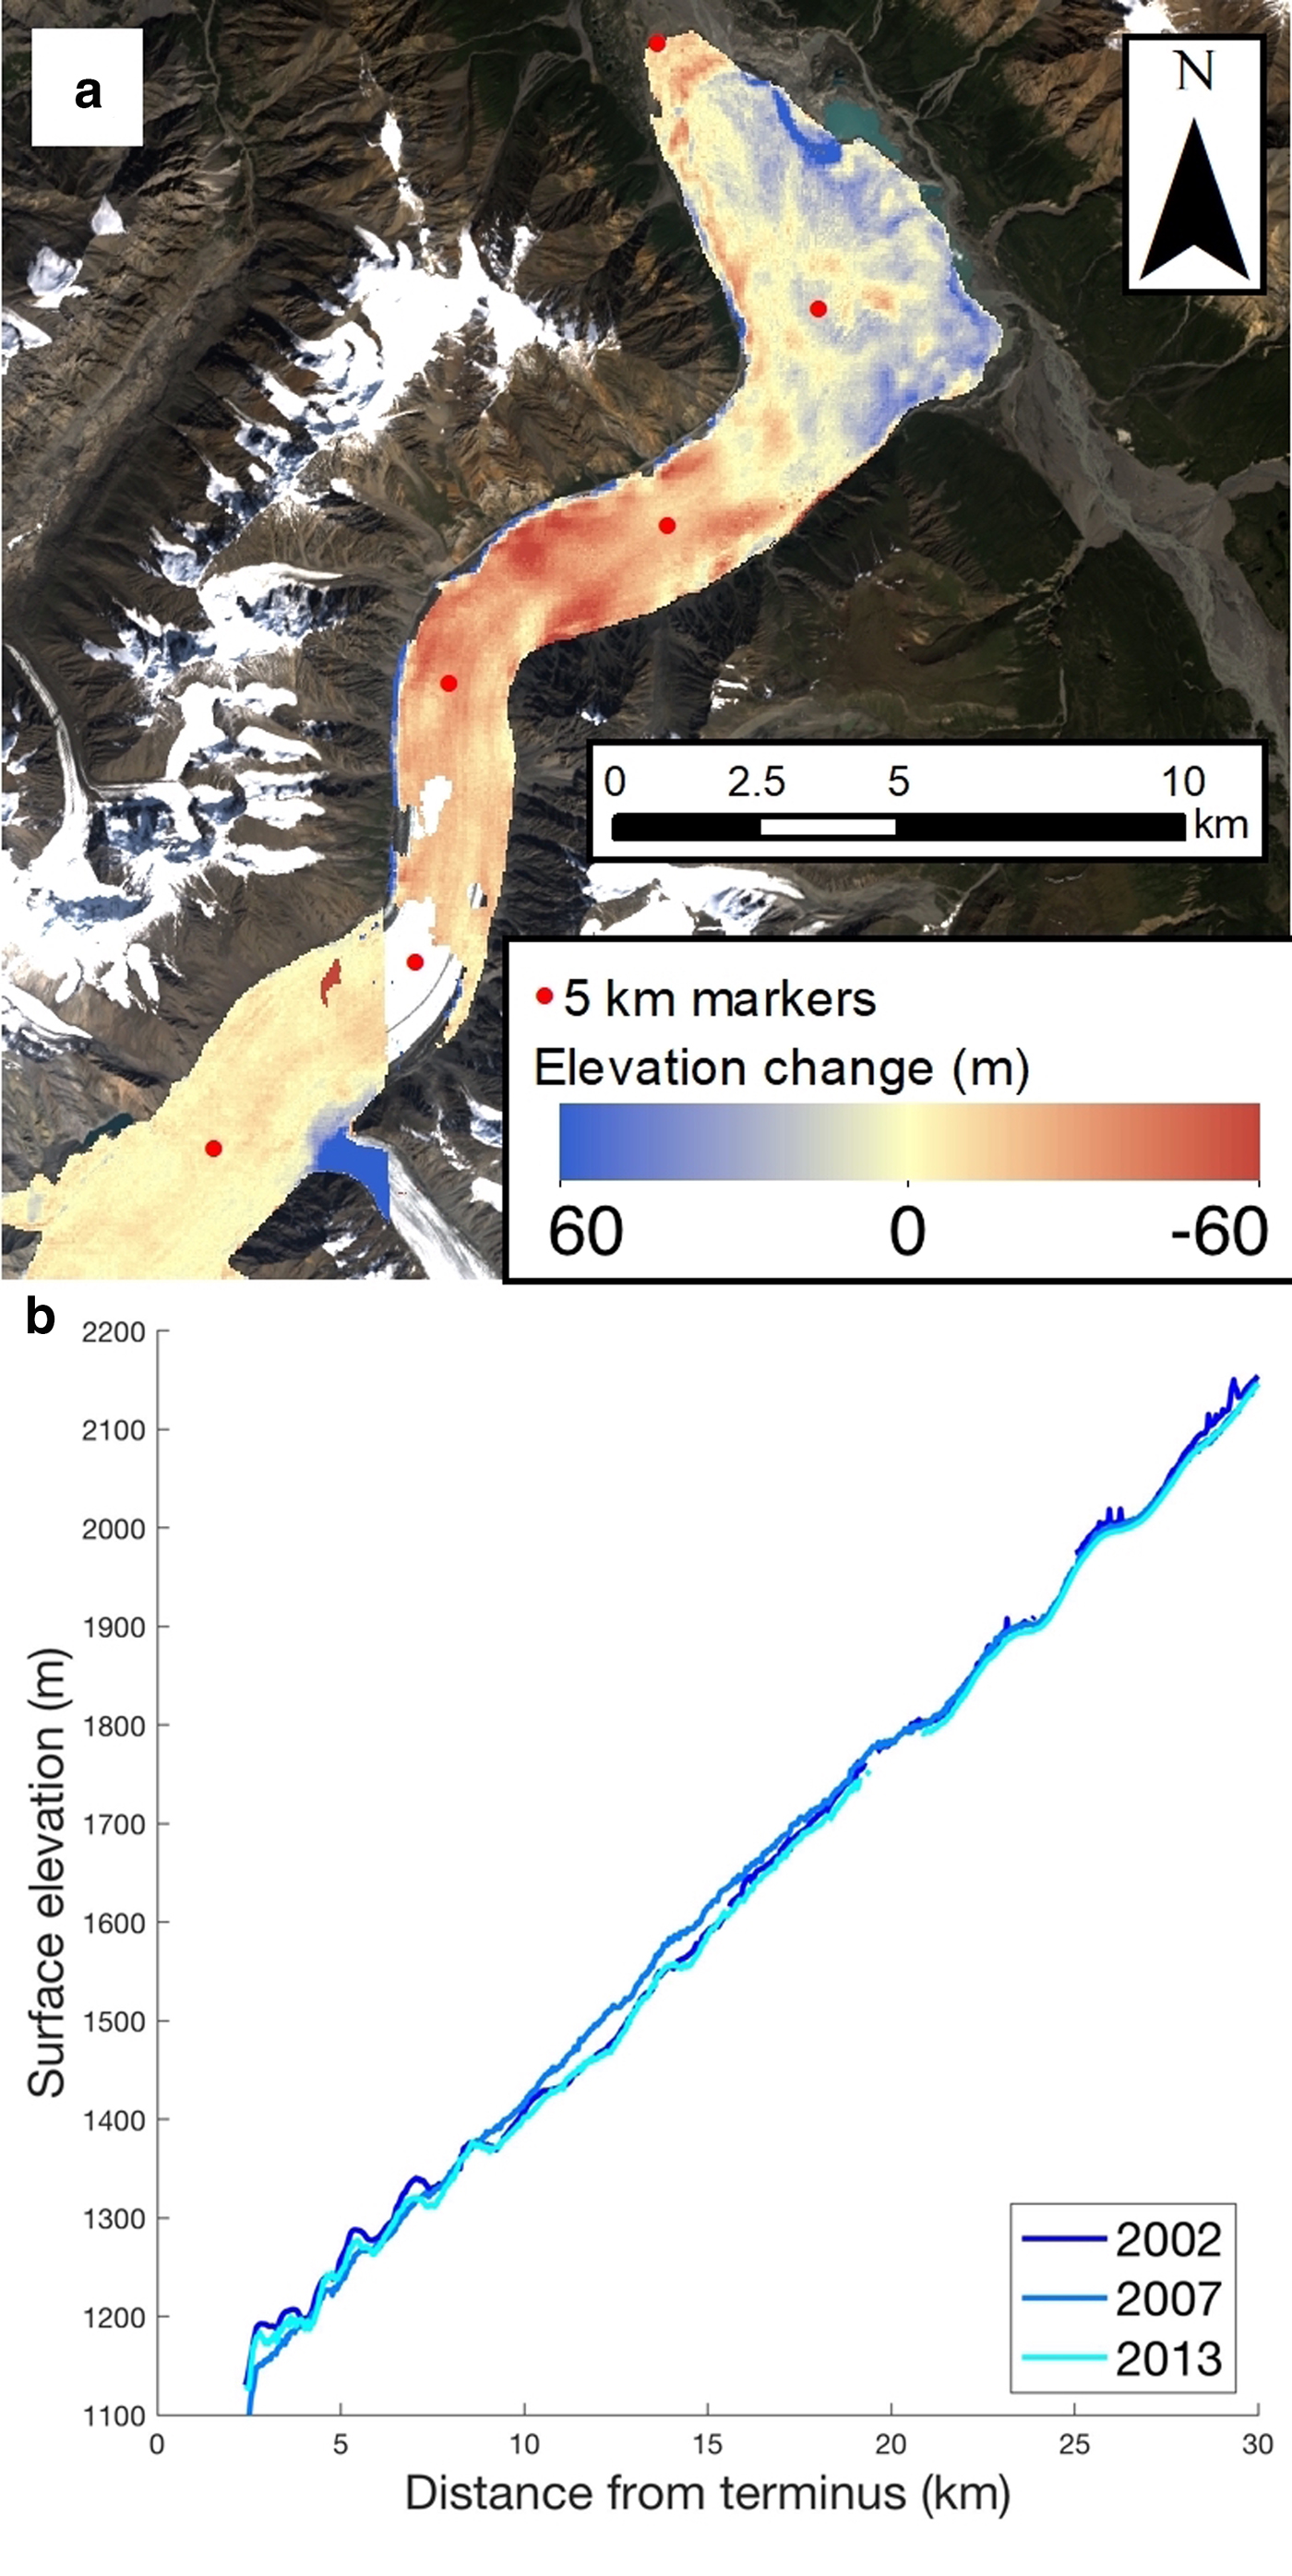
Absolute elevation change. (a) Elevation change from 13 September 2007 to August/September 2013 mosaic from red (negative) to blue (positive). Image is Landsat 8 scene from 22 July 2014 at the end of the 2012–2014 surge events. (b) Absolute elevation for middle profile on 30 May 2000 (dark blue), 22 May 2012 (medium blue) and the August/September 2013 mosaic (light blue). Surge events occurred from 2000 to 2002 and 2012 to 2014.
As the mass moved during the surge event, the glacier surface slope also changed. Slope changes during quiescence were mirrored by a nearly equal and opposite slope change during the surge phase in a wave-like pattern (Fig. 7e). The wavelength is 1.5 to 2 km with a maximum amplitude of 2° (Figs 7d, e). In the lower 1 km of the reservoir zone (8–9 km from the terminus) the glacier surface slope increased from 1.1 to 2.2° between 2002 and 2007 (Figs 7d, e). From 2007 to the end of the surge event in 2013, the slope over this area decreased by 1.2° on average. Overall, between 2007 and 2013 the glacier absolute slope decreased from 2.30 to 2.15° in the receiving zone and 2.05 to 1.8° in the reservoir zone (Fig. 7). The largest glacier surface slope changes occurred at 8.5 km from the glacier terminus on the eastern flowline, where the slope increased by 2.5° from 2002 to 2007 and decreased by 2.7° from 2007 to 2013. The observed change in surface slope along the eastern flowline corresponds with a maximum elevation gain of 51 ± 12 m during quiescence along the same flowline (Fig. 7c).
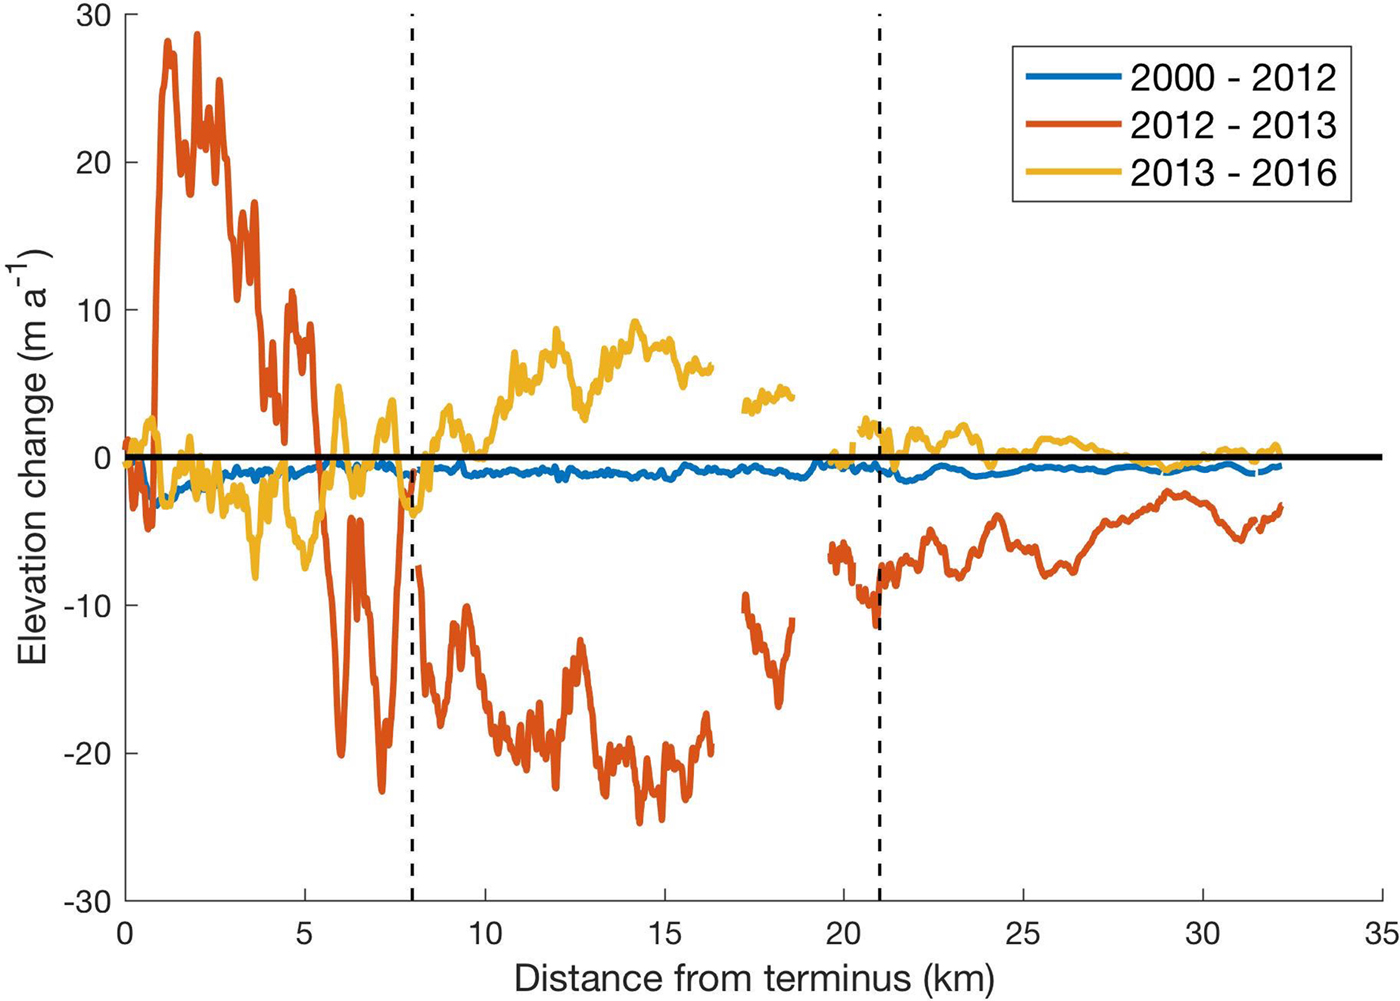
We measured the long-term geodetic mass balance of the lower 32 km of Donjek Glacier and the impact of the surge events using Operation IceBridge lidar swaths along the approximate centerline and WorldView DEMs. From 30 May 2000 to 22 May 2012, during which time a complete surge cycle occurred, the lower 32 km of the glacier surface lowered by an average of 1.0 m a−1 (Fig. 9). During the surge, from 22 May 2012 to August/September 2013 the lower 21 km of the glacier surface lowered by an average of 9.6 m a−1 along the flowline (Fig. 9), divided between a thickening of 6.11 m (~0.098 ± 0.0015 km3) in the receiving zone (0–8 km from terminus) and a thinning of −21.32 m (~0.61 ± 0.0016 km3) in the reservoir zone (8–21 km from terminus). If we extrapolate these results by zone area and assume constant glacier width and profile averages we find a net volume change of −0.512 ± 0.0022 km3. From August/September 2013 to 15 May 2016, the first three years of the current quiescent phase, the lower 32 km of the glacier surface rose by an average of 1.2 ± 0.0017 m a−1 (Fig. 9).
Glacier surface elevation change from 2000 to 2016. Glacier surface elevation change derived from IceBridge lidar (2000, 2012 and 2016) and WorldView (2013) elevation models. Lidar flight line is shown in Figure 1. We show change from 30 May 2000 to 22 May 2012 (blue) and change from 22 May 2012 to the August/September 2013 mosaic (red). Elevation change from the August/September 2013 mosaic to 15 May 2016 is shown in yellow. Extent of the reservoir zone indicated by black dashed lines at 8 km (dynamic balance line) and 21 km from the terminus. Note difference in profile location from Figures 6 and 7 due to 2000 flight line (Fig. 1).
From these observations, we infer the dynamic balance line to be 8 km upstream of the terminus. There is little change in surface elevation over time at this hinge, but there is pronounced mass movement across this line from the reservoir zone to the receiving zone during both the 2000–2002 and 2012–2014 surge events. Consistent with an inferred dynamic balance line in this location, there are significant changes in slope during surges in this area, especially along the eastern flowline (Fig. 7).
5. DISCUSSION
5.1. Mass redistribution
Abe and others (Reference Abe, Furuya and Sakakibara2016) hypothesized that the narrowing of the valley at 20 km up-glacier of the Donjek terminus acts as a constriction to outflow, allowing ice to accumulate in an upstream reservoir zone. The thickening and steepening at this location would eventually lead to the onset of a surge. Therefore, according to Abe and others (Reference Abe, Furuya and Sakakibara2016), the location of this constriction may be the location of the dynamic balance line. However, our velocity and elevation observations indicate that glacier velocity only increases significantly in the lowermost 21 km of the glacier during a surge, showing that both the reservoir and receiving zones are within this region. Indeed, we observe mass movement from a reservoir zone at 8–21 km from the terminus, across the dynamic balance line at ~8 km and into the receiving zone at 0–8 km from the terminus. This signifies that the constriction at 21 km limits the up-glacier extent of the surges, where only the portion of the glacier downstream of the valley constriction exhibits true surge-type behavior. However, the role of the valley constriction is not fully understood. While we and Abe and others (Reference Abe, Furuya and Sakakibara2016) both suggest the constriction is crucial in controlling surging, we lack observations to determine how it controls the surges. New bed elevation and glacier surface velocity observations are needed to understand the role of the Donjek constriction in surging.
Although the region up-glacier of the constriction is not actively involved in surging, it plays a key role in refilling the reservoir zone. We observe rapid refilling of the reservoir zone following a surge event, leading to a positive geodetic mass balance over the lower 32 km of the glacier from 2013 to 2016 (Fig. 9). We currently lack sufficient elevation data in the accumulation zone to determine the precise source of this mass. The constriction may still exert a control on the surge behavior of Donjek Glacier, but as the boundary between the lower ‘surge-type’ and upper ‘normal’ portions of the glacier.
Consistent with other findings (Ađalgeirsdóttir and others, Reference Ađalgeirsdóttir, Björnsson, Pálsson and Magnússon2005), our results suggest that surge-type glaciers can have a strong negative mass balance during a surge by moving large amounts of mass to lower, warmer elevations (Fig. 9). Immediately following a surge, the ablation area of a glacier can gain mass as it is dynamically refilled from an area above the reservoir zone. Thus, the mass loss during quiescence does not reflect the climatic mass balance of the glacier (cf. Gardelle and others, Reference Gardelle, Berthier, Arnaud and Kaab2013). Instead, our results indicate that a climatic mass balance can be derived from surge-type glaciers by comparing the glacier surface elevation at equivalent points in a surge cycle (e.g. just before a surge event; Fig. 9). However, this study is limited in the spatial extent of elevation measurements by narrow lidar swaths collected in 2000, 2012 and 2016.
The relationship between mass balance and surging at Donjek may be complicated by the presence of the surge-type tributary glacier 23 km upstream of the terminus. Abe and others (Reference Abe, Furuya and Sakakibara2016) suggest that surges of this tributary occur independently of surges of the main trunk, but because the tributary adds mass to the trunk it could cause the trunk to surge sooner than it would do otherwise. Although the 1974 and 2010 tributary surges appear to have added mass to the trunk (Fig. 2b), it seems that they had little impact on the recurrence interval of the main glacier surges events. The surge-type tributary plays a minor role, if any, in the surging of Donjek Glacier.
5.2 Surge mechanisms and comparison between events
Robust observations of repeat surges in a glacier are rare due to decadal to multi-decadal surge recurrence intervals, the relatively short time period over which high resolution satellite observations exist and the scarcity of repeat elevation data. Variegated (Eisen and others, Reference Eisen2005), Lowell (Bevington and Copland, Reference Bevington and Copland2014), Bering (Fatland and Lingle, Reference Fatland and Lingle1998; Burgess and others, Reference Burgess, Forster, Larsen and Braun2012) and now Donjek Glaciers, are among the only glaciers to have both elevation and velocity measurements for multiple surge events. The surges of Variegated Glacier were all similar in timing and scope, except for the 1995 surge, which did not reach full maturity (Eisen and others, Reference Eisen2005). It is still difficult to assess variability in recent surges of Lowell Glacier due to a lack of elevation data and spatially extensive velocity maps (Bevington and Copland, Reference Bevington and Copland2014). The two recent surges of Bering Glacier have showed different initiation patterns and timing, as the 2008–2011 surge initiated over 90 km of Bering Glacier (Burgess and others, Reference Burgess, Forster, Larsen and Braun2012) whereas the 1993–1995 surge had an isolated initiation zone (Fatland and Lingle, Reference Fatland and Lingle1998; Burgess and others, Reference Burgess, Forster, Larsen and Braun2012).
The surge time series presented here suggests that Donjek Glacier may have multiple surge initiation mechanisms. During some surge events the terminus begins to advance first, while the entire glacier starts moving at surge initiation in other events (Fig. 3). The 1977–1979 and 2012–2014 surge events both exhibited rapid motion of upstream ice (1–21 km from terminus) followed by terminus advance, while the 1988–1990 and 2000–2002 events exhibited terminus advance followed by upstream speedup (Fig. 3). Terminus advance appears to consistently occur at approximately the same time of year (August–September) for each surge event, regardless of velocity further up glacier (Fig. 3). We hypothesize that a surge can be trigged in two different ways, observed as up-glacier velocity increase or near-terminus advance, at Donjek Glacier, potentially related to how the subglacial drainage system is routed. We do not observe any kinematic waves propagating up or down glacier, suggesting that meltwater at the bed of the glacier acts over the lowest 21 km of the glacier nearly equally and/or rapidly propagates (in a matter of hours or days). However, the specific surge mechanisms at Donjek remain an open question that requires further research to address.
While we observe different patterns in surge initiation and termination, the location of the dynamic balance line appears to be controlled by the bed or valley curvature or both. We observe the dynamic balance line to be in the same location for the two most recent surge events with elevation measurements, for which we also observe the upper limit of surge activity to be at ~21 km upstream of the terminus. The geology underlying Donjek Glacier is composed of Silurian limestone, marble, argillite and phyllite in the accumulation area to Pennsylvanian quartz monzodiorite and diorite, and Devonian quartz-rich, micaceous, calcareous siltstone to sandstone in the lowest 22 km (Yukon Geological Survey, 2018). The terminus of Donjek sits on a strike–slip fault running east-west (Yukon Geological Survey, 2018). The lithological transition suggests that bedrock geology may have a control on the segment of Donjek Glacier that exhibits surge-type behavior. However, it is unclear if the valley constriction or the transition in bedrock lithology determines the upper limit (Fig. 1). Observations of other glaciers suggest that geology can favor surge-type over ‘normal’ glaciers (Jiskoot and others, Reference Jiskoot, Murray and Boyle2000, Reference Jiskoot, Murray and Luckman2003), but there appears to be no spatial pattern among the geology underlying surge-type glaciers in the Yukon (Clarke and others, Reference Clarke, Schmok, Ommanney and Collins1986; Crompton and others, Reference Crompton, Flowers and Stead2018). Observations of the bed profile, glacier thickness and substrate (bedrock type; till properties; etc.) are needed to better understand the causes and spatial extent of surging on Donjek Glacier.
5.3. Surge frequency and extent
Long-term changes in mass balance can cause changes in glacier surge frequency within a region (Dowdeswell and others, Reference Dowdeswell, Hodgkins, Nuttall, Hagen and Hamilton1995; Copland and others, Reference Copland2011). Although Donjek Glacier has experienced a negative mass balance in recent decades (Larsen and others, Reference Larsen2015) the recurrence interval of 12 years since the 1988–1990 surge event has not changed. While the quiescent interval appears to be 2 years shorter from 1980 to 1988 than it has been since that time (Table 4), we are unable to confidently measure quiescent phase length in earlier time periods. Interestingly, despite the largely constant repeat interval, the most recent active phase from 2012 to 2014 was the shortest on record at 1.28–1.69 years (Table 4). Despite the improved characterization of surging presented here, there is still insufficient evidence to state whether the duration of the recurrence interval, the quiescent phase or the active phase is changing significantly through time. The long-term negative mass balance in the study region has likely caused each of the successive surge events to be less extensive than the last (Fig. 2), consistent with the findings of Abe and others (Reference Abe, Furuya and Sakakibara2016). The next surge of Donjek Glacier is projected to occur in the mid-2020s, based on a consistent 12-year repeat interval, and will likely be less extensive than the 2014 maximum surge extent.
5.4. Comparison to other surge-type glaciers
Although other authors have found that glacier surges in Alaska tend to initiate in winter (Raymond, Reference Raymond1987; Harrison and Post, Reference Harrison and Post2003; Abe and Furuya, Reference Abe and Furuya2014), we show that the 1977–1979, 1988–1990, 2000–2002 and 2012–2014 surges of Donjek Glacier initiated in summer, similar to West Fork Glacier, Alaska (Harrison and others, Reference Harrison, Echelmeyer, Chacho, Raymond and Benedict1994). Furthermore, Abe and Furuya (Reference Abe and Furuya2014) found that surge-type glaciers in their quiescent phase frequently have higher winter than summer velocities. However, at Donjek Glacier, inter-annual variability during quiescence is greater than the seasonal difference between summer (Abe and others, Reference Abe, Furuya and Sakakibara2016) and winter velocity (Van Wychen and others, Reference Van Wychen2018).
Velocity cross sections show that sliding is likely the dominant mechanism of increased motion during the surge phase of Donjek Glacier as glacier velocity is elevated nearly uniformly across the width of the glacier (Fig. 5). This is consistent with the commonly observed ‘plug flow’ during surges (Kamb and others, Reference Kamb1985; Harrison and others, Reference Harrison, Echelmeyer, Chacho, Raymond and Benedict1994; Murray and others, Reference Murray, Strozzi, Luckman, Jiskoot and Christakos2003; Pritchard and others, Reference Pritchard, Murray, Luckman, Strozzi and Barr2005). It is difficult to discern patterns in velocity across the width of glaciers in their surge phase due to a lack of observations.
Steele (~35 km long), Lowell (~65 km long) and Trapridge Glaciers (<3 km) are the three geographically closest surge-type glaciers to Donjek that have received considerable attention. The 1966–1968 surge of Steele Glacier caused the ice surface to uplift 260 m (Stanley, Reference Stanley1969). Altena and others (Reference Altena, Scambos, Fahnestock and Kääb2019) found that Steele surged again between 2014 and 2016, although it has not yet been thoroughly documented. Lowell Glacier has experienced five surges since 1948, with recurrence intervals of 12–20 years (Bevington and Copland, Reference Bevington and Copland2014). Over the course of the 2009–2010 surge, Bevington and Copland (Reference Bevington and Copland2014) measured a 60 m maximum increase in elevation of the glacier surface. Trapridge Glacier underwent a slow surge from ~1980 to 2000 leading to little surface uplift, however, the glacier advanced 450 m (Frappé and Clarke, Reference Frappé and Clarke2007). Of these four well documented surge-type glaciers in the Yukon, Donjek has the shortest recurrence interval and displaces the second least amount of mass during a surge event after Trapridge Glacier.
Other surge-type glaciers in the Alaska region with surface elevation change observations include Muldrow (Post, Reference Post1960), West Fork (Harrison and others, Reference Harrison, Echelmeyer, Chacho, Raymond and Benedict1994), Variegated (Eisen and others, Reference Eisen2005) and Bering Glaciers (Burgess and others, Reference Burgess, Forster, Larsen and Braun2012; Table 5). Of these, Donjek Glacier experiences the least amount of elevation change in either the reservoir or receiving zone and has the least extensive reservoir zone. This suggests a connection between reservoir zone size and surge volume. While a great deal of work has been conducted on Trapridge Glacier (Clarke and others, Reference Clarke, Collins and Thompson1984; Clarke and Blake, Reference Clarke and Blake1991; Frappé and Clarke, Reference Frappé and Clarke2007), little work has been conducted to understand mass transfer from the reservoir to receiving zones for surge-type glaciers in general.
Surge elevation change, zone length and glacier details from around the world
a Elevation change is dependent on timing of available DEMs.
b Terminus position defined by each study author.
With the exception of Bering Glacier (Burgess and others, Reference Burgess, Forster, Larsen and Braun2012), the maximum elevation gain is always larger than the minimum elevation loss for all surge-type glaciers in Alaska and the Yukon. Peak elevation loss exceeds elevation gain at the tidewater glacier Sortebrae in Greenland (Jiskoot and others, Reference Jiskoot, Pedersen and Murray2001), while tidewater glacier surges in Svalbard have almost equal peak elevation increase/decrease (Table 5). Variegated Glacier is the only known Alaskan glacier whose surge involves the entire length of the glacier (Eisen and others, Reference Eisen2005). Variegated is also one of the only two glaciers in the Alaska region which has its annual snowline within the reservoir zone (West Fork Glacier being the other; Table 5). Although it is possible that other surge-type glaciers exhibit similar elevation change characteristics as those mentioned here, it is difficult to compare surge phase elevation change to other glaciers around the world due to a lack of glacier wide elevation data.
6. CONCLUSIONS
Donjek Glacier has retreated ~2.5 km since its pre-1874 Little Ice Age maximum extent to its most recent advanced post-surge position in 2014. Despite this retreat, and an overall negative mass balance, Donjek has surged regularly, with eight events since 1935 (~1935, ~1947, late-1950s, ~1969, 1977–1979, 1988–1990, 2000–2002, 2012–2013) and a repeat interval of 9–12 years. During each of the last three surges Donjek increased in area by 3–7 km2 (0.7–2% of total area) due to terminus advance. We found that the 2000–2002 and 2012–2014 surge events initiated in summer months, but did not reach their full active phase until the following spring (2001 and 2013, respectively). The surge is limited to the lower 21 km of Donjek Glacier as mass is redistributed from the reservoir zone (8–21 km from the terminus) to the receiving zone (0–8 km from the terminus). Ice velocity is fastest in the receiving zone, reaching speeds as high as 1700 m a−1. While the location of the dynamic balance line remains constant between recent surge events, observations suggest different ways in which surges can initiate for unique surge events. The entire portion of the glacier affected by the surge begins to move rapidly before we observed terminus advance for the 1977–1979 and 2012–2014 surge events, while the opposite is true for the 1988–1990 and 2000–2002 events. This suggests that Donjek surge events can be triggered at different locations, and perhaps by different mechanisms.
Abe and others (Reference Abe, Furuya and Sakakibara2016) hypothesized that significant narrowing of the valley at 21 km from the terminus controlled the surging of Donjek Glacier, but we show here that the constriction actually defines the upper end of the active surge zone. This surge zone corresponds to the part of Donjek Glacier underlain by metasedimentary rock, and the constriction corresponds to the area were the underlying lithology changes from metasedimentary up-glacier to igneous down-glacier (Fig. 1). Thus, the role of the constriction in surging is complicated as it represents both a change in geometry and lithology.
We find elevated rates of mass loss during the surge phase, while comparatively little mass is lost during quiescence. During the 2012–2013 surge event, Donjek Glacier had a net ice volume loss of ~0.51 ± 0.0022 km3 in the lower 21 km of the glacier, the active surge zone. In the few years following a surge event we observe the ablation area to have a positive geodetic mass balance, suggesting rapid refilling from up-glacier regions. Thus, it is vital that surge-type glacier mass balance measurements are undertaken at the same time in the surge cycle (e.g. immediately before or after a surge event) for inclusion in glacier response to climate studies (cf. Yde and Paasche, Reference Yde and Paasche2010) and mass balance inventories (cf. Larsen and others, Reference Larsen2015).
ACKNOWLEDGEMENTS
WK is supported by the National Science Foundation Graduate Research Fellowship under Grant No. DGE-1144205. WK thanks Dan and Betty Churchill for providing funding for a 2017 field season. LC thanks the Natural Sciences and Engineering Research Council of Canada, University of Ottawa and Polar Continental Shelf Program for funding and field logistics. KK thanks the NSF for funding St. Elias research, NSF AGS-1502783. WorldView DEMs were provided by the Polar Geospatial Center under NSF-OPP awards 1043681, 1559691 and 1542736. We thank William Hauer at the Alaska Satellite Facility for his assistance tracking down Austin Post's air photographs, the Yukon Energy, Mines and Resources Library for scanning air photographs, and the University of Ottawa Geographical, Statistical and Government library for ordering air photographs. This work used the Extreme Science and Engineering Discovery Environment (XSEDE), which is supported by the National Science Foundation grant number ACI-1548562. This work used XSEDE Bridges GPU at the Pittsburg Super Computing Center through allocation DPP170002.


 Open access