


1. Introduction
Hydraulic conditions in a glacier can exert strong control on its basal motion (Reference Cuffey and PatersonCuffey and Paterson, 2010). Long-known examples are the fast motion of some polar ice streams, the surging of glaciers and the seasonal variations in speed of temperate and polythermal glaciers. A diverse mix of observations provide a framework for understanding the breadth of these modes of velocity variation. These include direct sampling and instrumentation of the basal zone through boreholes or tunnels, remote sensing with seismic and radar methods, inference based on changes in surface motion including uplift, sampling of discharges in proglacial streams and investigation of deglaciated terrains. Reference Fountain and WalderFountain and Walder (1998) give a broad review; Reference Mair, Willis, Fischer, Hubbard, Nienow and HubbardMair and others (2003) and Reference Bartholomaus, Anderson and AndersonBartholomaus and others (2008) provide a recent perspective on seasonal changes in speed. A central problem for advancing understanding is acquiring both spatial and temporal coverage of contemporaneous covariation of relevant variables describing the basal motion and hydraulic conditions. Radio-echo sounding (RES) is strongly motivated because of its capability for both high time resolution and rapid coverage of large spatial areas.
We performed a series of surface-based, low-frequency RES measurements in the upper ablation area of Black Rapids Glacier (BRG), Alaska, USA, (Fig. 1) to examine the changes in reflections from the interior and base of the ice on an hourly timescale associated with seasonal change in speed and shorter motion events. Measurements were carried out from mid-May to early July 1993 in conjunction with contemporaneous seismic reflection investigations by the University of Alaska Fairbanks (UAF;Reference Nolan and EchelmeyerNolan and Echel-meyer, 1999a).
Black Rapids Glacier and its location in Alaska (inset panel). The primary study region (heavy-lined box) is shown enlarged in Figure 2.

Considerable success has been achieved on both polythermal and temperate glaciers of modest thickness with ground-penetrating radar (GPR) using frequencies of 25 MHz and higher. GPR has been used to map water content in the ice (e.g. Reference Murray, Booth and RippinMurray and others, 2007;Reference Bradford, Nichols, Mikesell and HarperBradford and others, 2009), which is relevant to transfer of water through the ice and its mechanical properties. GPR has also been used to detect changing intra- and basal-water conditions (e.g. Reference Irvine-Fynn, Moorman, Williams and WalterIrvine-Fynn and others, 2006;Reference Kulessa, Booth, Hobbs and HubbardKulessa and others, 2008) relevant to our interest.
The 600 m thickness and temperate thermal regime of BRG motivated our use of low-frequency (2 and 5 MHz), short-pulse radar. At typical GPR frequencies, strong scattering from abundant meter-scale water bodies in temperate ice obstructs clear viewing through thick temperate ice to the bed. Low frequency reduces scattering from such water bodies, with their effect being smoothed into the bulk-ice water content. While thin water bodies and layers can be detected (e.g. Reference Jacobel and AndersonJacobel and Anderson, 1987;Reference Walford and KennettWalford and Kennett, 1989), sensitivity and resolution are less.
The primary challenges that emerge are shared generally by radar methods. Two such challenges are (1) strong nearsurface effects modifying the returns from all depths, which can give false indications of changes in the ice and at the bed, and (2) possible high background basal reflectivity from till, which can hide reflectivity changes from a drainage system between the till and ice base. Analysis of our data motivated a viable method for overcoming the first and provides perspective on the second.
2. Black Rapids Glacier
BRG is ~ 40km long and ~2.3 km wide (Fig. 1) with an average surface slope of 2.3° (Reference Heinrichs, Mayo, Echelmeyer and HarrisonHeinrichs and others, 1996). It moves in a generally U-shaped valley with maximum ice depth of ~700m (Reference GadesGades, 1998). The gently curving east- west part of the valley 12-35 km from the head of the glacier follows the trace of the Denali Fault, separating distinct rock terranes to the north and south (Reference Truffer, Motyka, Harrison, Echelmeyer, Fisk and TulaczykTruffer and others, 1999). BRG is temperate (Reference Harrison, Mayo and TrabantHarrison and others, 1973). It has surged in the past, most recently in 1936-37 (Reference PostPost, 1960). During the past few decades there has not been a progressive evolution of geometry and speed that would indicate buildup to the next surge (Reference Heinrichs, Mayo, Echelmeyer and HarrisonHeinrichs and others, 1996; Reference Truffer, Harrison and MarchTruffer and others, 2005). The pattern of water and sediment discharge from the glacier does not show distinctive features related to the glacier's surge history (Reference Raymond, Benedict, Harrison, Echelmeyer and SturmRaymond and others, 1995).
Much attention has focused on seasonal changes in speed in the upper part of the ablation area below the sharp bend in the main flow (Fig. 2). UAF photogrammetric velocity monitoring, started in 1982, identified an annually repeating pattern of spring speed-up and summer slowdown accompanied by motion events on shorter timescales (personal communication from W.D. Harrison, 1993). Approximately day-long, strongly peaked motion events are associated with rapid drainages of marginal or supraglacial lakes up-glacier from km-16 that fill during the early melt season. Some less pronounced multi-day motion events are not so associated. Figure 3 shows the speed changes and the timing of lake drainages observed in our interval of observations during the early melt season of 1993.
BRG study region. Thick curve shows outline of the glacier. km-XX indicates distance from the head of the glacier. Circles show locations of continuous RES monitoring of internal and bed reflections. Thicker straight lines show profiles, where repeated measurements were made. ‘x’s show locations on profiles of repeated stationary measurements. Light lines show paths of RES traverses to map surface elevation and ice thickness (Reference GadesGades, 1998, ch. 4). Contours show unmigrated two-way travel time converted to distance based on an assumed speed of 168mms–1 in pure, temperate ice not accounting for presence of water. Black patches show lake positions labeled with date of drainage initiation. Arrows show direction of over-surface drainage (solid) and assumed subsurface (dashed).

(a) BRG measurement record and (b) daily average glacier speed at km-15. Vertical lines show the approximate onsets of marginal lake drainages. The speed measurements were gathered in collaboration with Reference Nolan and EchelmeyerNolan and Echelmeyer (1999a).

Seismic reflection experiments (Reference Nolan and EchelmeyerNolan and Echelmeyer, 1999a, Reference Nolan and Echelmeyerb) and observations from boreholes drilled to the bed (Reference Truffer, Motyka, Harrison, Echelmeyer, Fisk and TulaczykTruffer and others, 1999) in a cross section ~0.2 km down-glacier from km-16 have shown that the ice there is underlain by 4-7 m of till. Further, the experiments indicate that acoustic properties of the till can change rapidly in association with lake drainage events, and that deformation deep within the till, shearing concentrated in a thin layer just beneath the top of the till, and/or sliding over the top of the till all contribute in various combinations to the observed seasonal-scale variations in speed (Reference Truffer, Harrison and EchelmeyerTruffer and others, 2000; Reference Truffer and HarrisonTruffer and Harrison, 2006).
Reference Truffer, Echelmeyer and HarrisonTruffer and others (2001) analyzed some of these data and showed how high sensitivity of basal motion to small changes in basal water pressure and stress can explain the primary features of observed velocity change. Such sensitivity will arise from the presence of till close to or at failure under a large part of the glacier width, with stabilization provided by relatively small strong zones. More detailed analysis by Reference Amundson, Truffer and LüthiAmundson and others (2006) has shown that increases in surface speed during spring and summer, and associated changes in the cross-glacier distribution of surface speed in comparison to winter, were related to redistribution of basal shear stress. Shear stress on the bed was reduced by 7% during spring and by 16% during summer in a zone ~1 km wide centered ~0.5 km left (north) of the deepest part of the cross section (Fig. 4).
Cross profile on 24 June 1993 looking down-glacier at km-16 displayed as a Z-scope image of received voltage. The horizontal axis is distance (northward to left, southward to right) for ~ 86 filtered records spaced ~15.7m across the ~1354m display width. Heavy ticks at top show transverse locations of measurement sites in the section named according to horizontal coordinate (Fig. 11). The circle indicates transverse location of RES16U ~ 0.2 km up- glacier from the section. The left axis is TWTT with zero adjusted accounting for surface elevation change determined with barometric leveling. Sampling interval is 10 ns, giving a total of 740 samples in the TWTT in the 7.4 ms height between the upper surface and bed at the deepest location in the image. The white band near the surface is a consequence of near-field antenna interaction that is not completely removed by filtering and choice of grayscale mapping optimized to display later returns. The local signal emerging through this band beneath the location of RES16U is a consequence of interaction with antennas at RES16U and 16L just up-glacier. The right axis is a distance corresponding to travel time calculated with assumption of uniform radar wave speed of 168 m ms-1 in pure, temperate ice not accounting for presence of water. The thick white curve is a two-dimensional migration of the bed reflection based on that wave speed. The short horizontal bars represent the ice base in UAF boreholes (Reference Truffer, Motyka, Harrison, Echelmeyer, Fisk and TulaczykTruffer and others, 1999) 0.2 km down-glacier relative to the vertical distance axis on right shown as if they were in the section. Holes are named according to Nolan and Echelmeyer (1999a). N1 and D1 definitely reached the ice base and penetrated till. There are two hole locations beyond the south edge of the diagram at about +500 and +600 m. The long horizontal bar shows the transverse range of the basal stress reduction zone inferred by Reference Amundson, Truffer and LüthiAmundson and others (2006) in summer (solid) and spring (solid + dashed). Vertical exaggeration 1.47: 1.

3. Methods
3.1 RES system
The RES systems consisted of a ±1 kV balanced impulse transmitter (Reference WeertmanWeertman, 1993) driving a resistively loaded, half-wavelength, center-feed dipole antenna and a receiver/ recorder sensing voltage on an identical antenna. Several commercial digital-oscilloscope-computer combinations were used for receiving and recording. The length of the antennas determined center frequency. (Each leg of the dipole was one-quarter wavelength, either 20 m for ~2 MHz or 10m for ~5MHz.) Antennas lay directly on the glacier surface in a common line with centers offset depending on frequency (either 80 or 40 m). With a smooth bed, reflection power from the ~600 m depth of the bed will return from an area approximated by the diameter of the first Fresnel zone (~300 m or 200 m).
During measurement, the transmitter sent pulses with a repetition rate of ~100Hz. The oscilloscope was triggered by arrival of an airwave, which initiates acquisition of a 'waveform' composed of a sequence of equally time-spaced voltage 'samples' (512 at 20 ns interval or 1024 at 10 ns interval). The waveform included pre-trigger for noise analyses (typically ~ 0.5 ms) and post-trigger to capture bed and later returns (typically ~10ms). Each 'record' represents an average of order 100 waveforms from multiple transmissions stacked internally in the oscilloscope to reduce system and environmental noise.
Effects from low-frequency, near-field antenna interaction and residual high-frequency noise not removed by stacking were reduced in each record by post-processing digital filtering using a zero-phase, forward-reverse fourth-order Butterworth bandpass filter (chosen to minimize distortion of amplitude and phase shift for frequencies within the passband of 1 : 10MHz). 'Filtered' records are used for display and analysis.
Here our main focus is detection of changes in the timing and strength of reflections, and we use the recorded twoway travel time (TWTT) without interpretation into travel distance. Precise positioning of the reflectors is not central to our purpose, and is hampered by the complex distribution of water present in temperate glaciers (Reference Bradford, Nichols, Mikesell and HarperBradford and others, 2009).
3.2 Repeat profiles
To provide spatial context and track seasonal change, RES profiles were repeated along marked paths at km-14, km-16 and km-18 (Fig. 2) every few days during the interval of lake drainages but less frequently before and after (Fig. 3). The receiver/recorder used a Tektronix 2432 oscilloscope sampling at 10 ns and a pre-amplifier. Power for the oscilloscope was supplied by a gasoline generator. The shorter 5 MHz antennas were used to enable easier change of direction at ends of profiles and towing in rough terrain. The in-line transmitter and receiver/recorder were towed behind a snowmobile. Records were acquired at a spacing of ~15.7m determined by a calibrated wheel, with each record composed of a stack gathered over that distance. Records were filtered as above for display and analysis. Figure 4 shows an example of the profile measurements at km-16. (Images of all three cross-section profiles can be found in Gades (1998, figs 4.2-4.4), but note incorrect orientation of Fig. 4 .3 in that source.)
Features common to profiles at different times present problems for direct temporal intercomparison of bed reflection amplitude either in profiles as a whole or in records selected from them. Foremost, variability of about ±30% between adjacent, along-profile records indicates mixing of spatial with temporal changes associated with imprecisely reproduced antennas positions, recording locations and associated stacking intervals from one profile time to another. The more than order-of-magnitude bed reflection amplitude variation from the deepest to the shallowest bed reflections across a profile together with the limited dynamic range of the recording system (10 bits) lead to clipping of the highamplitude reflections in shallower locations. This problem occurred in the early profiles; it was later eliminated by adopting a strategy for gain management.
For these reasons, the profiling system was stopped and precisely positioned for stationary recording at 13 marked locations (Fig. 2). At these sites the number of successful records is six (at the three locations on km-14 and at the six locations on km-16) to four (at the four locations on km-18).
3.3 High-resolution time series
Our main effort was directed toward identifying sub-daily changes in reflection characteristics with continuous high time resolution of 0.5-1 hour time sampling. This was achieved with automated systems at fixed locations (Fig. 2) near the deepest part of the valley at km-14 (RES14) and ~0.2 km up-glacier from km-16 (RES16) with intervals of recording shown in Figure 3. Battery banks charged with solar panels provided power for both transmitter and receiving/recording. At each location, ~2MHz antennas were left in place on the glacier surface without disturbance other than from surface melting and gradual displacement by motion <20 m down-glacier over the measurement interval. Sites were visited once or twice daily to download data and to correct any problems with antennas or power supply.
The primary recording site near 63.48° N, 146.464° W consisted of a single transmitter (~150m up-glacier from km-16) and two receivers. One (RES16U) was located 80 m up-glacier from the transmitter. It was a Tektronix 222 oscilloscope recording half-hourly with 20 ns sampling rate and 128 stacking depth. The other (RES16L) was 80 m down- glacier. It was a Tektronix 2432/2440 recording hourly with 10 ns sampling rate. Records from RES16U were more complete than those from RES16L, where there were downtimes caused by oscilloscope failure and temporary redirection of the recording system for profiling described above. There were no apparent differences in the overlapping parts of records from 16U and 16L, so we present only RES16U (Fig. 5).
Filtered data from RES16U displayed as a Z-scope image. The horizontal axis is the observation time (day of year) for N= 1747 records. Vertical black bands are intervals when records were not acquired. The vertical axis is reflection TWTT for m= 512 samples spaced 20 ns apart. Grayscale is related to the voltage amplitude of the reflection. The divisions into surface, interior and bed sample regions are labeled along the right vertical axis.
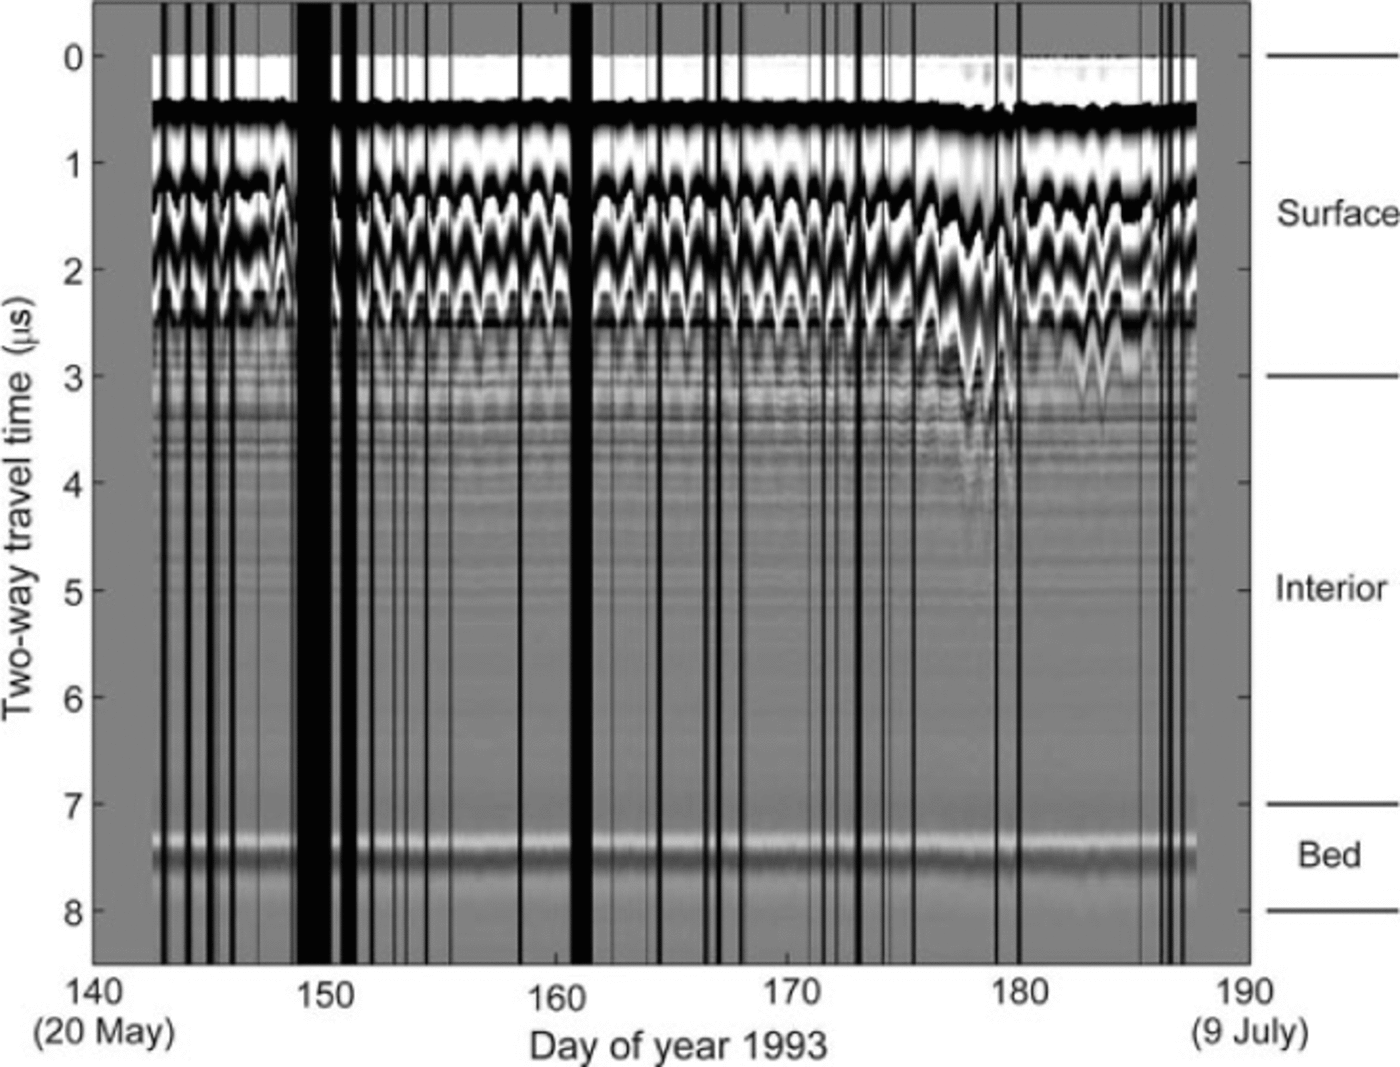
With the foregoing information for transmitter and RES16U receiver location and assumption of specular reflection off the bed, the bed reflection was located ~190m up-glacier from the km-16 profile. Given the bed cross section (Fig. 4) and the TWTT to the bed at RES16U (~7.2 ms), we expect that radar energy was reflected from a position ~130m north of the deepest part of the bed.
At RES16U there is a strong bed reflection at ~7.2 ms as well as persistent returns at other travel times. Diurnal variations in return are prominent near the surface and are also visible at depth. Peak amplitudes always occurred in the late afternoon, when surface water content in the snow was maximum. The strength of diurnal variation was relatively constant at RES16U until day 175, when a slush swamp started to build up around and under the equipment. The abrupt decrease in reflection strength on day 179 coincided with a slushflow, which rapidly drained the water from this region. Thereafter, the equipment was on bare ice. Apart from these diurnal variations, there is no obvious change in the displayed amplitude and timing of reflectivity.
Site RES14 was at 63.482° N, 146.502° W on the km-14 profile. There was one transmitter and one receiver (a Fluke 97 oscilloscope recording half-hourly with a 20 ns sampling rate and 256 stacking depth). There are a total of 634 records of 512 samples each. Based on the cross profile measured at km-14 (Reference GadesGades, 1998, Fig. 4 .2, deepest return ~7.6 ms) and the TWTT to the bed at RES14 (~7.4 ms), we expect that radar energy was reflected from a position ~190m north of the deepest part of the bed.
Similar to RES16U, there was a strong bed reflection (~7.4 ms) and persistent internal returns, with diurnal variations most prominent in the near surface. Unlike RES16, the snowline did not reach RES14 during the observation interval, and there was no time of anomalous diurnal variations associated with a snow swamp. Because of the visual similarity of features to Figure 5 and their availability in Gades (1998, Fig. 5 .4), they are not shown here. They are analyzed below.
4. Data Analysis
4.1. Temporal variations near the center of the glacier
Changes in reflection from within the ice and at the bed are subtle compared to near-surface effects at the level of display provided in Figure 5. We now undertake analysis to determine what limits on changes in bed reflectivity can be determined at RES16U and RES14. To do this we seek persistent, time-independent internal reflectors that can be used to calibrate and correct for changes in power transmission through the near surface (Reference GadesGades, 1998;Reference Kulessa, Booth, Hobbs and HubbardKulessa and others, 2008).
For this analysis we define surface, internal and bed zones (Fig. 5) as well as a pre-trigger zone (not shown). To make quantitative comparisons of reflected power from different return-time windows, the returned power P represented by signal samples A, from within a return-time interval t1-t2 is defined as the sum of squared samples divided by the number of samples:

where n 1 and n2 are the sample numbers corresponding to t1 and t2.
To determine a bed reflection power (BRP), the returntime window is centered on the reflected wavelet with length two times its period T A collective internal reflection power (IRP) coming from internal layers and scattering is defined over a return-time window chosen to start after the high-amplitude direct wave with associated signal clipping (3 ms or later) and to end before the bed reflection (7 ms or sooner). The first limit successfully eliminates the nearsurface part of the waveform over the complete interval of observations with the exception of days 175-180 at the RES|6U site, when amplitudes of diurnal variation were especially high (Fig. 5).
Figure 6 shows variations of BRP and IRP at RES16U, with IRP computed over a uniform time window, 5.5-7 ms, to enclose only the deepest scattering. For comparison, BRP and IRP are both normalized by the relation value/mean. BRPN and IRPN show clear (mostly diurnal) variations that are not evident at the level of display in Figure 5. The sizes of these temporal variations are large (up to 40%). A linear regression shows that BRP and IRP are highly (positively) correlated at both RES16U (r2 = 0.90, N =1700) and RES14 (r2 = 0.84, N = 640).
RES16U normalized reflection power from bed (upper curve) and interior (lower curve) showing a high degree of correlation (inset plot). Vertical lines show times of lake drainage.

Principal component analysis (Reference Dillon and GoldsteinDillon and Goldstein, 1984) provides another way to examine the covariation of features in the RES records. Principal components are formed from linear combinations of n RES records of msamples each to form an orthogonal set of n normalized basis functions E ithat are chosen to sequentially minimize the variance represented in the residual subspace. Any individual RES record (number r in interval 1 to n) can then be represented as the sum of its projections on the principal components (i from 1 to n), the size of which is given by the corresponding coefficients Cir. This technique allows us to quantitatively extract patterns in the waveforms that are most consistent through the time history and identify those features that are variable.
Figure 7a shows a typical record at RES16U for the interval 3-9 ms. Figure 7b-d show the first three principal components calculated for that sampling sub-interval (m = 300 samples) for the full set of RES records (n = 1747). Figure 7e shows the fractions of the total data variance explained by the first ten principal components. The break in slope in the explained variance between the first principal component and the second through tenth components indicates by the so-called scree test (e.g. Reference Dillon and GoldsteinDillon and Goldstein, 1984) that only the first component is significant in this case. Effectively, the variation with time of RES records through the full measurement interval can be represented by a single waveform (the first principal component) with varying amplitude (C1r). These results are consistent with the high degree of correlation between variations in IRP and BRP noted above, as well as details of all subsurface features deeper than 3 µs.
(a) Example record from RES16U, day 158.6. (b–d) The first three principal components E1 (b), E2 (c) and E3 (d) scaled by their coefficients C 1 , C 2 and C 3 respectively as calculated from the n=N= 1747 RES records and m= 300 samples in the shown travel-time interval. (Note the change in vertical scale in (c) and (d) compared to (b).) (e) The fraction of the total variance for the first ten principal components.

It is compelling to conclude that the proportional changes in IRP and BRP arise from changes in the transmission and reception of the radar power through the upper surface due to varying system (antennas) interaction with it. This conclusion is consistent with the known characteristics of the water variation in the snow and on the ice surface (described above). Note that strongest returns occurred when surface water content was a maximum (late afternoon and persisting slush). Apparently, high water content in the near-surface snow and/or ice significantly enhanced the coupling of the low-frequency antennas to the dielectric interface formed by the air/snow/ice transition.
4.1.1. Power reflectivity of the bed
Whatever their causes, strong variations in transmitted and received power through the surface zone must be taken into account to delineate locally induced variations in the scattering strength in the ice and reflectivity of the bed. A measure of the variation in power transmitted into the ice is sought by identifying stable reflection patterns within the interior zone (Fig. 5) well below the near surface. The strongest reflectors/scatterers are likely to be water-filled cavities (e.g. Reference Jacobel and AndersonJacobel and Anderson, 1987). Those cavities, either isolated from the connected internal drainage system or lying beneath the range of water-level fluctuations would have time-independent reflectivity. Wet englacial sediment bodies are other potential stable sources of radar returns. The time-varying amplitude returning from such stable reflectors/scatterers can then be used to calibrate changing interaction of the radar system with the surface zone and travel path through it.
To identify the most stable reflection pattern in the interior zone, the first principal component E1 is calculated for only this zone, in this case chosen to be 3-7ms to represent as much of the interior zone as possible without near-surface or bed influence. E1 represents the shape of the most common waveform from the interior throughout the measurements and arises from reflectors that are most constant. In these data the first principal component accounts for ~76% of the total variance, indicating that most of the returned signal from the interior is, in fact, due to persistent features.
The amplitude of E1 present in the ith waveform, represented as C1i, is calculated by projecting the ith waveform onto the normalized vector E1. C1i then represents the amplitude of the signal from the most persistent internal reflectors.
A linear relationship between C1i and the corresponding measured BRP i would indicate a covariation caused only by varying amounts of radar power reaching the ice subsurface (because of instrumentation and/or ice surface property variations), which would proportionally affect BRPand timeindependent scatterers. A residual BRP is defined as

where A and B are coefficients determined by the least- squares linear fit between C1i and BRPi. Non-zero BRPR is then due to variations in the physical conditions at the base of the glacier or error.
Error in each BRPRi defined by Eqn (2) comes from instrumentation and environmental noise. A standard error in BRPi (Eqn (1)) was estimated based on the pre-trigger data noise level in the ith record. The error in C1i depends on the number of interior-zone samples, m, chosen for the analysis and noise level in the ensemble of waveforms as well as in the ith waveform. The dependence of standard error in C1i on m and noise levels was estimated empirically using a series of tests on a known set of n waveforms generated from a representative measured waveform with added Gaussian white noise of distribution and amplitude range characteristic of the background pre-trigger sampling interval (Reference GadesGades, 1998).
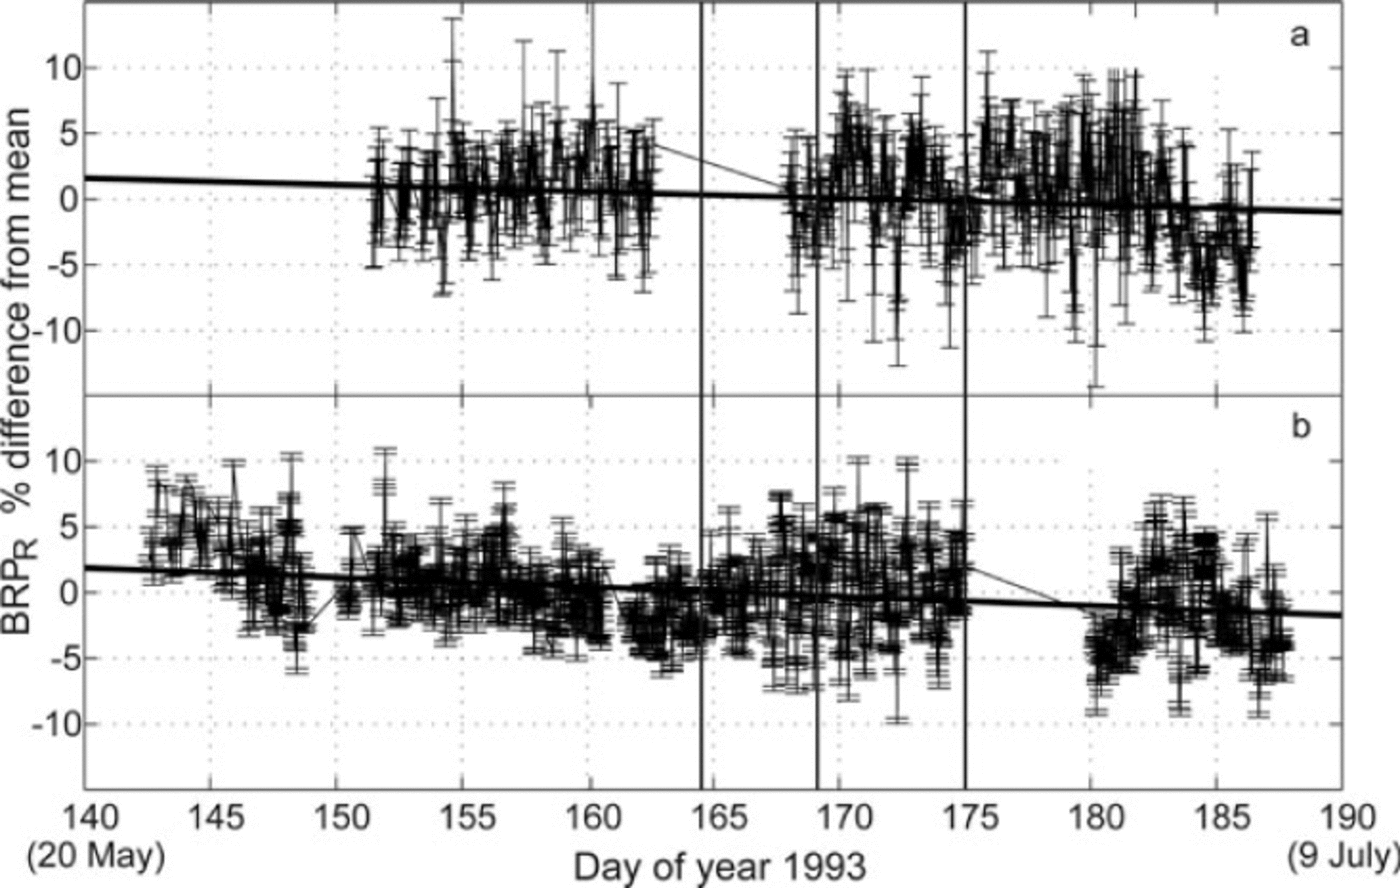
Results for BRPr in Figure 8 show that it is less than about ±5% of the mean BRP. At RES16U, the linear least-squares best fit for BRPr over time suggests a declining trend in amplitude of only ~3.2% with root-mean-square (rms) error of 4% over the measurement period. The corresponding values are amplitude of 2.2% with rms error of 5% at RES14. Evidently, any actual temporal variations in bed reflectivity must be less than ±5% throughout the record time-span at both km-14 and km-16. Uncertainty in BRPr (error bars in Fig. 8) indicates that any actual variations of ±5% or less cannot be discriminated with confidence. In any case, the suggested low-level fluctuations and trends (Fig. 8) are not clearly correlated with changes in speed (Fig. 3).
Residual bed reflection power (BRPR Eqn RES14 (a) and RES16U (b) zero lag correlation of bed reflection pulse with the mean pulse for hourly measurements. Vertical lines show times of lake drainage.
4.1.2. Bed reflection phase
Figure 9 shows the zero lag correlation of the bed reflection pulse relative to the mean reflection pulse using the fixed time window centered on the mean pulse. The extremely high degree of correlation (~0.99) at both RES14 (Fig. 9a) and RES16U (Fig. 9b) indicates that the reflected pulse timing and shape were nearly constant over the measurement period at both sites.
RES14 (a) and RES16U (b) zero lag correlation of bed reflection pulse with the mean pulse for hourly measurements. Vertical lines show times of lake drainage.

An immediate conclusion of the consistency of the bed return pulse is that there are strong limits on changes in the transmitted pulse, ice thickness, mean wave speed through the ice and phase spectrum of the bed reflectivity. The first three are expected from our instrumentation, the consistent timing of returns and the correlations in amplitude of power returns discussed above. To quantify limits on changes in phase of the bed reflection, Figure 10 shows the phase spectra of the mean pulse and the least correlated pulse at RES16U calculated using the discrete Fourier transform. The phase difference is <0.01 rad for the pulse center frequency (~2.2MHz) and <0.05 rad over the full frequency range of usable power return (~1 to ~5MHz). Results are similar at RES14. The implication is that changes in the phase of bed reflection are <0.05 rad.
(a) Phase spectrum of mean record (solid curve) and least correlated record (day 182.8, dashed curve) from RES16U. (b) Phase difference between the mean record and record from day 182.8.

4.2. Temporal variations along cross profiles
A similar path of analysis to that developed in Section 4.1 was followed to account for changes in instrumental and surface conditions at the 13 fixed measurement locations on the cross profiles (Figs 2 and 4). Results for BRPr (Eqn (2)) are shown in Figure 11. The only difference in method was calculation of bed return power as the peak-to-peak amplitude of the pulse squared (linearly related to BRP from Eqn (1) as verified empirically using the data from RES16U where consistency of the bottom pulse permits comparison). This evaluation was motivated because sampling over the full length of the bed reflection pulse was less clear at some locations and times (partly due to the lower power of 5 MHz antennas).
Residual bed reflection power (BRPR, Eqn (2)) at the poles along profiles km-14, km-16 and km-18 (from top to bottom) ordered left to right as if looking down-glacier. Values and uncertainties are plotted as percentage difference from the mean. Measurement positions (Fig. 2) are given in meters south of glacier center. km-14 and km-16 measurements were made on days 154.5, 158.5, 161.5, 166.5, 171.6 and 175.5. km-18 measurements were made on the first four of those days. Vertical lines show times of lake drainage.
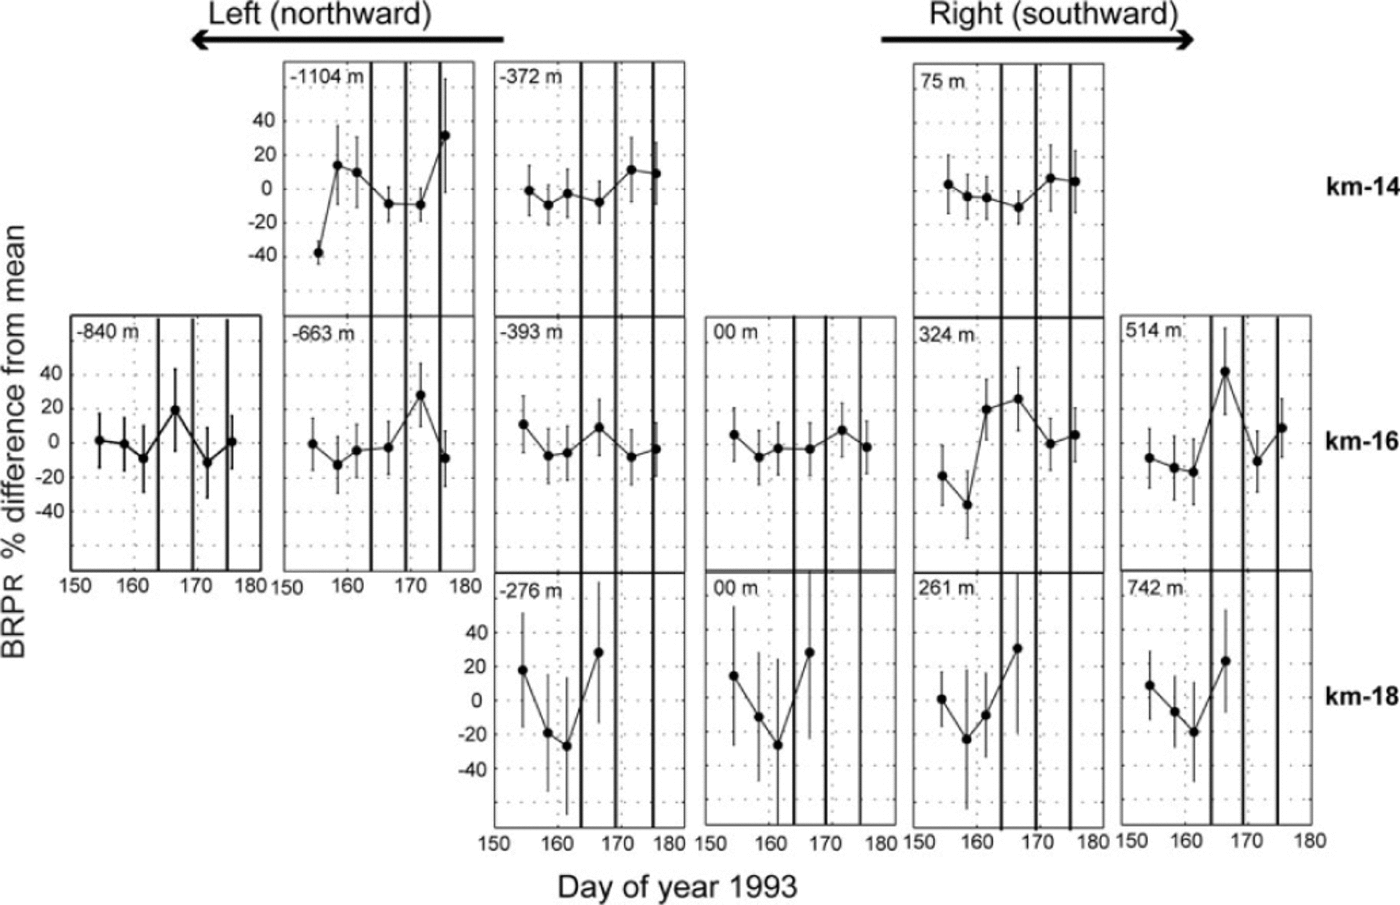
Uncertainties are larger than those found at RES16U and 14. In addition to a less well-defined bed reflection, there are other factors associated with identifying stable internal reflectors: a much smaller number of records (4-6 compared to 640-1700);smaller ice thickness at most locations, with correspondingly smaller interior region (e.g. along km-16 (Fig. 4)); and imperfect repositioning at markers, compromising exact duplication of the distribution of internal reflectors. As a result, the first principal component E1 of the interior zone describes a smaller fraction of the total data variance. Uncertainty along km-18 was especially large (E1 accounting for <40% of variance), where difficult snow conditions reduced access to four measurements. At km-14 and km-16, results were generally better defined (E1 accounting for >60% of variance).
Locations along the km-14 and km-16 lines show that change in BRPR in the central portion of the glacier was below a detection limit of about ±10%. This is consistent with results from RES14 and RES16U near the center, which impose even smaller limits on change.
In contrast, changes in BRPr can be recognized at five locations, all away from the center: km-14-1104m showed upward shifts of about 35-50% on days 158.45 and 175.45; km-16-840 m and + 514 m showed temporary highs on day 166.5;km-16-663m showed a temporary high on day 171.55;and km-16 + 324 m showed an upward jump (~60%) on day 161.45.
Although km-14 -1104 m and km-16 + 324 m suggest an increase in reflectivity over the sampling interval, a coherent pattern of seasonal change is not obvious. Instead, there are shifts suggesting isolated events. There is no clear one-on- one relationship with lake drainage, but an association could be possible if lags are involved.
Nolan and Echelmeyer (1999a, Fig. 10) defined a sequence of three periods of anomalous seismic reflection related to the three lake drainages. Radar observation days 154.5, 158.45 and 161.45 preceded any anomalous seismic reflections. Days 166.5 and 171.55 were during anomalies I and II. Day 175.45 was close to the end of anomaly III. There is no clear correlation of radar observation with these seismically anomalous or non-anomalous times. It is noteworthy that no large radar changes were found at km- 16-393 m, which was close to UAF N1 where the most pronounced seismic anomalies are thought to have been centered (Reference Nolan and EchelmeyerNolan and Echelmeyer, 1999a).
Unfortunately, the time sampling is not dense enough to explore a correlation between BRPR and short-term dynamic events (Fig. 3). The spatial sampling does show that changes in bed reflectivity occurred away from the center, and may have been restricted to non-center locations during the interval of observation.
In view of the clear difficulties of detecting changes at fixed locations, it is not surprising that it is even more problematic to draw conclusions about changes in bed reflectivity from records taken while in motion during profiling. The data quality for detecting temporal changes is lower for reasons stated earlier. The records do not have the degree of correlation needed for the above kind of analysis. Quantification of changes may be possible with a more complex integrated temporal-spatial analysis, which is beyond the scope of this paper.
5. Synthesis Of Bed Conditions
5.1. Spatial context
We focus discussion on km-16, where most data from our radar and UAF studies were concentrated (Fig. 4). Reference Truffer, Motyka, Harrison, Echelmeyer, Fisk and TulaczykTruffer and others (1999) suspect that D1 and N1 are in the Denali Fault zone with different rock terranes to the north and south. The seasonal transfer of basal shear stress from north to south and generally higher stress in the south found by Reference Amundson, Truffer and LüthiAmundson and others (2006) indicate significant mechanical differences that could be associated with a cross-glacier transition in basal zone composition and/or structure near D1 (Fig. 4). The cross-valley topography radar profiling reveals some asymmetry, with lower slope on the left (north) compared to the right side. The right side shows reflections from longitudinal off-profile variations in topography along the valley's south side. (km-14 shows similar asymmetry (Reference GadesGades, 1998, Fig. 4 .2);km-18 (Reference GadesGades, 1998, Fig. 4 .4) is more symmetric.)
We are concerned here primarily with spatial variations in reflections from the bed. There are four bright patches ~100m wide in the central parts of the profile (deeper than ~5 ms, roughly between -600 and +400 m). One is in the center. The other three are on the left (north) side of the glacier centered at approximately -550, -350 and -150 m. Amplitudes of bed returns exceed 100% above the background trend associated with varying travel time. These four bright patches stand out in the profiles from all available times. Farther from the center, the strength of returns is heterogeneous on both sides.
Both N1 and D1 are associated with bright patches. These are locations where till has been detected seismically (Reference Nolan and EchelmeyerNolan and Echelmeyer, 1999a) and directly sampled in UAF boreholes (Reference Nolan and EchelmeyerNolan and Echelmeyer, 1999a; Reference Truffer, Motyka, Harrison, Echelmeyer, Fisk and TulaczykTruffer and others, 1999) (7 m thick at N1 and 4.5 m thick at D1). As discussed below, till can be highly reflective compared to most bare rock. Thus, especially reflective till may contribute to the relative brightness at these two locations, with the caution that focusing associated with the concave-upward bed at D1 must also make a contribution here.
We keep in mind that the presence of till has not been demonstrated directly at any locations other than N1 and D1 including the other UAF boreholes, where sub-ice sampling was not done (Reference Nolan and EchelmeyerNolan and Echelmeyer, 1999a; Reference Truffer, Motyka, Harrison, Echelmeyer, Fisk and TulaczykTruffer and others, 1999). We suspect the presence of highly reflective till at other bright spots, and also suggest that the till cover is not homogeneous or necessarily pervasive given the substantial variability in brightness.
5.2. Temporal variations of basal water
We now examine two related questions about temporal changes in bed reflectivity:
-
1. What are the limits to changes in water at central locations where bed reflectivity changed by <5%?
-
2. How big must the changes in water be to enable changes of order 50% in reflectivity similar to those observed at some off-center sites?
Actual mean thicknesses of water on extensive areas of glacier beds are not well known for either hard or soft beds, but are estimated to be in the range 10-3 to 10-1 m based on observations of surface uplift driven by basal water storage changes, local observations in boreholes and theoretical considerations of water flow and mechanical equilibrium (Reference Fountain and WalderFountain and Walder, 1998). Exceptions are localized concentrated flow channels and subglacial lakes. Electrical conductivity of water in the 1993 summer outflow of BRG had mean ~3 x 10⁻³Sm-1 and maximum ~8 x 10⁻³Sm-1 (Reference Raymond, Benedict, Harrison, Echelmeyer and SturmRaymond and others, 1995). We focus on ranges of water thickness d up to 0.1 m and electrical conductivity a up to 10-2 Sm-1.
In broad form, bed morphology involves ice, water of varying d and a and substrate of rock or till-on-rock. A substrate permittivity range from about 7 (dry rock) to 25 (high-porosity, water-saturated till) is relevant. A related range of substrate electrical conductivity is 10-5 to 10-4 Sm-1 (dry rock) to 10-3 to 10-2 Sm-1 (highly conductive till). These ranges are based on the dielectric properties of water and rock materials, mixing models (Reference LooyengaLooyenga, 1965) and empirical data (Reference Keller and FrischknechtKeller and Frischknecht, 1966) as discussed by Reference GadesGades (1998). With the foregoing context we consider both rock and till substrates. For practicality, we do not explicitly explore a range of till thicknesses over rock, although important implications are mentioned below. Nor do we consider stratified till including the possible presence of ice in pores, as found by Reference Truffer, Motyka, Harrison, Echelmeyer, Fisk and TulaczykTruffer and others (1999).
We examine a three-layer model (Reference McIntyre and AspnesMcIntyre and Aspnes, 1971;Reference Born and WolfBorn and Wolf, 1980;Reference GadesGades, 1998) of ice on a substrate with an intervening water layer of electrical conductivity a and uniform thickness d approximating irregular water patches and passageways (Reference McIntyre and AspnesMcIntyre and Aspnes, 1971;Reference Chan and MartonChan and Marton, 1974).
As a reference baseline, we first assume a non-conducting substrate, which enables simple analysis. When the water layer is thin compared to the radar wavelength in it (~6.4 m for 5 MHz, larger for 2 MHz) and to the skin thickness beyond which the substrate becomes invisible (~5 m in water with a ≈ 5 x 10⁻³ Sm-1 for 2-5 MHz), the full theory can be approximated by a linearized thin-film theory (Reference McIntyre and AspnesMcIntyre and Aspnes, 1971, Eqn (28)) in the form

where R is power reflectivity, R0 is the background R in the absence of the layer and F0 is a constant. Both R0 and F0 depend only on the properties of the ice and substrate. Change in R caused by the water layer is proportional to ad,which represents the layer-parallel conductance per unit width of the layer.
As the permittivity contrast between ice and substrate increases: R0 increases; F0 decreases; and R0F0 varies only weakly over the relevant range of substrate permittivity, 7-25. R0F0σd gives the absolute effect of a water layer, which has a corresponding weak dependence on substrate permittivity. F0σdgives the fractional change in R caused by the layer in comparison to its absence. It declines with increasing substrate permittivity.
Rearranging Eqn (3) gives the sensitivity of the fractional change in R to a change in Δ(ad) from an initial condition ad as

Because of the dependence on ad, sensitivity to the amount of water d is higher when a is relatively large. Correspondingly, when d is large, sensitivity to σ is enhanced.
We first consider a substrate of permittivity 8 (e.g. dry rock). Figure 12 shows both R (solid curves) and phase P(dashed curves) calculated from the full model depending on water thickness d (up to 0.1 m) and electrical conductivity a (up to 10-2 S m-1). Starting from the assumed bed with no water layer (R = 0.052), fractional change in R approaching 6 can be achieved in the displayed range of d and a. With reference to the linearized approximation R0 = 0.052, F0 = 6.2 x 10³S-1, R0F0 = 0.32 x 10³S-1, and Eqn (3) gives a close approximation to power reflectivity shown in Figure 12.
Contours of power reflectivity R(solid lines; interval 0.1) and phase P(dashed lines; radians interval 0.1) for 2MHz wave impinging on a water layer of given thickness and conductivity situated between ice (permittivity 3.17) and solid rock of assumed real permittivity 8 (intermediate between 7 for limestone and 11 for basalt (Reference JonesJones, 1987)). Power reflectivity with no water layer (0 thickness) is 0.052. Dark-gray region shows power reflectivity of 0.1_0.05 (_5%). Light-gray region shows phase of –0.045_0.015 rad, which is the maximum variation expected for 2MHz center frequency (Fig. 10). The area in common between the gray regions is the allowable combined variation in water-layer thickness and conductivity for the specified set of initial conditions (in this case, R= 0.1 and P= 0.045).

The pattern of R calculated for a substrate permittivity of 25 (e.g. possibly realized by wet porous till with clean pore- water) looks closely similar to Figure 12 for permittivity 8. The difference is the addition of ~0.18 to each R contour value, which accounts for a higher bare substrate reflectivity of 0.23 compared to 0.05. The fractional change in Racross the range is ~1.4 compared to 6.2, so sensitivity is lower by a factor of ~4.4. The linearized approximation (Eqn (3)) is given by R0 = 0.23, F0 = 1.4 x 10³S-1 and R0F0 = 0.31 x 10³S-1.
Figure 13 shows the changes in ad required for AR/R of less than 0.05 (5%) and more than 0.50 (50%) depending on the initial σd based on Eqn (4). The loss in sensitivity going from substrate permittivity 8 (heavy lines) to 25 (light lines) is evident. However, in either case and through the intervening range of permittivity, 50% changes in R can be produced by changes in σd within the expectations of reasonable variation. Correspondingly, changes in R less than 5% restrict changes in ad to be a small fraction of the range.
Upper limit on changes in σd for ΔR/R ≤ 0.05 (solid lines), and lower limit on changes in σd for ΔR/R ≥ 0.05 (dashed lines) for permittivity 8 (heavy) and 25 (light).

For specific illustration, consider a constant σ = 3x 10⁻³Sm-1 (the stream outflow average in summer) and a range of initial d of 0.00-0.10 m. To obtain ΔR/R>0.5, Δd would have to be more than 0.027-0.077 m for permittivity 8, or 0.122-0.172 m for permittivity 25. To restrict ΔR/R to <0.05, Ad would have to be less than 0.0027-0.0077 m for permittivity 8, or 0.012-0.017 m for permittivity 25.
When emphasis is on detecting changes in the amount of water d, the co-effect of σ prevents unique interpretation unless σ can be constrained. For example, adding relatively clean water to the base could just dilute ionic solutes and leave σd and R unchanged (not probable, but conceivable). Phase information can help limit this ambiguity, since its dependence on d and σ can have a different pattern (e.g. Fig. 12 , light filled region).
With this three-layer morphology and typical σ summer water: (1) fractional changes in power reflection of <5% are quite restrictive to changes in d at the sub-cm level for low bed permittivity and a few centimeters at high permittivity; (2) fractional changes in power reflection of 50% are quite possible with glaciologically reasonable changes in d of <10 cm to a few tens of centimeters. The difference between near-center and off-center reflection changes would indicate more active hydrological changes away from the center.
Consideration of electrical conductivity in the substrate presents a substantial difficulty for conclusions about (1) and (2). Based on the empirical formula of Reference Keller and FrischknechtKeller and Frishknecht (1966), till with high porosity (0.4) saturated with conductive water like the minimum for summer outflow, σ = 8 x 10⁻³Sm-1, would have a bulk conductivity σ =3x 10⁻³Sm-1 (like the mean summer outflow). Even higher pore-water conductivity and correspondingly higher bulk till conductivity could be possible given the relatively long residence time in contact with rock of pore-water in till compared to through-flowing meltwater.
We have not found a simple analytical description of the relationship of R to d and σ for a water layer on a conductive bed. The relevant basic features derived from the full model are nevertheless simply described for the high end of the range. When conductivity for the substrate is similar to or higher than σ = 3 x 10⁻³Sm-1, R of the substrate alone can exceed 0.5. Correspondingly, R varies <0.2 in the full reference ranges of d up to 0.1 m and σ up to 10-2Sm-1 and phase varies by <0.1 rad. When water-layer and substrate conductivity are similar, there is a loss of sensitivity to changes in d. When σ of the water layer is less than substrate conductivity, R decreases (weakly) with increasing d. If substrate conductivity were this high over a thickness of meters, the radar would not detect even modest changes in water. Relative to the above questions: (1) changes in water at the decimeter scale could go undetected even with the 5% detection level for power reflection; and (2) fractional changes in power reflection of 50% require exceptionally large changes in water amount of more than a few decimeters.
The detection of changes in some places shows that locally the bed is not mantled with till so thick and conductive as to hide hydrological influence on reflections. Indeed, very high-porosity, dilated till is likely to be restricted to a thin layer on top of or in till that is partially consolidated and possibly stratified (Reference Truffer and HarrisonTruffer and Harrison, 2006). Known full till thickness of 4-7 m cannot be considered either thick (obscuring underlying rock) or thin (much thinner than the wavelength, ~12 m for 5 MHz in high-porosity till), allowing interference of reflections from the top and bottom interfaces with large changes in reflectivity over quarter-wavelength changes in thickness. A spectrum of substrate reflection characteristics between bare rock and thick conducting till can be expected (Reference GadesGades, 1998), with corresponding ambiguity for answering (1) and (2).
From this perspective, the difference in the central band of temporally constant reflectivity compared with variable locations to the side could have more to do with differences in bed morphology than hydrological driving. Away from the central zone, there are locations not mantled with till so thick and conductive as to hide hydrological effect on reflections, and changes in water amount are 10cm or larger if significant till is present. In the central zone, UAF boreholes show till is very likely at radar measurement points, but without information about its electrical properties it is difficult to place upper limits on changes in the amount of water between till and ice.
In combination we conclude that the center and much of the north side of the glacier is probably mantled by conductive till over which hydrological activity is not visible with our low-frequency radar methods, and that there are local places on both sides, perhaps more pervasively in the south, where the bed is both morphologically different and hydrologically active.
5.3. Changes in till structure
A relevant question is the role of changes in the till itself induced by normal and shear stress fluctuations forced by water and ice acting on its upper surface. Diffusion of pore- water through till can affect seasonal change in speed (Reference Truffer, Echelmeyer and HarrisonTruffer and others, 2001). Low hydraulic diffusivity of till limits pore-water change through the full thickness on the sub-daily timescale of lake drainage and motion events, so changes in the till structure are expected to be concentrated in thin zones at the upper surface or possibly inside, involving only local water transfer. On the basis of the foregoing discussion, such changes would be difficult to detect in conductive till.
However, we are motivated to address whether the radar can detect changes in the full thickness of the till proposed to explain the anomalous seismic reflections associated with lake drainages (Reference Nolan and EchelmeyerNolan and Echelmeyer, 1999b). The central feature is a small dilation of the low-permeablility, normally water-saturated till at nearly constant water content with exsolved gas filling the added void space. An estimate of the upper limit of dilation is 0.02 volume fraction based on uplift of 0.1m or less spread over at least 5 m of till thickness. Linear mixing models (e.g. Reference LooyengaLooyenga, 1965) indicate an addition of <0.02 volume fraction of gas-filled void space causes reduction in permittivity by <0.1 to 0.8 for original bulk permittivity of 7-25. The corresponding fractional reductions in R are 0.03 in either case. These changes are too small to be detected by the radar. Reduction caused by electrical conductivity change would also be small and undetectable on the same basis, noting that high nonlinearity near a percolation threshold would not be expected for a small volume fraction of the insulating gas bubbles. Thus, this kind of change in the till could not be disallowed or confirmed by the radar measurements, even in the central part of the glacier where changes in radar reflection are constrained to be very small. The proposed mechanism to excite dilation is reduction of the normal stress on the top of a significant area of till by local over- pressurization of water in a network of passageways. The pressurization itself or modest expansion and thickening of the passageways would also not be visible with the radar.
6. Conclusions
For low-frequency (2-5 MHz) radar, the coupling of surface- deployed, resistively loaded dipole antennas strengthens with increasing water content of the snow and/or nearsurface weathered ice. An implication is that wet surface conditions are favorable for detecting weak subsurface reflections such as the bed beneath deep ice. A wet surface also increases the amount of direct current induction in the receiving antenna as well as its rate of decay, which is a disadvantage for detecting shallow reflectors, especially if they are weak. Fluctuating surface wetness poses major problems for monitoring temporal changes in internal and bed reflectivity at any depth. It is possible to correct for varying antennas coupling and other system variations by identifying consistent internal reflectors that can be used for relative calibration of the system and antenna coupling. Principal component analysis provides one such means.
On BRG, below the near-surface zone, there was a high degree of spatial correlation of internal scattering and bed reflectivity, indicating a very stable dielectric structure both internal and at the bed with undetected influence from variable water content or conductivity. Time-independent travel times and corresponding constancy of radar wave velocity also indicate that changes in internal water storage must be small or local.
In the deepest part of the glacier cross section, bed reflectivity varied by less than 5% in power and 0.05 rad in phase through the spring speed-up and summer slowdown and related motion events induced by lake drainages. In contrast, changes in bed reflectivity of up to 50% were identified at some locations away from the center.
Theoretical analyses indicate that changes in reflectivity from a rock bed of <5% constrain equivalent basal water- layer thickness changes to centimeter scale or less. The presence of conductive till at the bed degrades the tightness of constraint to decimeter scale or more. Changes in bed reflectivity of up to 50% suggest that there was probably not thick conductive till in those locations, and the changes were caused by centimeter to decimeter changes in water thickness.
The cross-profile topography and reflection brightness together with locations of identified reflection variability suggest that the till cover is widespread, but not homogeneous or necessarily pervasive.
The widespread presence of till, especially under the central locations chosen for high-time-resolution monitoring, prevented detection of changes in basal hydrology and timing in relation to lake drainages and glacier speed changes.
The presence of highly reflective basal till will generally challenge the combined spatial/temporal detection of subdecimeter changes in basal water thickness under thick temperate ice with radar methods.
Acknowledgements
This project was supported by US National Science Foundation (NSF) grant Nos. 0PP-9122540 and OPP- 0520541 to the University of Washington. Support to the University of Alaska by NSF grant No. OPP-9122783, and the resulting collaboration with K. Echelmeyer, M. Nolan and C. Larsen was essential for successful execution of the fieldwork. Martin Truffer provided considerable help in establishing the locations of our measurements relative to subsequent measurements by UAF. Three reviewers prompted improvement in presentation and balance of the manuscript.



