


Women still occupy disproportionately fewer seats at the tables where critical decisions are made, especially in executive governance. While women’s representation in national parliaments has increased to 27.1% globally in 2025, the share of women heading ministries stands at 22.9%, and only 9.8% of heads of state or prime ministers are women (World Economic Forum, 2025). This disparity extends from national to local municipal arenas, manifesting a profound gender gap in access to government positions. Much of the existing research has focused on barriers to women’s selection as political leaders, such as who gets elected or formally appointed (Barnes and O’Brien, Reference Barnes and O’Brien2025). But in parliamentary democracies, gaining executive power may also depend on post-electoral coalition building that determines who joins the governing team.
While the reasons for women’s underrepresentation are multifaceted and deeply entrenched, it remains a challenge. Prior research has offered valuable insights into the various political institutions that impact women’s access to high-level political positions. These include the electoral system (Tremblay, Reference Tremblay2012); the structure and rules of legislative committees (Heath, Schwindt-Bayer and Taylor-Robinson, Reference Heath, Schwindt-Bayer and Taylor-Robinson2005; O’Brien, Reference O’Brien2012); the system of government (Krook and O’Brien, Reference Krook and O’Brien2012); the types of ministerial systems (Claveria, Reference Claveria2014); or political parties’ formal and informal practices (Fox and Lawless, Reference Fox and Lawless2010; Verge and De la Fuente, Reference Verge and De la Fuente2014; Folke and Rickne, Reference Folke and Rickne2016; O’brien and Rickne, Reference O’brien and Rickne2016). Moreover, even when women are included in executive governments, they are often appointed to specific types of ministries, typically those perceived as less central to power, such as education, health, or social affairs, rather than key portfolios like finance, defense, or interior (e.g. Barnes and O’Brien, Reference Barnes and O’Brien2025). This selective inclusion underscores that representation is not just about presence in office, but about where within government power is exercised.
Recent studies explore how gender influences coalition formation by examining how the gender of party leaders affects their opportunities to exert political power during post-election negotiations. For instance, Huidobro and Falcó-Gimeno (Reference Huidobro and Falcó-Gimeno2023) show that women often face barriers to securing the mayoralty even after electoral victories, and instead are incorporated into governing coalitions in less prominent roles. This finding points to a complex dynamic: women may be seen by their political peers as competent collaborators, but are less often entrusted with full leadership authority. Yet, it remains unclear whether and how the gender of potential coalition partners shapes politicians’ preferences during government formation.
This paper addresses this question by shifting attention from the final outcomes of coalition formation, such as who leads the government, to an earlier and less visible stage: the selection of coalition partners. Coalition governments are collaborative teams created in contexts of high uncertainty where politicians must choose from a pool of political opponents. In such scenarios, politicians are motivated to succeed while minimizing risks by assessing disparities among their potential partners in terms of governance competence, compatibility, reliability, or personal affinity. In these settings, individual preferences provide insight into how political actors are perceived, and whose selection is considered desirable. I explore such preferences, with a focus on whether and how gender biases shape who is seen as suitable governing allies.
To do so, I theorize how women politicians may be seen as desirable coalition partners due to perceived collaborative and governance skills shaped by gender stereotypes. These stereotypes emphasize their honesty and commitment to democracy, making them appealing in contexts like coalition formation, where loyalty and trustworthiness are crucial. As a result, politicians may prefer women as coalition partners to reduce costs, avoid conflict, and govern effectively. Indeed, the nuanced preferences held by politicians regarding their prospective coalition partners represent a pivotal and often overlooked dimension in the complex process of government formation.
Analyzing politicians’ preferences over potential partners presents two methodological challenges: first, these preferences are not observable in real-world negotiations; and second, the gender of potential coalition partners is often correlated with other factors such as party affiliation or political experience, making it difficult to isolate its effect. To solve this, I conducted a conjoint experiment in an original survey of 979 Spanish Mayors between June 2018 and January 2019. In the experiment, mayors are placed in a post-election scenario where they have won and must choose a coalition partner. This setup helps to capture the preferences of potential gatekeepers, those who, from a position of power, decide who they prefer to govern with. Respondents are presented with profiles of hypothetical candidates and asked to choose the one they would prefer to govern with. Each profile varied randomly across six characteristics, including gender, party size, ideological distance, and prior experience. This design allows me to isolate the role of gender in shaping coalition preferences while holding other traits constant. To examine the potential mechanisms after revealing their preferences, mayors are asked to rate the hypothetical candidates based on their perception of similarity in political positions, ease of communication, ability to govern, and trust. This design allows for measuring politicians’ evaluations of the candidates and to what extent this informs their decisions.
My findings reveal that the gender of potential coalition partners influences mayors’ preferences when selecting a party leader with whom to form a coalition. On average, mayors prefer forming governments with women. This preference is primarily driven by center and left-leaning mayors, which also constituted the majority of local officeholders in Spain during the period under study. Further analysis suggests that female candidates are often perceived as better communicators and more capable partners, particularly by male and older mayors, who may be influenced by gendered expectations about women’s collaborative style. Additionally, politicians prioritize coalition partners based on political alignment, and trust, often placing less emphasis on governing competence. This suggests a strategic trade-off, where compliance and reliability are valued over capability. The findings illustrate the complex factors shaping coalition choices, including ideological alignment and political trust, with expediency playing a significant role in partner selection.
This experiment makes two contributions. Methodologically, it demonstrates that it is viable to study the logic behind politicians’ preferences through surveys and applies a novel way to study mechanisms. To the best of my knowledge, no previous conjoint experiment has analyzed the mechanisms driving why some candidates are preferred over others by adding simple follow-up questions. Substantively, this research presents evidence that politicians have meaningful preferences about the personal traits that they look for in potential coalition partners. This finding opens up a new research agenda centered on the relevance of politicians’ characteristics in shaping coalition formations.
This line of inquiry carries important implications for understanding gendered access to executive power, with normative consequences for the descriptive and substantive representation of certain social groups. Leaders’ preferences when selecting coalition partners can lead to scenarios where certain profiles are relegated to specific roles within governments, perpetuating situations of inequality in access to positions of power. Increasing knowledge of these inequalities can help institutions create fairer and more egalitarian process designs to ensure that everyone has equal access to power and the selection of the most appropriate leaders.
1. Unexplained variation on governments formation
Understanding who is selected into government, and why, is crucial for explaining both the performance and the stability of governing coalitions. In parliamentary democracies, political selection occurs at different stages, and one of the most important is government formation. Our knowledge of how leaders come to hold the reins of power has advanced significantly over the past decades. In the case of parliamentary democracies, a prolific stream of literature has crystallized into a whole subfield of government formation studies (Martin and Stevenson, Reference Martin and Stevenson2001).
Politicians leading government formation processes have rarely been the focus of analysis. Instead, most existing work considers party motivations and institutional factors as the main determinants of participation in coalition governments (e.g. Laver and Schofield, Reference Laver and Schofield1998; Bäck and Dumont, Reference Bäck and Dumont2008). Parties have office and policy-seeking motivations and mainly strive to gain a place in government (e.g. Riker, Reference Riker1962). Party size—i.e. the number of seats in the legislative chamber—is the key determinant of party’s bargaining power in the formation process. The largest party has the highest chance of reaching office, joined by one or more parties that can form a minimal winning coalition (e.g. Tavits, Reference Tavits2008; Glasgow and Golder, Reference Glasgow and Golder2015). Parties, however, must be ideologically aligned to reduce the political costs of bargaining and produce desirable policies. Parties prefer to build a government that is ideologically homogeneous and survives as long as they remain ideologically similar (e.g. Baron, Reference Baron1991). Aspects such as the existence of institutions such as the investiture requirements or the formateur role also give parties an advantage in the negotiation over who gets access to political power (e.g. Ansolabehere et al., Reference Ansolabehere, Snyder, Strauss and Ting2005; Indridason, Reference Indridason2011). Moreover, incumbency and other cultural and social norms have been shown to be a source of power in these processes (e.g. Glasgow, Golder and Golder, Reference Garrett, Golder and Golder2011; Fujiwara and Sanz, Reference Fujiwara and Sanz2020).
Political coalitions, however, are established for reasons beyond institutional rules, party size, or ideological alignment. Recent research on coalitional presidentialism in Brazil shows that coalition dynamics can restrict women’s access to cabinet positions: although presidents may be willing to appoint women, coalition partners rarely put them forward to fill the portfolios they receive (Gatto, Dos Santos and Wylie, Reference Gatto, Santos and Wylie2022). In contrast, Huidobro and Falcó-Gimeno (Reference Huidobro and Falcó-Gimeno2023), focusing on party leaders, finds that women are incorporated into coalition governments, but typically in subordinate roles, even after winning elections. Although these studies differ in institutional focus, both underscore that gendered patterns of inclusion and exclusion are not solely determined by formal rules, but also shaped by the decisions and strategic behavior of political actors themselves. What remains underexplored, however, are the preferences and personal characteristics that inform those decisions, factors that may be central to understanding how gender influences coalition-building and access to executive power. If political leaders play such a central role in shaping coalition outcomes, then it is essential to ask them directly: whom do they want to govern with, and why?
Political actors involved in coalition governments must therefore make strategic decisions under uncertainty, often with limited information about potential partners. These governments function as work teams designed to execute government tasks and are created in contexts in which potential team members do not know each other well. Under the assumption that politicians are principally motivated by retaining office while maximizing power, their preferences are molded by anticipations surrounding the capability of potential partners to collaborate and engage in successful collaboration effectively. Considering that politicians must often select coalition partners from a pool of political rivals, they probably prefer individuals with whom they calculate they are most likely to succeed, trying to minimize the risks of a coalition government.
Scholars in fields such as social psychology, management and organizational studies contend that people rely on social cues that pertain to the potential competence of their task partners (e.g. Kurzban and Leary, Reference Kurzban and Leary2001; Magee and Galinsky, Reference Magee and Galinsky2008). Accordingly, politicians traits may signal information about their capacity and intention to engage in successful collaboration (Driskell and Mullen, Reference Driskell and Mullen1990; Tsai et al., Reference Tsai, Melia and Hinsz2020). Political science also identifies these mechanisms from party gatekeepers in the selection of candidates. Party selectors prefer candidates with specific characteristics that determine how much time they will spend in party work (Norris and Lovenduski, Reference Norris and Lovenduski1995) or how they collaborate during legislative activity (Barnes, Reference Barnes2016).
Drawing upon this literature, my expectation is that politicians make strategic choices when selecting coalition partners. These choices are influenced by perceptions of effective and efficient governance, including ideological proximity, reduced interaction costs, trustworthiness, and governing capabilities. Within this contextual framework, the paper goes a step further by asserting that political leaders harbor discernible predilections concerning the gender of potential coalition collaborators during the intricate process of shaping governments formation, which they consider along with other factors, such as political or ideological ones.
2. Why might politicians prefer female coalition partners?
A growing body of research is examining a compelling hypothesis about gender dynamics in politics: the calculated strategic utilization of women by politicians. This perspective posits that certain actors might strategically harness the presence and involvement of women in political roles to secure various advantages. These advantages could encompass, among other things, bolstering the credibility of their political parties or organizations, enhancing their own reputations as inclusive leaders, or even strategically mitigating certain controversies (Valdini, Reference Valdini2019).
Parties, for instance, exhibit a greater propensity to amplified female representation in party lists and embrace gender quotas when electoral competition escalates, particularly when the discourse around gender equality is fervently contested to appeal to diverse voter groups, including women (Folke and Rickne, Reference Folke and Rickne2016; Weeks, Reference Weeks2018). Gender diversity elevated to a strategic instrument for political parties to project a more progressive and inclusive image (Besley et al., Reference Besley, Folke, Persson and Rickne2017). Politicians have strategically aligned themselves with women’s issues to reap electoral advantages (Abou-Chadi et al., Reference Abou-Chadi, Breyer and Gessler2021). This perspective reflects a calculated approach to leverage the strengths associated with women’s presence in political spheres, ultimately aimed at fortifying leaders’ positions and broader political agendas.
In evaluating the gains inherent in forming a coalition with a political adversary, female politicians emerge as favored coalition partners, benefiting from the prevailing perception of their propensity for effective collaboration and ability to govern. Analyses of political performance suggest that women produce better welfare outcomes, secure more transfers from other levels of government and are more effective lawmakers than men (Anzia and Berry, Reference Anzia and Berry2011; Volden, Wiseman and Wittmer, Reference Craig, Wiseman and Wittmer2013; Brollo and Troiano, Reference Brollo and Troiano2016). Additionally, some research shows women legislator exhibit a greater proclivity toward consensus-building and collaborative efforts, particularly across party lines (e.g. Kennedy, Reference Kennedy2003; Weikart et al., Reference Weikart, Chen, Williams and Hromic2006; Volden, Wiseman and Wittmer, Reference Craig, Wiseman and Wittmer2013; Barnes, Reference Barnes2016). While the empirical evidence on whether women actually govern more collaboratively remains mixed, these gendered perceptions that women are more consensual, shaped by broader gender socialization processes, may render women desirable as potential coalition partners, regardless of whether such stereotypes reflect consistent behavioral differences.
Feminine stereotypes also influence perceptions of women in politics, with a focus on their perceived honesty and commitment to democracy (Valdini, Reference Valdini2019). Research on party loyalty states that female politicians are more honest, less corrupt, and less rebellious than males (Cowley and Childs, Reference Cowley and Childs2003; Escobar-Lemmon and Taylor-Robinson, Reference Escobar-Lemmon and Taylor-Robinson2008; Barnes and Beaulieu, Reference Barnes and Beaulieu2014; Clayton and Zetterberg, Reference Clayton and Zetterberg2021). All this may result from their marginalization in politics, their socialization role, and their tendency to avoid conflict and competitive environments (Lawless and Fox, Reference Lawless and Fox2010; Barnes, Reference Barnes2016). These qualities may be especially relevant in threatening and competitive contexts, such as coalition formation processes, where commitment and loyalty are highly valued.
These qualities and attributes associated with women can render them highly appealing choices for collaborative governance. My expectation is that politicians are likely to exhibit a heightened inclination toward selecting women as instrumental coalition partners in the pursuit of safe and successful governance. This preference stems from the perception that a female coalition partner possesses a special ability to reduce interaction costs in a coalition government since she is more consensual, more trustworthy, and capable of governing.
3. Research design
No previous research has ever directly asked politicians about their preferences when choosing government partners. To find out what these preferences are and assess the impact of gender on selecting government partners, I design a novel conjoint experiment, which is then included in an original survey of mayors in Spain. The experiment has two goals. The first is to study whether the gender of potential partners affects politicians’ preferences in forming governments, all the while attempting to determine which trait is most relevant. Second, the experimental design makes it possible to investigate the mechanisms by disentangling whether some politicians’ profiles are preferred over others in potential partners due to the expectation of communication, trustworthiness, and performance.
3.1. Background and data: Spanish local elections
Spain has a decentralized political system, where citizens elect local councils every four years in more than 8000 municipalities. Depending on their size, municipalities elect a certain number of councilors using a proportional representation system (PR) with closed party lists. The electoral system and the mayor’s decision on who to enter into coalition with determine institutional incentives for local government formation processes.Footnote 1 This system generates party fragmentation in municipal councils—an ideal scenario for the formation of coalitions.
The survey covers the 2,284 municipalities with more than 2000 inhabitants, clearly a sufficient number of cases to conduct a survey and a large-N quantitative analysis. Focusing on the local level provides me with many observations from within a single country, which allows me to hold constant potential confounding factors that vary across countries and might be relevant to explaining mayors’ preferences to select coalition partners. Additionally, the presence of women in Spanish politics has increased rapidly in recent decades, while it has stagnated in the top positions. Spain is one of the highest-ranked countries in the global ranking of gender equality in politics (World Economic Forum, 2025). Currently, almost half of the seats in the Spanish Parliament are held by female politicians, but only men have held the position of prime minister. Appendix A Figure A1 shows that the presence of women in the Spanish Parliament over the last three decades has increased at a similar rate to most European countries. Spain is situated near the average in this comparison, but still lower than in some places.
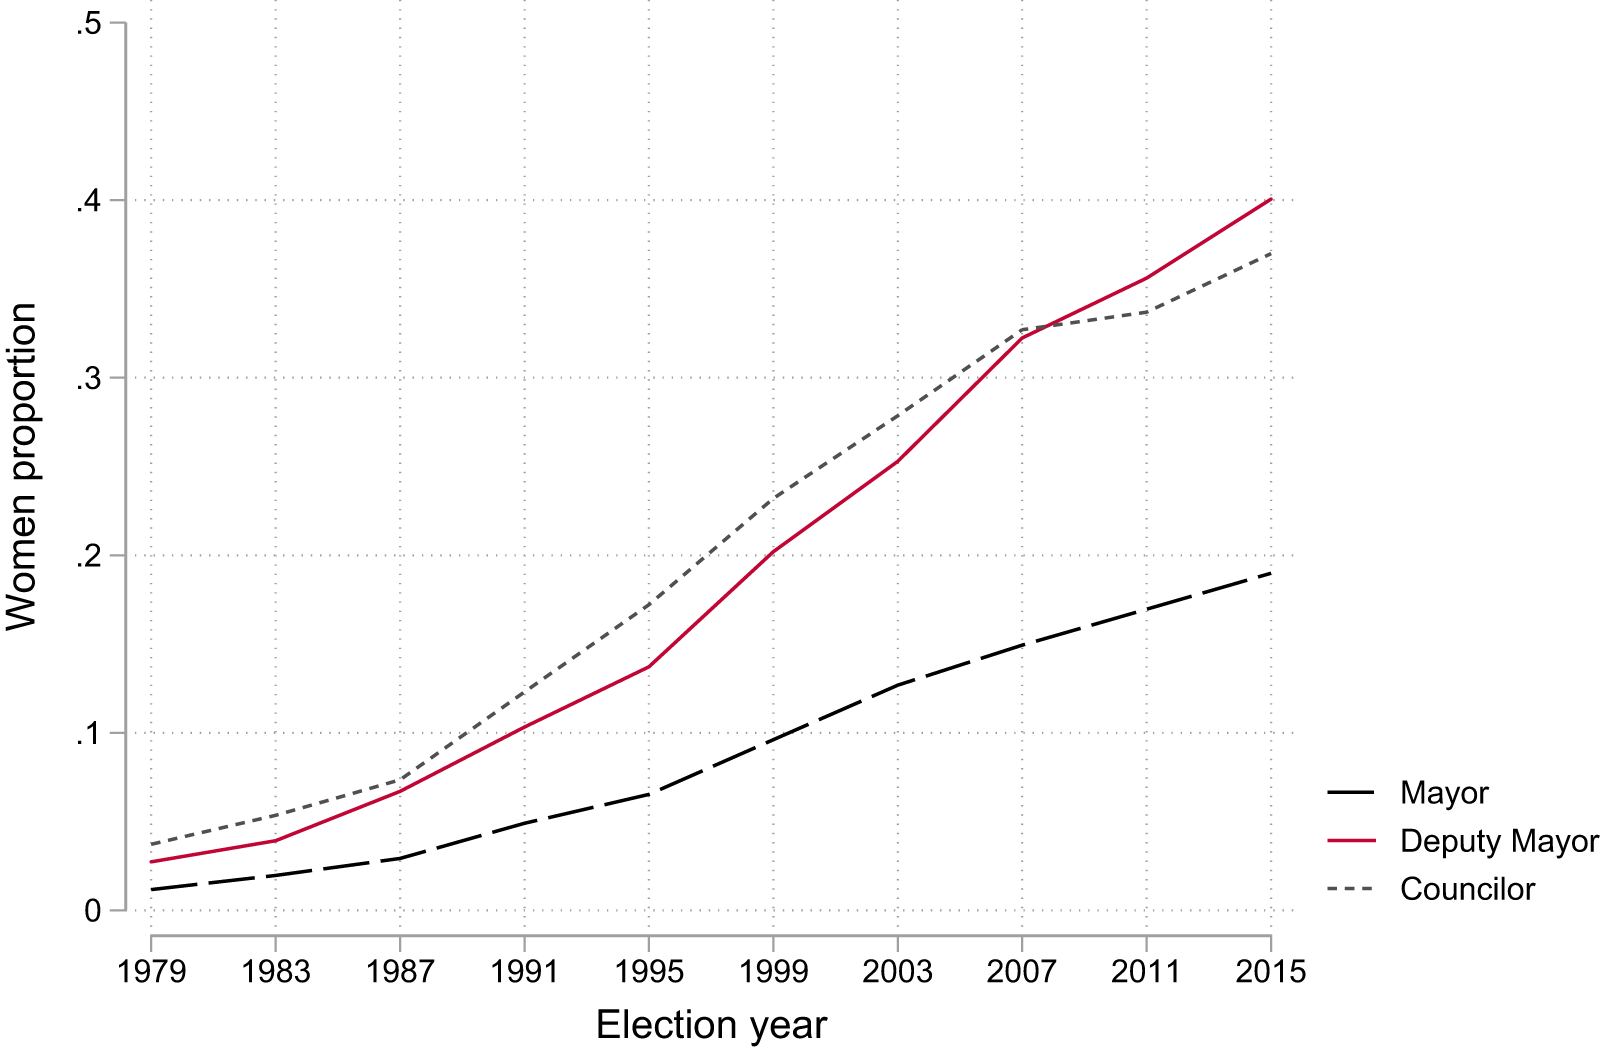
In Spanish municipalities, the representation of female councilors is almost equal, while the number of female mayors is far from parity. Figure 1 shows the evolution of the share of women across various political positions in Spanish municipalities, spanning from 1979 to 2015. Notably, the ratio of female councilors approaches parity, showcasing considerable progress. However, the representation of female mayors remains strikingly low, consistently below 20% over the past decade. This gender gap between the representation of women in the local top political position and among councilors, observed in Spain, is also evident in comparable contexts. As demonstrated in Appendix A Figure A2, there exists a significant gender gap—ranging from 10 to 20 percentage points—between the proportion of female councilors and female mayors in various Western European countries. This pattern highlights that women encounter similar challenges in attaining top political roles across different political contexts.
Women’s proportion by position in the city council in Spain from 1979 to 2015.

Figure 1 also reveals an intriguing observation: the position of deputy mayor boasts a substantial representation of women, comprising 42% of incumbents, surpassing even the overall proportion of female councilors. This gender gap raises questions about the dynamics of government formation, particularly in coalition scenarios where the deputy mayor position often falls to the leader of the junior party of the coalition government. The pronounced presence of women in this role may suggest a strategic selection process in which coalition-building efforts result in a higher likelihood of women being chosen as coalition partners. Such dynamics raise important questions about how coalition negotiations perpetuate gender imbalances in leadership roles, potentially positioning women as key partners without challenging the entrenched male dominance in the highest executive positions.
3.2. Experimental design
Selecting coalition partners is a complex task since competing possible partners differ on various dimensions, including sociodemographic characteristics, ideological positions, and bargaining power. In order to examine the relative weight of different considerations, I use a candidate choice conjoint experiment. By asking mayors to choose from and rate hypothetical profiles that combine multiple attributes, it is possible to estimate the relative influence of each attribute on the resulting choice or rating (Hainmueller, Hopkins and Yamamoto, Reference Jens, Hopkins and Yamamoto2014). This design reduces the social desirability bias implicit in asking politicians since sensitive attributes are mixed with nonsensitive ones and make the respondent less aware of which profile is violating the social norm (Horiuchi, Markovich and Yamamoto, Reference Horiuchi, Markovich and Yamamoto2021).
I study mayors because of their role in municipal government formation. Two aspects are known to condition local government negotiation strategies: the council’s election of the mayor and the mayor’s appointment of the councilors that will join her team in government (Márquez, Reference Márquez2003). The mayor is the person who leads the government formation process and who has the power to propose governments. After the electoral process, the mayor is elected by an absolute majority of the city council. However, if no agreement is reached in the first round, the councilor at the top of the list of the most voted party becomes the mayor. Later, the mayor appoints an executive committee. Spanish mayors, therefore, are important political players with considerable executive power. Thus, selecting between competing candidates for a potential local coalition government during the negotiation process is a familiar situation for mayors.
To measure partner selection, therefore, I use a standard conjoint approach. The experiment read as follows: “Imagine that you have obtained 5 councilors after the elections out of a total of 13 seats. If you could choose between two partners to form a government coalition with the following two leaders, which one would you choose?” This framing reflects a scenario in which politicians find themselves as key decision-makers in coalition formation. By placing them in the role of electoral winner, the experiment is designed to capture preferences as they would be expressed from a position of dominance, knowing that the prospective partner will occupy a more junior role in the coalition.
The survey then described a pair of hypothetical government partners. Table 1 lists the potential attributes of six dimensions of the hypothetical candidates. The experiment supplied each candidate’s gender, age, and education level independently generated at random.Footnote 2 I also provided the candidate’s previous political experience—worded as the number of terms in the city council—to avoid confounding the effect of age. Each profile also contained information on the ideology and the number of seats (main predictors of coalition formation) of the party to which the leader belongs in order to be able to compare the effect of individual-level characteristics to the effects of these two established predictors. Providing this information also made the scenario more realistic. The dimensions were presented in a randomized order fixed across the two pairings for each respondent. Each mayor was shown two conjoint matchups, each on a separate screen, so that each respondent made two choices.
List of random treatments in conjoint experiment

Note: Each potential candidate had one attribute randomly assigned from the listed options for each dimension.
Additionally, I designed a novel way to test the mechanisms of the mayor’s decision by asking them to rate substantive evaluations of the candidates’ profiles. This allows me to explore the aforementioned mechanisms (those that drive the decision to choose a candidate): the perception of similarity in political positions, ease of communication, capacity to govern, and trust. After the mayors viewed the candidates, I asked a “forced-choice” question to force mayors to decide between the two candidates. After the forced-choice question I asked mayors to what extent they agreed with four statements about the similarity of the candidate’s political preferences to their own, how easy it would be to communicate with this person, how capable of governing this person is and how much they would trust this person.Footnote 3 When evaluating the statements, mayors had to place themselves on a five-point scale, where 1 indicated that the respondents “Strongly disagreed” with the statement and 5 indicated that they “Strongly agreed.” Appendix B shows the full text of each question and how the survey was shown to respondents.
I received responses from 979 mayors, who represent 42.86% of all municipalities of over 2000 inhabitants—a high participation rate for a survey administered to elites. The survey was programmed and administered online between September 2018 and January 2019. Appendix B includes detailed information about the data collection process. I complement survey data with a database containing politicians’ characteristics, assembled with information from the Spanish Ministry of the Treasury and Public Administration for this study. I also use a database on electoral outcomes compiled by the Spanish Ministry of the Interior comprising detailed information on local election results.
To ensure the representativeness of respondents, Table 2 compares the mayors who completed the survey to the whole population of mayors (all Spanish municipalities with more than 2,000 citizens), respectively. This table shows descriptive information for the observations by the mayor and council. The response rates were consistent between the sample and the population for all the main indicators under examination (gender, age group, and education level).Footnote 4 The proportion of female mayors was around 22%, on average they were 50 years old and had 16 years of education. Looking at the city council, the average size of local parliaments was around 14 seats and the number of parties that obtain at least one seat is close to four. Concerning the last elections before the experiment, no party obtained the absolute majority in 68.59% of the municipalities, making government negotiation processes necessary.
Descriptive statistics for the survey respondents vs the whole population

Note: Education refers to average years of education. Seniority refers to the average years in the city council. PP refers to the Partido Popular, the main conservative party in Spain. PSOE refers to the Partido Socialista Obrero Español, the main social-democratic party in Spain. Minority refers to the average number of municipalities without an absolute majority.
One potential concern is that mayors who responded might come from municipalities with systematically different characteristics. For instance, those from smaller municipalities might have been more likely to participate due to fewer time constraints. This could also be related to lower levels of political competition or a smaller number of parties. However, Table 2 shows that respondents’ municipalities are broadly similar to the population of mayors in terms of population size, number of parties, and levels of political competition.
Finally, another concern is that the most ideologically polarized mayors would self-select into taking the survey. Table 2 shows that this does not appear to be the case. The ideology distribution of the respondents closely matches that of the population of mayors in all municipalities. It is worth noting that the population itself leans slightly toward the center-left, a trend that is reflected in the sample. Although there is a higher response rate of mayors from local parties and a slight underrepresentation from those affiliated with the main national parties, Partido Popular (PP) and Partido Socialista Obrero Espaol (PSOE), the overall ideological balance remains consistent. This indicates that the sample is broadly representative of the political preferences among Spanish mayors.Footnote 5
3.3. Empirical models
To carry out the analysis of the conjoint experiment, I reshape the data matrix so that each candidate proposed per  $k$ of task $j$ presented to respondent $i$ is a different row. The respondents were presented with two tasks and there were two alternative candidates proposed per task, hence generating a total of 3,324 observations.
First, I am interested in the marginal effect of an attribute on the decision to choose a candidate. I estimate the Average Marginal Component Effect (AMCE), which represents the marginal effect of a specific attribute over the joint distribution of all other attributes. If respondents take intensely into account one dimension compared to others, these attributes will be stronger predictors than the baseline level. I use a simple ordinary least squares (OLS) linear regression to estimate elasticities. I include cluster-robust standard errors to correct for within-respondent clustering. I regress  $y_{ijk}$, which denotes the chosen candidate, on a series of dummy variables that take a value of one if respondents were exposed to the respective attribute. Whether respondent $i$ chooses candidate $k$ in task $j$ is modeled as a function of $X_{ijk}$, a vector containing the attributes of the candidate presented to the respondent in that task, included as dummy variables. The model takes the following form:
 \begin{equation}
y_{ijk}=X_{ijk}\beta+e_{ijk}
\end{equation}
\begin{equation}
y_{ijk}=X_{ijk}\beta+e_{ijk}
\end{equation} Second, my analysis focuses on examining how individual attributes determine these evaluations. I once again employ the OLS linear regression approach while adhering to the same specifications delineated in Equation 1. However, the dependent variable in this iteration shifts to encompass the responses to the evaluation questions. Here,  $y_{ijk}$ denotes the politician evaluation from 1-5. This shift allows for a comprehensive assessment of the effects that individual attributes included in $X_{ijk}$ exert on these evaluations. Finally, I aim to ascertain the relative importance of substantive evaluations in influencing respondents’ choices among potential partners. I adopt the Ordinary Least Squares (OLS) regression method to accomplish this. Now, the variable $X_{ijk}$ is a vector that encapsulates the responses to the 5-point scale evaluations assigned to each candidate. For all the models, I cluster the standard errors by the respondent to account for possible non-independence of ratings from the same respondent.
4. Experimental results
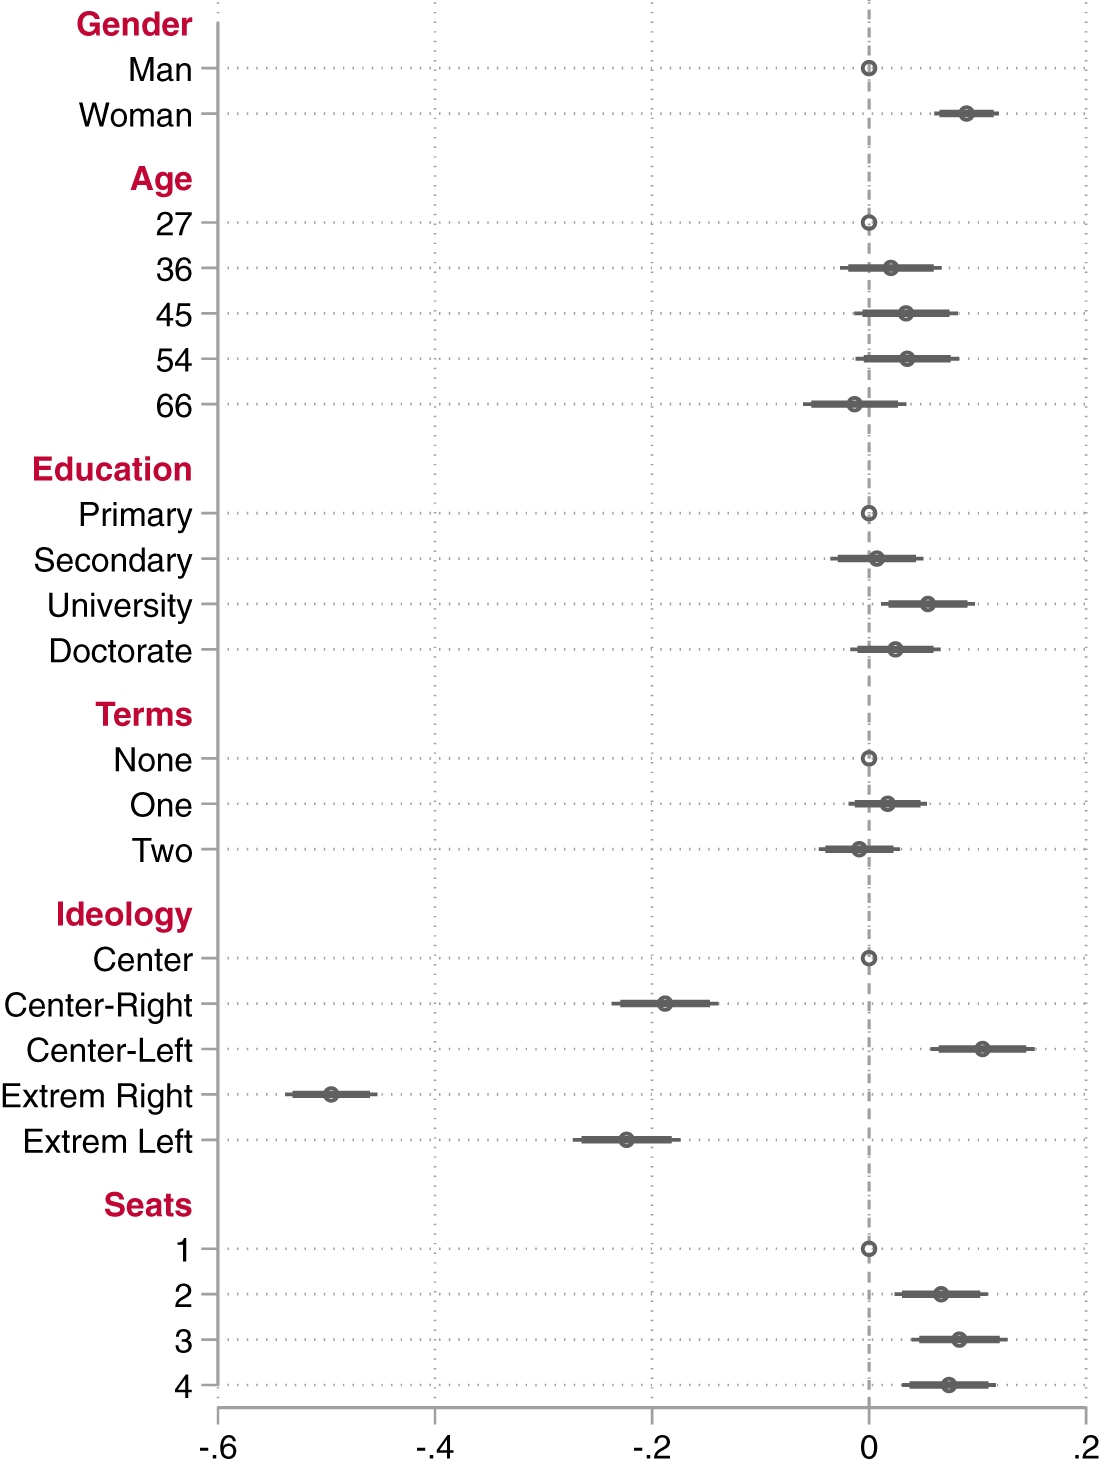
The paper argues that politicians consider candidates’ gender when choosing government partners. The conjoint experiment confirms my expectation that mayors prefer women as coalition partners together with other specific candidates characteristics. Figure 2 graphically presents which characteristics mayors prefer when they choose their partners, including all responses from mayors in the sample. The figure shows the estimated effect of each attribute on the probability of being selected to form a coalition, with 95% and 90% confidence intervals. Detailed results can be found in Appendix C Table C2.
Candidate characteristics effects on choosing coalition partners.

First, a few findings from the experiment are worth highlighting as they are consistent with classical theories of government formation, thus giving me confidence in the validity of the design. The results reveal that what drives mayors’ preference to govern with a candidate are the latter’s party’s size and ideology. Mayors avoid choosing candidates with whom they do not reach an absolute majority of seats, but they are indifferent between forming a minimal-winning coalition or larger coalitions. As expected, ideology is also a fundamental factor in choosing a candidate to form a government with. Figure D4 in Appendix D further complete our understanding by indicating a preference among mayors for coalition partners who align ideologically with them. These results are consistent with prior analyses of party motivations, implying that similar considerations also drive politicians’ preferences.
Beyond confirming the importance of ideology and the number of seats, the results show that mayors, on average, prefer female, middle-aged, and educated candidates. First, a female candidate is about 9 percentage points (p.p.) [b  $=$ 0.090 (SE $ = $ 1.5)] more likely to be selected as a partner in government than a male candidate. The gender of potential partners appears to have a comparable influence to the classical variables, with the seats distribution having smaller effects on the decision to select coalition partners.
Further analysis in Appendix D shows that these preferences for women do not seem to vary depending on the gender of the mayor. However, they do vary according to the age and ideology of the mayors. Older mayors drive the preference for women. This could be explained by the fact that older adults tend to be more influenced by gender stereotypes due to their socialization both inside and outside of politics. This result appears to be in line with the literature’s expectations. Finally, I found that ideology strongly determines the preference for women partners. As shown in Figure D4 in Appendix D, for right-wing mayors, the gender of the candidate is not important, while those in the center and on the left prefer to choose a woman to form a coalition with. These results may be the consequence of women being perceived as more liberal than men because of their gender, as suggested by previous studies (e.g. Huddy and Terkildsen, Reference Huddy and Terkildsen1993; Koch, Reference Koch2000). An alternative explanation may be that left-wing politicians show more concern and commitment to gender parity in selecting their government partners, as left-wing parties have demonstrated in the representation of women’s interests (Campbell and Childs, Reference Campbell and Childs2015; Campbell, Reference Campbell2016).
The preferences for educated candidates may shed light on politicians’ inclinations toward profiles that signal competence for governance. University-educated candidates are about 6 p.p. [b= 0.649 (SE $=$2.3)] more likely to be selected. This also suggests that mayors prefer candidates with better capabilities and a deeper understanding of politics. Political studies on performance demonstrate that high levels of education in politicians also positively correlate with integrity (Mondak, Reference Mondak1995; Besley, Reference Besley2006), economic growth (Besley et al., Reference Timothy, Montalvo and Reynal-Querol2011), and public goods provision (Martinez-Bravo, Reference Martinez-Bravo2017). Consequently, politicians’ preference for candidates with higher education may stem from the perception of heightened competence and trustworthiness.
Yet, the preference for capable partners does not extend to candidates with previous city council experience, as the number of years in office is not a significant factor. This suggests that the reasons behind education may differ from having a deeper understanding of politics. Along these lines, in Appendix D Figure D4 I revise the experiment results dividing the sample by mayors education level and find that a university-level education is not universally preferred. The figure indicates that education homophily plays a role when choosing a governing partner, with mayors tending to prefer candidates of similar educational backgrounds.Footnote 6 These findings align with recent studies that highlight a citizen’s preference for candidates with similar educational levels, particularly among degree holders (Simon and Turnbull-Dugarte, Reference Simon and Turnbull-Dugarte2024).
4.1. Mechanisms: candidates assessments
Having elucidated politicians’ preference for women when selecting partners, the attention now turns to the compelling question: Why are women often perceived as more suitable choices for governing coalitions? Central to my argument lies the premise that politicians employ gender as a heuristic for predicting potential coalition partners’ future behavior. Building on these insights, I explore whether expectations about the future behavior of potential coalition partners help explain the preference for women. Suppose the main reason underlying mayors’ preference for women candidates as coalition partners is that they are perceived as good coalition colleagues. In that case, I should see a positive assessment of women’s abilities to be part of a team.
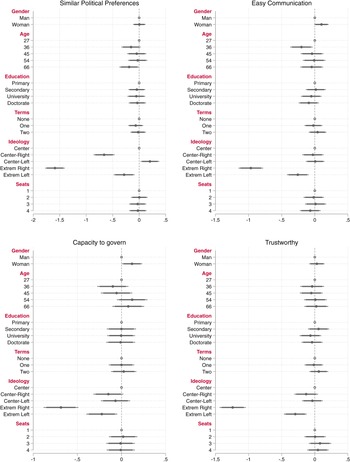
Figure 3 therefore displays the estimated effect of each attribute on politicians’ candidate evaluations encompassing: perceived similarity in political preferences, ease of communication, capacity to govern, and trust. The analysis hinges on a set of independent variables measured on a 5-point scale, gauging support for four statements that capture these critical aspects. This shows that female candidates, on average, receive higher marks in the evaluation for communication and capacity to govern. In particular, mayors report that communication is easier with a female candidate than with a male candidate. This aligns with the idea that the preference for female coalition partners may be driven by gender stereotypes that portray women as more consensual, cooperative, and less confrontational leaders.
Candidate characteristics effects on coalition partners assessments.

Additional analyses provide further insight into the variation behind these perceptions. As shown in Appendix D Figure D6, the finding that women are perceived as easier to communicate with is largely driven by male mayors. Similarly, Appendix D Figure D8 reveals a near-significant association between trustworthiness and female candidates among male mayors, suggesting that some men may also associate women with greater honesty. Finally, perceptions of women’s governing competence appear to be more closely linked to respondents’ education levels, rather than gender alone, as shown in Appendix D Figure D7. Taken together, these findings suggest that gender may function as a heuristic for certain positive traits, but that the basis for these perceptions may vary across respondent characteristics.
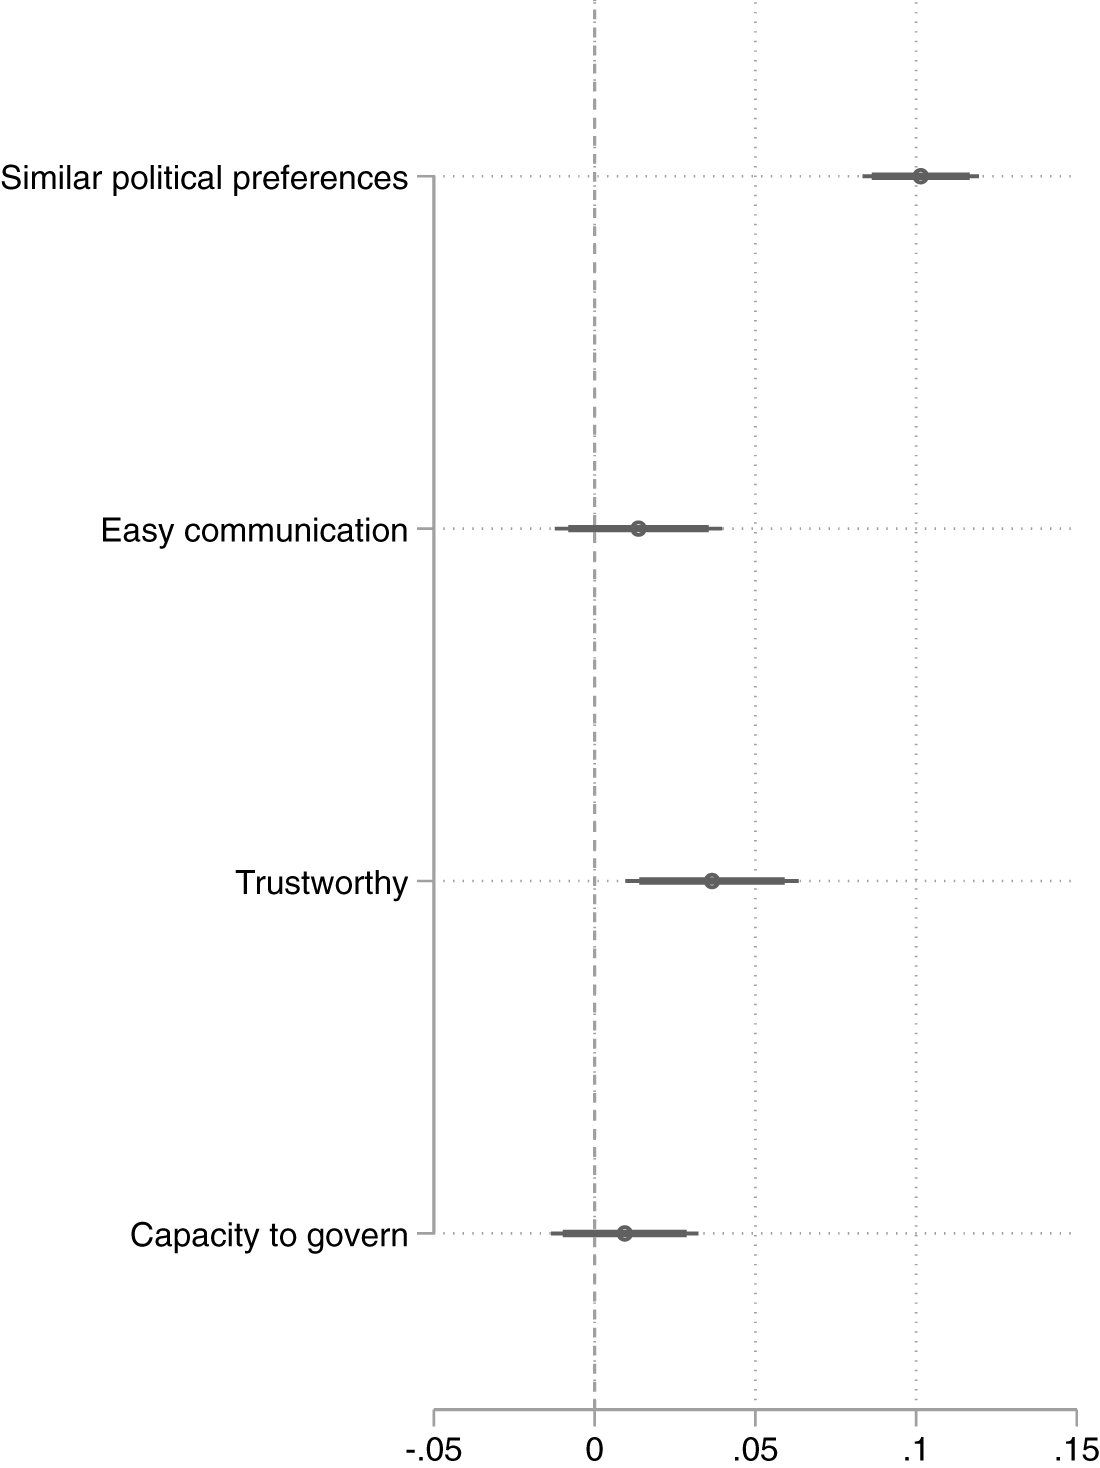
To further understand the factors associated with the selection of coalition partners, I examine the extent to which mayors’ evaluations of candidate profiles correlate with their choice. Figure 4 breaks down how each candidate’s rating influences the partner selection decision. Respondents prioritize coalition partners’ political preferences, trustworthiness, and communication over their capacity based on the evidence. Specifically, politicians continue to prioritize partners who align ideologically or share similar policy preferences, but also those they perceive as trustworthy and reliable in supporting their agenda. This suggests that politicians are willing to trade off competence for compliance, with strategic considerations and political expediency playing an important role in coalition choices. This finding aligns with the expectation, underscoring the complex interplay of strategic calculations, ideological alignment, and political trust in shaping coalition formation.
Assessment effects in choosing potential partners.

That said, while women are rated more highly on competence and ease of communication, they are not consistently seen as more trustworthy, a trait that, as shown in the model from Figure 4, is among the most positively correlated with the likelihood of being chosen as a coalition partner. This apparent disconnect may raise a legitimate concern about the alignment between preferred traits and the traits attributed to women. To help reconcile this, I further explore how these patterns vary across respondents. First, Appendix Figure D8, which breaks down trustworthiness evaluations by mayor gender, reveals that while the interaction between candidate gender and trustworthiness evaluations is not statistically significant, male mayors appear more likely to perceive women candidates as trustworthy, whereas female mayors show the opposite tendency. Second, Appendix Figure D9 provides additional insight by replicating the model from Figure 4 separately for male and female mayors. The results show that traits such as capacity to govern are much more important for male mayors than for female ones. This is consistent with earlier findings that men are driving the association between perceived competence and preference for women. Taken together, these analyses suggest that the mechanisms linking gender to partner preference are not uniform but vary systematically by mayors’ own gender. Male mayors appear more likely both to attribute traits like trustworthiness and competence to women candidates and to prioritize precisely these traits when selecting coalition partners.
Given this, I conduct an additional analysis presented in Appendix E, focusing on politically ambitious mayors—those most likely to treat coalition building as a strategic decision. Among this group, the mechanisms appear more clearly defined. Ambitious male mayors who value trustworthiness, competence, and ease of communication are significantly more likely to prefer women partners. In contrast, ambitious female mayors show no consistent pattern linking trait preferences to gendered partner choices. These findings suggest that the mechanisms driving gendered coalition preferences are not uniform but vary systematically by both gender and political ambition. While not all traits associated with women predict partner preference in the same way across the board, the additional evidence supports the broader theoretical claim that gendered perceptions of coalition traits play an important, if complex, role in shaping local political behavior.
5. Conclusion
Women remain underrepresented in top political positions. While institutional factors shaping this gap have been extensively studied, less attention has been paid to how government formation processes themselves shape access to executive power. In coalition-based systems, forming a government often involves alliance-building among elected politicians. These processes act as another step in the political selection process where the preferences and traits of the actors involved can play a determining role that may end up compromising the representativeness of the governments formed. While existing research emphasizes party incentives and institutional constraints, this study sheds light on the individual-level preferences and perceptions that may influence these decisions.
To examine these dynamics, I theorized that politicians may prefer women as coalition partners due to stereotyped expectations about their collaborative behavior, reliability, and governing style. I tested these hypotheses through a conjoint experiment embedded in a survey of 979 Spanish mayors. The experiment uses six different dimensions of hypothetical candidates, including newly considered sociodemographic characteristics as well as long-studied government formation determinants. The findings suggest not only that said characteristics are relevant at the level of the potential partner being evaluated but also that the decision makers’ own characteristics have an important effect on their selection. The results suggest that, mostly, what drives a leader’s preference to form a coalition with another party leader is the latter’s ideology and their party’s size. However, the analysis also reveals gender as an important predictors of preferences.
Spanish mayors prefer to form governments with women. This preference for female candidates is the most important personal characteristic, being at the same level as the party’s size effect. Importantly, this gender preference is primarily driven by center and left-leaning mayors. This preference may be driven by the positive evaluations women coalition partners receive regarding their ability to reduce communication costs and their perceived competence in governance. The stronger support for women observed among male and older mayors is consistent with the possibility that gendered expectations about women’s leadership, such as being more collaborative or less confrontational, may influence coalition preferences, at least for some groups. However, the findings also indicate that politicians rely more on their assessments of a potential partner’s trustworthiness.
It is worth highlighting that the observed preference for female coalition partners is not uniform across the ideological spectrum. Rather, it is driven by center and left-leaning mayors, a pattern that aligns with previous research showing stronger commitments to gender parity among left-wing politicians (Weeks et al., Reference Weeks, Caravantes, Espírito-Santo, Lombardo, Stratigaki and Gul2024). Importantly, this does not seem to result from a sample-specific bias: as discussed earlier, the ideological distribution of respondents closely matches that of the overall population of Spanish local executives at the time. This suggests that the main findings could be reflective of broader coalition dynamics in local Spanish politics, where progressive ideological orientations were more common. As such, shifts in the ideological composition of local leadership may influence the extent to which gender plays a role in coalition formation.
While ideology may help explain who is more likely to prefer female partners, it is not the only factor shaping coalition preferences. The findings also show that coalition formation among politicians is not merely a matter of ideological alignment or party strategy; it also reflects calculated assessments of individual costs and benefits. Politicians display strategic behavior when selecting coalition partners, often favoring profiles perceived as more collaborative and less threatening to their own leadership. Mayors, in particular, seem to prefer partners who maintain coalition consensus without challenging their authority.
This strategic preference helps explain why women are often favored in such scenarios. Similar patterns have been observed in voter behavior through conjoint experiments, where women are frequently rated more positively than men (Schwarz and Coppock, Reference Schwarz and Coppock2022). As other scholars have noted, this finding appears counterintuitive when considering persistent gender disparities in access to political leadership. Although conjoint experiments are good at avoiding social desirability bias, they may not fully capture the dynamics of discrimination against certain groups, such as women. One possible explanation is that these experiments might reflect general attitudes toward women rather than the complex realities of elite political selection, where male and female politicians often face different pathways and expectations (Clayton and Zetterberg, Reference Clayton and Zetterberg2021). However, those women who reach that position likely have more competitive profiles for governing. So, it is plausible to think that politicians’ preferences toward the general population of women, as I show them here, are essential when politicians are forming their teams.
The findings of the paper therefore are crucial for expanding our understanding of women’s participation in executive politics. On one hand, coalition building may offer an entry point for women into executive office. On the other hand, the same preferences that enable their inclusion may reinforce their relegation to junior roles. This helps explain the apparent paradox whereby women hold visible executive positions, such as deputy mayor, yet remain excluded from top leadership. This may account for the descriptive finding in the paper that women are equally represented in deputy mayor roles, which are commonly assigned to coalition partners.
This pattern resonates with recent work by Huidobro and Falcó-Gimeno (Reference Huidobro and Falcó-Gimeno2023), which shows that despite winning elections, women face barriers in securing the mayor’s office and are relegated to junior partner positions within the government. The empirical findings underscore the presence of gender-associated roles in alignment with the role congruity theory (Eagly and Karau, Reference Eagly and Karau2002). The preference for women conveyed by gender stereotypes and how they fit the qualities of a good coalition partner is likely to generate a gender bias in how men and women manage government formation negotiations. Thus, women will likely be anchored to a junior role.
Understanding the preferences of political leaders offers critical insight into how we understand women’s political underrepresentation, not just in terms of electoral outcomes, but in the informal dynamics through which executive teams are assembled. In line with a growing literature on ministerial appointments showing that women are disproportionately assigned to less influential or stereotypically feminine portfolios (Barnes and O’Brien, Reference Barnes and O’Brien2025), this research adds to broader debates about how government gatekeepers allocate executive responsibilities and assign seats within governing bodies. Even when women are not systematically excluded, the positions they are offered often may reflect constrained opportunities and gendered expectations around collaboration and deference. Coalition inclusion, then, may serve both as a pathway into executive office and as a mechanism that reproduces unequal authority within it.
These dynamics matter not only for gender equality, but for the quality of democratic representation itself. If access to executive authority is shaped by informal and often unaccountable preferences, rather than by merit or electoral performance, the promise of democratic inclusion remains fundamentally incomplete. Recognizing the informal biases embedded in government formation can help inform reforms to coalition bargaining, transparency in appointments, and internal party processes, ultimately contributing to more equitable and representative governance.
Supplementary material
The supplementary material for this article can be found at https://doi.org/10.1017/psrm.2025.10077. To obtain replication material for this article, please visit https://doi.org/10.7910/DVN/ZQIF
Acknowledgement
I would like to thank Aina Gallego, Soledad A. Prillaman, Elias Dinas, Andy Eggers, Rachel Bernhard, Amanda Clayton, Olle Folke, Ignacio Lago, and Leonardo Carella for their feedback at different stages of the process. I also thank them for their useful comments and suggestions to the participants at the EUI Political Behaviour Colloquium, Early Careers Gender and Politics Writing Group, European Graduate Network, EPSA, APSA, and MPSA. I also thank the anonymous reviewers for their feedback, which contributed to the quality of the article.
Funding statement
Support for this research was provided by the Spanish Ministry of Economy, Industry and Competitiveness (grant CSO2016-79569-P).


 Open access