


1. Lack of opportunity for lower educated workers
The earnings of less educated workers in the United Kingdom have been considerably lower than more skilled workers (see, e.g., Joyce and Xu, Reference Joyce and Xu2019, Figure 4), and there has been a lack of opportunity for individual wage growth and job progression for workers who do not succeed in formal education in the United Kingdom.
In Figure 1, we plot the mean wage by age of workers who work in occupations where there are typically no formal skills requirements, intermediate skill requirements or high skills requirements. Workers in the occupations with less skill requirement see almost little pay progression over their career, particularly compared to workers in occupations that typically require the equivalent of a university degree, where average wages more than double in the first 10 years of work and continue to grow after that.
Average wages by education level of occupation.
Source: Figure 1 in Aghion et al. (Reference Aghion, Bergeaud, Blundell and Griffith2020), based on ‘Annual Survey of Hours and Earnings (ASHE)’, https://doi.org/10.57906/x25d-4j96, October 2022, Version 2.0.
Note: Figure shows the average wage of workers in occupations classified by the typical qualification requirements. The typical qualification requirements are based on Appendix J of the immigration regulation (HomeOffice, 2020). Occupations are classification according to the National Qualification Framework (NQF), ‘None’ includes NQF1-2 or no formal qualifications required, ‘A-levels’ includes NQF3–5, which corresponds to A-level or professional qualifications, ‘Higher education’ includes NQF6-8, which corresponds to a bachelor’s degree or higher.

A similar picture arises in work that documents the individual wage growth of workers by their obtained education qualifications. The wages of men and women who leave school with less than level 2 qualifications (equivalent of less than high school) see some wage growth in their early 20s, but after that almost none, compared to workers with higher education, who experience wage growth up until their late 40s or early 50s (see Figure 3 in Blundell et al., Reference Blundell, Costa Dias, Goll and Meghir2021).
In the United Kingdom, the increase in earnings inequalities is largely the result of these differences in rates of pay progression, and there has also been a marked increase in in-work poverty, as summarised by Joyce and Ziliak (Reference Joyce and Ziliak2019), ‘Poverty in Britain used to be overwhelmingly a story of old age or household worklessness. This is no longer the case. About 80 per cent of those in poverty in Britain are now in non-pensioner households, and this is more than 20 percentage points higher than in 1979’.
The policy concern is not only a lack of opportunity for productive and rewarding paid employment at the bottom of the wage distribution. There are large and growing gaps in other economic, health and social outcomes.
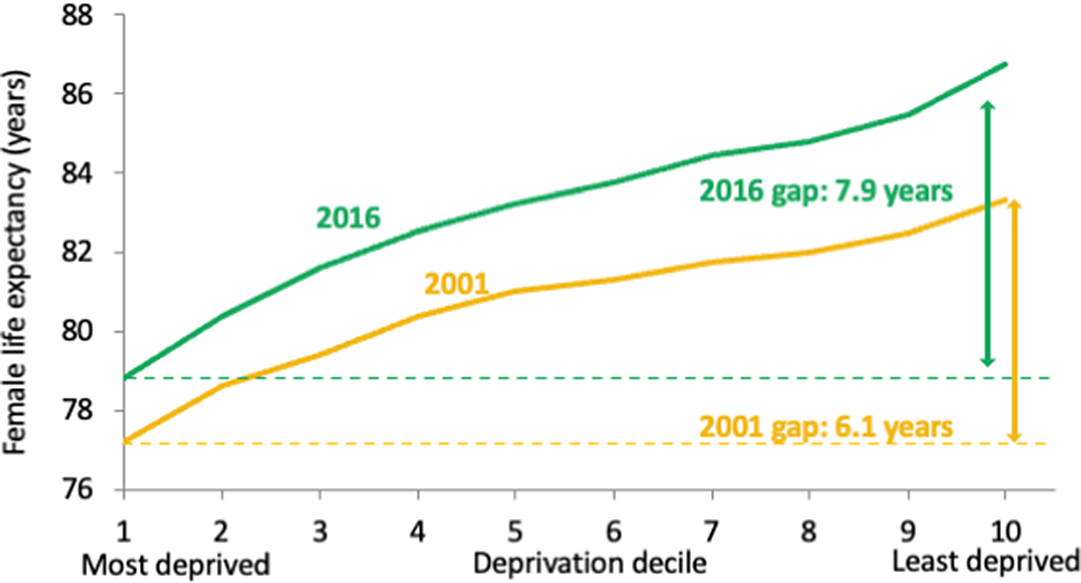
For example, life expectancy is higher for people born in more affluent areas compared to those born in more deprived areas, as measured by the Index of Multiple Deprivation (see Figure 2). In 2001, females born into the most deprived areas had a life expectancy that was 6.1 years less than those born into the most affluent areas. By 2016, this had increased to 7.9 years. For males born into the most deprived areas, they had a life expectancy that was 9.0 years less than those in the most affluent areas, rising to 9.7 by 2016.
Life expectancy by deprivation.
Source: Redrawn from Figure 1 in Bennet et al. (Reference Bennet, Pearson-Stuttard, Kontis, Capewell, Wolfe and Ezzati2018) under CC BY 4.0 licence.
Note: The figure shows life expectancy at birth by decile of deprivation for females in 2001 and 2016.
We also see growing inequalities in people’s social situations. In 1993, people aged 40–45 years were equally likely to be married or cohabiting regardless of their education. By 2018, the share of less educated people who were married or cohabiting declined by around 10 percentage points, while for those with a university education, it remained constant (see Figure 3). In the United States, similar trends have been attributed, at least in part, to a lack of economic opportunity (Autor et al., Reference Autor, Dorn and Hanson2018).
Share of 40–45-year olds who are married or cohabiting.
Source: Joyce and Xu (Reference Joyce and Xu2019) based on Quarterly Labour Force Survey, Q1 1993 to Q2 2018.

Children growing up in deprivation are more likely to be obese, which has long-term adverse consequences. Figure 4 shows that in 2020 children growing up in the most deprived areas are twice as likely to be obese than children grouping up in the least deprived areas (20% compared to 10%), and they are nearly five times more likely to be severely obese (7.5% compared to 1.6%). The same is true if we look at children in their first year in school (reception); children in the most deprived areas are nearly twice as likely to be obese (9.4% compared to 5%) and nearly four times as likely to be severely obese (3.9% compared to 1%). These disparities have widened since 2006–2007. For children in year 6, the gap in the prevalence of obesity between the difference between the most and least deprived as widened from 8.5 percentage points to 13.3, and the disparity in the prevalence of severe obesity from 3.1 percentage points to 5.3 (see Figure 5).
Prevalence of obesity in children in year 6 in 2019.
Source: Table 10, National Child Measurement Programme, 2020; NHSDigital (2020).
Note: Deprivation is measured using the Index of Multiple Deprivation of the postcode of the child. Children in year 6 are typically 10–11 years old.

Share of children in year 6 that are obese by disparity.
Source: Table 13, National Child Measurement Programme, 2020; NHSDigital (2020).
Note: Deprivation is measured using the Index of Multiple Deprivation of the postcode of the child. Children in year 6 are typically 10–11 years old.

2. Poor educational attainment is both a cause and consequence of poverty
Growing up in adverse economic circumstances can be an important limiting factor on child development. Educational inequalities that emerge early in life have increased over recent years. Cognitive and socioemotional skills developed in childhood are strong predictors of adult outcomes such as wages, health, criminal activity and many others. School is one important place where children develop these skills. And while there has been substantial growth in participation in higher education in the United Kingdom, with the share of workers with a degree or equivalent rising from around 15% in 1990 to over 40% in 2020, there remain large and persistent difference in educational attainment between children from different social and economic backgrounds. Farquharson et al. (Reference Farquharson, McNally and Tahir2022) provide a review of this literature in the context of the current UK education system.
There are large differences in educational attainment at age 14 for children living in households in the bottom 10% by household income, compared to those in the top 10%. Around 25% of children in the poorest 10% achieve five good GCSEs compared to around 70% of children in the richest 10%; less than 5% of children in the poorest 10% get any A or A* grades, where over 35% of children in the richest 10% (see Farquharson et al., Reference Farquharson, McNally and Tahir2022, Figure 30). The share of children who leave education at 18 without any qualifications is considerably higher among children who received free school meals, at 37% in 2018, compared to 18% across all children (Children’s Commissioner, 2019).
Overall, looking at educational attainment at age 26, the share of people who grew up in the most deprived areas obtaining a degree or equivalent was 17%, compared to 49% of people growing up in the least deprived areas and to 71% of people going to independent schools. At the other end of the scale, 24% of people growing up in the most deprived areas left school with no qualifications, while 6% from the least deprived areas and 2% of people who attended independent schools (see Farquharson et al., Reference Farquharson, McNally and Tahir2022, Fig 33).
3. The role of taxes and benefits
In the United Kingdom, the tax and benefit system has until recently propped up incomes at the bottom of the distribution. The growth in average household earnings (before taxes and benefits) between 1994/1995 and 2017/2018 is much higher for higher-income households than for lower-income households. For example, at the 10th percentile, growth in earnings was 5%, whereas at the 90th percentile, it was 40%. In contrast, the growth rate in average household net income (after taxes and benefits) over this period is close to constant across the income distribution at 30%. This was because the expansion of tax credits increased after tax incomes for lower income households (see Joyce and Xu, Reference Joyce and Xu2019, Figure 4 and discussion around it).
The benefit system provides an important safety net to protect the most vulnerable. Relying on benefits is both socially undesirable and politically untenable. Evidence suggests that people distinguish between money earned and money received from the government in terms of the dignity and security associated with it (Bryson et al., Reference Bryson, Clark, Freeman and Green2016). Spending on working-age benefits increased considerably in real terms and as a share of GDP from 1990s to 2010s, although it fell from 2010 until the pandemic due to cuts in their generosity (see Hoynes et al., Reference Hoynes, Joyce and Waters2023).
It would be more desirable for individual workers to experience pay growth that is driven by increases in their productivity. This is the challenge of inclusive growth—there is a lack of opportunity for workers without formal education qualifications to improve their productivity.
4. The labour market for low-educated workers
There have been a number of likely factors behind the lack of pay progression for less educated workers. The United Kingdom overall has experienced low (stagnant) productivity growth since 2008. Increasing globalisation has had important implications for labour demand (see Dorn and Levell, Reference Dorn and Levell2021) and has had unequal effects on workers in different industries. There has been an increase in differences across firms in productivity, wages and market shares, driven in large part by the growing market power of superstar firms, which has affected different types of workers differently (De Loecker et al., Reference De Loecker, Obermeier and Van Reenen2022).
One important driver of lack of job opportunities and wage growth for less educated workers has been the adoption of new technologies. Automation and other forms of technology have replace the routine tasks previously done by low- and medium-skilled workers, putting pressure on job opportunities and wages at the bottom (see, e.g., Acemoglu and Autor, Reference Acemoglu, Autor, Card and Ashenfelter2011; Autor et al., Reference Autor, Levy and Murnane2003; Goos et al., Reference Goos, Manning and Salomons2014; Michaels et al., Reference Michaels, Natraj and Van Reenen2014).
Building on this work, a growing literature has emphasised the importance of flexibility, teamwork and other noncognitive skills, mainly for high-skilled workers (see, e.g., Deming, Reference Deming2017). Less is known about whether these types of skills and abilities are important for workers without formal educational qualifications in the sense that they will enhance the worker’s ability to make a productive contribution in the workplace, and so have opportunities for pay progression.
A separate literature shows that the firm you match to is important in explaining differences in pay and pay growth (see, e.g., Abowd et al., Reference Abowd, Kramarz and Margolis1999; Card et al., Reference Card, Heining and Kline2013). Workers that appear similar in their characteristics, including educational background, experience different individual wage growth at different firms.
Aghion et al. (Reference Aghion, Blundell, Griffith and Bergeaud2023) combine the insights from these literatures to study the possibilities for policy to boost pay growth for workers in occupations with little or no formal educational requirements. They use matched employee–employer administrative data from the United Kingdom to highlight the importance of social skills, including the ability to work well in a team and communicate effectively with coworkers, as drivers for individual wage growth for workers with few formal educational qualifications.
One indicator that this might be an important mechanism is that employment is increasing in those occupations where soft skills are important, relative to those where they are not. Figure 6 shows that employment has increased in occupations where social skills are important (panel a), where teamwork is important (panel b) and where being sensitive to the problems of your coworkers is important (panel c). This increase has been larger for occupations where there are lower qualification requirements.
Change in employment shares, 2004–2019.
Source: Data from Aghion et al. (Reference Aghion, Blundell, Griffith and Bergeaud2023) online appendix, based on O*NET version 21.1 (https://www.onetcenter.org/db_releases.html) and employment from the UK ONS Annual Population Survey (https://www.nomisweb.co.uk/datasets/aps168).
Note: Figure shows the change in share of employment from 2004 to 2019 of workers in occupations classified by the typical qualification requirements and the importance of social skills for that occupation (measured by O*Net as detailed in Aghion et al., Reference Aghion, Blundell, Griffith and Bergeaud2023). The typical qualification requirements are based on Appendix J of the immigration regulation (HomeOffice, 2020). Occupations are classification according to the NQF, ‘None’ includes NQF1-2 or no formal qualifications required, ‘A-levels’ includes NQF3-5, which corresponds to A-level or professional qualifications, ‘Higher education’ includes NQF6-8, which corresponds to a bachelor’s degree or higher (see Aghion et al., Reference Aghion, Blundell, Griffith and Bergeaud2023 for details of how occupation characteristics are measured using O*NET data).

Aghion et al. (Reference Aghion, Blundell, Griffith and Bergeaud2023) show that the payoff to these skills varies across occupations and firms. They show that less educated workers can experience significantly faster individual wage growth in occupations where these social skills and teamwork are important (see Figure 7), and that this can be even higher if they match to the right firm. They use panel data that follows workers over time (the ASHE) to estimate wage equations that control for worker, occupation, local labour market conditions and firm characteristics. Workers in occupations with low requirements for formal qualification experience significantly faster wage growth in occupations where these soft skills are more important.
Wage progression by importance of social skills and teamwork.
Source: Figure C.1(a) in Aghion et al. (Reference Aghion, Blundell, Griffith and Bergeaud2023), based on O*NET version 21.1 (https://www.onetcenter.org/db_releases.html) and ‘Annual Survey of Hours and Earnings (ASHE)’, https://doi.org/10.57906/x25d-4j96, October 2022, Version 2.0.2.
Note: Figure shows the average wage for workers in occupations where the typical qualification requirements are no higher than NQF level 5 according to Appendix J of the immigration regulation (HomeOffice, 2020. The three lines indicate terciles of the importance of a range of social skills and teamwork skills in that occupation (see Aghion et al., Reference Aghion, Blundell, Griffith and Bergeaud2023 for details of how occupation characteristics are measured using O*NET data).

Importantly, Aghion et al. (Reference Aghion, Blundell, Griffith and Bergeaud2023) show evidence that this is driven by a complementarity between the skills and abilities of less educated workers and the firm’s other assets. The evidence suggests that workers in these occupations increase the productivity of the firm’s other assets. Other data suggest that firms invest more in training these workers, which results in longer tenures and stronger pay progression. Taken together, this means that investing in and developing these noncognitive skills is productivity enhancing, and could be a driver of inclusive growth.
5. Implications for policy
The facts and figures that I have presented in this lecture suggest a strong need for policies that will provide opportunities for those who have not succeeded in the formal education to develop skills that are valued in the labour market.
We need a better understanding of what these skills are, and for example, whether there should be a greater emphasis on training for noncognitive skills, and whether these skills can and should be accredited. We also need to look at how we can improve the educational outcomes for children growing up in poverty.
We need a better understanding of the characteristics of the firms that are, and could potentially, create these ‘good jobs’ that help to develop workers’ soft skills and enhance productivity within the firm. Is there a potential for industrial policy to encourage the growth in these jobs, or for policies that help match workers who have these soft skills to firms that need them?
However, of course, there are many other challenges to achieving inclusive growth. Education and training are only part of the policy solution. As Paul Johnson emphasised in a speech at the Tony Blair Institute for Global Change’s Future of Britain conference (Johnson, Reference Johnson2022) the ingredients of broader policy are well known. They include education, particularly early years and further education; trade reform, including openess to our richest, nearest and biggest trading partners; reforms to planning regulations and building of more housing to support growth; the implementation of effective competition policy to control excess of market power, particularly in the digital age; and ensuring people and markets have confidence in institutions and macroeconomic stability. That is all easily said, but much more difficult to achieve.
The ongoing IFS-Deaton Review (https://ifs.org.uk/inequality/) in the causes, consequences and policies to address the increase in inequalities is hoping to provide some concrete proposals in this direction. As the chair of the review, the Nobel laureate Angus Deaton, said,
In Britain at the beginning of the 19th century, inequality was vast compared with today. Wages were stagnant and … profits were rising … Yet by century’s end reforms led to reduced fortunes of the aristocrats, extended political inclusion, wages began to rise and mortality started to fall All of this happened … through gradual change in institutions that slowly gave way to the demands of those who had been left behind.
Acknowledgements
This was the Prais Lecture delivered 23 November 2022 at the National Institute for Economic and Social Research (NIESR) in London. The author would like to thank the ESRC Centre for the Microeconomic Analysis of Public Policy (CPP) at IFS for funding under grant number ES/M010147/1.


 Open access