


Nearly all materials can be transformed into nanoparticles (Luther et al., Reference Luther, Nass, Remškar and Žumer2004). Recently, the utilization of nanotechnology has received significant attention for numerous applications. The main advantage of nano-sized particles is the increased filler effect in comparison to micro-sized materials (Muhd Norhasri et al., Reference Muhd Norhasri, Hamidh and Mohd Fadzil2017; Guo et al., Reference Guo, Fan and Luan2018). Currently, there is increasing interest in developing nanomaterials for the construction industry. Nano-metakaolin (NMK) is a new nanomaterial that recently began to be used in concrete production. However, the exact production process and its specific application mechanism are still under research (Guo et al., Reference Guo, Fan and Luan2018). Metakaolin (MK) is a nearly amorphous, highly reactive pozzolanic material that is produced by thermal treatment of kaolinite clay within a temperature range of 650–800°C (Sabir et al., Reference Sabir, Wild and Bai2001). During thermal activation, dehydroxylation of kaolin leads to phase transformation (Moodi et al., Reference Moodi, Ramezanianpour and Safavizadeh2011). Pozzolans such as MK are used in the concrete industry to improve the technical characteristics of concrete, mainly its strength, durability and rheological properties (Ilic et al., Reference Ilic, Radonjanin, Malešev, Zdujić and Mitrović2017). The improvement of these properties is related to the reactivity of MK, as its addition leads to the formation of supplementary cementitious compounds (Ilic et al., Reference Ilic, Mitrović, Zdujić and Ljiljana2018). Nanoparticles used as substitutes for other supplementary cementitious materials of larger particle size could perform equally well or even better than MK at lower quantities (Morsy et al., Reference Morsy, Al-Salloum, Abbas and Alsayed2012). To produce NMK, a size reduction procedure is necessary, which can be achieved by following an appropriate milling process. Additionally, a high-energy milling process can simultaneously cause amorphization of kaolinite.
High-energy ball-milling (HEBM) is a widely used technique for the synthesis of nanomaterials. This process is an environmentally friendly and low-cost procedure due to the low processing temperatures and therefore low energy consumption (Tole et al., Reference Tole, Habermehl-Cwirzen, Rajczakowska and Cwirzen2018). During the milling process, plastic deformation, cold welding and fracturing of the particles occur, leading to material size reductions and morphological transformations. Milling not only produced a fine particle size but also blends the particles, transforming the material composition into new phases (Ilic et al., Reference Ilic, Radonjanin, Malešev, Zdujić and Mitrović2017). The efficiency of the milling process depends on several parameters, such as time, the ratio of balls to processed material, the use of grinding aids and the speed, among others. Optimization of these parameters may result in greater amorphization rates of the clay minerals over shorter time periods (Tole et al., Reference Tole, Habermehl-Cwirzen, Rajczakowska and Cwirzen2018). Finally, the produced material is usually in the form of thin flakes or flake stacks depending on the choice of the balls used (diameter, material, etc.) and the type of milling (Morsy et al., Reference Morsy, Alsayed and Aqel2010). Specifically, the formation of NMK mainly involves layering or stacking of flakes due to strong Van der Waals forces. The NMK structure, owing to its fine particle size, increases the tendency for agglomerate formation. These agglomerates cause difficulties in the use of the material in mixtures as they reduce the homogeneity of these mixtures (Ilic et al., Reference Ilic, Mitrović, Zdujić and Ljiljana2018). This obstacle can be overcome with the incorporation of nanoparticles in liquid dispersions or the application of mechanical grinding before use.
The morphological properties of MK after size reduction from micro-size to nano-size change, as the size reduction leads to greater surface area and consequently greater reactivity (Tole et al., Reference Tole, Habermehl-Cwirzen, Rajczakowska and Cwirzen2018). More specifically, the NMK particles act as ‘nuclei’ of hydration, have pozzolanic properties and fill the pores, rendering their use favourable in cementitious matrices when the target is to improve reinforcement (Li et al., Reference Li, Xiao, Yuan and Ou2004). Many studies have reported that replacing cement with very small amounts of nanomaterials has a positive impact on the mechanical performance of cement-based composites by accelerating the pozzolanic reaction, thus improving workability and enhancing durability (Morsy et al., Reference Morsy, Shoukry, Mokhtar, Ali and El-Khodary2018).
Further investigation is needed for the production of NMK if the aim is to optimize the existing processes and up-scale equipment for the transition to large-scale production. New studies could help to maximize the potential of NMK as an alternative nanomaterial for use in the concrete industry (Ilic et al., Reference Ilic, Mitrović, Zdujić and Ljiljana2018).
This paper is an investigation of NMK synthesis through HEBM under differing time and speed conditions. Using this technique, transformation to MK and size reduction to the nanoscale occur in a one-step process. All activated samples were fully characterized to examine the effects of the process parameters and to determine the optimum conditions for NMK production.
Materials
Two kaolins of differing purities were used in this study, originating from Cornwall, UK, and supplied by Imerys Minerals Ltd Co. The kaolin Supreme had the highest purity (>95% kaolinite), and the kaolin Polwhite E was the one with the lowest purity (75% kaolinite), containing impurities such as mica, feldspar and quartz. Additionally, the commercial MK Metastar, produced by thermal activation of high-purity kaolin, was used as a reference for comparison with the produced MK samples. Table 1 lists the chemical compositions of the kaolin and MK samples.
Chemical compositions of the raw kaolin samples and commercial MK (% w/w).
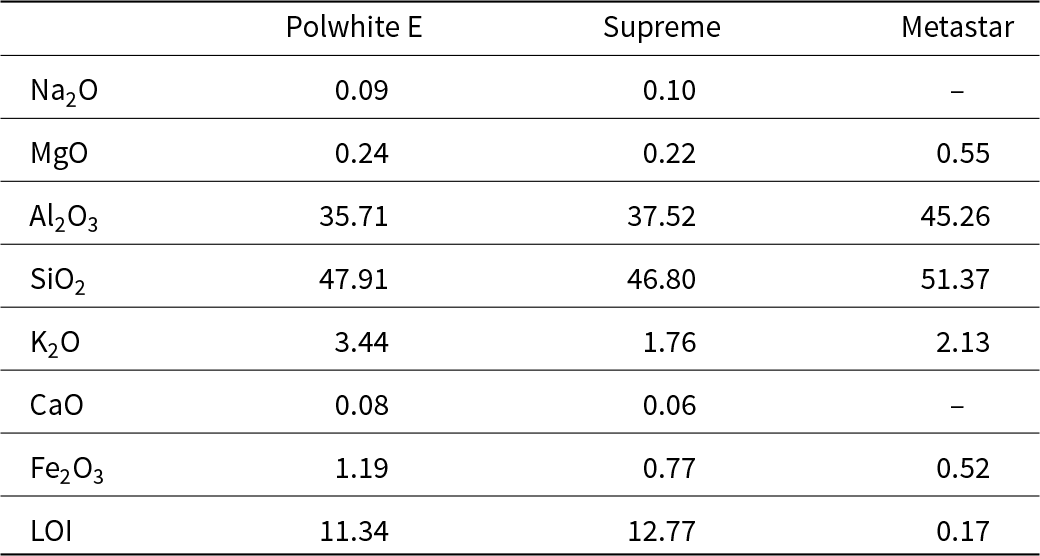
LOI = loss on ignition.
Experimental
X-ray fluorescence
The chemical analysis of the raw materials (Table 1) was performed by wavelength-dispersive X-ray fluorescence (WDXRF) using a Rigaku ZSX Primus IV XRF spectrometer. Loss on ignition (LOI) was determined by heating 1 g of raw kaolin at 1000°C for 1 h.
X-ray diffraction
The mineralogy of both the raw and mechanical activated samples was examined with X-ray diffraction (XRD) using a Bruker D8 Focus diffractometer in the range 5–70°2θ (step size: 0.02°2θ min–1) with Cu-Kα radiation (1.54 Å). Data analysis was performed using Bruker software DIFRAC.EVA.
Fourier-transform infrared spectroscopy
Fourier-transform infrared (FTIR) spectroscopy analysis was performed to identify the types of chemical bonds and to observe the differences between raw and activated samples using a Perkin Elmer Spectrum 100 spectrometer with a ZnSe attenuated total reflectance crystal. All of the samples were analysed within the wavelength range of 4000–650 cm−1.
Thermal analysis
The thermal behaviour of all the samples was investigated using differential thermal analysis (DTA) and thermogravimetric (TG) analysis with a Labsys TG-DTA/DSC thermal analyser (Setaram, France). The raw materials were heated in the temperature range of 20–800°C and MK was mechanical activated samples in the temperature range 20–600°C, both with a heating rate of 20°C min–1 in a He atmosphere and using a Pt crucible.
Particle-size distribution
The particle sizes of the initial kaolin and commercial MK samples were measured using a Horiba Particle Size Distribution Analyzer LA-960. For the mechanically activated samples, the method of dynamic light scattering (DLS) was selected for particle-size measurement due to the very small size of the produced particles. An Anton Paar Litesizer 500 equipped with a back-scattering detector was used for these measurements. The samples were prepared as a suspension in distilled water and measurements were made in duplicate.
Specific surface area analysis
The specific surface area of the activated samples was measured using a NOVA 1200 Quantachrome analyser. Samples were degassed at 250°C for 2 h under low-vacuum conditions. The specific surface area of the samples was calculated according to the Brunauer–Emmett–Teller (BET) method from the linear part of the nitrogen adsorption isotherms, and the total pore volume (V total) was given at P/P 0 = 0.998.
Scanning electron microscopy analysis
The changes in the microstructure of the material after mechanical activation and the general morphology of the particles were observed with scanning electron microscopy (SEM) using a JEOL 6380 LV electron microscope. The samples were observed in low-vacuum mode in their raw form (powder), without coating.
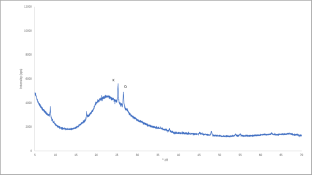
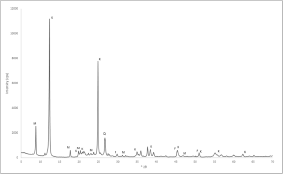
XRD trace for Metastar. K= kaolinite; Q = quartz.
Pozzolanic activity test
The reactivity of the activated kaolin and commercial MK samples was assessed using the modified Chapelle test according to NF P18-513 standard. This test allows for quantification of the consumption of Ca(OH)2 by 1 g of MK when mixed with 2 g of CaO in distilled water. The solution was heated at 90°C for 16 h, and then it was cooled to room temperature. The Ca(OH)2 content that was finally consumed was determined by sucrose extraction and acid titration (Eferraz et al., Reference Eferraz, Andrejkovičová, Hajjaji, Velosa, Silva and Rocha2015). The pozzolanic activity was determined from the Ca(OH)2 consumption. Increased consumption values indicate more reactive materials.
Activation procedure
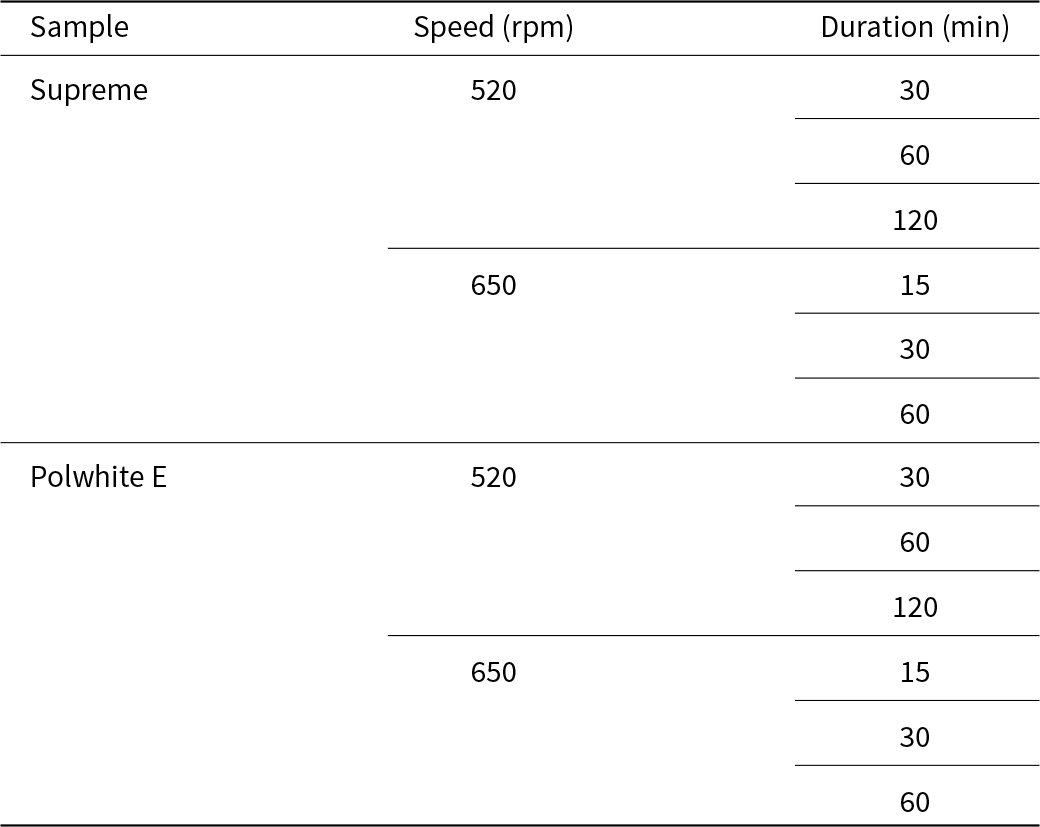
Mechanical activation was carried out using a planetary high-energy ball mill PM 100 (Retsch) with an agate jar of 500 mL volume. In total, 74 agate balls of various diameters, ranging between 5 and 20 mm, were used. In each milling run, ∼ 30–40 g of kaolin was milled, and the ratio of balls to powder mass was 25. The examined process parameters are presented in Table 2.
Process parameters of the mechanically activated kaolin.
Results and discussion
Metastar
Figure 1 shows the XRD trace of Metastar. The two significant kaolinite peaks are visible, though their intensity is relatively low. Additionally, a low-intensity quartz peak is also detected.
The FTIR spectrum (Fig. 2) confirmed the loss of the crystalline structure of the material. All characteristic kaolinite bands have disappeared, implying near completion of the dehydroxylation process. Bands and their assignments (Saikia & Parthasarathy, Reference Saikia and Parthasarathy2010) are presented in Table 3.
FTIR spectrum of Metastar.
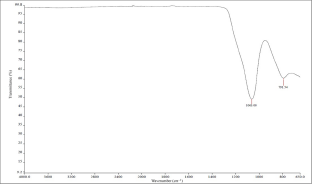
Infrared band positions and band assignments of Metastar.

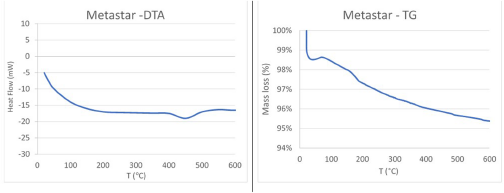
Figure 3 illustrates the thermal curves of commercial MK. Both diagrams confirm the XRD and FTIR spectroscopy results, showing that no exothermic reaction has occurred, as the material is completely amorphous. Additionally, the sample presented a mass loss of only 2–3%.
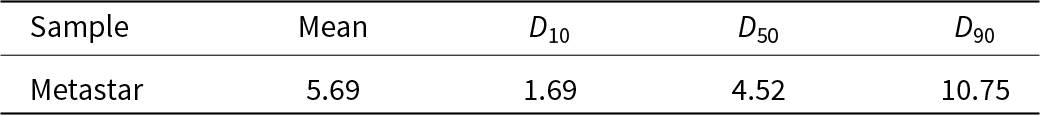
Table 4 lists the particle-size distribution of the sample.
Particle-size (µm) distribution results of Metastar.
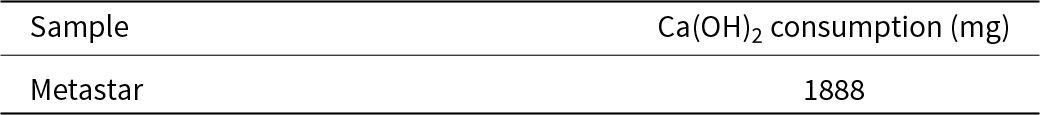
The results from the Chapelle test, shown in Table 5, indicate significant Ca(OH)₂ consumption, suggesting a high level of pozzolanic activity. This characteristic is the most significant for comparison with the mechanically activated samples.
Chapelle test results for Metastar.
Kaolin Polwhite E
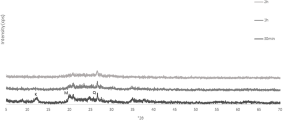
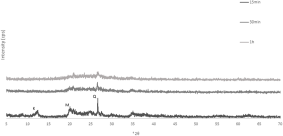
The XRD trace of kaolin Polwhite Ε is presented in Fig. 4. The sample consists of kaolinite with minor quartz mica and feldspar. Mechanical activation gradually decreased the intensity of the kaolinite peaks. Even at the lower milling duration the kaolinite peaks disappeared (Figs. 5 & 6). The peaks that were still visible belong mainly to quartz and some mica and felspar. However, mica and feldspar peaks also disappeared after longer milling times (120 min at 520 rpm and 60 min at 650 rpm), indicating complete amorphization of these phases. For Polwhite E the intensity of the quartz reflections decreased slightly without disappearing completely, even after the longest duration of milling.
DTA and TG curves of Metastar.
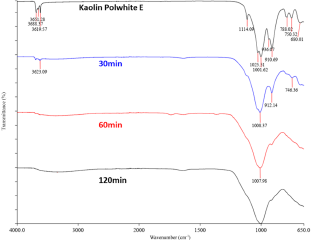
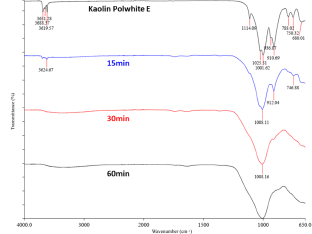
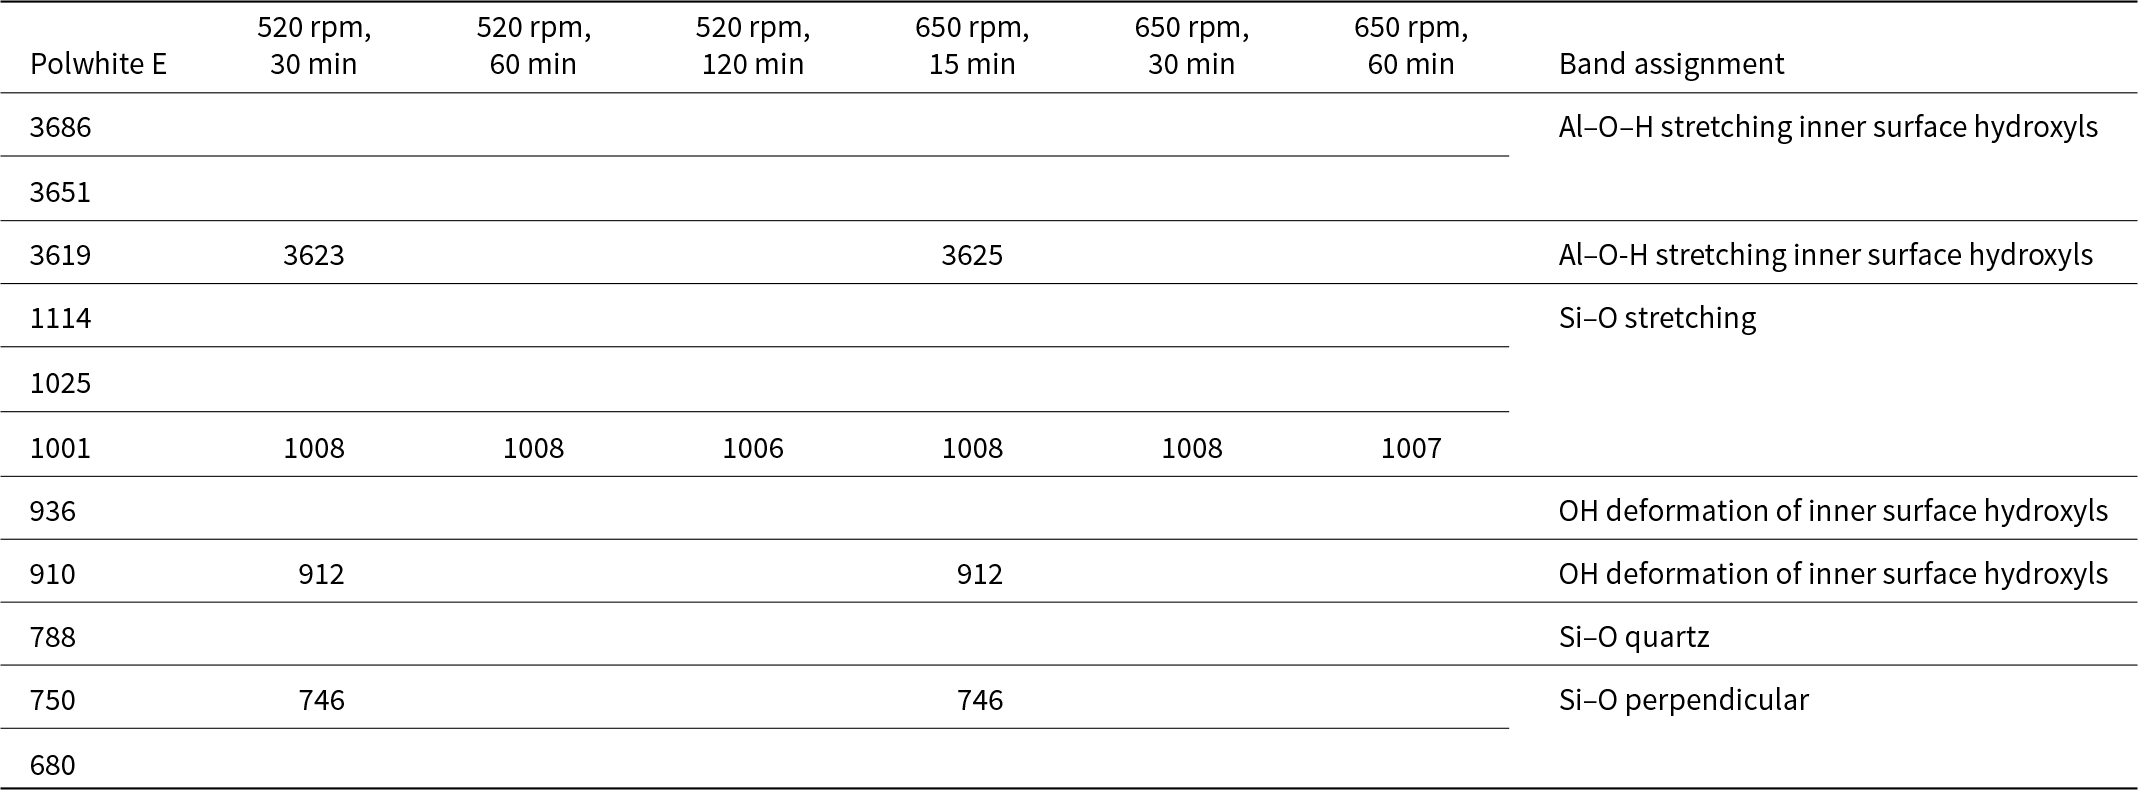
Comparable results were obtained during the FTIR analysis (Figs. 7 & 8). For both milling speeds the spectra of initial kaolin and the activated samples differ significantly and are characterized by intensity reductions or even disappearances of the kaolinite bands due to the transformation into MK. At shorter milling times, the conversion to metakaolinite is not complete, but at longer milling times, the bands characteristic of kaolinite disappeared, suggesting an amorphous material. The bands at 3696 and 3623 cm–1 correspond to the stretching vibrations of inner surface and inner hydroxyl groups, respectively. Wavelengths ranging from 1007 to 1010 cm–1 correspond to Si–O stretching and did not differ among the various samples, indicating that this band was not significantly affected by milling. Bands at 912 and 746 cm–1 correspond to hydroxyl and Si–O–Si bending, respectively.
XRD trace for kaolin Polwhite E. F = feldspar minerals; K = kaolinite; M = mica minerals; Q = quartz.
XRD traces of mechanically activated products of kaolin Polwhite E at 520 rpm.
XRD traces of mechanically activated products of kaolin Polwhite E at 650 rpm.
FTIR spectra of kaolin Polwhite E and corresponding mechanically activated products at 520 rpm.
FTIR spectra of kaolin Polwhite E and corresponding mechanically activated products at 650 rpm.
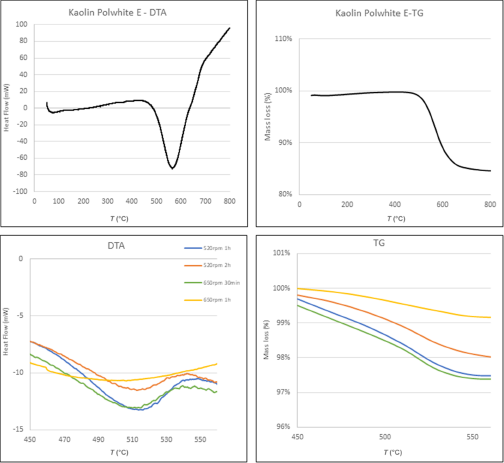
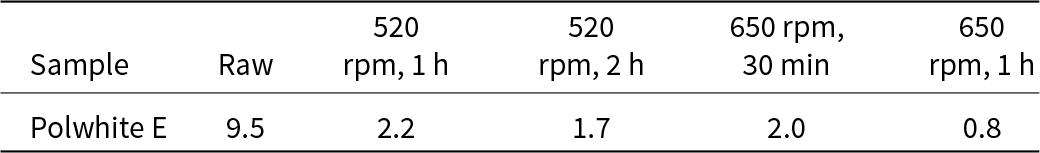
The TG-DTA analysis showed that for Polwhite E, dehydroxylation started at ∼ 500°C and ended at ∼ 630°C, being centred at 570°C (Fig. 9). The DTA analysis of the mechanically activated samples revealed the degree of the amorphization (Fig. 9). As the milling time and speed increased, the endothermic peak assigned to the dehydroxylation became broader and shifted to lower temperatures.
DTA and TG curves of kaolin Polwhite E and its mechanically activated products.
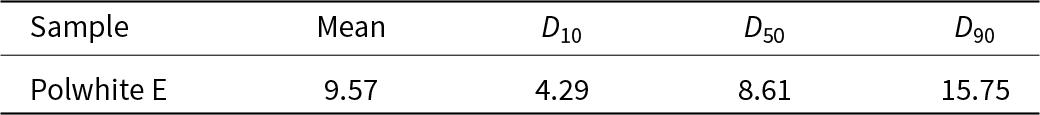
The differences in TG weight loss between the mechanically treated samples and the raw material were remarkable (Table 6). This is attributed to progressive dehydroxylation caused by mechanical deformation during milling.
Weight loss (%) of kaolin polwhite e and its mechanically activated samples.
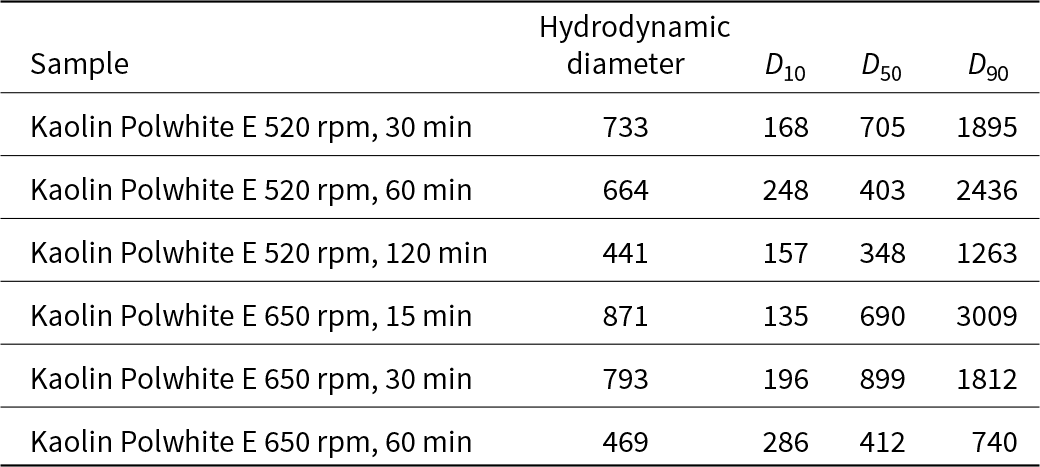
The particle-size distributions of the initial material and all of the activated samples are listed in Tables 7 & 8. The particle diameters of all of the activated samples were less than 1000 nm, suggesting that they are nanoscale materials (European Commission, 2011; ISO, 2023). For both milling speeds, as the activation time increased, the particle diameter increased.
Particle-size (µm) distribution results of kaolin Polwhite E.
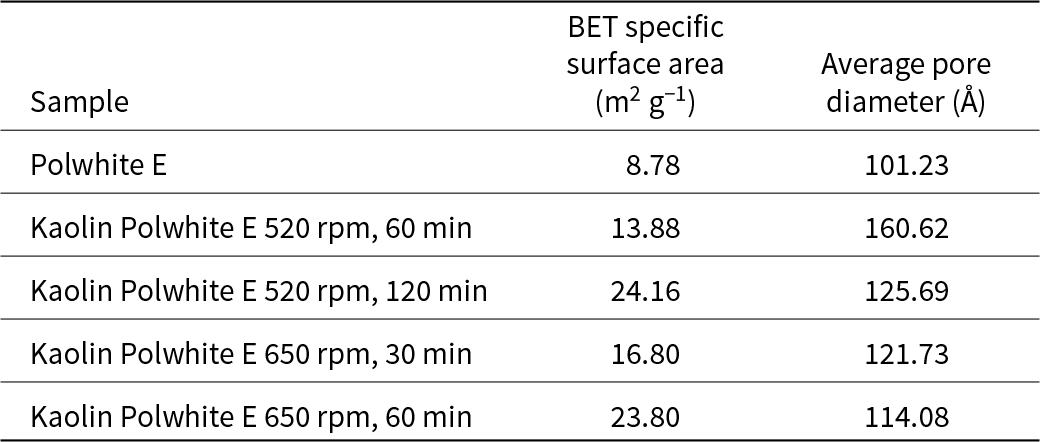
Mechanical activation significantly increased the specific surface area and was affected by the milling duration, while the increase in the average pore volume was very low and was practically independent of the milling speed and duration (Table 9).
BET specific surface areas and average pore diameters of the Polwhite E samples.
Τhe reactivity results from the Chapelle test of the activated samples are presented in Table 10. Pozzolanic activity slightly increased with increased milling duration from 520 to 650 rpm. The reactivity of the measured samples does not appear to approach the value observed for the commercial MK Metastar (1888 mg of Ca(OH)2).
Chapelle test results for all of the mechanically treated samples and commercial MK.
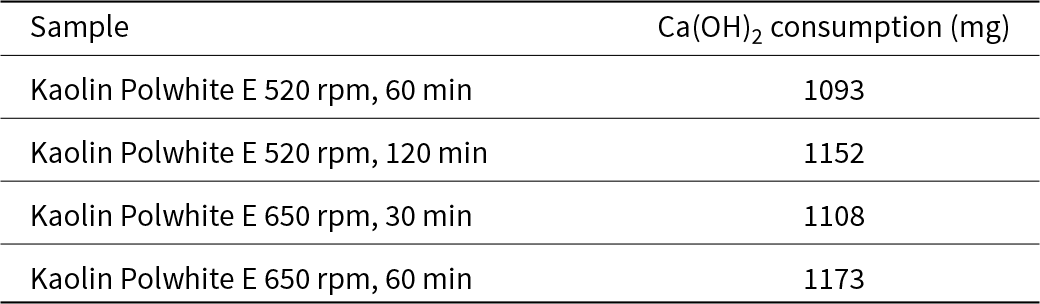
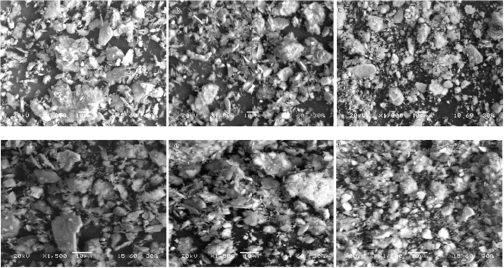
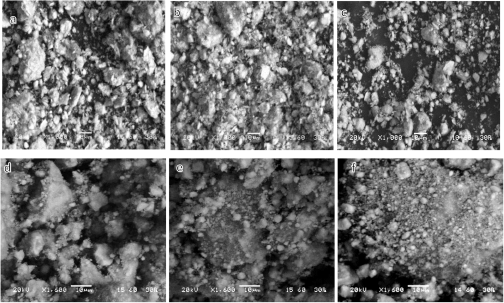
Figure 10 shows the morphology of the mechanically activated samples. Due to the excessively small size (<1000 nm) and the presence of agglomerates, the SEM results can only provide a general overview of the material's microstructure and do not constitute a criterion regarding the actual size of the particles. However, an increase in grinding speed generally leads to a reduction in the size of particles. Simultaneously, the morphology of the particles appeared to change, starting angular and becoming more spherical. After grinding at a speed of 650 rpm, the number of agglomerates increased over time, but after grinding at 520 rpm, the formation of agglomerates was not so pronounced as it was at 650 rpm. This confirmed the results of the particle-size analysis (Tables 8 & 11).
Infrared band positions (cm–1) and band assignments of kaolin Polwhite E and its mechanically activated products.
Kaolin Supreme
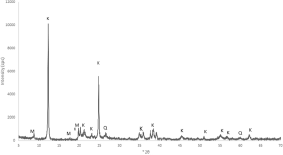
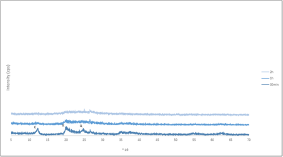
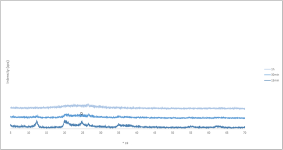
The XRD traces of Supreme are presented in Fig. 11. The sample consists mainly of kaolinite, with minor quartz, mica and feldspar. Mechanical activation (Figs. 12 & 13) initially decreased the intensity of the kaolinite peaks, and milling for 60–120 min at 520 rpm and for 30–60 min at 650 rpm led to complete amorphization of the samples. In addition, quartz peaks were initially visible but disappeared after longer milling times.
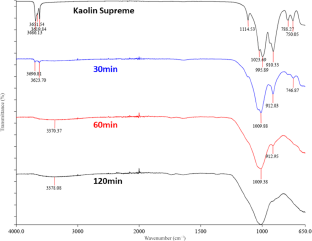
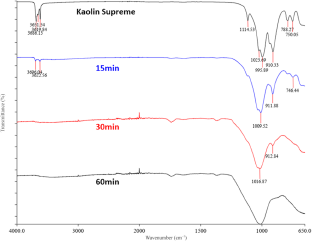
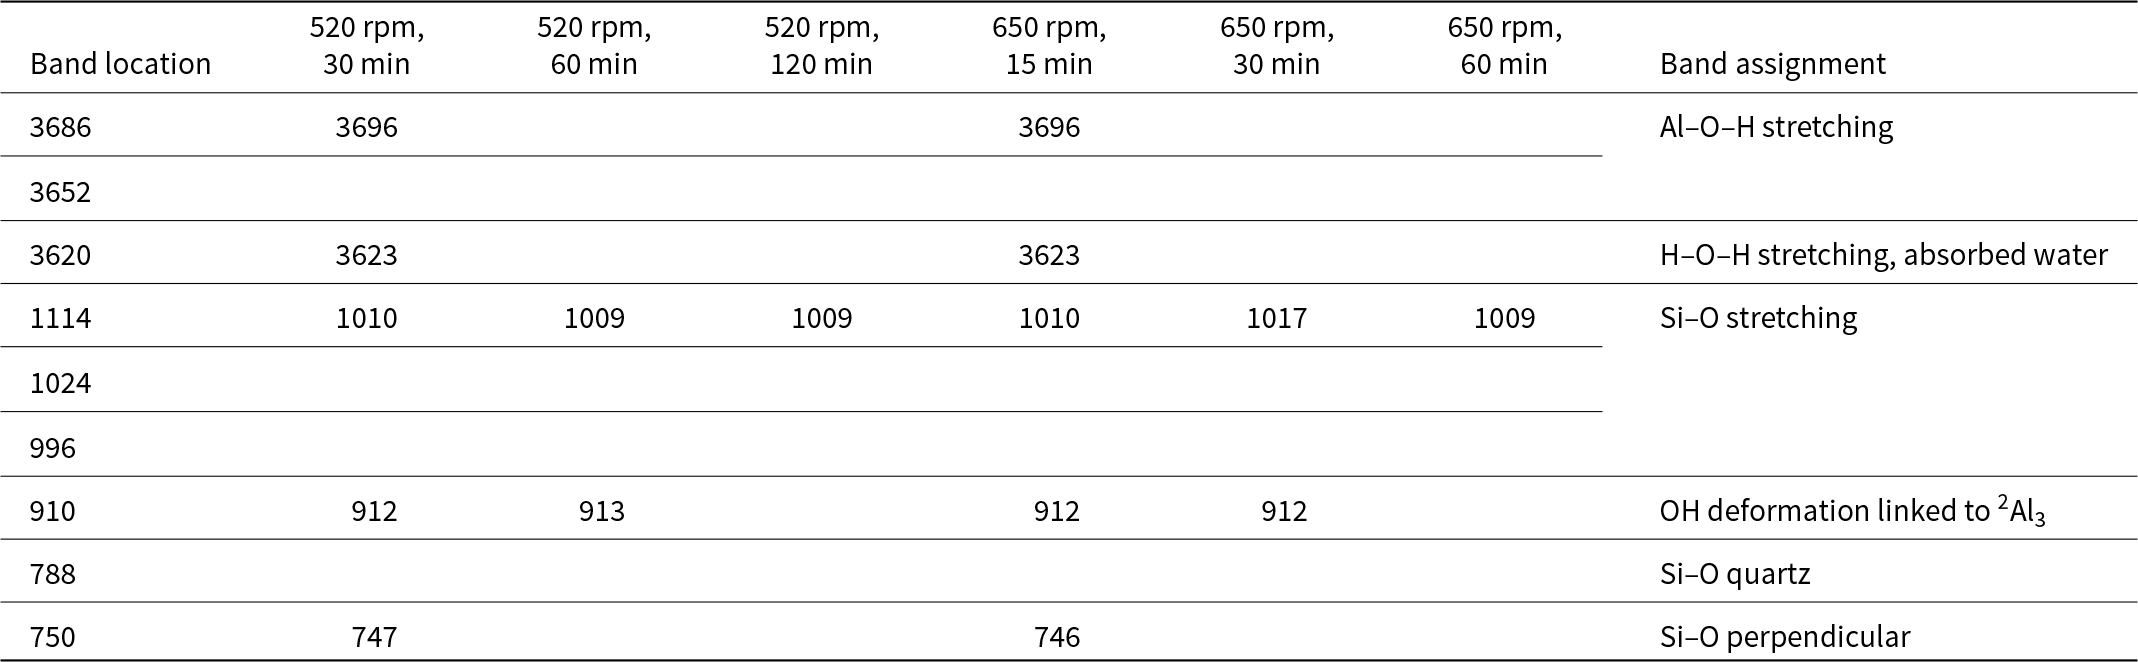
Figures 14 & 15 show the characteristic FTIR bands of the kaolinite and the changes that occurred after mechanical activation. Activated samples showed significant differences compared to the original kaolin. The bands were retained only after short treatments but at a low intensity. For longer milling periods all bands disappeared due to transformation into MK. Generally, the changes and the reductions of the band intensities in the FTIR spectra were similar for the two kaolin samples. The bands at 3696 and 3623 cm–1 are attributed to stretching of inner surface and inner hydroxyl groups, respectively. The bands at 1007–1010 cm–1 due to Si–O stretching exhibited consistent behaviour across all samples, suggesting minimal impact from processing. Finally, the bands at 912 and 746 cm–1 correspond to hydroxyl and Si–O–Si bending, respectively (Table 12).
Particle-size (nm) distribution results of kaolin Polwhite E mechanically activated samples.
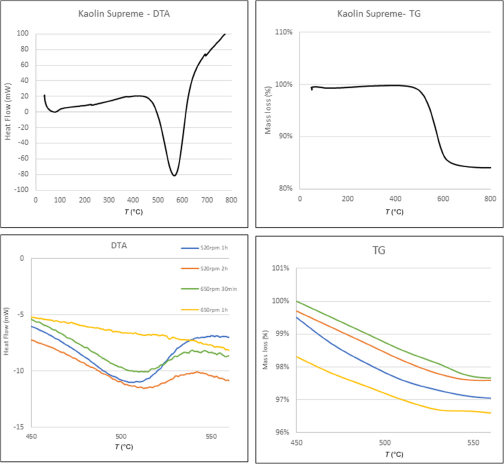
Dehydroxylation of the Supreme kaolin began at ∼510°C and ended at ∼610°C, being centred at 570°C (Fig. 16). After mechanical treatment, the endothermic peak became broader, starting (∼480°C) and ending (∼530°C) at lower temperatures for treatments of longer duration and greater speed (Fig. 16).
Table 13 lists the weight loss from the TG analysis of both the raw and mechanically activated samples. The mass loss due to dehydroxylation decreased significantly for milled samples.
SEM images of mechanically activated kaolin Polwhite E samples ground at 520 rpm for (a) 30 min, (b) 60 min and (c) 120 min and at 650 rpm for (d) 15 min, (e) 30 min and (f) 60 min. scale bars = 10 μm.
Weight loss (%) of kaolin Supreme and its mechanically activated products.
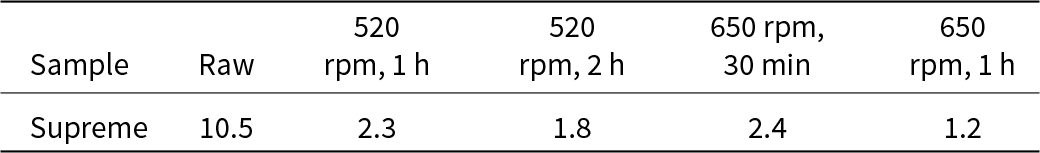
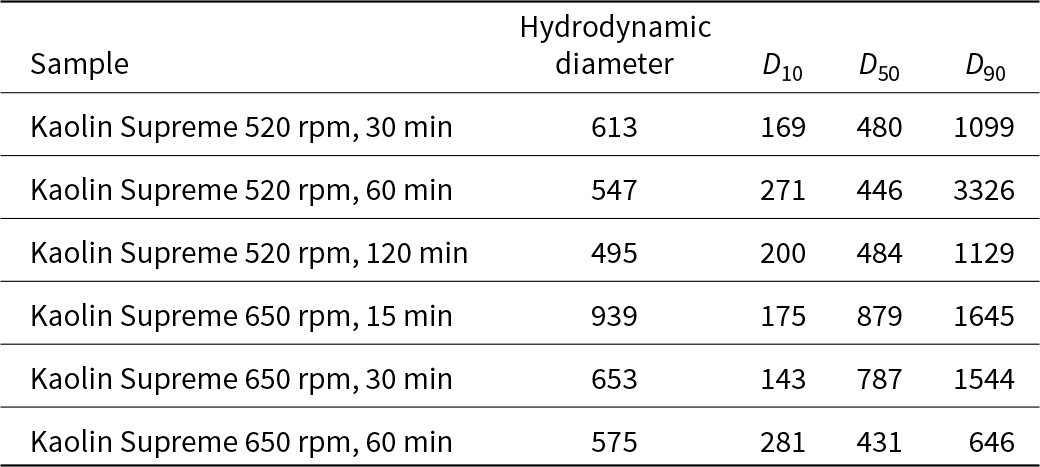
Table 14 shows the changes in particle-size distribution of the original and the activated samples. All mechanically activated samples were smaller than 1000 nm in size (Table 15). Size decreased as the treatment time increased at the same speed.
Particle-size (µ) distribution results of kaolin Supreme.
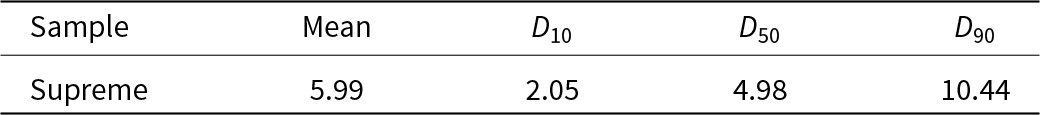
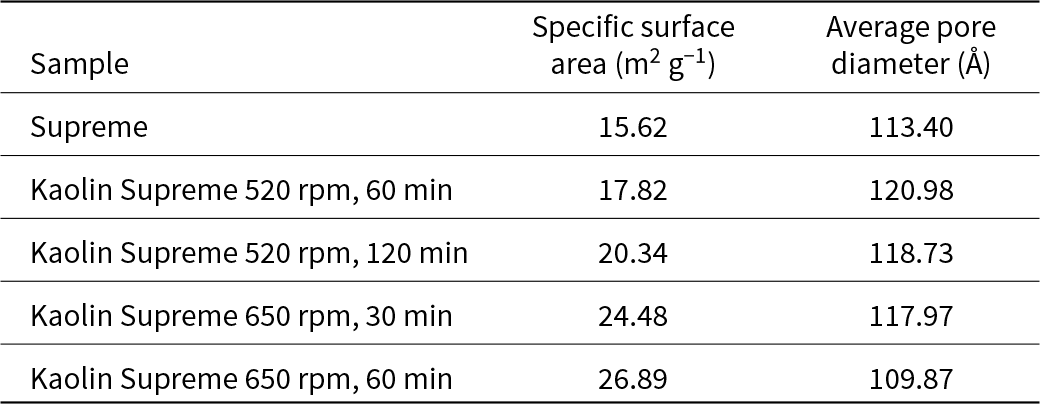
Table 16 presents the specific surface areas and pore diameters of Supreme and the fully activated products. The specific surface area of the treated kaolin increased and its porosity decreased with increased grinding time. For a grinding speed of 650 rpm, the specific surface area was significantly larger compared to that of the raw kaolin. Generally, for Supreme, the specific surface area appears to be higher compared to Polwhite E. In addition, the pore diameter decreased slightly with increasing specific surface area. The porosity was directly correlated with the existence of the agglomerates, so in certain products it increased rather than decreased.
BET results for specific surface area and average pore diameter of all Supreme samples.
The results from the Chapelle test for the fully activated samples are listed in Table 17. Reactivity values increased as speed and time increased, but the changes in their values remained relatively small. In comparison with Polwhite E, the reactivity values of Supreme were higher. However, compared to Metastar, both Polwhite E and Supreme samples displayed lower reactivity.
Chapelle test results for the kaolin Supreme mechanically treated samples.
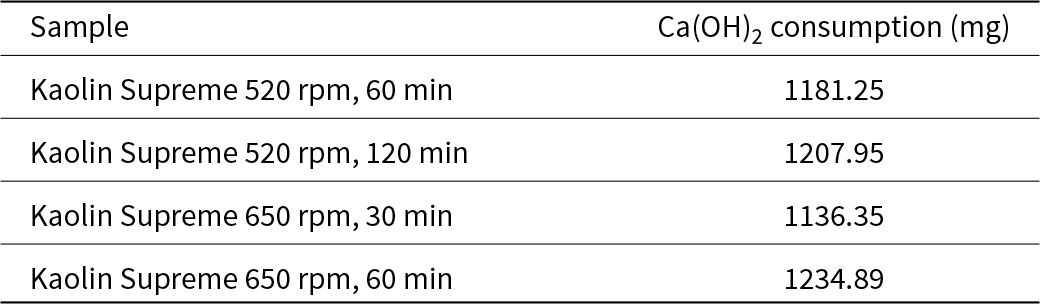
Figure 17 shows the microstructure of the treated samples. At both treatment speeds, there was tendency for stack formation and there were differences in the shape and size of particles. More specifically, greater treatment speed typically resulted in diminished particle size, yielding particles with more a spherical shape. At 650 rpm, agglomeration increased over time, whereas at 520 rpm, agglomeration was less pronounced. This phenomenon persisted irrespective of kaolin quality; however, the overall examination of both materials suggested that Supreme exhibited a finer texture compared to Polwhite E.
Based on the XRD traces of the mechanically activated samples, the samples produced from Supreme had fewer impurities compared to those from Polwhite E, indicating that the transformation of Supreme into MK was easier and required less time to be completed. Generally, a speed of 650 rpm gave better results concerning the complete amorphization of both kaolin types.
The FTIR spectra showed reductions in the number and intensity of the kaolinite bands, probably due to the transformation process. More specifically, mechanical treatment caused a significant decrease in the intensity or even elimination of the following bands:
•The Al–O–H stretching bands (3696–3619 cm–1)
•The Si–O bands (1114–1001 cm–1, 788–680 cm–1)
•The OH deformation band of inner surface hydroxyls (936 cm–1)
•The OH deformation band of inner surface hydroxyls (913–910 cm–1)
XRD trace of kaolin Supreme. K = kaolinite; M = mica; Q = quartz.
XRD traces of mechanically activated samples of kaolin Supreme at 520 rpm. K = kaolinite; M = mica; Q = quartz.
XRD traces of mechanically activated samples of kaolin Supreme at 650 rpm. K = kaolinite; M = mica; Q = quartz.
FTIR spectra of kaolin Supreme and its mechanically activated products at 520 rpm.
FTIR spectra of kaolin Supreme and its mechanically activated products at 650 rpm.
Infrared bands and band assignments of kaolin Supreme and its mechanically activated products.
DTA and TG curves of kaolin Supreme and mechanically activated products.
The bands at 3625–3619 cm–1 (inner OH-stretching) were retained only in those samples processed for short durations (30 min for 520 rpm and 15 min for 650). This proves that the octahedral sheets were not completely destroyed, as was also observed in the XRD analysis. The total disruption of these bonds was accomplished at longer milling times, causing the distortion of the crystalline structure of kaolinite and the formation of metakaolinite (Giuseppe et al., Reference Giuseppe, Maria Teresa, Letterio and Salvatore2024). Hence, mechanical activation modified the OH-stretching bands of kaolinite, whereby the OH groups were irreversibly disrupted during processing. Deformation of the hydroxyl groups leads to the release of structural water due to mechanical dehydroxylation (Derouiche & Baklouti, Reference Derouiche and Baklouti2021). Finally, the presence of bands located in the range of 1017–1006 cm–1 could be attributed to the various modes of vibration of the Si–O bond (Cao et al., Reference Cao, Su, Lu and Yang2005). Amorphization of the samples was also confirmed by comparing the XRD and FTIR analyses with those of the commercial MK, Metastar. Both analytical methods showed similar results for Metastar and the mechanically activated samples, especially at longer treatment times for each speed.
The thermal behaviour of the raw and activated samples was evaluated by DTA and TG analysis. The raw materials displayed minor differences in their dehydroxylation temperatures. The DTA curve of Supreme was sharper compared to Polwhite E, suggesting that Supreme was a more structurally ordered material (Kakali et al., Reference Kakali, Perraki, Tsivilis and Badogiannis2001). Increases in milling duration and speed shifted the dehydroxylation peak to lower temperatures. The peak became wider, started at lower temperatures and was completed at lower temperatures. Additionally, the dihydroxylation peak was less symmetrical due to the increase in defects in the octahedral sheet (Ilic et al., Reference Ilic, Radonjanin, Malešev, Zdujić and Mitrović2016). The decrease in dehydroxylation temperature is attributed to the particle-size reduction and the increase in structural disorder (Franco et al., Reference Franco, Pérez Maqueda and Pérez-Rodríguez2003). Regarding the TG analysis, the differences between the mechanically treated samples and raw materials were significant because of the release of structural water and transformation of the structure. The mass loss occurred in the temperature range 450–550°C. The mass loss of the mechanically treated samples was comparable to that of the commercial product.
Particle-size (nm) distribution results of kaolin Supreme mechanically activated samples.
SEM images of mechanically activated kaolin Supreme samples ground at 520 rpm for (a) 30 min, (b) 60 min and (c) 120 min and at 650 rpm for (d) 15 min, (e) 30 min and (f) 60 min. scale bars = 10 μm.
Regarding particle size, DLS results showed that the treated samples had particle diameters smaller than 1000 nm, verifying that they were nanoscale materials. For both milling speeds, as the process duration increased, the particle diameter decreased. However, for most samples, 90% of the total volume of the material had a particle size equal to or smaller than 1000–3000 nm. This indicates an increase in particle size because of the agglomeration of small particles, which has already been reported for continuous milling processes (Suraj et al., Reference Suraj, Iyer, Rugmini and Lalithambika1997). Thus, small particles tended to adhere to each other due to the increase in surface energy and tension of the amorphous surface layers formed during grinding. Only for the samples activated at 650 rpm for 60 min were the particle sizes smaller than 1000 nm.
The mechanical activation increased the specific surface area of the particles compared to the original kaolin. As the milling duration and speed increased, the reactive surface are became greater, and for most of the samples the average pore diameter increased slightly due to stacking and agglomeration of the particles (Ilic et al., Reference Ilic, Radonjanin, Malešev, Zdujić and Mitrović2016). Changes in particle morphology and size during mechanical activation may cause increases in the mesopore volume (Li & Fan, Reference Li and Fan2022). This can be explained according to the activation process leading to a distortion of the crystal structure of the octahedral sheets, allowing an increase in the volume of micropores and therefore an increase in total porosity. This was also confirmed by analysing the SEM images of the present study. For longer milling times, the powder particles became smaller and began to agglomerate. Additionally, a noticeable difference between the activated and raw materials is the change in particle shape from plate-like pseudohexagonal particles in the raw material to more round-edged particles in the milled material. Although SEM provided a general view of the microstructure, it was not an appropriate method for particle-size calculations due to the stacking and agglomeration tendencies of the material.
Finally, the Supreme samples had greater reactivity than their Polwhite E counterparts. The reactivities of the Polwhite E and Supreme samples increased with increasing milling time at both 520 and 650 rpm. Under the studied milling conditions, the pozzolanic activity values for all samples were significantly lower than the reactivity value of the commercial metakaolin MK Metastar (1880 mg Ca(OH)2). This difference is due to variations in the activation process and structural changes. However, this does not mean that the material is ineffective; these lower values might still indicate suitability for specific applications, such as concrete enhancement, as the milling process alters a material's structure and properties, making direct comparisons to raw materials non-meaningful (Ilic et al., Reference Ilic, Radonjanin, Malešev, Zdujić and Mitrović2017; Reference Ilic, Mitrović, Zdujić and Ljiljana2018).
Conclusions
The results obtained in this study allow us to draw the following conclusions:
• The purity of the initial kaolin affected the dehydroxylation process (Kosmidi et al., Reference Kosmidi, Panagiotopoulou, Angelopoulos and Taxiarchou2021). The higher-purity kaolin quality (Supreme) was more easily transformed into MK and had better thermal behaviour than lower-purity kaolin (Polwhite E).
• The mechanically activated samples of Polwhite E presented less weight loss, indicating that the amorphization process probably was prevented.
• Milling at a lower speed (520 rpm) required more time to obtain similar products to those obtained at a higher speed (650 rpm).
• Apart from the optimum combination of milling speed and time, the optimum activation conditions depended on the raw material and the desired final properties.
• Mechanical activation reduced the particle size and increased the specific surface area of the kaolin. However, there was an increased tendency for the formation of agglomerates, suggesting that incorporation of the material into the cement matrix might need further examination.
• The reactivity of the activated materials produced in this study was significantly lower than that of the commercial MK, Metastar (1880 mg Ca(OH)2). The greatest value obtained was 1234.89 mg Ca(OH)2 for kaolin Supreme activated at 650 rpm for 1 h.
• The pozzolanic activity values for mechanically activated samples differed from those of their thermally activated counterparts, but this does nοt indicate that the samples did not obtain necessary reactivity. To fully evaluate the performance of these materials in concrete, special application tests would need to be conducted.
Acknowledgements
The authors thank Imerys Minerals Ltd for supplying the raw materials that were used in this research and Creative Nano for the support concerning some of the necessary measurements.
Financial support
This research did not receive any specific grant from funding agencies in the public, commercial or not-for-profit sectors.
Conflicts of interest
The authors declare none.


 Open access