


Introduction
The responsiveness of political parties is a central feature of party competition in democratic systems. Either party responds to voters’ preferences changing in office – the direct responsiveness – or they are voted out of office – the indirect responsiveness (Stimson, MacKuen, and Erikson Reference Stimson, MacKuen and Erikson1995). Based on spatial voting theories (Downs Reference Downs1957), political parties are expected to adapt their positions to the position of voters to avoid electoral backlashes and collect electoral gains.
So far, the literature has examined responsiveness to the median voter (e.g., Adams, Clark, Ezrow et al. Reference Adams, Clark, Ezrow and Glasgow2004; Adams, Haupt, and Stoll Reference Adams, Haupt and Stoll2009) and political parties’ responsiveness to their electorate, on the other (e.g., Ibenskas and Polk Reference Ibenskas and Polk2022). While the literature is flourishing (Adams, Clark, Ezrow et al. Reference Adams, Clark, Ezrow and Glasgow2004; Adams, Haupt, and Stoll Reference Adams, Haupt and Stoll2009; Dassonneville, Fréchet, Jabbour et al. Reference Dassonneville, Fréchet, Jabbour, Ferland and Homola2025; Ezrow, De Vries, Steenbergen et al. Reference Ezrow, De Vries, Steenbergen and Edwards2011; Klüver and Spoon Reference Klüver and Spoon2016; Koedam 2021; Steenbergen, Edwards, and De Vries Reference Steenbergen, Edwards and De Vries2007; Williams and Spoon Reference Williams and Spoon2015), key obstacles remain. First, the measures used to estimate parties’ responsiveness to voters’ positions are not necessarily reliable (Adams, Bernardi, Ezrow et al. Reference Adams, Bernardi, Ezrow, Gordon, Liu and Phillips2019), and as a consequence, not all studies do find evidence of responsiveness (O’Grady and Abou-Chadi Reference O’Grady and Abou-Chadi2019). Second, and related, as many measures are connected to the electoral arena, they are only available during election periods, i.e., every four or five years. This seems a rather limited research design given that the theoretical premise is that parties’ responsiveness to the electorate’s position shift – the direct form of responsiveness – is a vote-seeking behavior (Harmel and Janda Reference Harmel and Janda1994), meaning that political parties should aim to be responsive also between elections. Doing so means that a party knows what is happening within their electorate and, more broadly, where public opinion is heading. Also, there is ample evidence that parties react more short-term to changing public priorities (e.g., Bevan and Jennings Reference Bevan and Jennings2014; Bonafont and Palau Reference Bonafont and Palau2011) and to coalition dynamics within the electoral cycle (e.g., Bevan, Borghetto, and Seeberg Reference Bevan, Borghetto and Seeberg2024; Pardos-Prado and Sagarzazu Reference Pardos-Prado and Sagarzazu2019), and even that public policy is adapted in the short run (Burstein Reference Burstein2003; Lax and Phillips Reference Lax and Phillips2012). Third, the literature is surprisingly vague in theorizing and analyzing instances where the preferences of the median voters clash with those of the party electorate, probably because such situations are rare in the real world.Footnote 1
This paper aims to contribute to this literature on parties’ responsiveness and offers a remedy to the challenges mentioned above by studying party responsiveness in a different setting: we focus on the Swiss political context, where the frequent use of direct democratic institutions enables us to evaluate the dynamic responsiveness of political parties with several observations per year for a large variety of topics. We utilize the fact that political parties have to make their positions public before each popular ballot and match this with information on the median voter position as well as on their party electorate’s position in previous ballots. Moreover, our setting allows us to delve deeper into how parties resolve situations when the median voter and partisan supporters’ positions do not align. We argue and show empirically that party responsiveness always trumps median voter responsiveness, and parties act to represent their partisan supporters.
This study is based on the analysis of around 300 ballot proposals collected over 37 years. We use dynamic Bayesian IRT models to estimate the ideological meaning of ballot proposals to map voters and parties in one ideological space. We then analyze whether a change in party position is influenced by the previous support of this very position by different segments of the electorate, i.e., the median voters’ or the partisan supporters’ positions. The results indicate that political parties in this direct democratic setting are responsive to public opinion. However, they are not responsive to the median voter but to the party voter. Moreover, the analyses suggest that parties try to position themselves to represent better the party voter than the median voter.
In the next section, we discuss the responsiveness of political parties and formulate our expectations before delving deeper into the specificity of our setting of direct democracy and how this allows us to study responsiveness. Then, we present the research design data and method used in the analyses. Finally, we present the results and concluding remarks to discuss the implications of the findings.
Theory
The dynamic relationship between parties and voters is a key element of democracies and a strong link between public opinion, i.e., what citizens want, and the positions and actions of political actors, i.e., what representatives do, a defining feature of democratic rule: ‘The basic normative assumption is that policymakers in a democracy should do what the citizens want them to do’ (Strom, Muller, and Bergman Reference Strom, Muller and Bergman2003: 19). Political parties should thus be responsive to citizens’ wishes in their ideological position-taking. In essence, the literature has revealed two major forces for such a position change. First, based on spatial models of party competition, parties calibrate their positions in line with the median – often measured as the mean – voter (Adams, Haupt, and Stoll Reference Adams, Haupt and Stoll2009; Adams Reference Adams2012). Second, they adapt their position in response to shifts in their core constituency, i.e., party electorates (Ibenskas and Polk Reference Ibenskas and Polk2022; Schumacher, De Vries, and Vis Reference Schumacher, De Vries and Vis2013). Let us delve deeper into these forces now.
Many studies aim to evaluate if and to what extent parties are responsive to position shifts from the median voter. In general, studies found that parties are responsive to public opinion shifts on one or more ideological dimensions (Adams, Clark, Ezrow et al. Reference Adams, Clark, Ezrow and Glasgow2004; Adams, Haupt, and Stoll Reference Adams, Haupt and Stoll2009; Ezrow, De Vries, Steenbergen et al. Reference Ezrow, De Vries, Steenbergen and Edwards2011; Kluver and Spoon Reference Klüver and Spoon2016; Koedam 2021; O’Grady and Abou-Chadi Reference O’Grady and Abou-Chadi2019; Williams and Spoon Reference Williams and Spoon2015) and in attitudes towards European integration (Arnold, Sapir, and De Vries Reference Arnold, Sapir and De Vries2012; Spoon and Klüver Reference Spoon and Klüver2014; Spoon and Williams Reference Spoon and Williams2017; Steenbergen, Edwards, and De Vries Reference Steenbergen, Edwards and De Vries2007) and also highlight that this relationship could be conditioned by the salience voters attach to the issue (Franklin and Wlezien Reference Franklin and Wlezien1997; Klüver and Spoon Reference Klüver and Spoon2016; Malet and Thiebaut Reference Malet and Thiebaut2024; Steenbergen and Scott Reference Steenbergen and Scott2004). The main argument behind this literature is that parties should adapt their ideological or issue position to a position change by the median voter. Such behavior is argued to become more crucial given the growing shares of independent voters that parties want to appeal to as well (Dassonneville Reference Dassonneville2018) and to serve both vote and office-seeking purposes (Lehrer Reference Lehrer2012; Schumacher, Van de Wardt, Vis et al. Reference Schumacher, Van de Wardt, Vis and Klitgaard2015). Given the high visibility of the mean voter position in the Swiss direct democratic setting – parties just have to look at the outcome of the ballot, i.e., whether the proposals have gotten an electoral majority – we expect parties to adapt their positions in response to signals by the mean voter, i.e., the general electorate. Thus, we expect parties to adapt their position when the mean voter disagrees with their previous position – the mean voter hypothesis.
Although the responsiveness of parties to the mean voter should be a frequent phenomenon, empirical studies do not always confirm this expectation and often report rather low responsiveness of political actors to the mean voter. An important qualification concerns party heterogeneity in median voter responsiveness. It seems that especially mainstream parties are prone to responding to mean voter shifts (Adams, Clark, Ezrow et al. Reference Adams, Clark, Ezrow and Glasgow2006). Also, recently, Adams, Bernardi, Ezrow et al. (Reference Adams, Bernardi, Ezrow, Gordon, Liu and Phillips2019) showed that one core issue with the study of party responsiveness and studies relying on measures of ideology is that they do not correlate well across different data sources. Thus, it is difficult to give any reliable indication of parties’ responsiveness to the median voter’s position change. Using a more sophisticated measure of voters’ ideology on four dimensions developed by Caughey, O’Grady, and Warshaw (Reference Caughey, O’Grady and Warshaw2019), O’Grady and Abou-Chadi (Reference O’Grady and Abou-Chadi2019) found no evidence of parties’ responsiveness in their large study across European countries. Thus, either we consider that ‘[e]lections do not force successful candidates to reflect the policy preferences of the median voter, as Downsian logic implies’ (Achen and Bartels Reference Achen and Bartels2016: 48–49), or the median voter is overrated in the literature on parties’ responsiveness, and parties are responsive to more specific segments of the electorate.
A second important logic of responsiveness is that parties respond to shifts in their own electorates. While earlier literature found this behavior confined to niche or more activist-dominated parties (Adams, Clark, Ezrow et al. Reference Adams, Clark, Ezrow and Glasgow2006; Schumacher and Giger Reference Schumacher and Giger2018), recent work on European parties suggests that party responsiveness is the dominant behavior of political parties in Western Europe nowadays (Ibenskas and Polk Reference Ibenskas and Polk2022). Ibenskas and Polk (Reference Ibenskas and Polk2022) argue that a strong realignment process has made party constituents more distinct, which in turn encourages the responsiveness of vote-seeking parties. Importantly, such reactions are no longer confined to niche parties but are observable across all party types.
In short, we expect that parties adapt their position when partisan voters disagree with their previous position – the partisan voter hypothesis.
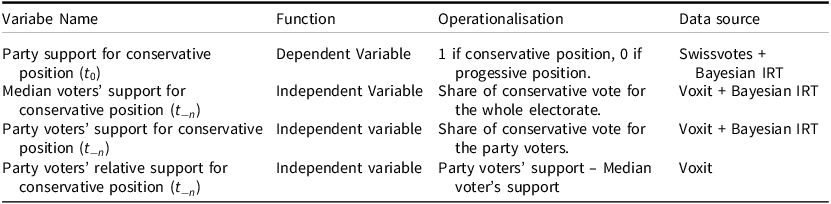
In this study, our aim is also to address situations of dynamic party responsiveness that are less commonly theorized in the literature but allow us to delve deeper into the mechanisms of party competition and its drivers. These are, in particular, situations where there is a large gap between the median voter’s and the partisan supporter’s positionFootnote 2 and also situations where the intensity of the signal from voters differs. With intensity we mean the strength of the support or opposition for a ballot, i.e., whether voters marginally (e.g., in 52%) or strongly support (e.g., at 82%) it.Footnote 3 To do so, we introduce four scenarios as depicted in Figure 1 and discuss what we learn from them below.
Comparison between four scenarios with the position of the median (M) and the partisan (P) voters.

Figure 1 compares four scenarios with different support for the conservative policy position by the median (M) and partisan (P) voters. In the first scenario, both the median voter and the partisan voter take a position in favor of the ballot proposal, as the average support for the ballot is above 50% for both types of voters. Nevertheless, we see that the intensity of the signal – the strength of support for the ballot – varies between the median and the partisan voter. Scenario 4 depicts the opposite scenario, where both types of voters oppose the ballot, and the intensity of the position is stronger for the median voter than for partisan voters. In scenarios 2 and 3, the positions of the median voter and the partisan voter differ, with the median voter opposing the policy in scenario 2 and supporting it in scenario 3, and vice versa for the partisan voter. The intensity remains medium for the median voter and weak for the partisan voter in both scenarios.
If we now compare different groupings of the scenarios, it becomes clear that in scenarios 1 and 4, both the partisan and the median voters are on the same side of the ballot proposal. In this case, hypotheses 1 and 2 stipulate that parties should unequivocally adopt the position supported by the median and partisan voters to increase their congruence. However, in both scenarios, parties would then be more congruent with the median voter than with their electorate, given the higher intensity of the position of the median voter.
In scenarios 2 and 3, the median voter and the partisan voters are on different sides of the ballot proposal, with one opposing and the other supporting the proposal. However, while the intensity of the partisan voters’ position on the ballot is relatively weak, i.e., support is slightly above 50%, compared to the general electorate, their position is starkly different.
Comparing scenarios 1 and 2 (or scenarios 3 and 4), we see that both the position and the intensity of the partisan voter’s position are the same. However, considering the position of the median voter in both scenarios, it is not evident that parties will have the same probability to support the proposal in both scenarios 1 and 2 (or oppose the proposal in scenarios 3 and 4).
In this manuscript, we argue that not only should parties follow moves from parts of the electorate that are likely to vote for them – voters who identify with the party – but they also should want to represent these voters more than they represent the mean voter. In other words, the difference in the intensity of the positions serves as a guideline for the dynamic responsiveness of parties. We thus define the relative partisan voter as the difference in support for a policy between the partisan and the mean voter. If this difference is negative, parties should take a position against the proposal. On the contrary, they should support the proposal if the difference is positive, as it means that the partisan voter will support the policy more than the mean voter. Importantly, in the relative partisan model, parties consider the position of their electorate compared to the mean electorate. Also, mean voter responsiveness is hardly relevant anymore in this model. It occurs only collaterally if median voter and party voter positions align.
This argument builds on theoretical arguments made in the previous literature. First, parties are responsive to manifest incongruence with their electorate, which does not necessarily unequivocally mean following positional shifts of the general electorate. As emphasized by Golder and Benjamin (Reference Golder, Benjamin, Herron, Pekkanen and Shugart2018: 217), ‘There are cases in which a representative can achieve greater congruence, and hence be more responsive, by moving in the opposite direction to the citizen’. A key question the paper aims to answer is which type of voter incongruence parties are responsive to. As shown in the scenarios depicted in Figure 1, parties can evaluate their (in-)congruence with the partisan voter depending on the position of the median voter, which can be seen as an extreme version of partisan responsiveness. This is in line with Ibenskas and Polk (Reference Ibenskas and Polk2022: 202), who argue that the realignment process has made party constituents more relevant for vote-seeking parties so that ‘parties respond first and foremost by eliminating previous incongruence between their policy positions and those of their supporters’. Thus, party-voter incongruence is a quintessential driver of parties’ responsiveness.
In sum, we expect that parties adapt their position when the relative partisan voter disagrees with their previous position – the relative partisan voter hypothesis.
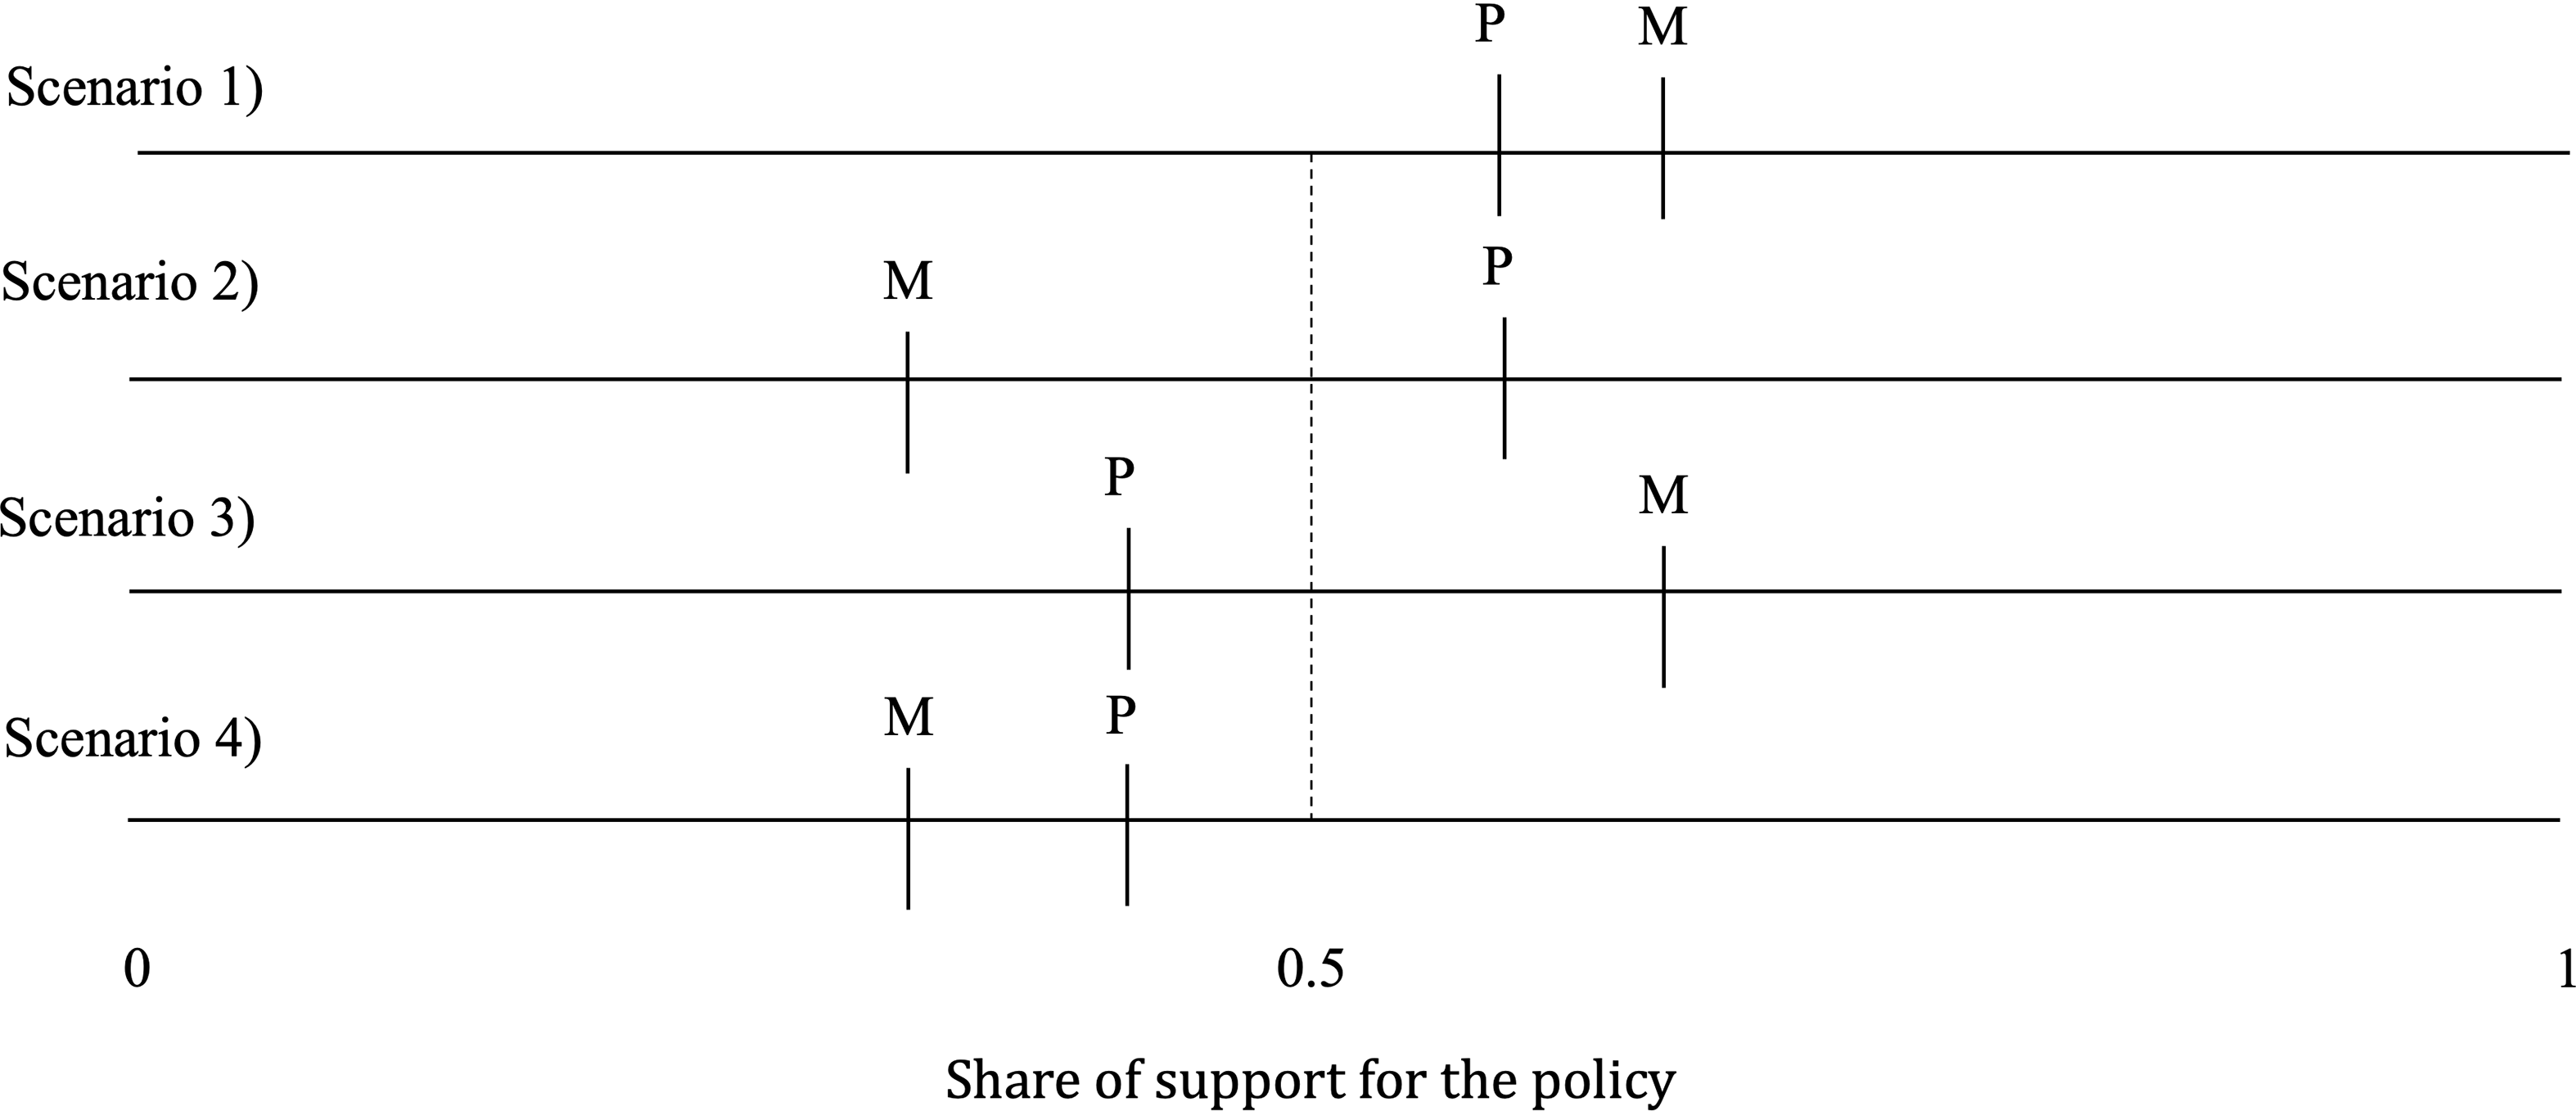
Table 1 presents the varying expectations on the positions parties take in the four different scenarios for the median voter, the partisan, and the relative partisan voters’ hypotheses. While the expectations derived from the median and partisan hypotheses don’t need more explanation, let us spend a bit more time elaborating what the relative partisan hypothesis predicts. For scenarios 2 and 3 of Figure 1, the relative partisan hypothesis allows theorizing why the parties would follow the partisan position even if the median voter is far away. According to this hypothesis, parties would notice that their electorate supports the policy twice as much as the general electorate and thus follow suit. In scenario 1, we see that the difference between the partisan and the median voters’ support of the ballot is negative. Thus, the relative partisan hypothesis expects that parties would position themselves against the proposal, even though a majority of their electorate supports the proposal. Mirroring this case, in scenario 4, we see that the difference is positive; parties thus have a comparative advantage in positioning themselves against the proposal. This ‘overshooting’ – arguably the most extreme case of the relative partisan hypothesis – is driven by their desire to represent their partisans better than the median voter.Footnote 4
Expected position of parties based on their congruence with the mean voter, the partisan voter, and the relative partisan voter’s position in the four scenarios presented in Figure 1

In most cases, parties will align more with their own electorate than with the median voters’ position (cf. Table A1 in the online Appendix). Nevertheless, in these cases, the intensity of the position can be different for the partisan and the relative partisan voter. Indeed, Table 1 indicates that in scenarios 2 and 3, the expected position of parties is the same for the partisan and relative-partisan voter.
In sum, Table 1 shows that considering the median, the partisan, or the relative partisan voters imply different expectations both in terms of party position and the intensity of voters’ signals. The paper aims to test how incongruence with the position of the mean, partisan, and relative partisan voter affects party positions in the Swiss direct democratic setting from a dynamic perspective.
The study of responsiveness in direct democratic settings
We test these hypotheses in Switzerland, taking advantage of the Swiss direct democratic system. While some scholars argue that direct democratic instruments are conducive for policy congruence (Gerber Reference Gerber1996; Matsusaka et al. Reference Matsusaka2010), the empirical evidence is mixed at best (Lax and Phillips Reference Lax and Phillips2012). Leemann and Wasserfallen (Reference Leemann and Wasserfallen2016) find only a conditional effect of the intensity of direct democracy for policy congruence in Switzerland. This finding aligns well with recent evidence placing Switzerland at the lower end of policy congruence among European countries (Rasmussen, Reher, and Toshkov Reference Rasmussen, Reher and Toshkov2019). In sum, this literature suggests that in terms of outcome, i.e., policy congruence, Switzerland can be considered rather average in comparison to countries with other institutional settings. In this article, we take a different angle and exploit direct democracy as an opportunity to shed more light on the dynamic responsiveness of political parties vis-à-vis the general public and their own electorate.
The Swiss political system employs heavily direct democratic decision-making. Swiss citizens vote on several policy proposals per year. There exists a variety of direct democratic instruments, ranging from compulsory referendums on international treaties to initiatives that take up topics from civil society. Importantly, before the ballots are presented to the population, the government and parliament vote also on them. In general, political parties are heavily involved in the direct democratic process and play an important role (Kriesi Reference Kriesi2006). In fact, political parties communicate so-called ‘vote recommendations’, i.e., announce their position of support or rejection of the proposal, on all direct democratic ballots at the beginning of the campaign. For this study, we interpret these vote recommendations as revealed positions of political parties. Party vote recommendations indicate to voters the official position of political parties on the concrete policy proposals that are on the ballot. These positions are usually taken during their party delegates’ assemblies ahead of the campaign. They are intended for the public, as this is an opportunity for all parties to present their programsFootnote 5 and ideas on a specific issue (Müller and Linder Reference Mueller and Linder2017). Vote recommendations inform voters about the ‘configuration of the positions taken by the political elites’ (Kriesi et al. Reference Kriesi2005, 149) on direct democratic ballots. The exact coalition of supporters and opponents in direct democratic campaigns is an important factor in the success of the ballot (linder2008gespaltene; Hug Reference Hug1994; Kriesi Reference Kriesi2006). The position-taking of parties is thus influential, consequential, and very visible both to other political actors and to the public.
In other words, contrarily to party manifestos or speech data – which are regularly used to measure parties’ positions – vote recommendations in direct democracy have clear policy implications as they at least influence, if not determine, the adoption or the rejection of a policy proposal. As policy seekers, parties have incentives to reveal their true position in this setting given the likely impact on policy implementation. Voters are called to the voting booth up to four times a year and have to decide on one or more ballot proposals. From the point of view of political parties, the results and accompanying opinion polls offer valuable information on the preferences of the electorate as a whole, and their party supporters in particular. Thus, for parties, direct democratic votes offer a valuable (and free) source of information on the preferences of the voters. This is especially important in the Swiss setting, where parties do not have the resources for frequent opinion polls. For voters, the direct democratic setting means not only more occasions to participate in the democratic process and have power over policy decisions, but it is also an opportunity to check whether parties are in line with public opinion and whether they adapt their ideological position if they are deviating from what the public or their partisans want.
In sum, the great advantage of studying the responsiveness of parties in such a setting is that parties take a position on ballot proposals by communicating vote recommendations to voters, and voters choose the preferred outcome on the exact same ballot proposal. Thus, it is possible to directly compare voters’ and parties’ positions on policy proposals, avoiding many issues highlighted by Adams, Bernardi, Ezrow et al. (Reference Adams, Bernardi, Ezrow, Gordon, Liu and Phillips2019) and also relying on visible, behavioral measures of policy support among the public. Second, given the visibility and importance of the coalition patterns, for a party, changing position has potentially large policy costs and is not something done easily. We can thus assume that this is sincere position-taking. Third, Switzerland has a stable multiparty system that allows party responses to be compared over time across different political parties. In sum, this setting allows us to analyze how the position-taking of parties is influenced by public opinion and their partisan electorate on a frequent basis and in a dynamic setting given that the ballots take place every three to four months.
Our approach investigates how (in-)congruence between the parties’ positions and the voters’ decisions affects future vote position-taking of parties in this highly visible setting. In sum, focusing on the relationship between voters’ decisions and parties’ positions enables us to test whether and how parties adapt their position – measured here as their vote recommendation – when their position has been diverging in the past.
We see the position, taking the form of vote recommendations, as a signal of ideological responsiveness. It seems a good moment for parties to show that they are responsive to the expressed public opinion and their partisan electorate in past ballots and thus show this as an example that they listen to what voters want. While these position-takings do not generate immediate electoral returns, they serve as visible and potentially costly signals of responsiveness, through which parties seek to cultivate a reputation for attentiveness to voter preferences and thereby enhance their broader electoral appeal over time among voters valuing responsive behavior.
Data and methods
The core idea of the research design of this paper is to see whether parties adapt the position they take on a specific ballot based on the electorates’ general or their party electorates’ position in former proposals, measured as a single, broad ideological dimension. In essence, this is a classical formulation of party responsiveness (Ibenskas and Polk Reference Ibenskas and Polk2022; Lax and Phillips Reference Lax and Phillips2012) but adapted to the direct democratic setting, which requires parties to publicly announce their position on the ballots in the form of a so-called ‘vote recommendation’, and detailed information about public opinion on the exact same policy questions exists.
In this study, we use two main data sources. The Swissvotes data (Swissvotes 2021) and the Voxit data (Kriesi, Brunner, and Lorétan Reference Kriesi, Brunner and Lorétann.d.). The Swissvotes data contain information about ballot proposals, including the vote recommendations of political parties since 1868. The Voxit data regroups post-vote surveys conducted after most voting days between 1981 and 2016. This data regroups individual surveys that were conducted after each voting day. Overall, it contains 320’197 observations on 297 proposals collected over 37 years. The surveys asked respondents about their vote choice and party affiliation, which allowed us to operationalize our variable of electoral support.
To get an idea of the temporal dynamic, we first create dyads of proposals based on their temporal location. More precisely, we link each proposal at
 ${t_0}$
to each proposal at
${t_0}$
to each proposal at
 ${t_{ - n}}$
where
${t_{ - n}}$
where
 $n$
is more than 0 and up to three years. This way, we create groups of ballot proposals. The main idea is to see whether the relationship between parties’ policy positions at
$n$
is more than 0 and up to three years. This way, we create groups of ballot proposals. The main idea is to see whether the relationship between parties’ policy positions at
 ${t_0}$
and
${t_0}$
and
 ${t_{ - n}}$
is influenced by the electorate’s support for the ballot at
${t_{ - n}}$
is influenced by the electorate’s support for the ballot at
 ${t_{ - n}}$
. In other words, this allows assessing whether parties change positions on ballots when the electorate does not support this position in previous ballots. We also conduct robustness tests with different lags of one and five years, which we discuss at the end of the paper and present in Appendix A.
${t_{ - n}}$
. In other words, this allows assessing whether parties change positions on ballots when the electorate does not support this position in previous ballots. We also conduct robustness tests with different lags of one and five years, which we discuss at the end of the paper and present in Appendix A.
In order to render the ballots comparable, we have to specify the ideological meaning of each ballot. In fact, direct democratic ballots in Switzerland cover a variety of topics and can take a conservative/right-leaning or liberal/left-leaning position.Footnote 6 In other words, as our data is organized in dyads based on temporal proximity, without the additional information on the ballot position on the ideological space, it makes little sense to compare vote recommendations (yes or no) over time as support for a ballot – i.e., our measured outcome – as this can mean very different things. For example, if we compare the positions on promoting parental leave to one on increasing spending on health care, supporting the two items has the same broad ideological meaning (i.e., in favor of the left position), but this would not be the case if the second ballot were on the deregulation of the financial industry.
The first important step in our empirical strategy is thus to estimate the ideological meaning of ballot proposals. In order to classify each proposal on an ideological scale, we rely on a dynamic Bayesian item-response theory (IRT) model. This model positions actors on a latent scale based on their responses to questions. In our case, the actors are political parties, and the responses to questions are represented by the parties’ vote recommendations. In general, the model can be specified as:
 ${Y_{ij}} \sim Bernouilli\left( {logi{t^{ - 1}}\left( {{\theta _{jt}}{b_i} + {a_i}} \right)} \right)$
In this model,
 ${Y_{ij}}$
represents the response of actor
${Y_{ij}}$
represents the response of actor
 $j$
– political parties – on item
$j$
– political parties – on item
 $i$
– ballot proposals. This variable takes the value 1 if the party recommended supporting the ballot and 0 if it gave a recommendation against it.Footnote
7
$i$
– ballot proposals. This variable takes the value 1 if the party recommended supporting the ballot and 0 if it gave a recommendation against it.Footnote
7
 ${\theta _j}$
represents the position of the actor
${\theta _j}$
represents the position of the actor
 $j$
on the latent scale. Given the specification of the model and the unidimensionality of the latent space, in this case,
$j$
on the latent scale. Given the specification of the model and the unidimensionality of the latent space, in this case,
 ${\theta _j}$
is equivalent to the latent position of party
${\theta _j}$
is equivalent to the latent position of party
 $j$
on the left-right or the progressive/conservative axis. Finally,
$j$
on the left-right or the progressive/conservative axis. Finally,
 ${b_i}$
represents the discrimination, and
${b_i}$
represents the discrimination, and
 ${a_i}$
represents the difficulty of the ballot. In this paper, we are especially interested in the
${a_i}$
represents the difficulty of the ballot. In this paper, we are especially interested in the
 ${b_i}$
parameter as it allows us to estimate how much the response of actors is discriminated by their response to the item
${b_i}$
parameter as it allows us to estimate how much the response of actors is discriminated by their response to the item
 $i$
. If the discrimination is different than 0, it means that the position of actors on the latent space influences its response to the question
$i$
. If the discrimination is different than 0, it means that the position of actors on the latent space influences its response to the question
 $i$
. However, if the discrimination of item
$i$
. However, if the discrimination of item
 ${b_i}$
is close to 0, this means that the latent position of the actor has only a little importance in explaining its response to the item
${b_i}$
is close to 0, this means that the latent position of the actor has only a little importance in explaining its response to the item
 $i$
. This can be seen with the multiplication between the parameters
$i$
. This can be seen with the multiplication between the parameters
 ${\theta _j}$
and
${\theta _j}$
and
 ${b_i}$
in Equation (1). Finally, we also implement a random walk on the parameter
${b_i}$
in Equation (1). Finally, we also implement a random walk on the parameter
 ${\theta _{jt}}$
so that if
${\theta _{jt}}$
so that if
 $t = 1$
,
$t = 1$
,
 ${\theta _{jt}} \sim N\left( {0,1} \right)$
and if
${\theta _{jt}} \sim N\left( {0,1} \right)$
and if
 $t1$
,
$t1$
,
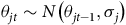 ${\theta _{jt}} \sim N\left( {{\theta _{jt - 1}},{\sigma _j}} \right)$
. This specification allows us to estimate the latent position of parties over time and unconstrained the ideological meaning of ballot proposals through the parameter
${\theta _{jt}} \sim N\left( {{\theta _{jt - 1}},{\sigma _j}} \right)$
. This specification allows us to estimate the latent position of parties over time and unconstrained the ideological meaning of ballot proposals through the parameter
 ${b_i}$
with a dynamic ideological space.
${b_i}$
with a dynamic ideological space.
We rely on the Swissvotes data to run this model. We selected all the ballot proposals included between 1971 and 2016. Then we excluded counterproposals as the response of parties to these items does not always have meaningful latent ideology.Footnote
8
This gives a total of 369 ballot proposals over 47 years. We then selected the five main parties of interest in this paper – the Social (SP), the Liberals (FDP), the Christian Democrats (CVP), the Conservatives (SVP), and the Greens (GPS).Footnote
9
These five parties are the major parties in Switzerland (Bütikofer and Seitz Reference Bütikofer and Seitz2023; Ladner, Schwarz, and Fivaz Reference Ladner, Schwarz and Fivaz2023).Footnote
10
We use these vote recommendations from parties – actors
 $j$
– on ballots – item
$j$
– on ballots – item
 $i$
– to run the Bayesian IRT model as specified in Equation (1). To do so, we use rstan, which is an R interface to the stan probabilistic programming language (Carpenter, Gelman, A., Hoffman et al. Reference Carpenter, Gelman, Hoffman, Lee, Goodrich, Betancourt, Brubaker, Guo, Li and Riddell2017). The model runs for 10,000 iterations with 5000 warm-ups over four parallel chains. Section B of the Appendix present the diagnostics of the dynamic Bayesian IRT model.
$i$
– to run the Bayesian IRT model as specified in Equation (1). To do so, we use rstan, which is an R interface to the stan probabilistic programming language (Carpenter, Gelman, A., Hoffman et al. Reference Carpenter, Gelman, Hoffman, Lee, Goodrich, Betancourt, Brubaker, Guo, Li and Riddell2017). The model runs for 10,000 iterations with 5000 warm-ups over four parallel chains. Section B of the Appendix present the diagnostics of the dynamic Bayesian IRT model.
The first relevant parameters of the models are the
 ${\theta _{jt}}$
parameters. This gives the latent positions of parties over 47 years. Figure C1 in the Appendix presents the latent position of parties over time. The picture painted there seems plausible, as the comparison between parties’ positions perfectly fits common knowledge about the parties’ positions. Indeed, we see this on the extreme with the right-wing and conservative party SVP on the one hand and the socialists and the greens on the other and, in between, the Liberals and the Christian Democratic Party. Moreover, we see a growing polarization between the SVP and the SP/GPS over time, which is consistent with the observations Sciarini (Reference Sciarini2023: 346–347) makes in his recent book on Swiss politics.
${\theta _{jt}}$
parameters. This gives the latent positions of parties over 47 years. Figure C1 in the Appendix presents the latent position of parties over time. The picture painted there seems plausible, as the comparison between parties’ positions perfectly fits common knowledge about the parties’ positions. Indeed, we see this on the extreme with the right-wing and conservative party SVP on the one hand and the socialists and the greens on the other and, in between, the Liberals and the Christian Democratic Party. Moreover, we see a growing polarization between the SVP and the SP/GPS over time, which is consistent with the observations Sciarini (Reference Sciarini2023: 346–347) makes in his recent book on Swiss politics.
While Figure C1 shows that the model gives the position of parties on a latent space that fits our expectations and thus lends credibility to the model, the principal parameter of interest for this study is the discrimination of ballot proposals. This will help determine whether the dyads of ballot proposals at
 ${t_0}$
and
${t_0}$
and
 ${t_{ - n}}$
ideologically go in the same direction or not.
${t_{ - n}}$
ideologically go in the same direction or not.
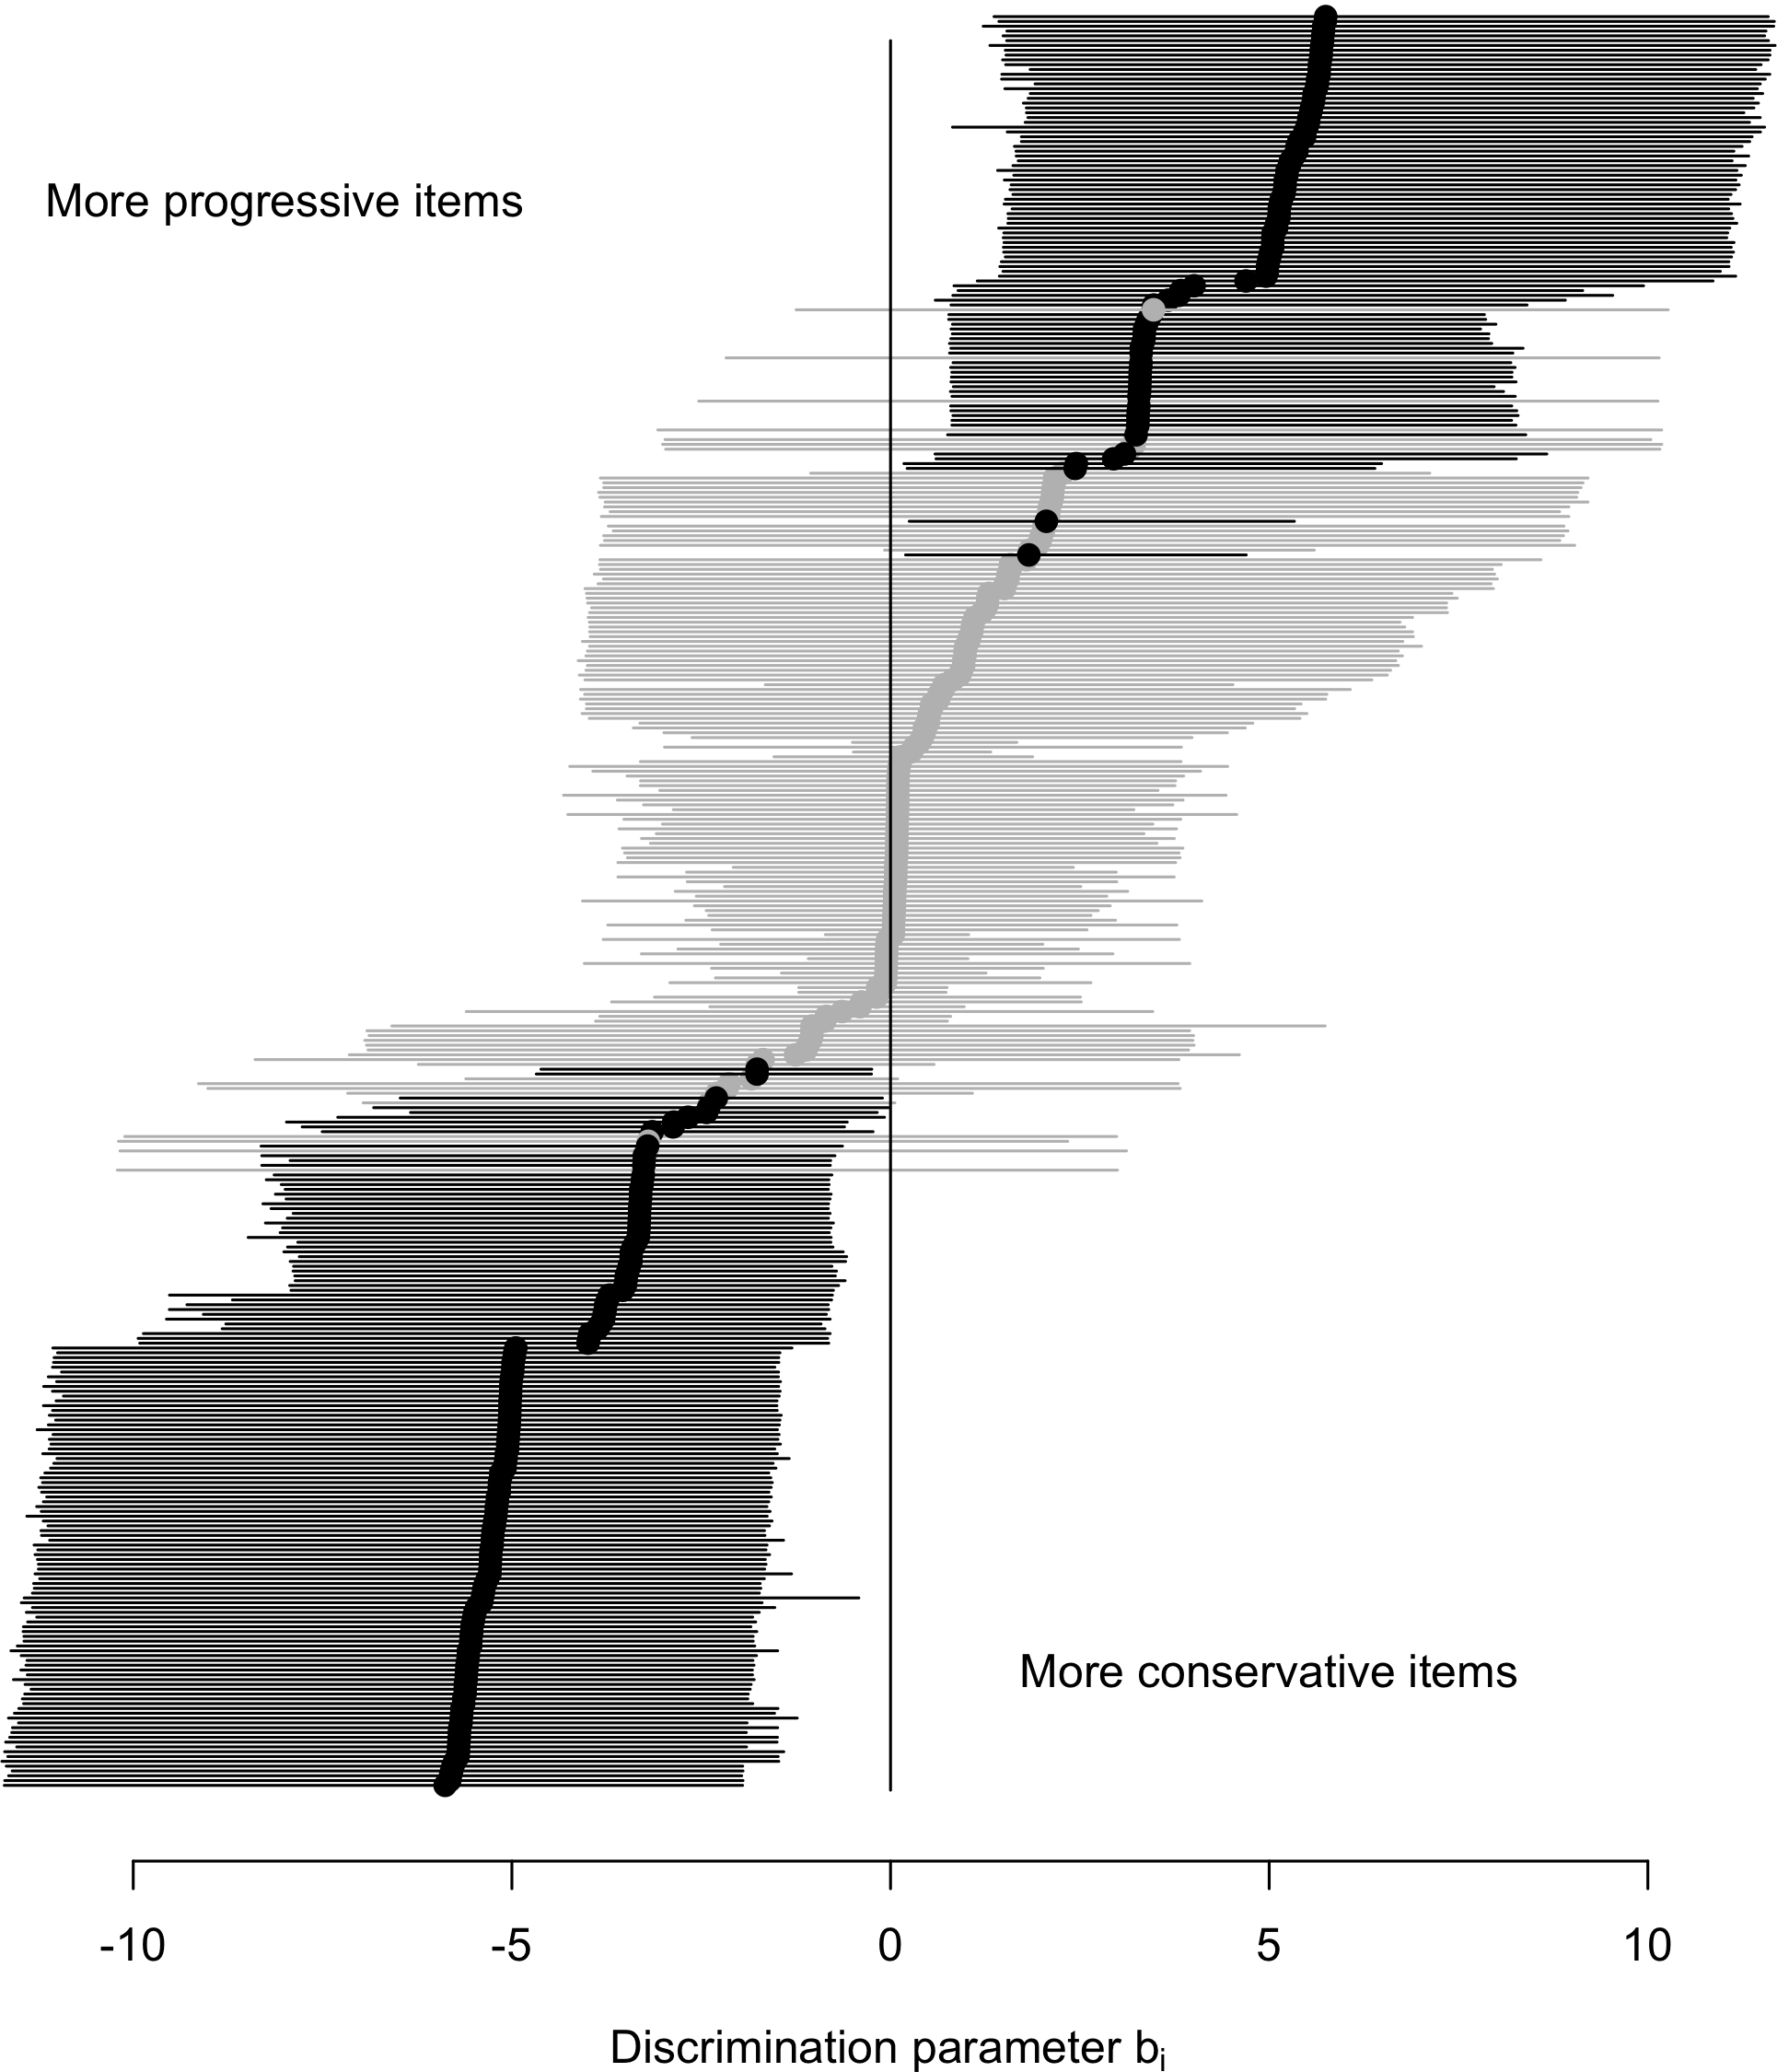
Figure 2 plots the parameter
 $b$
for each item from the most progressive, left-wing to the most conservative, right-wing ballot. However, several ballots have a median of the distribution for the discrimination parameter that is close to 0. In these cases, it is not possible to assess with sufficient certainty whether the support for the ballots has a left or a right meaning. Indeed, in the model, if all parties give the same vote recommendation, the parameter
$b$
for each item from the most progressive, left-wing to the most conservative, right-wing ballot. However, several ballots have a median of the distribution for the discrimination parameter that is close to 0. In these cases, it is not possible to assess with sufficient certainty whether the support for the ballots has a left or a right meaning. Indeed, in the model, if all parties give the same vote recommendation, the parameter
 $b$
for the ballot will be close to 0 – as the party vote recommendation
$b$
for the ballot will be close to 0 – as the party vote recommendation
 ${Y_{ij}}$
is not dependent on their ideology. Nevertheless, it is possible that the ballot has an ideological meaning and that including more extreme fringes of the political spectrum in the model would change this perception. As it is necessary to evaluate the ideological meaning of the ballot proposals correctly, we keep only ballot proposals where 95% of the posterior predictions are either positive or negative. This way, we ensure a high probability that the ballot’s aim is effectively progressive or conservative and that unclear cases are dropped. Figure 2 plots the discrimination of each ballot. Ballots indicated in grey are removed from the rest of the analysis, given their non-discriminatory nature. For now, this leaves 291 ballot proposals and excludes 78 ballot proposals where the ideological direction is not clear enough. Out of these ballots, 68 are in the time period covered by the survey data used to compute the voters’ support of proposals (see next section). Almost 60% of mandatory referendums fall into this category and have an unclear ideological direction compared to less than 10% of initiatives (see Table A2 in the Appendix). Furthermore, out of the 68 ballot proposals, 56 had no clear difference in the positions from the five main parties – either none opposed or none supported the ballot, meaning that the five main parties gave all the same vote recommendations. For the 12 remaining ballots, two of them saw the CVP (Christian Democrats) support it against all other parties, and ten ballots had parties on the extreme taking similar stances against parties in the center. In all of these cases, the positions of parties do not enable us to empirically distinguish whether supporting the ballot indicates a more progressive or a more conservative stance. This empirical pattern fits nicely with earlier typologies of coalitions in direct democratic ballots (Kriesi et al. Reference Kriesi2005), where the largest group of ballots with no clear ideological direction were grand coalitions with no opposition, and the smallest group were divided coalitions.
${Y_{ij}}$
is not dependent on their ideology. Nevertheless, it is possible that the ballot has an ideological meaning and that including more extreme fringes of the political spectrum in the model would change this perception. As it is necessary to evaluate the ideological meaning of the ballot proposals correctly, we keep only ballot proposals where 95% of the posterior predictions are either positive or negative. This way, we ensure a high probability that the ballot’s aim is effectively progressive or conservative and that unclear cases are dropped. Figure 2 plots the discrimination of each ballot. Ballots indicated in grey are removed from the rest of the analysis, given their non-discriminatory nature. For now, this leaves 291 ballot proposals and excludes 78 ballot proposals where the ideological direction is not clear enough. Out of these ballots, 68 are in the time period covered by the survey data used to compute the voters’ support of proposals (see next section). Almost 60% of mandatory referendums fall into this category and have an unclear ideological direction compared to less than 10% of initiatives (see Table A2 in the Appendix). Furthermore, out of the 68 ballot proposals, 56 had no clear difference in the positions from the five main parties – either none opposed or none supported the ballot, meaning that the five main parties gave all the same vote recommendations. For the 12 remaining ballots, two of them saw the CVP (Christian Democrats) support it against all other parties, and ten ballots had parties on the extreme taking similar stances against parties in the center. In all of these cases, the positions of parties do not enable us to empirically distinguish whether supporting the ballot indicates a more progressive or a more conservative stance. This empirical pattern fits nicely with earlier typologies of coalitions in direct democratic ballots (Kriesi et al. Reference Kriesi2005), where the largest group of ballots with no clear ideological direction were grand coalitions with no opposition, and the smallest group were divided coalitions.
Distribution of the discrimination parameter of the ballot proposal from the most progressive (bottom) to the most conservative (up). The extremity of the line represents the
 ${2.5^{th}}$
and
${2.5^{th}}$
and
 ${97.5^{th}}$
percentiles of the parameter distribution.
${97.5^{th}}$
percentiles of the parameter distribution.

We use the posterior estimate of the discrimination parameter from the Bayesian IRT model presented in Figure 2 to operationalize our dependent variable. We use this unidimensional measure of the party competition space that has been used in previous research to map the ideology of Swiss parties and ballot initiatives (Hug and Schulz Reference Hug and Schulz2007; Leemann, Emmenegger, and Walter Reference Leemann, Emmenegger and Walter2025; Walder Reference Walder2025). In this model, what binds the different issues together are the coalition-supporting positions of ballot proposals. For instance, the vote on the asylum law of 1987, on the financing of unemployment insurance, or on 11
 $th$
revisions of the pension system were all aiming at more conservative policies than the status quo. On the other side, votes on the easier naturalization of second-generation immigrants in 2017, the initiative on resigning from nuclear power, and the interdiction of weapon exportation all aimed at progressive moves from the status quo. Although these votes concern different topics, the key point is that the coalition of parties supporting the ballot is mirroring each other. Indeed, while the CVP (Christian Democrats), FDP (liberals), and SVP (right-wing populist party) all supported the ballot with conservative aims and opposed the ballot with progressive aims, the opposite is true for the SP (Social Democrats) and GPS (Green Party). The advantage of the Bayesian IRT model is that it gives a systematic and precise indication of the direction of the ballot. It is thus possible to specify whether parties take a conservative or a left-wing position on a given ballot. To do so, we classify the ballots into two categories. Ballots with discrimination parameters above 0 aim towards conservative proposals, and ballots with negative discrimination parameters aim towards more progressive proposals. Then, we recode the position of parties so that if parties support (oppose) conservative right-wing proposals, their position is coded as 1 (0). On the other hand, when parties support (oppose) progressive left-wing proposals, their position is coded as 0 (1). Using the Bayesian IRT model enables us to operationalize an ideological position from a position on a proposal.
$th$
revisions of the pension system were all aiming at more conservative policies than the status quo. On the other side, votes on the easier naturalization of second-generation immigrants in 2017, the initiative on resigning from nuclear power, and the interdiction of weapon exportation all aimed at progressive moves from the status quo. Although these votes concern different topics, the key point is that the coalition of parties supporting the ballot is mirroring each other. Indeed, while the CVP (Christian Democrats), FDP (liberals), and SVP (right-wing populist party) all supported the ballot with conservative aims and opposed the ballot with progressive aims, the opposite is true for the SP (Social Democrats) and GPS (Green Party). The advantage of the Bayesian IRT model is that it gives a systematic and precise indication of the direction of the ballot. It is thus possible to specify whether parties take a conservative or a left-wing position on a given ballot. To do so, we classify the ballots into two categories. Ballots with discrimination parameters above 0 aim towards conservative proposals, and ballots with negative discrimination parameters aim towards more progressive proposals. Then, we recode the position of parties so that if parties support (oppose) conservative right-wing proposals, their position is coded as 1 (0). On the other hand, when parties support (oppose) progressive left-wing proposals, their position is coded as 0 (1). Using the Bayesian IRT model enables us to operationalize an ideological position from a position on a proposal.
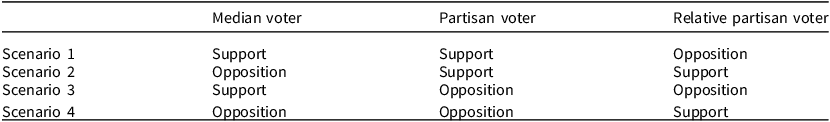
In a second step, we operationalize our main independent variable – the support of the conservative right-leaning position by the electorate. To do so, we use the same logic as for the dependent variable and consider the yes vote share for conservative ballots and the no vote share for progressive ballots.
To test the median voter hypothesis, we will rely on the Voxit survey data. This collected post-vote survey data from ballots between 1981 and 2016. Overall, it contains survey responses for more than 300,000 respondents over 297 ballot proposals. Out of these 297 proposals, 68 have an unclear ideological direction; see discussion above. Thus, we overall analyze 229 ballots over 37 years. We use this data to operationalize the electorate’s support of the conservative position as the share of the voters that supported the conservative position on a ballot. In more technical terms, it takes the share of Yes votes if the ballot has a positive discrimination score and the share of No votes if the ballot has a negative discrimination score. This represents the mean voters’ support of the conservative position.
We then operationalize the party voter support of the party position as the share of party voters that support the party position. This means that for each ballot, we take the share of party voters who voted Yes if the ballot has a positive discrimination score and the share of No if the ballot has a negative discrimination score. This represents the support of partisans of the conservative party position.
Lastly, the electorate’s support of the party position is operationalized as the relative support of the conservative position by the party voters – the relative partisan voter. To operationalize this relative partisan voter variable, the difference between the support of the conservative position by the party voter and by the median voter is computed. It takes positive values if the partisan voter supports more the conservative position than the median voter and negative values in the opposite case.
The three independent variables indicate both the direction and the intensity of the voters’ position. Indeed, for the mean and the partisan voters’ support for conservative position variables, the 50% threshold indicates the direction. This means that if the value is under .5, the voters support more the progressive position, and if it is above .5, they support more the conservative position. For the relative partisan voters’ support of the conservative position, the sign indicates the direction. Positive values mean greater support for the conservative position than the median voter, and negative values mean more support for the progressive position. The intensity of the signal is the difference to the 50% threshold, or to the median voter. Indeed, if 51% of voters support a conservative ballot proposal, the direction is the same as if 90% of them support it, but the intensity is stronger in the second case. Table 2 summarizes the operationalization and function of the different variables used in our models.
Summary of the operationalization for the variables used in the regression model
Using the variables described in Table 2, we use a logistic regression model to estimate the probability of a conservative policy position on a ballot based on the electorate’s support of a conservative position on the previous ballot at
 ${t_{ - n}}$
, and the position of the party on the last ballot. This model is, in essence, similar to other models analyzing parties’ responsiveness. We test whether the position of a party is influenced by the previous position of voters on the same scale. The main difference relates to our dependent – and lag-dependent – variables, which are binary due to the nature of our data. Generally, studies test whether the general left-right self-position of the party is influenced by the general left-right position of the electorate between elections. In our case, we test if parties are more likely to switch positions if they see that their electorate did not support their position on previous ballots. Formally, the model is written as:
${t_{ - n}}$
, and the position of the party on the last ballot. This model is, in essence, similar to other models analyzing parties’ responsiveness. We test whether the position of a party is influenced by the previous position of voters on the same scale. The main difference relates to our dependent – and lag-dependent – variables, which are binary due to the nature of our data. Generally, studies test whether the general left-right self-position of the party is influenced by the general left-right position of the electorate between elections. In our case, we test if parties are more likely to switch positions if they see that their electorate did not support their position on previous ballots. Formally, the model is written as:

Concretely, the model includes a lag-dependent variable. The goal is to estimate what the effect of the electorate’s position on the party position controlled by the lagged party position is. In this sense, it is similar to modeling strategies used in other research on party responsiveness (Adams, Haupt, and Stoll Reference Adams, Haupt and Stoll2009; Caughey and Warshaw Reference Caughey and Warshaw2018; Steenbergen, Edwards, and De Vries Reference Steenbergen, Edwards and De Vries2007). The main difference is that instead of considering general ideological positions, we use parties’ positions on specific policy proposals. In addition to the model presented in Equation (2), we also report results for models with an interaction term between the lagged party position and the electoral support. This enables us to see how the relation between the lagged and current party position is moderated by the electoral support on the last ballot. This provides a stronger test of the hypotheses formulated in the theoretical section, as it tests whether responsiveness to the mean voters is not moderated by the positions parties took in previous ballots. Furthermore, the interaction allows us to differentiate the effect for progressive and conservative parties’ positions, enabling us to verify that the effect is not driven by a single side of the ideological spectrum. In sum, the moderating effect between the lag-dependent variable and the independent variables provides a stronger test of our hypothesis, ensuring that the variance between parties’ positions over time is moderated by the voters’ positions, which also tests for the non-linearity of the effect for progressive and conservative positions.
Results
This section presents the results of the regression models. We first present and discuss the parties’ responsiveness to the median voter, then discuss the results of the parties’ responsiveness to the partisan voter, and finally, the results of the parties’ responsiveness to the partisan relative to the median voter are presented.
Parties’ responsiveness to the median voter
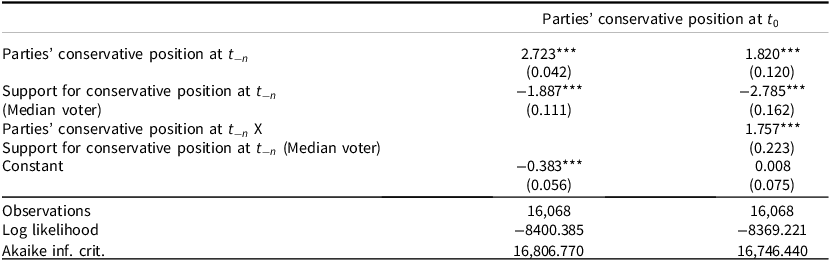
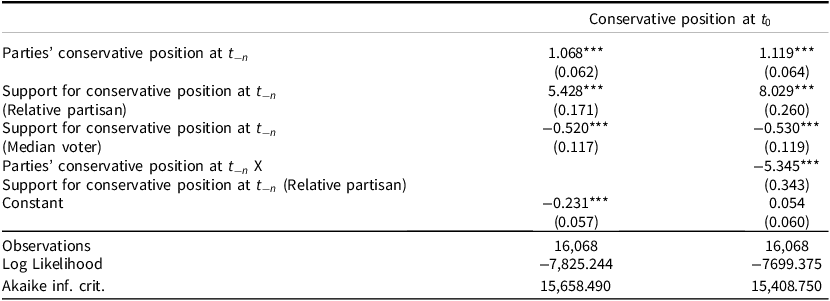
According to the median voter theorem (Downs Reference Downs1957), parties maximize their electoral results when they are responsive to the median voter’s position change. This means that the more the mean voter aligns with the conservative position on a ballot, the more parties should take up the conservative position on the next ballot. On the contrary, if the median voter does not support the conservative position on a ballot, then parties should be less likely to take a conservative position in later ballots. Table 3 presents the direct and moderator effects of the median voter’s position on party positions.
Regressions results for the median voter hypothesis

Note: *p
 $\lt$
0.05; **p
$\lt$
0.05; **p
 $\lt$
0.01; ***p
$\lt$
0.01; ***p
 $\lt$
0.001.
$\lt$
0.001.
The first model in Table 3 presents the direct effect of the median voters’ support for the conservative position on a ballot at time t-n on the probability of conservative party positions on a ballot at time t0. We see that there is a significant negative effect, meaning that parties tend to take less conservative positions on ballots when the median voters had stronger conservative stances in previous ballots. This goes against the median voter hypothesis, as we find that parties tend to go against the median voter.
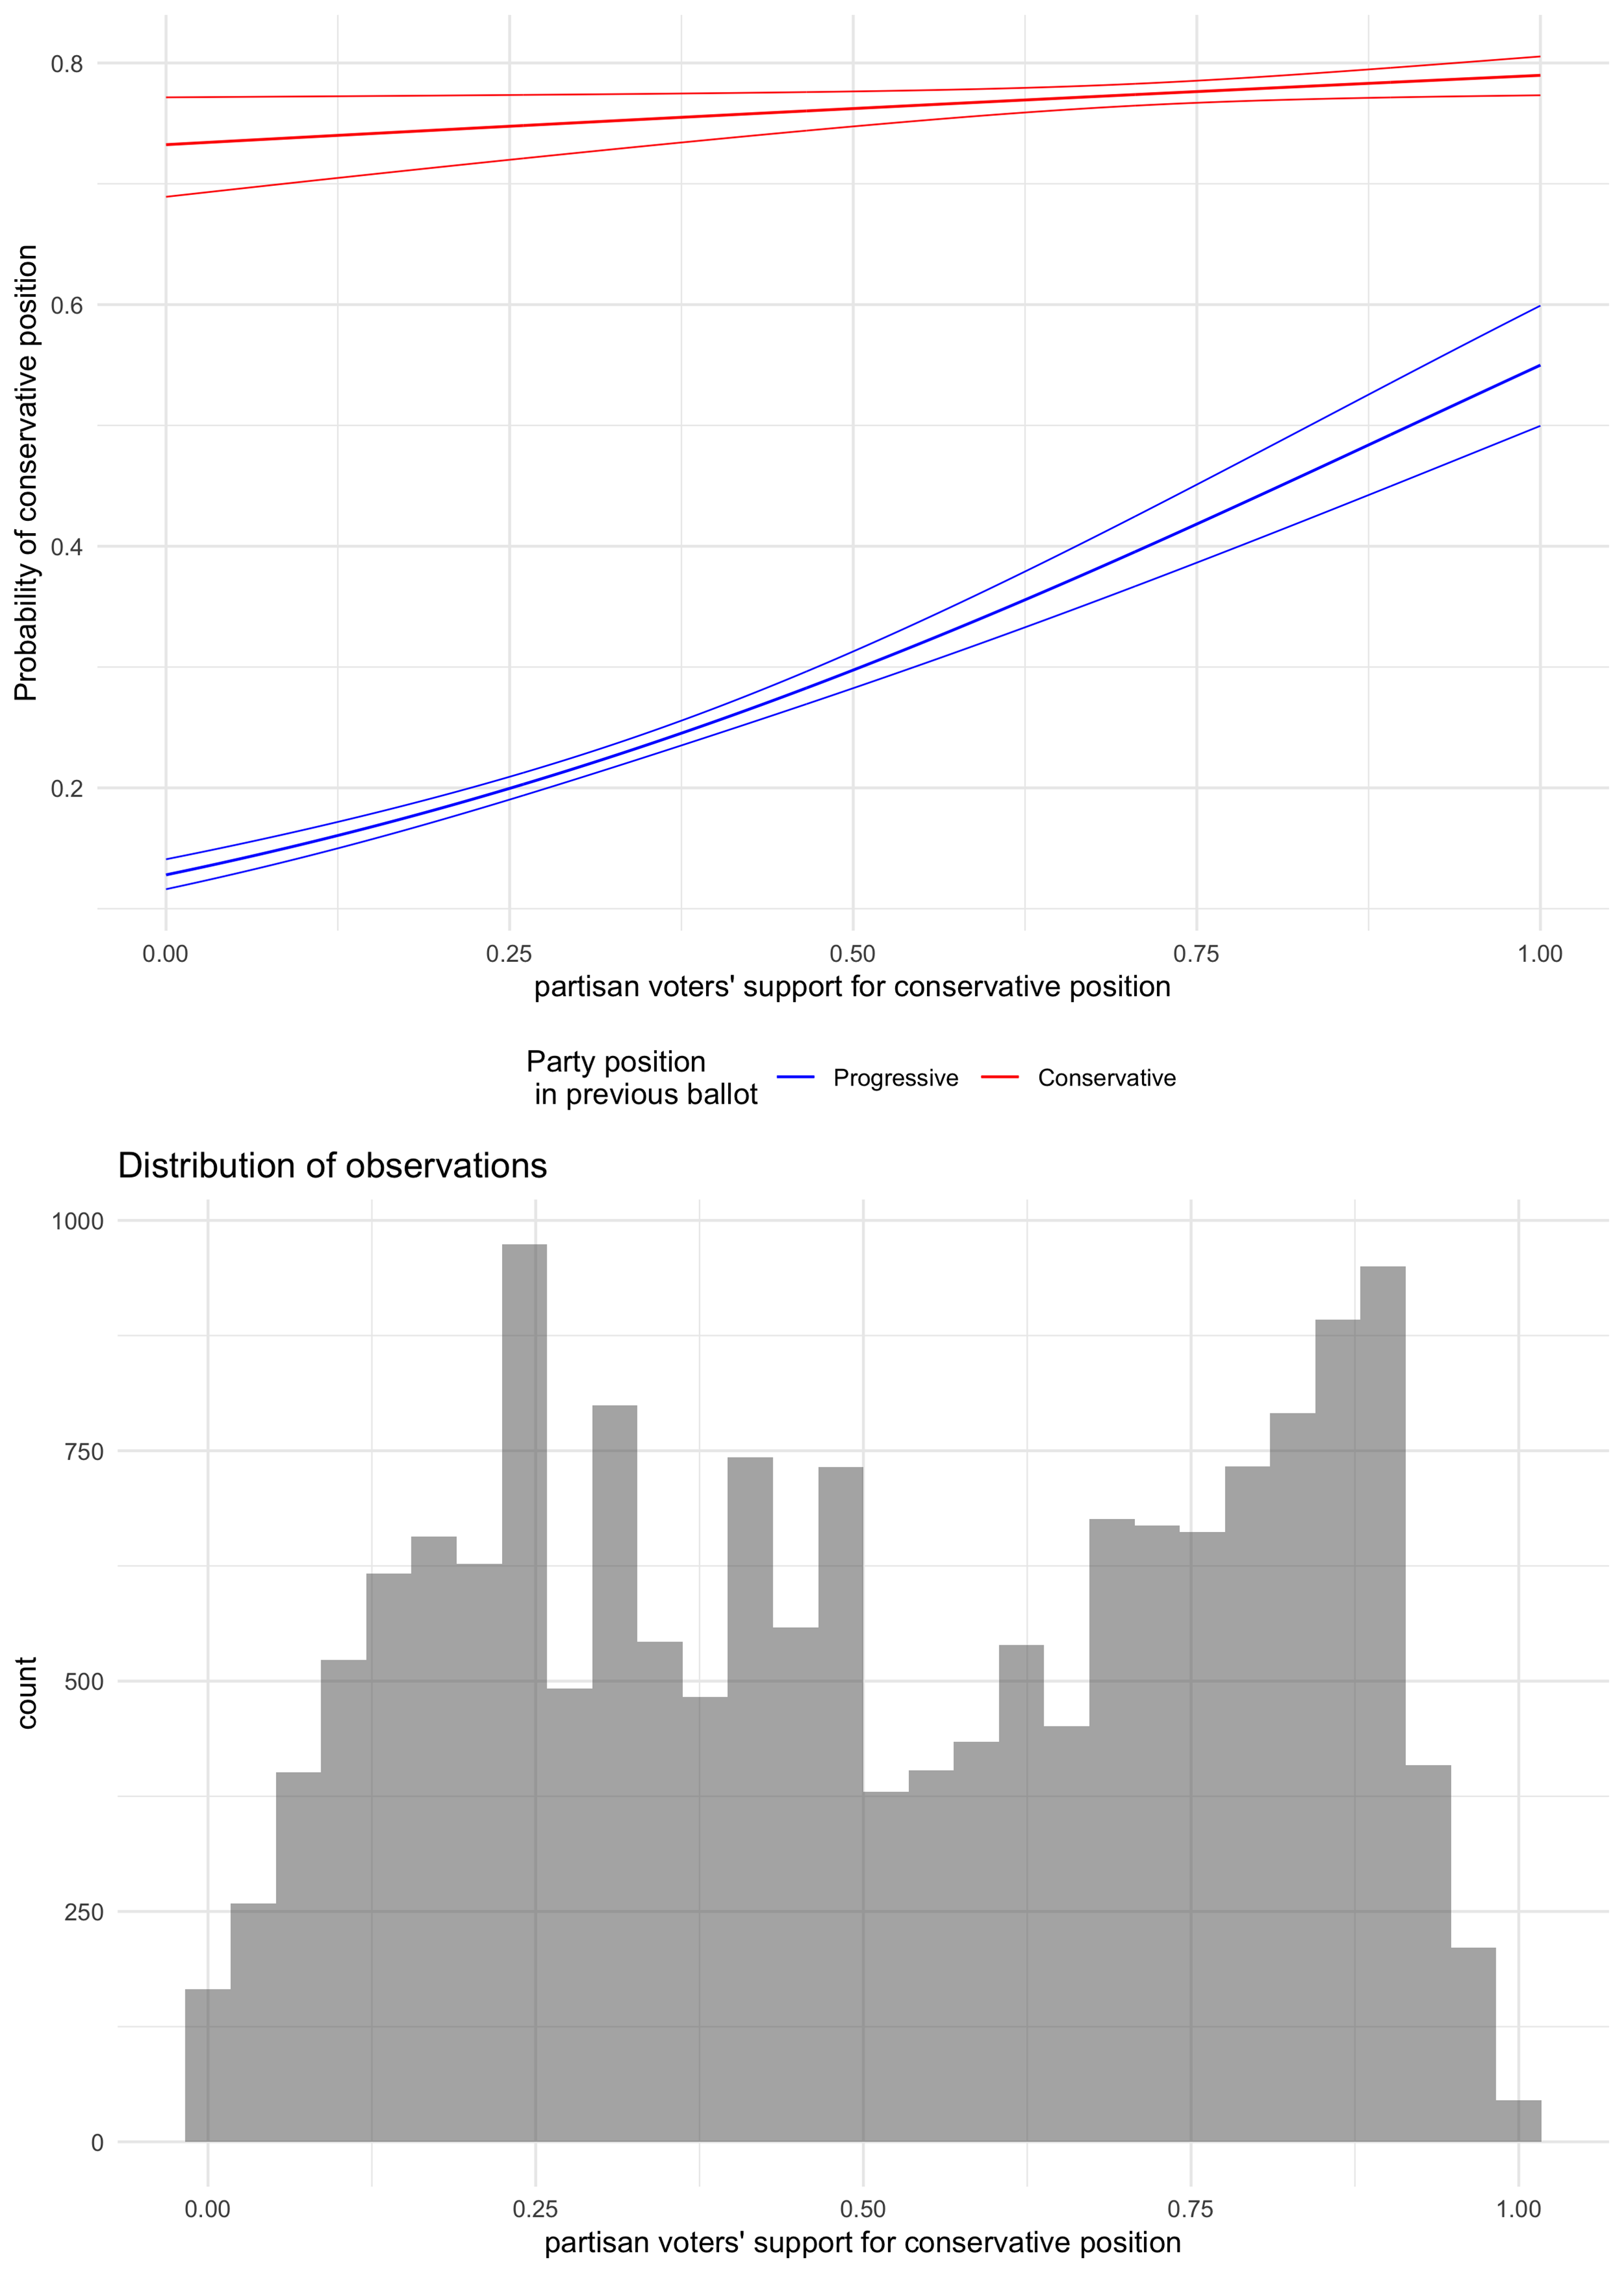
The results are similar in the second model in Table 3, which includes an interaction term between the parties and the median voter’s position in a previous ballot. To analyze the results of the second model of Table 3, we plotted the predicted probabilities, and the results are presented in Figure 3.
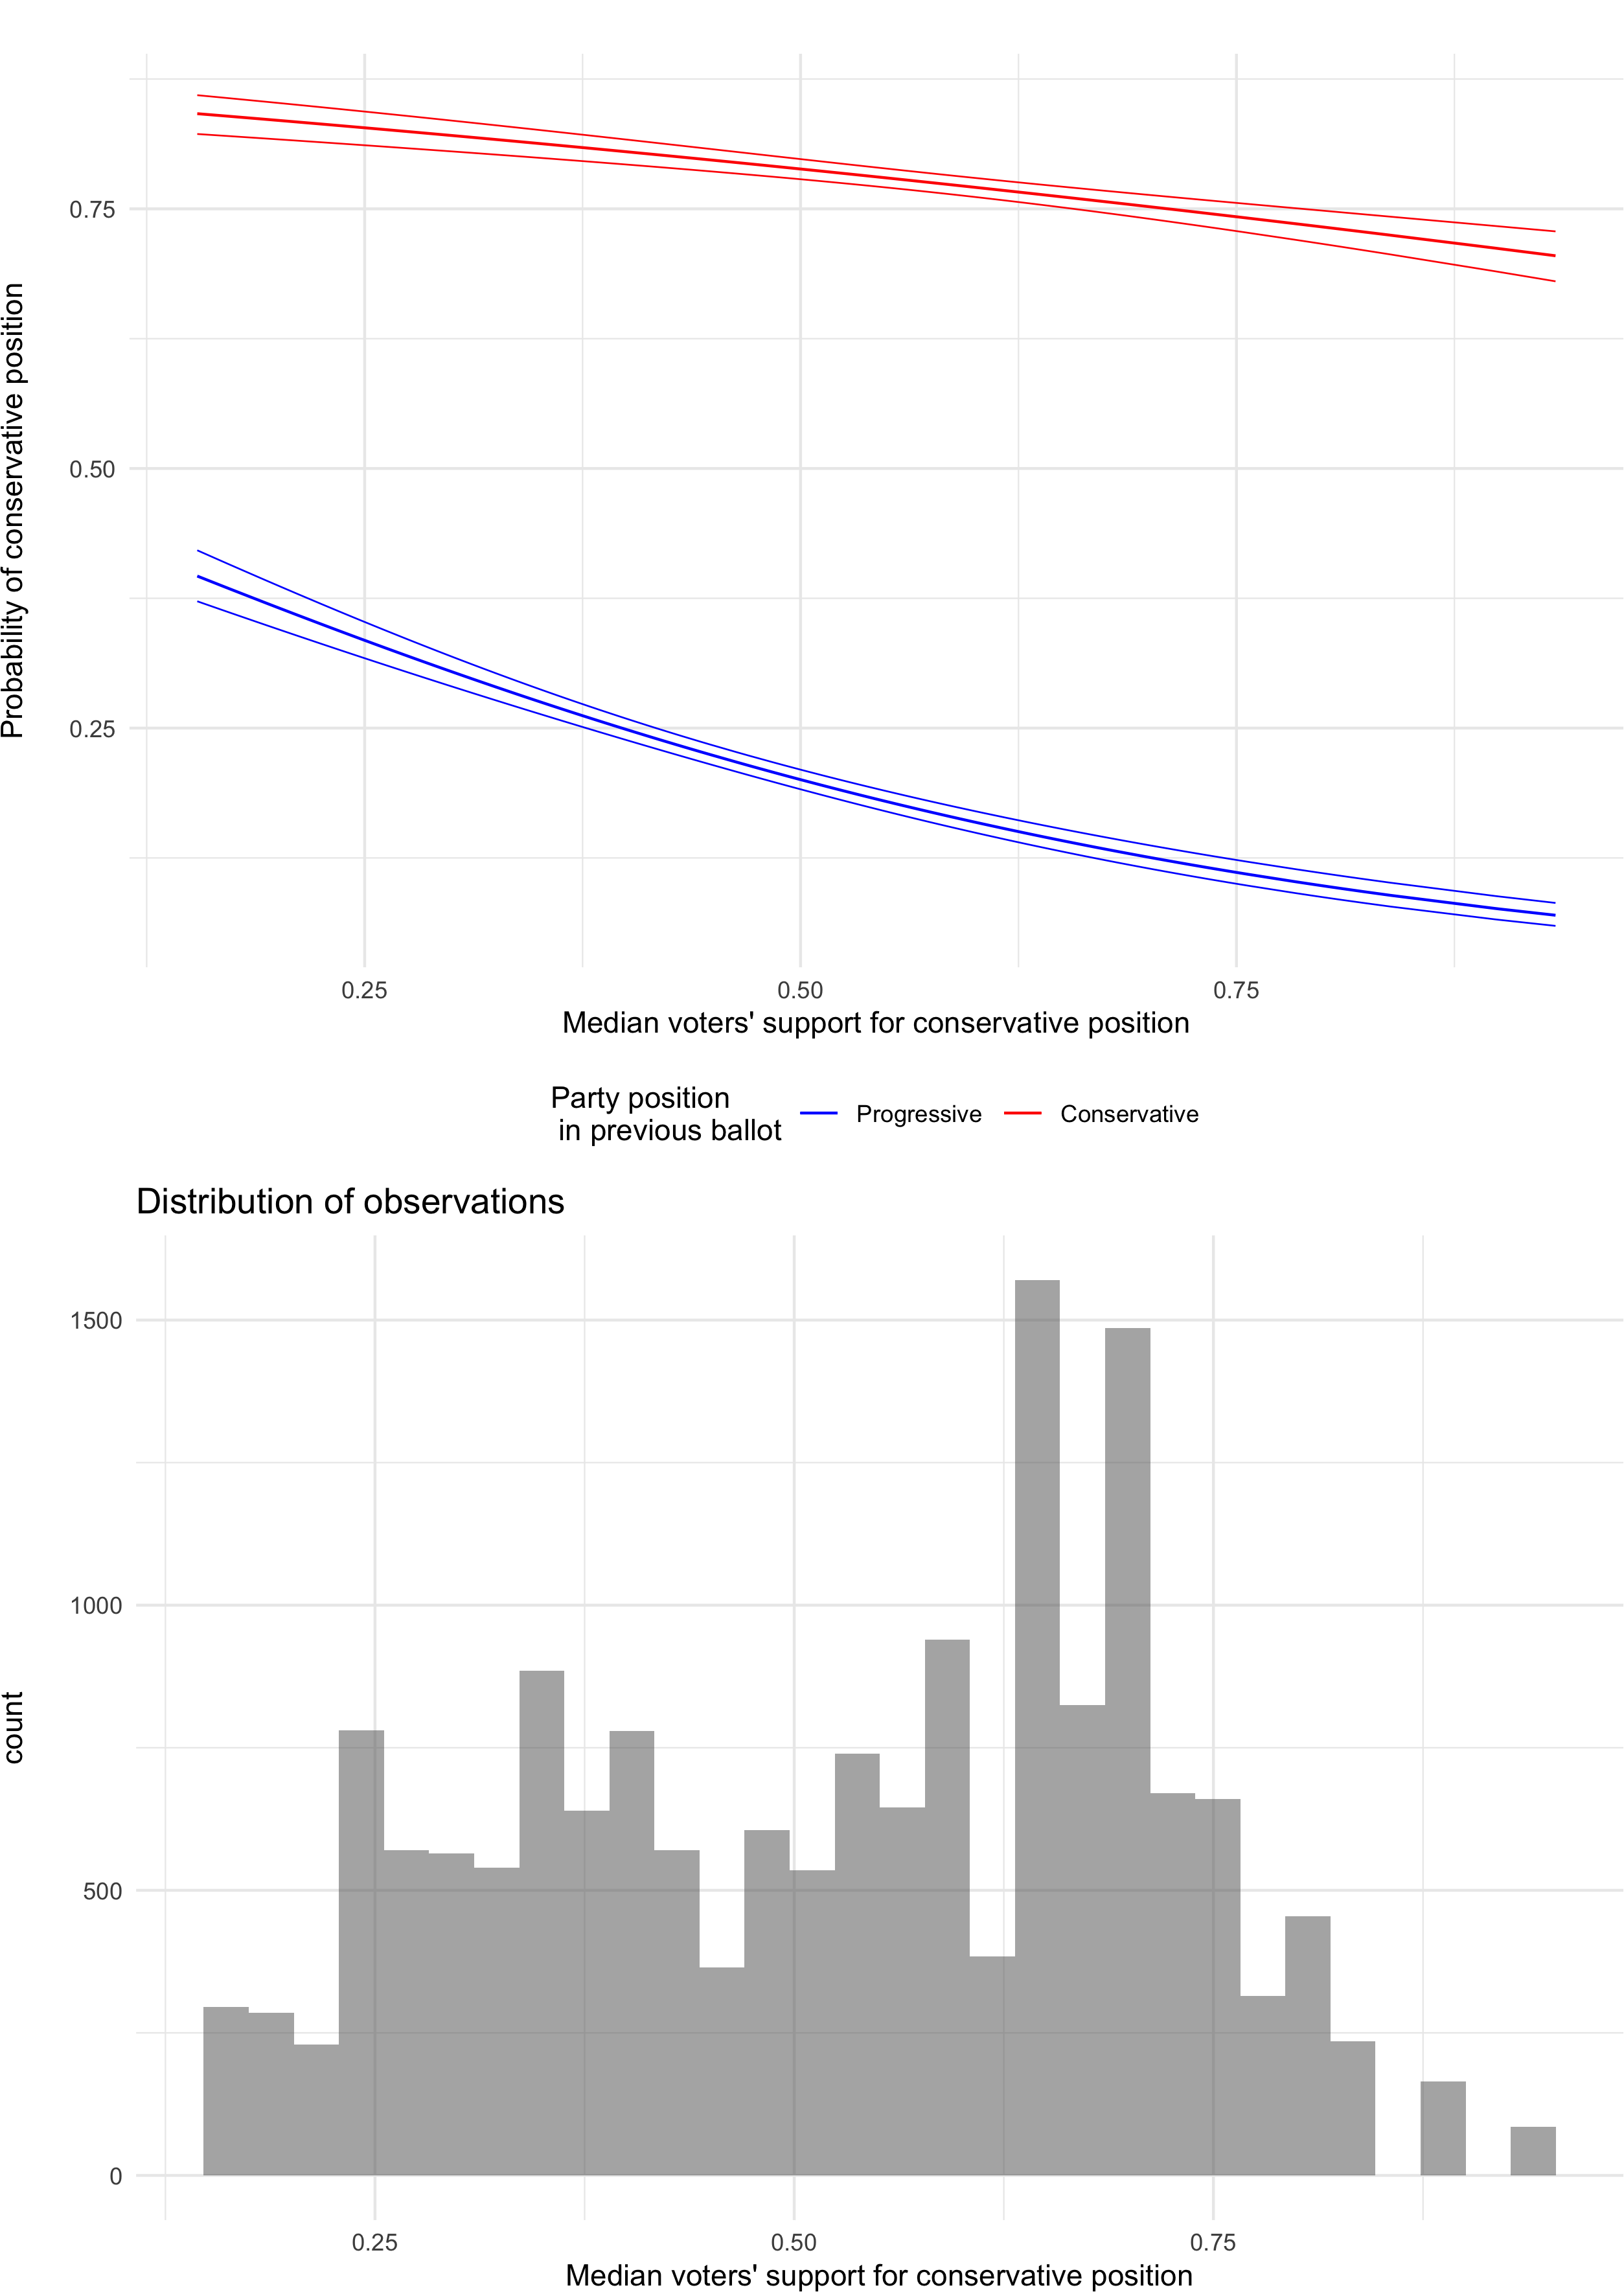
Parties’ responsiveness to the median voter’s position.

Figure 3 confirms the results of the first model and shows that parties are not responsive to the median voter’s position. If anything, parties seem to go in the opposite direction of the median voter. Indeed, we see that for both parties that previously had the progressive and the conservative position on a ballot, the support for the conservative position by the median voter lowers the probability of taking the conservative position. This is especially true for ballots with intense signals from the median voter. Indeed, we see that parties are more likely to take conservative positions when median voters had weak support of the conservative position in the last ballot. Similarly, strong support by the median voter for the conservative position lowers the probability that parties take the conservative position on the following ballots. This result goes against the general assumption that parties will follow moves by the median voters to maximize their electoral gain in future elections. However, we argue that this does not mean that parties are not responsive to the electorate’s position. Instead, we argue that parties will look at a specific segment of the electorate – the partisan voter – and balance their position to the one of the median voters to take a position that represents their electorate more than the median voter – the partisan voter.
The partisan voter
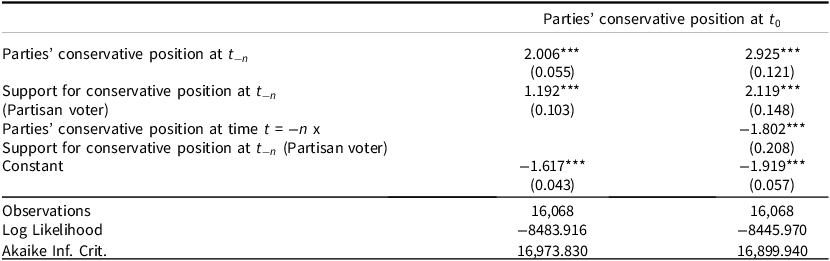
We now turn to the analysis of parties’ responsiveness to partisan voters. The partisan voter represents the core electorate of the party. Empirically, these are the citizens who report identifying with a party. Strategically, parties may want to follow the partisan voter’s position to keep their electorate for the next election. The median voter, even more in a multiparty system, is emcompassing many opinions that parties may not have an advantage in taking into account. The best possible strategy for parties is to have the best appeal to voters who might vote for them. One way to estimate the position of this group of voters is to have a close look at the position of voters who already voted for you. Thus, to keep their current electorate and appeal to their potential electorate, parties have an incentive to be responsive to the partisan voter. Table 4 presents the direct and moderating effect of the support for the conservative position by the partisan voter on the probability of the conservative party position on the following ballots and thus tests H2.
Regressions results for the partisan voter hypothesis

Note: *p
 $\lt$
0.05; **p
$\lt$
0.05; **p
 $\lt$
0.01; ***p
$\lt$
0.01; ***p
 $\lt$
0.001.
$\lt$
0.001.
The results for the first model in Table 4 show that parties are responsive to the partisan voter. Indeed, we see that the more conservative the partisan voter is, the more likely it is that parties will take the conservative position in the following ballot. In the second model, we also see a significant effect of the interaction between party position and partisan voter support for a conservative position at t –n . To discuss the moderating effect, we plotted the predicted probabilities and reported the results in Figure 4.
Parties’ responsiveness to the partisan voter’s position.

Figure 4 shows that, contrarily to the median voter’s position, parties are responsive to the partisan voter’s position as predicted. Indeed, we see that parties are more likely to take the conservative position when their partisans supported the conservative position in a previous ballot, especially when this support had a strong intensity. This shows that parties are not unresponsive to electorate position shifts but that they tailor their responsiveness to parts of the electorate that are more likely to vote for them. In more general terms, these results also confirm that party responsiveness can be observed in different settings, such as direct democratic position-taking.
The relative partisan voter
In sum, the first two parts of our analyses tend to disprove the median voter’s hypothesis and confirm the partisan voter’s hypothesis. However, we argued that parties may consider the median voter in their strategy to position the relative partisan voter. The idea is that parties should try to represent their electorate better than any random voter. Thus, they may consider the position of the partisan voter compared to the median voter. In this case, when n% of the electorate – the median voter – supports a conservative position on a ballot, if n + 1% of the partisan voter supports the conservative position, then the party takes the conservative position. On the opposite, if n − 1% of partisan voters support the conservative position, then the party takes the progressive position in the next ballot. Even if the direction supported by the partisan voter clearly supports the conservative or the progressive position on a ballot, we argue that parties can abstract from the specific side endorsed by their partisan electorate and instead focus on their relative position vis-à-vis the median voter. Thus, parties may be responsive to the partisan voter relative to the median voter. This is what we call the relative partisan voter.
This section presents the results of the models with the relative partisan voter as the electorate of interest. First, Table 5 presents the results of the direct and moderating effect of the support for the conservative position by the relative partisan voter on the probability of conservative party position at time t = 0.Footnote 11 To consider the possible values of the independent variable for the relative partisan voter, we also control for the support of the conservative position by the median voter. Table 5 presents the results of the regressions.
Regressions results for the relative partisan voter hypothesis

Note: *p
 $\lt$
0.05; **p
$\lt$
0.05; **p
 $\lt$
0.01; ***p
$\lt$
0.01; ***p
 $\lt$
0.001.
$\lt$
0.001.
In the first model in Table 5, we see that the support of the conservative position by relatively partisan voters has a positive and significant effect on parties’ conservative position on ballots. Furthermore, we see that the median voters’ conservative support has a negative and significant effect on the dependent variable. This indicates that parties tend to take a more conservative position when their electorate supported the conservative position in previous ballots.
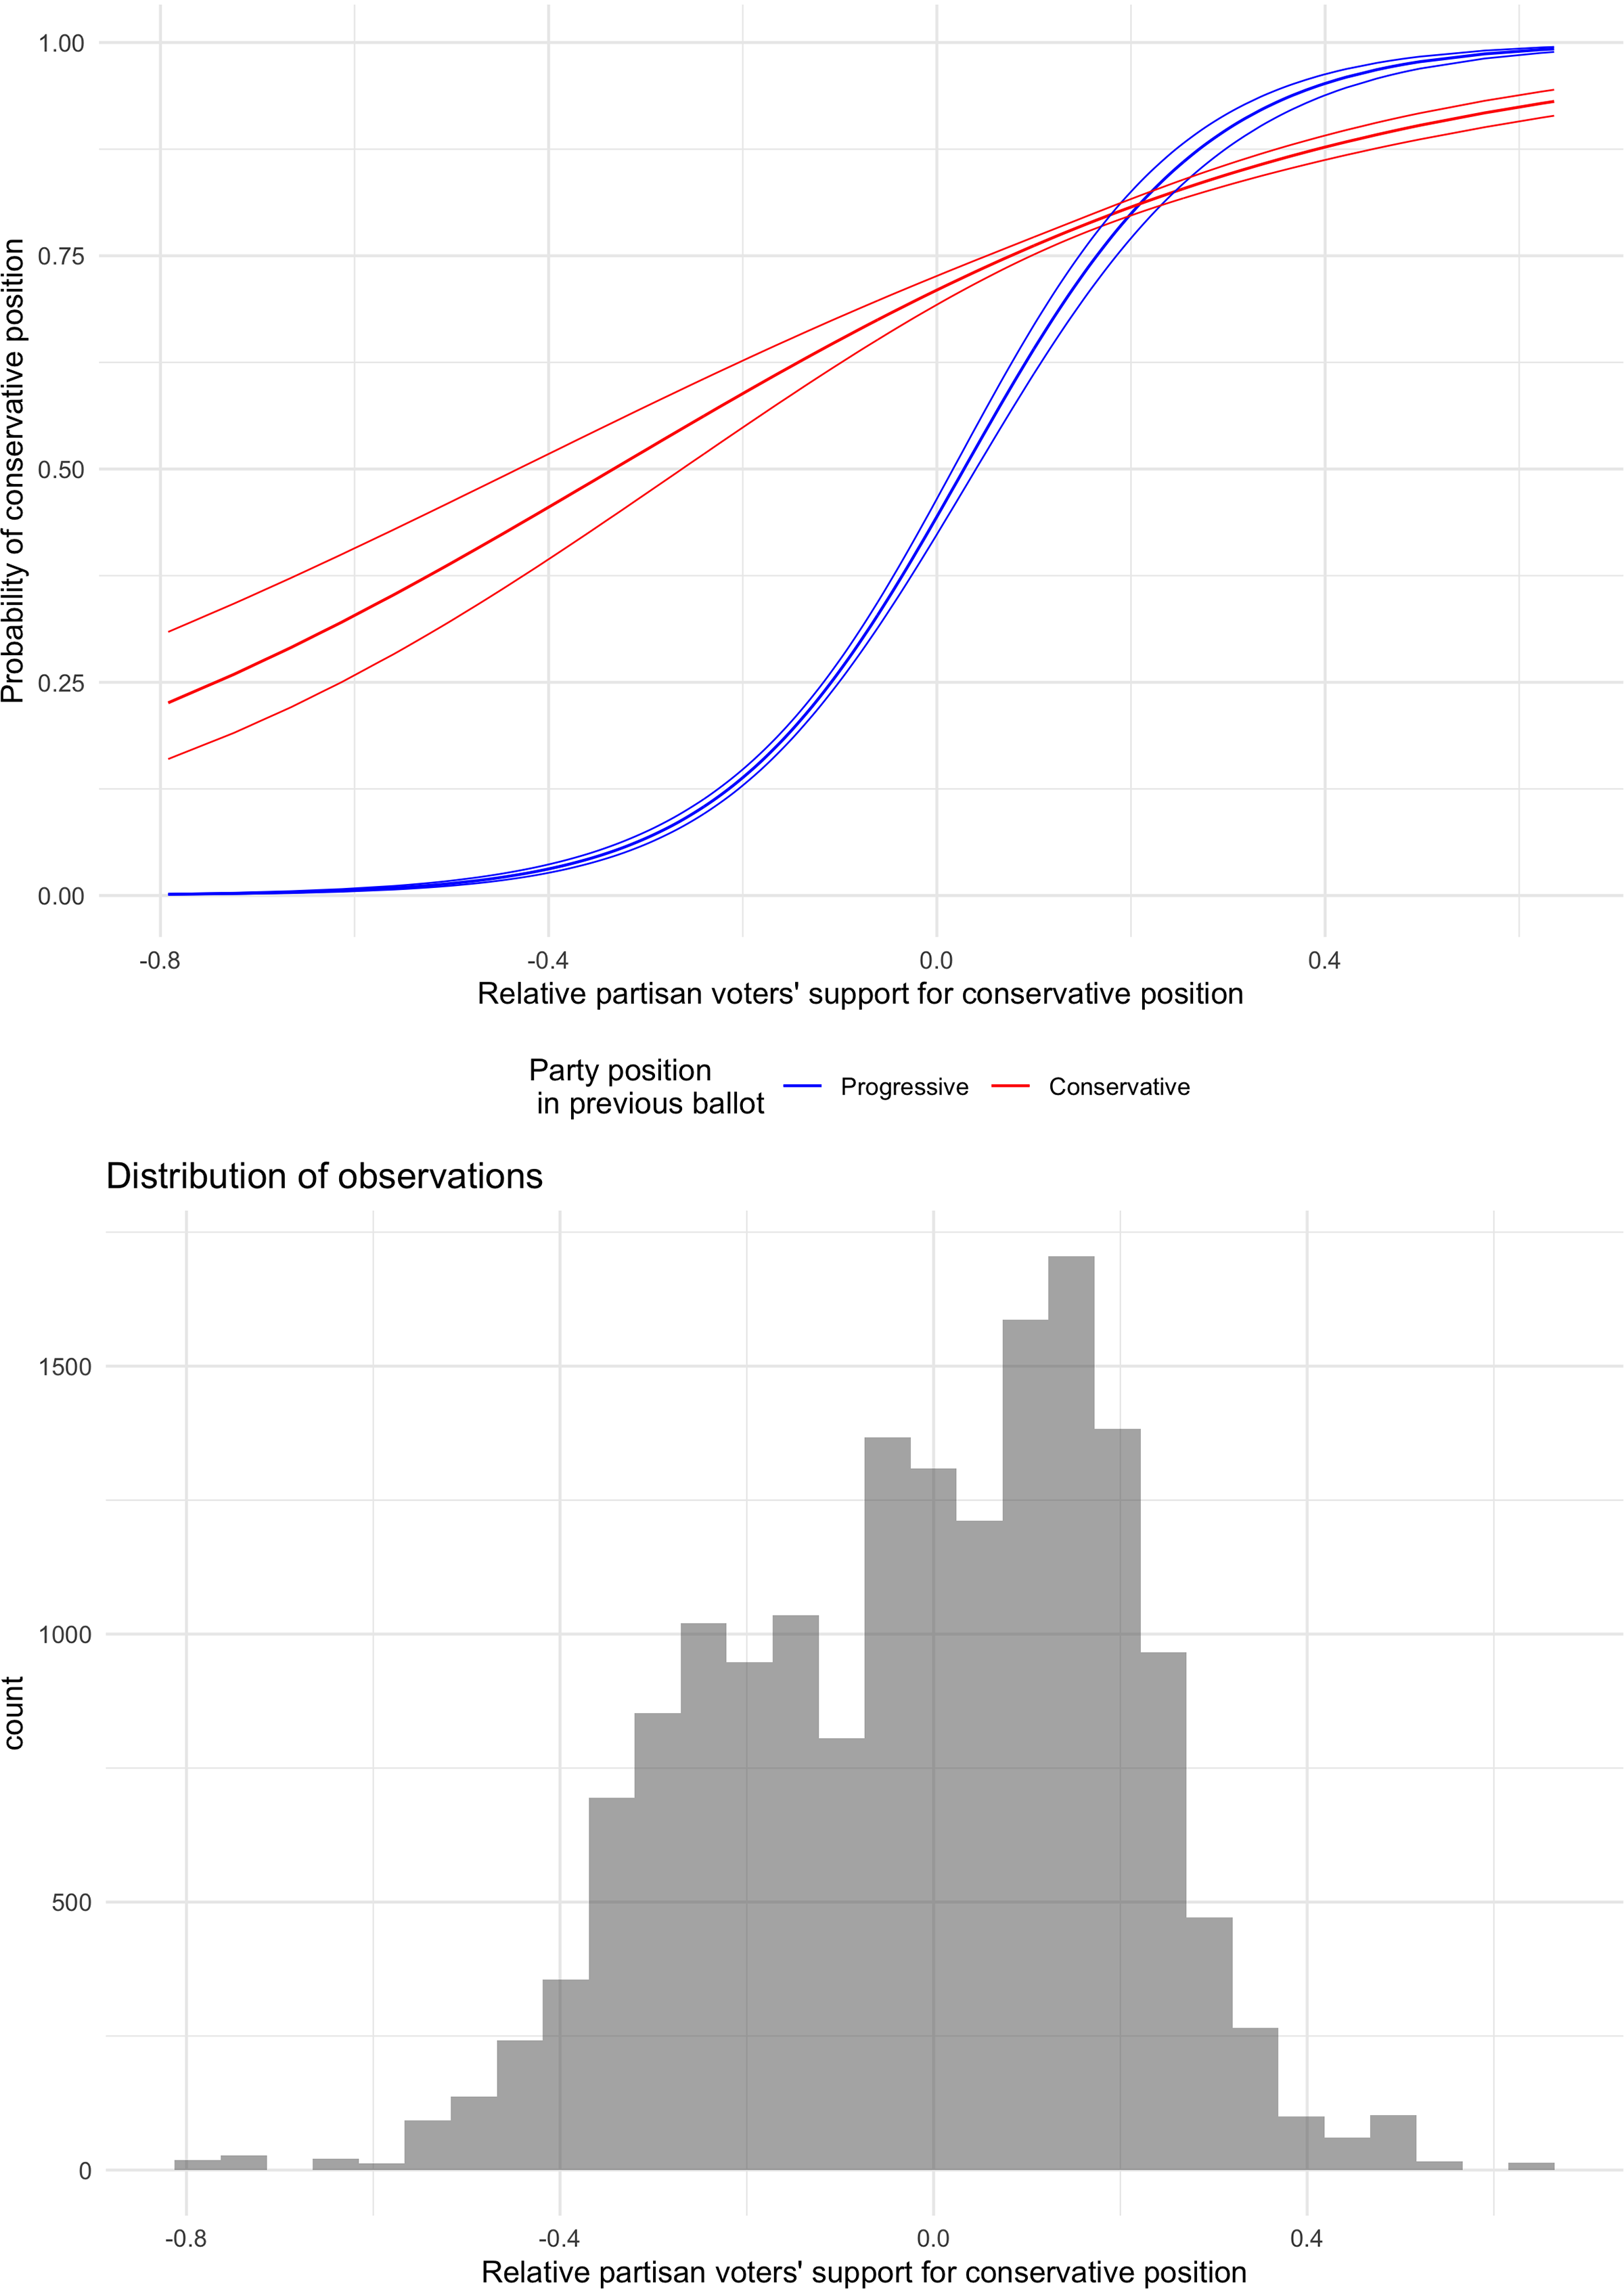
To analyze the results of the second model, we turn to Figure 5, which plots the interaction between the party position and support for the conservative position by the relative partisan in a previous ballot on the current party position.
Parties’ responsiveness to the partisan voter’s position relative to the median voter.

Figure 5 shows that the position of parties is substantially influenced by the relative partisan voter’s position. Indeed, while parties tend to take the conservative position when their electorate supports more the conservative position than the median voter (positive value), the probability that parties take the conservative position gets substantially lower when the party voters support the conservative position less than the median voter. These effects are particularly pronounced when the signal of the relative partisan voter has a strong intensity. Indeed, we see that the probability that parties support the conservative or progressive position in a ballot proposal changes radically when their partisans have a distinctively higher support for the conservative/progressive position than the median voter.
Overall, the results indicate that parties are not responsive to the mean voter but select parts of the electorate that vote for them and tend to follow their position. Moreover, we find that the relative partisan voter framework is relevant to explain parties’ position taking. This means that parties not only look at the position of the majority of their partisans but also weigh their support with the median voter as a benchmark to represent their supporters more than the median voter. In sum, our analyses suggest that parties always tend to favor their electorates’ position over the median voter’s position.
Robustness tests
In addition to the results presented in the former section, we ran additional analyses to verify the robustness of our results. First, we tested for the autocorrelation of party voters’ alignment in order to verify that our results are not driven by the de-alignment of party voters at a specific period in the time frame of the analyses.
Figure A1 in the online Appendix presents the descriptive time series of party voters’ alignment for the five parties considered in this paper and shows no clear trend of autocorrelation for any parties. In addition, Table A3 and Table A4 test for serial autocorrelation by estimating the effect of one and two lags, respectively, for each of the parties. These tests provide evidence that no serial autocorrelation is evidenced for party voters over the whole time period of our study.
Second, we replicated the analyses with different time lags – one and five years – to check whether our time frame was appropriate as a time horizon parties take into consideration. Furthermore, given the myopic nature of humans, we would expect more recent ballots to have a stronger effect. The results presented in Tables A5 to A7 and Figures A2 to A4 in the Appendix show that the results presented in the paper hold with different time lags. Indeed, our results indicate that even for the five-year time frame, our results are confirmed. Second, and in accordance with the myopic decision-making idea, we find that the effects are slightly stronger if we consider a one-year time frame only.
The third test relates to the function of the Green Party. When established, the Green Party was seen as a niche party that focused mainly on environmental issues. Importantly, several contributions highlight the fact that niche parties do not respond in the same way as mainstream parties to public opinion (Meguid Reference Meguid2005, Reference Meguid2023) and react mainly to their own party electorate (Adams, Clark, Ezrow et al. Reference Adams, Clark, Ezrow and Glasgow2006; Bischof and Wagner Reference Bischof and Wagner2017; Ezrow, De Vries, Steenbergen et al. Reference Ezrow, De Vries, Steenbergen and Edwards2011). It is thus fundamental to verify that the results we find in the paper hold when we remove the Green Party and consider only the mainstream parties. The results on the subsample excluding the Greens are presented in Tables A8 to A10 and Figures A5 to A7 and show very similar results to those presented in the paper.
Fourth, we replicate the analyses excluding mandatory referendums. The different nature of mandatory referendums implies that no group needs to mobilize to bring these topics to the ballot. As a result, their inclusion may bias the results of our analyses, as parties may emphasize their opposition differently than with other institutions of direct democracy. The results presented in Tables A11 to A13 and Figures A8, A9, and A10 show essentially similar dynamics without mandatory referendums, which provides a complementary test of the robustness of our findings.
Finally, we replicated the analyses with subsets of ballot proposals with low or high saliency based on the voters’ turnout, given that this factor is discussed as a potential scope condition for responsiveness in the literature. These additional analyses presented in Tables A14 to A16 and Figures A11, A12, and A13 also show similar patterns when considering only low or high saliency ballots.Footnote 12 Nevertheless, the size of the effect seems to be larger for ballots with high saliency, which indicates a higher propensity of parties to be responsive to their electorate when they disagree on salient topics. While our findings do not show clear evidence of a substantive difference in the responsiveness of parties for ballots with different degrees of saliency, these notable differences in effect size may attest that parties have slightly different incentives to be responsive on ballots with high and low saliency.
Taken together, these robustness tests show that the results presented in the paper are not dependent on serial autocorrelation in the time frame of the study, and they hold with a limited selection of mainstream parties, with different time lags, limited institution of direct democracy, and different saliency of ballot proposals.
Conclusion
This study asks what segments of the electorate parties are responsive to. While there is already rich literature on the topic, our study exploiting direct democracy in Switzerland sheds new light on parties’ responsiveness by analyzing to what degree the position-taking of parties is driven by the mean vs. the partisan voter in a dynamic setting with several observations per year. Not only can we study more short-term shifts in party positions in this setting, but our reliance on revealed behavioral measures of party positioning allows us to side-step many of the obstacles that plagued the literature so far.
Our findings indicate that also in this arguably different test of party responsiveness – no direct gain of votes – we confirm the most recent literature that political parties are responsive to their own electorates’ position shifts but not to the mean/median voter. Our analysis shows that, in particular, in situations where the signal from the general electorate and the party voters differs, parties respond by following the preference of their party voters. This is what we coin relative party voter responsiveness. Given that such instances are rather rare, they have not been the focus of the scholarly debate but, in our view, offer an even stronger test of the party-voter responsiveness hypothesis.
However, more studies are needed in other contexts to confirm this trend in a general manner. Although this paper uses reliable data to compare the position of parties and voters over a large number of issues and over 37 years, the analyses are limited to several dimensions. First, while the results are consistent across the five parties analyzed in the paper, different party types may still adhere to a different logic (Adams, Clark, Ezrow et al. Reference Adams, Clark, Ezrow and Glasgow2006; Bischof and Wagner Reference Bischof and Wagner2017; Ferland Reference Ferland2020; Schumacher and Giger Reference Schumacher and Giger2018), and the range of parties analyzed might not have captured this variation. Second, this paper limits its analyses to a unidimensional political space, while others analyze two or more dimensions (Koedam 2021; O’Grady and Abou-Chadi Reference O’Grady and Abou-Chadi2019), and some argue that party responsiveness occurs on single-issue dimensions (Schumacher and Giger Reference Schumacher and Giger2018). Furthermore, our findings indicate that generally responsiveness occurs for salient and less salient topics, although the responsiveness seems to be relatively stronger on salient issues. Beyond issue saliency, parties have different ownership of the different political issues, and this has noticeable electoral consequences for individual voters (see, e.g., Ansolabehere and Iyengar Reference Ansolabehere and Iyengar1994; Fagan Reference Fagan2021; Petitpas and Sciarini Reference Petitpas and Sciarini2018; Tresch, Lefevere, and Walgrave Reference Tresch, Lefevere and Walgrave2015; Walgrave, Lefevere, and Tresch Reference Walgrave, Lefevere and Tresch2012). Thus, parties may adapt differently to a partisan de-alignment depending on their ownership of the issue at stake, which is a clear avenue for future research on party responsiveness, especially in a direct democratic setting.
Finally, although existing literature suggests that in terms of policy congruence, Switzerland is rather average and thus our results should be generalizable, some uncertainty remains. Direct democracy renders both the median voter’s and partisans’ positions highly visible, which is not necessarily the case in other political systems. A party being incongruent with their own base or public opinion in general is more exposed. While our results show that even in such a spotlight, settlers are responsive primarily to their own electorate, some uncertainty remains regarding how well our findings travel. Also, other features of the Swiss system, i.e., that government participation is not dependent on position moderation, might influence our results in the sense that the logic described by Ezrow (Reference Ezrow2008) does not apply in this setting, for instance. Thus, the mean voter influence might be less pronounced in the Swiss case due to a lack of office-seeking motives for parties to engage in this type of behavior.
This paper nevertheless shows how parties’ behavior is explained by their response to shifts in public opinion or, more precisely, partisan supporter shifts. Responsiveness occurs to specific segments of the electorate, and parties focus their attention on the position of voters who are likely to vote for them – the party voters. Given the different setting in which this paper studies responsiveness, this can be seen as good news for the study of representation and hopefully encourages more work on responsiveness in novel circumstances. Among other things, future work could elaborate more on how voters view these patterns of responsiveness and to what degree this influences the electoral fate of parties.
Supplementary material
The supplementary material for this article can be found at https://doi.org/10.1017/S1475676526101030.
Data availability statement
The data that support the findings of this study are openly available in Replication Data for: Parties’ responsiveness to Voters’ Positions in a direct democratic setting at doi: https://doi.org/10.7910/DVN/2GHBXR.
Funding statement
No funding was provided for this research.
Competing interests
The authors declare no competing interest.


 Open access