


1. INTRODUCTION
Glaciers and ice caps on the Antarctic Peninsula and its peripheral islands are affected by rapidly changing climate in the region. The Antarctic Peninsula experienced rapid atmospheric warming during the second half of the 20th century at a rate of ~0.5 °C per decade – one of the strongest trends on Earth (e.g. Turner and others, Reference Turner2009). Most of the glaciers in the region retreated during the same period (Rau and others, Reference Rau2004; Cook and others, Reference Cook, Fox, Vaughan and Ferrigno2005). The spatial pattern of regional glacier changes corresponded with rising ocean temperatures, indicating that ocean forcing acted as a key driver of the glacier retreat, in addition to the atmospheric warming (Cook and others, Reference Cook2016). Another important process affecting the glaciers is the acceleration of inland ice after the disintegration of ice shelves. After the collapse of the Larsen B Ice Shelf in 2002, ice speed increased at glaciers feeding the ice shelf (e.g. Rignot and others, Reference Rignot2004; Scambos and others, Reference Scambos, Bohlander, Shuman and Skvarca2004). The speed-up caused an increase in ice discharge and subsequent thinning of the glaciers (De Angelis and Skvarca, Reference De Angelis and Skvarca2003; Berthier and others, Reference Berthier, Scambos and Shuman2012; Wouters and others, Reference Wouters2015). Recent studies indicate that the warming trend in the Antarctic Peninsula switched to cooling since the beginning of the 21st century (Turner and others, Reference Turner2016; Oliva and others, Reference Oliva2017). Moreover, a number of studies reported evidence of increasing trends in snow accumulation in the region (Turner and others, Reference Turner2005; Van den Broeke and others, Reference Van den Broeke, Van de Berg and Van Meijgaard2006; Miles and others, Reference Miles, Marshall, McConnell and Aristarain2008). Therefore, understanding the response of the glaciers to external forcing is important to assess the fate of the glaciers in the Antarctic Peninsula region and their future contribution to sea-level change (Hock and others, Reference Hock, de Woul and Radić2009; Davies and others, Reference Davies2014).
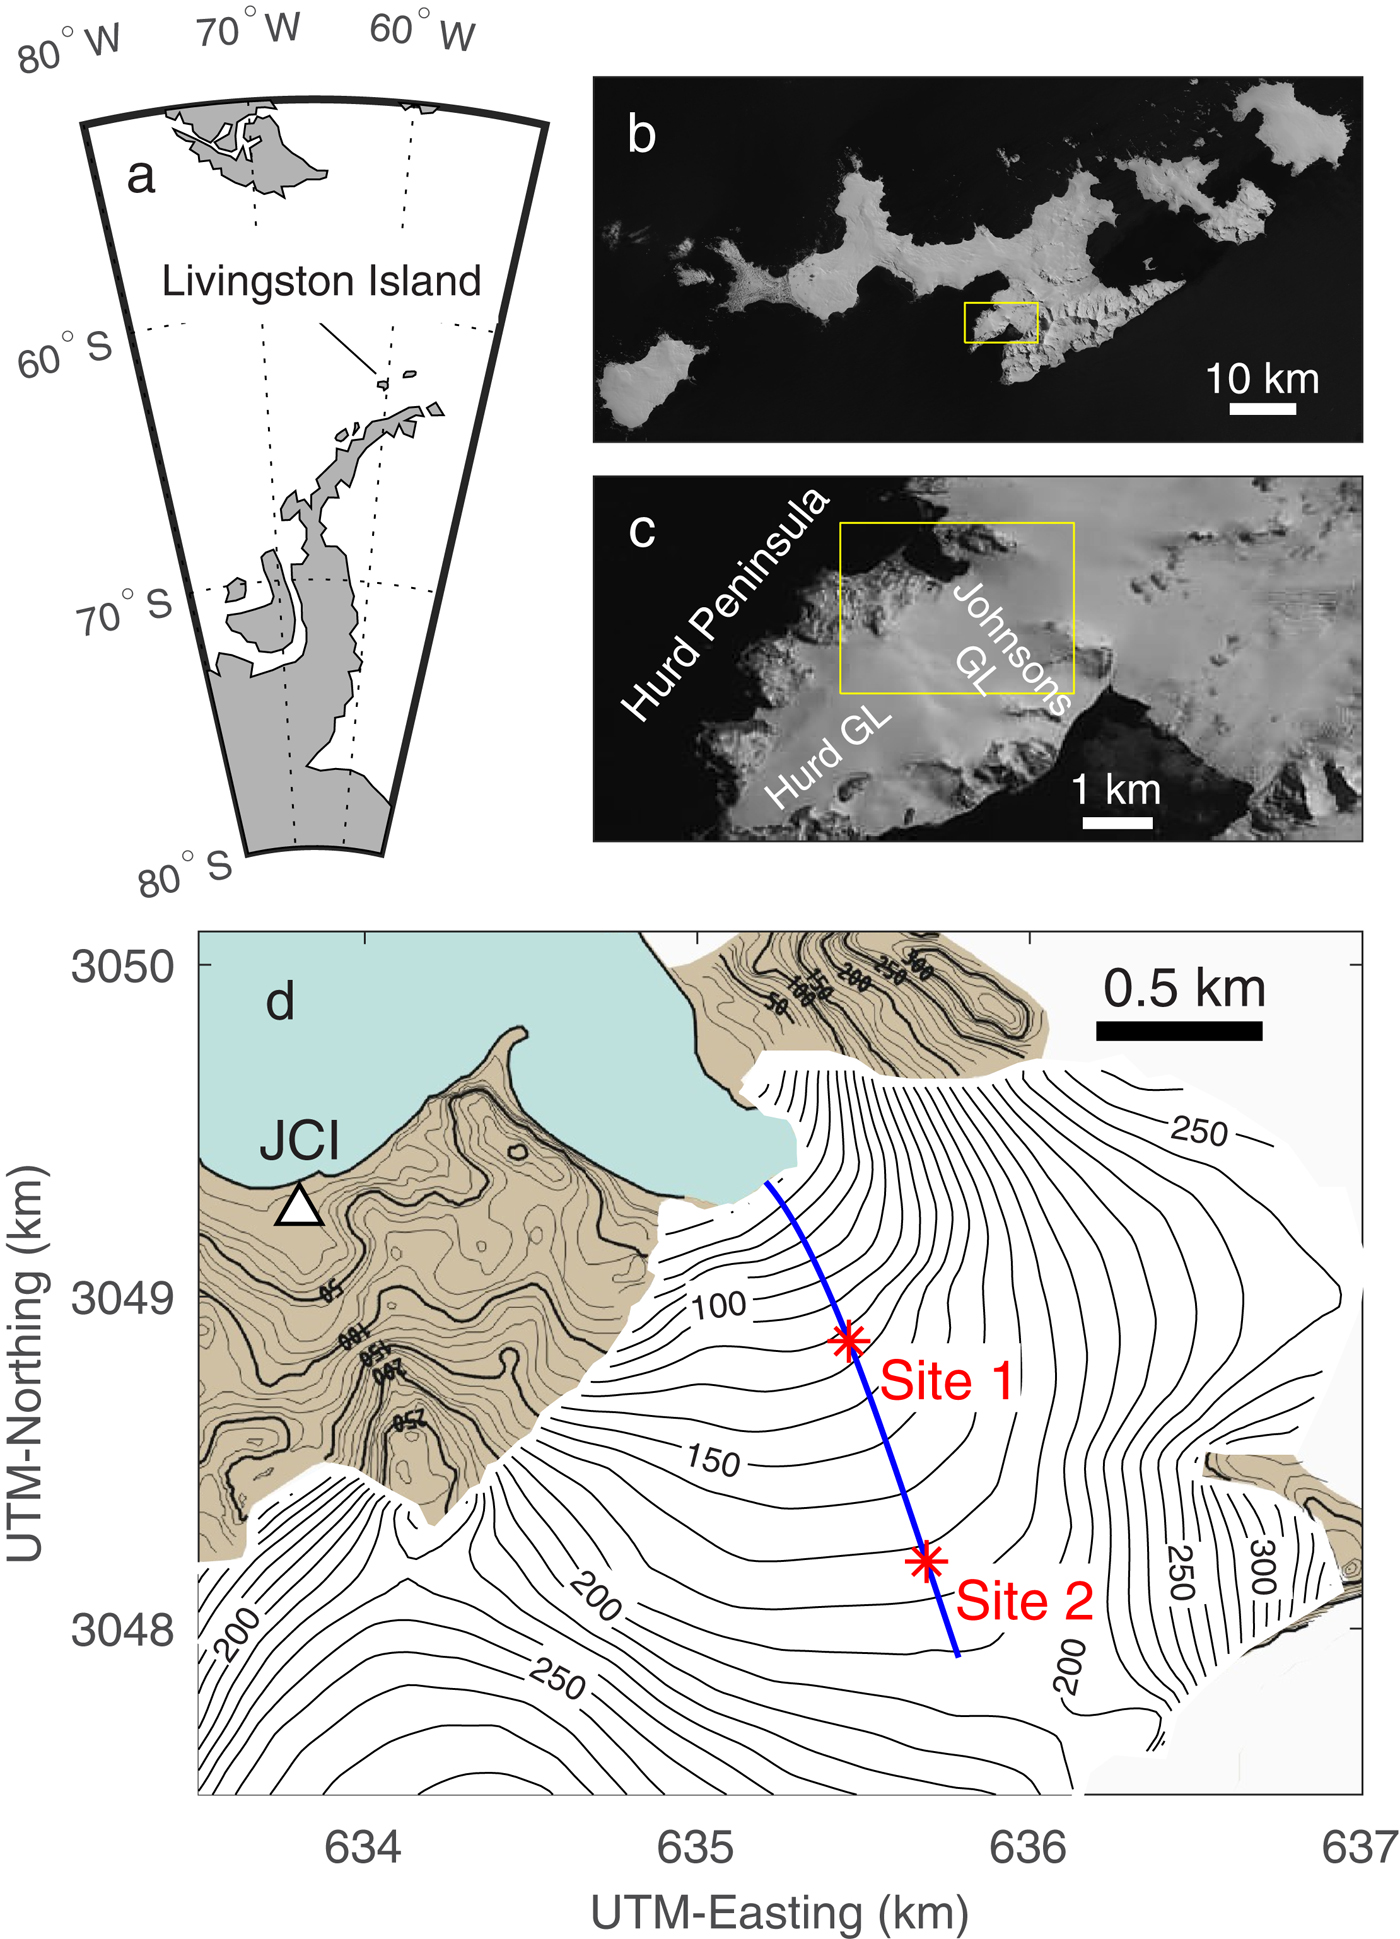
Livingston Island is the second largest island in the South Shetland Islands, ~200 km to the northwest from the northern tip of the Antarctic Peninsula across Bransfield Strait (Fig. 1a). The island is covered with glaciers and ice caps, with the exception of Byers Peninsula and land patches along the coast (Fig. 1b). The area of ice cover was 697 km2 in 2004 (Osmanoğlu and others, Reference Osmanoğlu, Navarro, Hock, Braun and Corcuera2014). Osmanoğlu and others (Reference Osmanoğlu, Navarro, Hock, Braun and Corcuera2014) performed satellite data analysis to measure ice motion over the glaciers and ice caps on Livingston Island. The study revealed large seasonal ice-speed variations, which affected ice discharge from the calving glaciers. According to their estimate, seasonal changes in the ice discharge amount to 46% of the annual mean frontal ablation (mass losses by calving and subaqueous melt) occurring on Livingston Island. Oceanic forcing is not a likely mechanism of the observed seasonality because ice-speed variations were found also at glaciers terminating in shallow water. A more likely interpretation is that surface meltwater drains to the glacier bed and enhances basal ice motion. Thus, atmospheric temperature change affects not only surface mass balance, but also ice dynamics of the glaciers in the Antarctic Peninsula region. These dynamical changes are particularly important in this region because many of its glaciers flow into the ocean and lose ice by calving. The influence of surface meltwater on ice flow speed has been documented by a number of studies at mountain glaciers. High-frequency ice speed and borehole measurements demonstrated that short-term speed changes are caused by subglacial water pressure variations due to meltwater input on the glacier bed (Iken and Bindschadler, Reference Iken and Bindschadler1986; Jansson, Reference Jansson1995; Sugiyama and Gudmundsson, Reference Sugiyama and Gudmundsson2004). In the southern hemisphere, short-term ice-speed variations associated with changes in subglacial water pressure were reported in Patagonia (Sugiyama and others, Reference Sugiyama2011). However, subglacial water pressure variations driven by surface meltwater have not been observed in Antarctica thus far, and borehole measurements of subglacial conditions have not been reported in the Antarctic Peninsula region.
(a) Map showing the location of Livingston Island. (b) Landsat image of Livingston Island acquired on 16 January 2014. The box indicates the region covered by (c). (c) The Landsat image showing the study site. The box indicates the region covered by the map in (d). (d) Map of Johnsons Glacier with locations of the drilling/GPS sites (*) and JCI (triangle). The lines show surface elevation with intervals of 10 m, based on geodetic surveys in 1999–2000 (Molina and others, Reference Molina, Navarro, Calvet, García-Sellés and Lapazaran2007). The vertical cross section shown in Figure 2 is taken along the blue line.
Motivated by the short-term flow speed variations reported by Osmanoğlu and others (Reference Osmanoğlu, Navarro, Hock, Braun and Corcuera2014), we performed hot-water drilling on Johnsons Glacier, Livingston Island, for subglacial water pressure measurements. The pressure data were compared with high-frequency GPS measurements on the glacier to investigate a link between subglacial conditions and ice dynamics. Boreholes were also utilized for ice temperature measurements. The thermal structure of a glacier is relevant to englacial and subglacial hydrology, which provides a clue to understand variations observed in pressure and ice speed. Therefore, the results from our study contribute to a better understanding of glacier response to changing climate in the Antarctic Peninsula region. Direct observation of subglacial water pressure also aids understanding of the mechanisms of glacier speed-ups observed in this region (Rignot and others, Reference Rignot2004; Scambos and others, Reference Scambos, Bohlander, Shuman and Skvarca2004; Pritchard and Vaughan, Reference Pritchard and Vaughan2007).
2. STUDY SITE
Johnsons Glacier (62°40′ S, 60°22′ W) is located on Livingston Island, South Shetland Islands, near the Antarctic Peninsula (Fig. 1). The glacier, forming a part of the Hurd Peninsula ice cap (Figs 1c and d), covers an area of 5.36 km2 and has an altitudinal range 50–330 m a.s.l. (Navarro and others, Reference Navarro, Jonsell, Corcuera and Martín-Español2013). The glacier front is situated in shallow sea water (~5 m deep) (Fig. 2), where ice forms a ~50-m-high cliff extending 570 m along the coast. Previously performed ice radar surveys showed a maximum glacier thickness of ~160 m (Navarro and others, Reference Navarro2009). The radio-echo data suggested a polythermal structure, but full thickness ice temperature measurements have never been carried out in this region. Maximum ice flow speed at the calving front is 65 m a−1 and decreases up-glacier (Ximenis and others, Reference Ximenis1999; Otero and others, Reference Otero, Navarro, Martín, Cuadrado and Corcuera2010). Satellite-remote-sensing data indicated seasonal ice-speed variations near the front of Johnsons Glacier, but uncertainty was large compared to the change in speed (Osmanoğlu and others, Reference Osmanoğlu, Navarro, Hock, Braun and Corcuera2014). In situ measurements for short-term flow speed variations have never been carried out before.
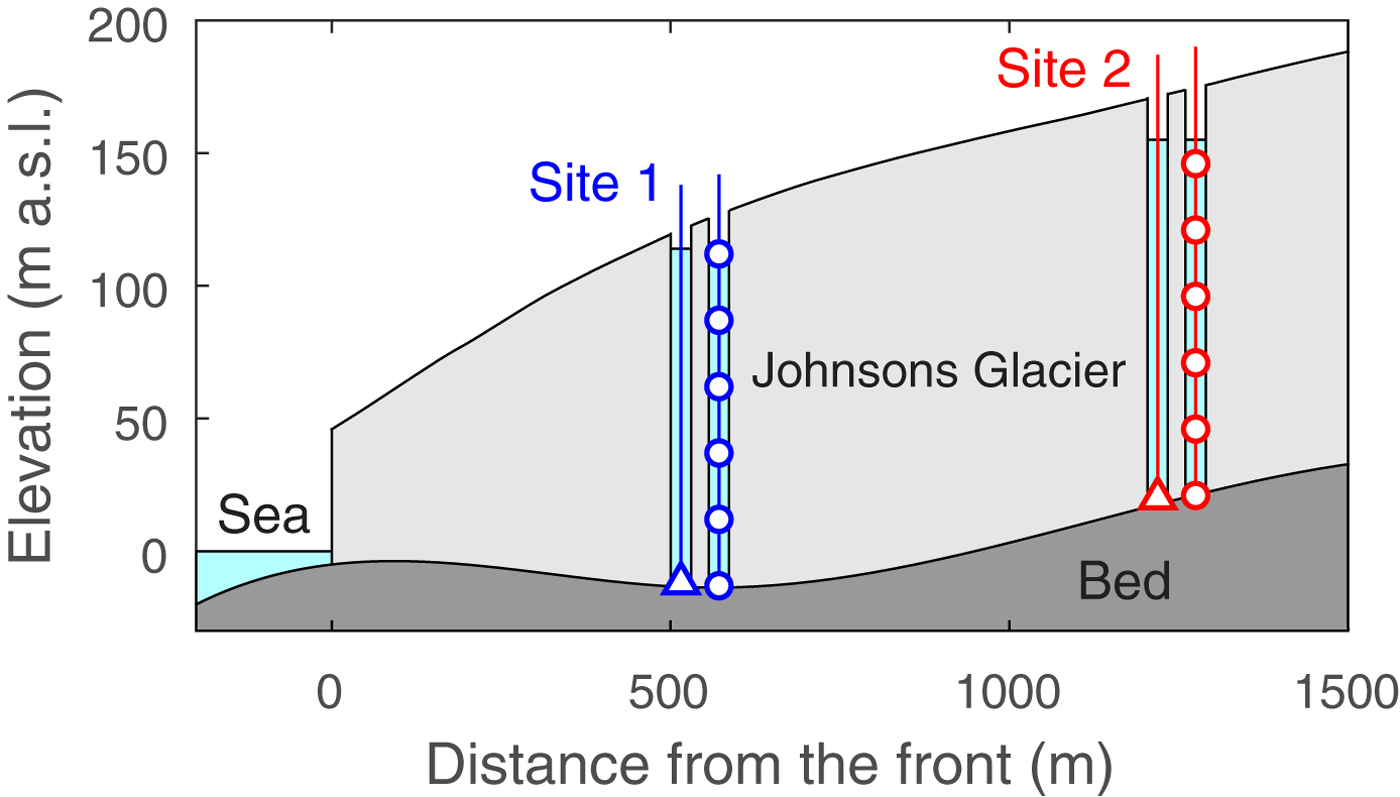
Vertical cross section of Johnsons Glacier along the blue line in Figure 1d. Hot water drilling and GPS measurements were performed at Site 1 and Site 2. The markers indicate the location of the pressure sensors (triangle) and thermistors (circle). The glacier surface shows the elevation in 1999/2000 (Fig. 1d) (Molina and others, Reference Molina, Navarro, Calvet, García-Sellés and Lapazaran2007) and the bed elevation is based on measurements at the glacier front and the drilling sites.
Johnsons Glacier is one of a few glaciers in the Antarctic Peninsula region which have relatively long field observation records. The glacier has been amply studied by Spanish researchers because of its proximity to the Spanish research station Juan Carlos I (JCI). Surface mass balance has been monitored since the 2001/02 summer field season (Navarro and others, Reference Navarro, Jonsell, Corcuera and Martín-Español2013). Ground-based radio-echo soundings were performed on Johnsons and the adjacent Hurd Glaciers to measure ice thickness, as well as to study water content and thermal structure of the ice (Benjumea and others, Reference Benjumea, Macheret, Navarro and Teixidó2003; Navarro and others, Reference Navarro, Macheret and Benjumea2005, Reference Navarro2009; Molina and others, Reference Molina, Navarro, Calvet, García-Sellés and Lapazaran2007). Automatic weather stations (AWS) have been operating at JCI since 1988 and on Johnsons Glacier since 2006. The latter data were used by Jonsell and others (Reference Jonsell, Navarro, Bañón, Lapazaran and Otero2012) to run a temperature-radiation index melt model that showed a high sensitivity of glacier melt to changes in ambient temperature: a 0.5 °C temperature increase resulted in 56% higher melt rates.
The surface elevation change was measured from DEMs constructed from aerial photographs from 1957 and surface-based topographic measurements in 1999/2000, quantifying the mass loss of Johnsons and Hurd Glaciers during 1957–2000 as 10% (Molina and others, Reference Molina, Navarro, Calvet, García-Sellés and Lapazaran2007). Together with a 4.3% decrease in total ice area on Livingston Island between 1956 and 1996 (Calvet and others, Reference Calvet, García-Sellés and Corbera1999), the data represent the response of the glaciers to the rapid climate change observed in this region since the 1950s. The total mass of Johnsons Glacier decreased between 2002 and 2011 at a rate of −0.09 ± 0.10 m w.e. (Navarro and others, Reference Navarro, Jonsell, Corcuera and Martín-Español2013), but the mass loss rate was smaller in magnitude than that of the preceding period 1957–2000 (−0.16 ± 0.09 m w.e.) (Molina and others, Reference Molina, Navarro, Calvet, García-Sellés and Lapazaran2007). The decelerated mass loss was attributed to a combination of increased winter precipitation and cooling in the summer period (Navarro and others, Reference Navarro, Jonsell, Corcuera and Martín-Español2013).
3. METHODS
3.1. Hot water drilling
We drilled boreholes with a hot water drilling system, consisting of two high pressure hot water machines (Kärcher HDS1000BE), 0.5-inch diameter hoses (Bridgestone WAR08), a drilling stem with 3.6 mm diameter nozzle, pully, tripod and water basins (1000 and 500 L) (Hubbard and Glasser, Reference Hubbard and Glasser2005; Sugiyama and others, Reference Sugiyama2010a). The system generates a hot water jet of ~60 °C at a rate of 30 L min−1. Because the glacier was covered with snow and no water was available, we transported snow-meltwater from a pond near the glacier to the drilling sites with snowmobiles. Four boreholes with depths of 130–151 m were drilled at a mean rate of 57 m h−1.
Drilling was carried out from 12 to 27 January 2015 at two locations, Site 1 (126 m a.s.l.) and Site 2 (172 m a.s.l.) situated 550 and 1250 m from the glacier front, respectively (Figs 1d and 2). The drilling sites were located up-glacier of a highly crevassed area, which extended ~300 m from the calving front (Otero and others, Reference Otero, Navarro, Martín, Cuadrado and Corcuera2010). The equilibrium line altitude (ELA) had generally been above Site 2 until the hydrological year 2009 (Navarro and others, Reference Navarro, Jonsell, Corcuera and Martín-Español2013). Then it dropped to around the elevation of Site 1 for ~4 years, followed by a further drop down to sea level in 2014 and 2015. The ELA remained at 105 m a.s.l. in 2016 and did not return above the drilling sites until 2017 (Navarro and others, Reference Navarro, Jonsell, Corcuera and Martín-Español2013; World Glacier Monitoring Service data https://wgms.ch). Accordingly, both drilling sites were covered with a several-meter thick snow layer during the field campaign in 2015, and the surface mass balance remained positive until our measurements were completed in March 2017.
Two boreholes were drilled at each of the two drilling sites to install a pressure sensor and a thermistor chain at each site in separate boreholes. When the nozzle reached the glacier bed, water in the boreholes showed no clear indication. The water surface remained at the top of the boreholes or dropped by only a few meters. Between several days to weeks after the drilling, however, the borehole water level dropped, and subglacial water pressure showed short-term variations, which are described later. Borehole depths were measured by reading the cable length of a borehole video camera (Raax SC-200) lowered to the bottom. Video images showed highly turbid water in the lower half of the boreholes, which indicated the existence of a sediment layer at the glacier bed.
3.2. Subglacial water pressure
Vibrating wire pressure transducers (Geokon 4500S) were installed in the boreholes ~0.5 m above the glacier bed. The depths of these boreholes were 137.7 ± 0.5 m at Site 1 and 153.5 ± 0.5 m at Site 2 (Fig. 2), including 3.6- and 2.5-m-thick surface snow layers. The sensor cables were connected to data loggers with interface modules (Campbell CR1000 and AVW1). The loggers were powered with 12 V batteries to record subglacial water pressure every 20 min with an accuracy and a resolution of <2 and 0.5 kPa, respectively. We operated the pressure sensors for more than 2 years, from 19 January 2015 to 3 March 2017 at Site 1 and 29 January 2015 to 1 March 2017 at Site 2. The overburden pressures at the drilling sites were calculated using densities of ice (910 kg m−3) and snow (350 kg m−3).
3.3. Ice motion
Ice motion was measured by surveying aluminum poles installed near the drilling sites (Sites 1 and 2 in Fig. 1d). We used dual-frequency GPS receivers to obtain three-dimensional coordinates with a static positioning technique. The antennas of the GPS (GNSS Technology Inc., GEM-1) were mounted on the top of the poles to record L1 and L2 GPS signals every second. The GPS receivers were kept running over austral summer field seasons in 2015 and 2016, from 10 January to 19 February in 2015 and from 27 January to 21 February in 2016. The devices were powered with 12 V batteries and solar panels. Power failure resulted in occasional loss of data for several hours to days. GPS data were processed with those from a reference station (Trimble R7) installed at JCI (Fig. 1d). We used GPS processing software RTKLIB (http://www.rtklib.com/rtklib.htm) to obtain coordinates for every 1-hour time window in a static mode. With the relatively short baseline length (~1.5–2 km), positioning errors in the static GPS measurement is typically several millimeters in the horizontal and 5 mm in the vertical directions, according to previous measurements under similar conditions (Sugiyama and others, Reference Sugiyama, Bauder, Riesen and Funk2010b). Horizontal ice speed was computed by filtering a time series of the positioning data, using a Gaussian smoothing routine with time windows of 6 and 18 hours at Sites 1 and 2, respectively. Ice displacements during the smoothing time windows were several times greater than the GPS positioning accuracy.
3.4. Ice temperature
The boreholes were utilized also for ice temperature measurements with thermistor strings (Geokon Model 3810) equipped with 8 thermistors 25 m apart. We installed the strings in boreholes with depths of 139.1 ± 0.5 m at Site 1 and 152.5 ± 0.5 m at Site 2, so that the thermistors are placed at 0, 25, 50, 75, 100, 125 and 150 m from the glacier bed. The resistance of the thermistors was measured with a digital multimeter (Fluke 179 or 189) and the resistance was converted to temperature using an equation provided by the manufacturer. The thermistors were calibrated in ice water before the installation. The calibration at 0 °C was sufficient to reduce error in the temperature measurement because measured ice temperature deviated only a little from 0 °C (−0.25 < T < 0 °C). Considering the accuracy of the resistance measurement and temperature fluctuations during the calibration, we estimate the error to be <0.05 °C. The strings were installed in the boreholes on 21 January 2015 at Site 1 and on 27 January 2015 at Site 2. Thermistor resistances were measured on 8 March 2016, more than 1 year after the installation. We assumed a coefficient of − 7.4 × 10⁻⁸ K Pa−1 (Petrenko and Whitworth, Reference Petrenko and Whitworth1999) to compute melting temperature at the depth of the thermistors.
3.5. Meteorological data
To investigate the influence of glacier surface melt and rain water on subglacial water pressure and ice-speed variations, we analyzed air temperature and precipitation measured by the AWS operated at JCI (12 m a.s.l.) (Fig. 1d) (Bañón and others, Reference Bañón, Justel, Velázquez and Quesada2013). The air temperature was measured at 1.7 m above the ground using a temperature/humidity sensor (Vaisala HMP45C) installed in a shielded box. A tipping bucket rain gage (Young 52203) was used for precipitation measurement. Data were recorded with a datalogger (Campbell CR10X) with intervals of 10 min, which were processed to obtain daily mean values.
3.6. Ice-penetrating radar data
The ice thickness along the glacier flowline passing approximately across Sites 1 and 2 (Fig. 1d) was measured as part of a detailed radar campaign on Johnsons Glacier performed nearly simultaneously to the drilling, between January and February 2015. The radar used, VIRL-7 (Vasilenko and others, Reference Vasilenko, Machío, Lapazaran, Navarro and Frolovskiy2011), had a central frequency of 20 MHz. Transmitter and receiver systems were placed on separate small plastic sledges pulled by a snowmobile. On heavily crevassed areas, they were pulled behind skiers. Radar processing was done using RadExPro software, by GDS Production (Kulnitsky and others, Reference Kulnitsky, Gofman and Tokarev2000). The main processing steps consisted of bandpass filtering, normal move-out correction, amplitude correction and Stolt 2D F-K migration (Navarro and Eisen, Reference Navarro, Eisen, Pellikka and Rees2010). The time-to-thickness conversion was done assuming a radio-wave velocity of 0.168 m ns−1.
4. RESULTS
4.1. Subglacial water pressure
The 2-year record of subglacial water pressure showed seasonal and short-term (days–weeks) variations (Fig. 3). At Site 1, pressure dropped to <50% of the overburden pressure in late January 2015, which was followed by short-term fluctuations and gradual pressure increase from February to May. Pressure reached the overburden pressure approximately when daily mean air temperature dropped below zero (Fig. 3b). Pressure was kept approximately at the overburden level for the rest of the year until several high-pressure peaks were observed in January and February 2016. Relatively constant pressure at ~10% above the overburden pressure was recorded from April to December 2016. After the consistently high pressure during the winter period, short-term pressure variations were observed during the following summer season in January and February 2017. The magnitude of the variations during summer 2016 and 2017 was smaller than that observed in 2015.
(a) Daily mean air temperature (magenta) and precipitation (black) from January 2015 to March 2017 measured at JCI. (b) Subglacial water pressure measured in the boreholes at Site 1 (blue) and Site 2 (red). Thick lines are after filtering high-frequency variations from raw data (thin lines). The blue and red dashed lines indicate the overburden pressures at Site 1 and Site 2, respectively. The shaded areas represent the 2015 and 2016 summer observation periods covered by Figure 4.

Similar but clearer seasonal patterns were obtained at Site 2. Pressure dropped several days after the drilling and showed short-term variations during the summer period from January to April in 2015. Pressure increased in the late summer and reached the overburden pressure in late April. Then, it gradually decreased over the rest of the year until the next summer season. A similar seasonal cycle was observed in 2016. The range of the annual pressure variations was within 90–100% of the overburden pressure, except for the drop to lower pressures during the summer periods. In addition to the general trend described above, the sensor at Site 2 recorded sharp low-pressure troughs (light red in Fig. 3b). During these events, pressure suddenly dropped and remained at a low level typically for several hours to a day. These troughs were more frequently observed in the summer periods, but smaller troughs were observed also in other seasons.
During the summer GPS measurement periods, water pressure varied on temporal scales of days to weeks. At Site 1, pressure dropped from the overburden level ~2 weeks after the drilling (Fig. 4a). For the rest of the GPS measurement period in 2015, pressure varied at ~50% of the overburden with high-pressure peaks on 4 and 8–9 February. In the summer of 2016, pressure was consistently high and showed variations above the overburden level (Fig. 4b). Pressure dropped close to the overburden level on 31 January and 10 February 2016.
Time series of data obtained during the summer observation periods in 2015 and 2016. (a, b) Subglacial water pressure, (c, d) horizontal ice speed (blue) and vertical displacement (black) at Site 1. (e, f) Air temperature (magenta) and precipitation (black) measured at JCI. (g, h) Water pressure, (i, j) ice speed (red) and vertical displacement (black with error bands) at Site 2. The shaded areas in (a–d) and (g–j) show the periods of speed-up events described in the text. Dashed lines in (a), (b), (g) and (h) indicate the overburden pressure. Water pressure and ice-speed data during these periods are used for the scatter plots in Figure 6.
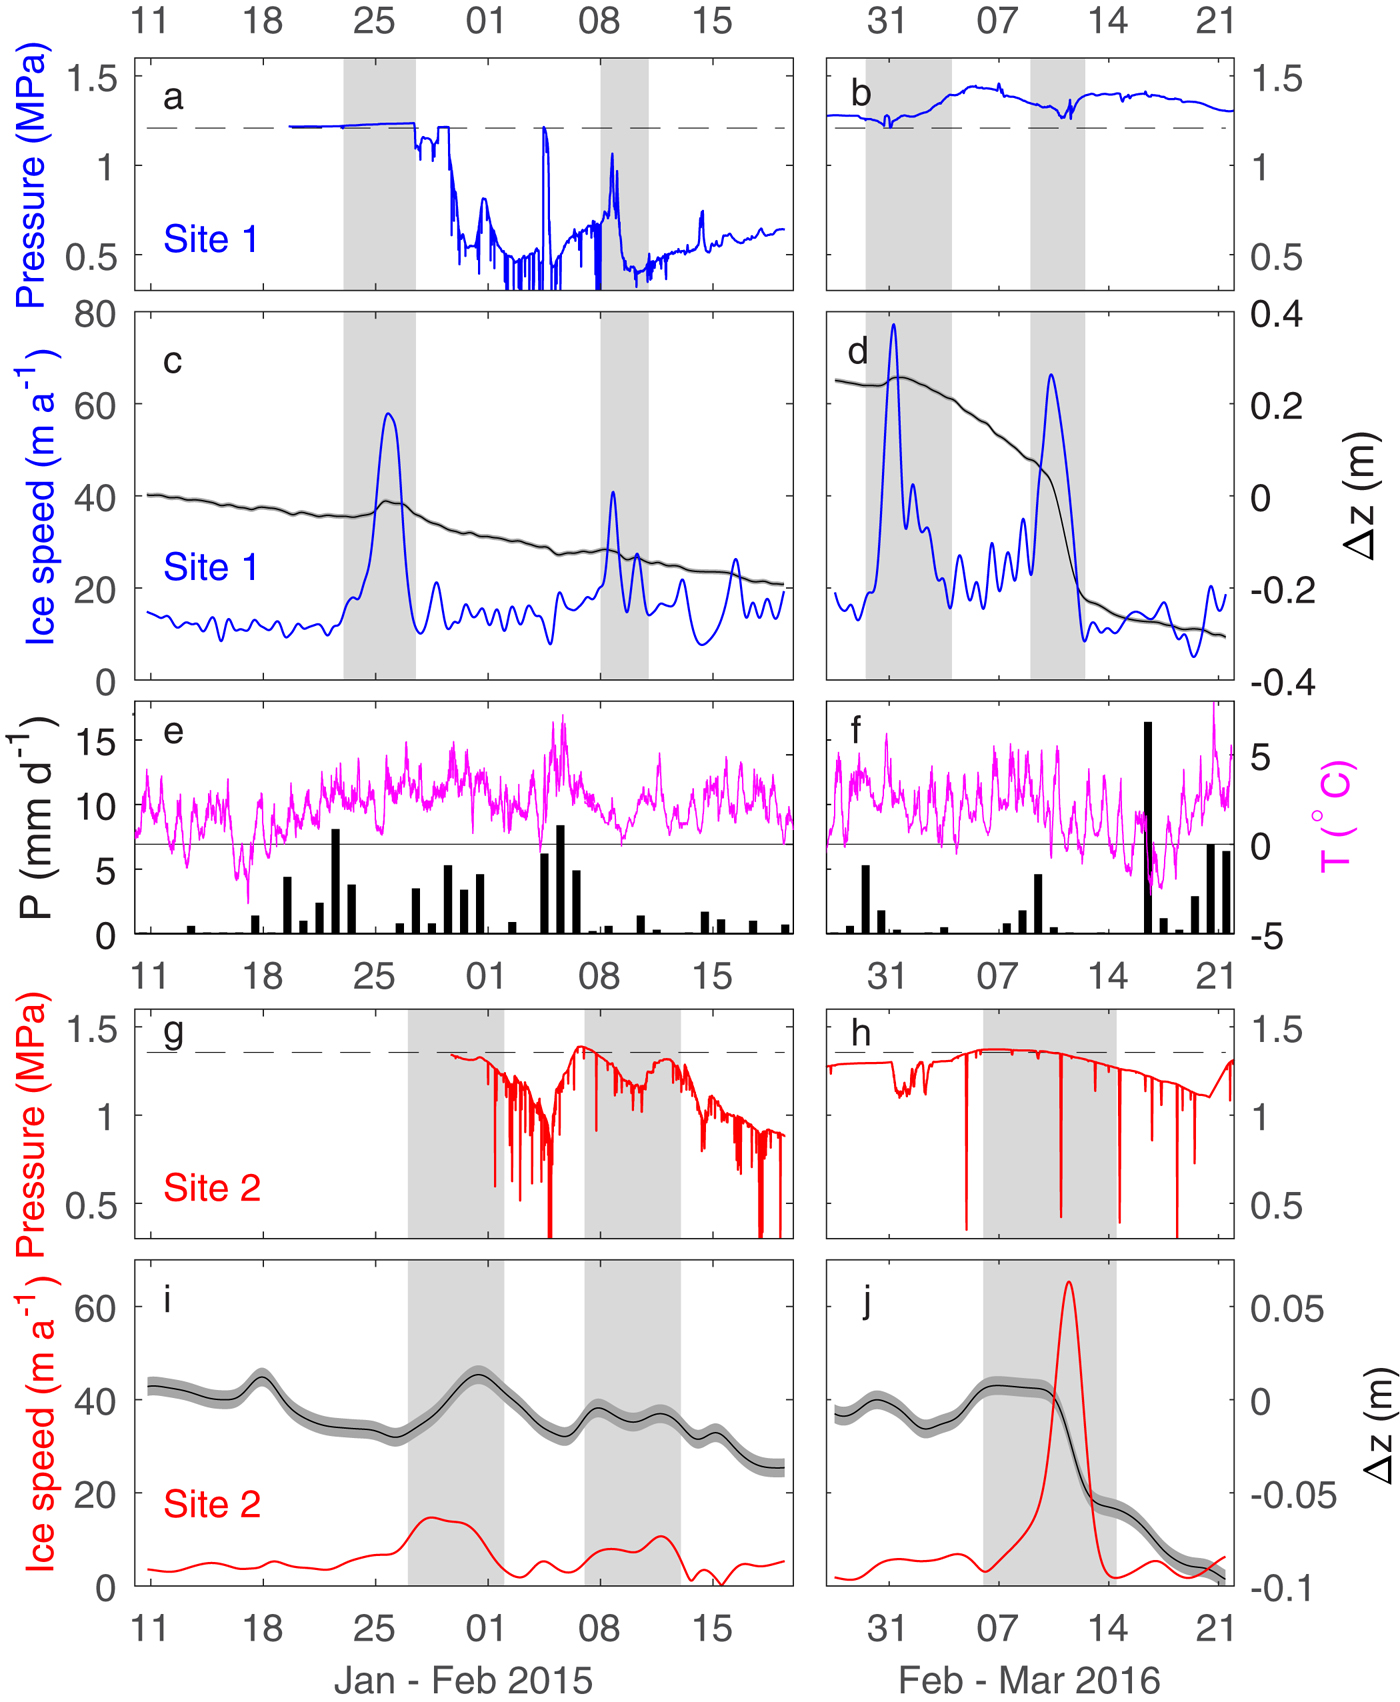
The borehole at Site 2 was filled with water until it drained on 28 January, 5 days after drilling. The pressure began fluctuating and varied over the GPS measurement period within a range 50–100% of the overburden level (Fig. 4g). In the 2016 observation period, the range of the variation was similar to that in 2015, but the pressure change was more gradual (Fig 4h).
4.2. Ice speed and vertical ice motion
Our GPS measurements showed short-term speed-up events during the summers of 2015 and 2016 (Fig. 4). The glacier accelerated to a speed several times greater than the long-term mean during the events, and each of the accelerations lasted for a few days. Several events were observed both at Site 1 and Site 2. In 2015, ice speed at Site 1 increased above the background level (<20 m a−1) on 23 January and reached a peak speed (~60 m a−1) on 25 January (Fig. 4c). A smaller acceleration was recorded at the same site from 8 to 10 February. At Site 2, fast flowing periods were observed twice in 2015, from 27 January to 1 February and from 7 to 12 February (Fig. 4i). The latter event coincided with the second speed-up at Site 1.
In 2016, speed at Site 1 rose above 60 m a−1 twice, on 31 January and 10 February (Fig. 4d). The second event was accompanied by a pronounced acceleration at Site 2 (Fig. 4j). This acceleration at Site 2 was much more substantial than those observed in 2015. The peak speed was >60 m a−1 and the duration of the event was about a week (Fig. 4j). The maximum speed occurred on 11 February, 1 day later than the peak speed at Site 1.
These speed-up events were associated with changes in the vertical ice motion. The ice surface moved generally downward during the observation period. However, GPS data showed surface uplift during the acceleration and enhanced downward motion during the latter half of the events. For example, the first event in 2015 at Site 1 (25 January) was accompanied by 40 mm uplift (Fig. 4c). A similar amount of uplift was observed also at the first event in 2016 (31 January) (Fig. 4d). These uplifts were followed by slower downward motions. The second event in 2016 (10–11 February) was characterized by a relatively large downward surface motion during the deceleration phase. The drops in surface elevation at Site 1 and Site 2 were ~200 and 50 mm, respectively (Figs 4d and j).
Ice speed at Site 1 showed diurnal variations. The most clear diurnal signals were obtained from 31 January to 8 February 2016, between the two speed-up events (Fig. 4d). Timing of the daily speed maxima is difficult to assess because of the smoothing applied to the GPS data, but the speed changes are correlated to the pronounced diurnal air temperature variations (Fig. 4f). Diurnal patterns are also observed in small fluctuations in 2015 from 30 January to 3 February and from 16 to 18 February (Fig. 4c).
4.3. Ice temperature
All the thermistors installed at Site 1 showed pressure melting temperatures within the accuracy of the measurement (Fig. 5a). At Site 2, temperatures were at the pressure melting point at the five lower thermistors, placed at 0, 25, 50, 75 and 100 m from the glacier bed (Fig. 5b). Only the two upper sensors, at 125 and 150 m from the bed (28 and 3 m from the glacier surface), showed temperatures below freezing. Temperatures at these thermistors were −0.23 and −0.11 °C, respectively.
Ice temperature measured in the boreholes at Site 1 (a) and Site 2 (b). Dashed lines indicate the pressure melting temperature of ice.

5. DISCUSSION
5.1 Water pressure variations
Variations observed in the subglacial water pressure confirmed that surface meltwater reaches the bed during the melt season and activates a basal drainage system. Surface meltwater drainage to the bed is also evident from the diurnal ice-speed variations. The existence of the drainage system was expected from studies on other glaciers in similar atmospheric and ice temperature conditions, for example, glaciers in Scandinavia and in the Arctic. This study confirms such a subglacial condition for the first time in the Antarctic Peninsula region. The pressure data recorded over the 2-year period are unique because a pressure sensor installed in a borehole often stops working within a year.
The water pressure variations beneath Johnsons Glacier can be categorized into two regimes. High-frequency variations with large amplitudes were observed during the summer melt period, whereas pressure was relatively uniform at a high level during the rest of the year. These two regimes are clearly distinguishable in the data from Site 2 and in the first-year data from Site 1 (Fig. 3b). This observation is consistent with year-round pressure measurements reported in a temperate glacier in Alaska (Fudge and others, Reference Fudge, Humphrey, Harper and Pfeffer2008), a polythermal glacier in Scandinavia (Jansson and Näslund, Reference Jansson and Näslund2009) and in the ablation area in western Greenland ice sheet (Wright and others, Reference Wright, Harper, Humphrey and Meierbachtol2016). High-frequency pressure variations typically began in January, about 1 month after the daily mean air temperature rose above 0 °C. It is likely that surface snow absorbs meltwater at the beginning of the melt period, which prevents input of surface meltwater to the bed. The water pressure variation ceased in April–May, which corresponded to the drop in the air temperature below 0 °C. This indicates that the subglacial hydraulic condition swiftly responded to the termination of surface melting.
After the melt season, water pressure at Site 2 occasionally dropped from the high-pressure level. For instance, a sudden pressure decrease by >1 MPa was observed in June 2016 (Fig. 3b). During this event, pressure began a gradual decrease on 2 June in the afternoon, reaching the minimum value after ~30 h and returned to the pre-event level on 4 June around noon. The event lasted for more than 2 days and the pressure change was smooth, thus it was not likely due to a device failure. A plausible interpretation of the pressure drop is a gradual connection of the borehole to a low-pressure hydraulic system. The high-pressure condition was restored after a few days, suggesting that the system recovered from the effect of the connection, or the borehole was disconnected from the low-pressure system. Similar short duration changes in water pressure were observed in other glaciers, and they were considered as a result of the adjustment of subglacial hydrological system to glacier motion (Jansson and Näslund, Reference Jansson and Näslund2009; Kavanough, Reference Kavanough2009; Meierbachtol and others, Reference Meierbachtol, Harper and Humphrey2018).
Pressure fluctuations were small at Site 1 during the summers in 2015/16 and 2016/17 (Fig. 3b). We assume that connection of the borehole with a major hydrological system was not re-established after the melt season ended in May 2015. Although the amplitudes were smaller than those at Site 2, pressure at Site 1 showed clear variations from January to April in 2016 and 2017. These pressure variations at Site 1 were probably affected by connection/disconnection of the borehole to a drainage channel under the influence of basal ice motion. Hydraulic connection of the boreholes to a subglacial drainage system is discussed with the GPS data in the following subsection.
5.2. Ice-speed variations
The GPS data showed speed-up events during the two summer melt seasons (Fig. 4). This observation is consistent with the seasonal speed variations observed by satellite remote sensing (Osmanoğlu and others, Reference Osmanoğlu, Navarro, Hock, Braun and Corcuera2014). As suggested by the summer speed-up observed on Johnsons and other glaciers on Livingston Island, surface meltwater and rainwater penetrate to the glacier bed and affect basal water pressure. The speed-up events had a substantial influence on the total ice motion during the observation periods. Mean horizontal ice speed during the 2015 and 2016 field measurements were 16.4 and 23.9 m a−1 at Site 1 and 5.1 and 9.7 m a−1 at Site 2, respectively. The mean speed at Site 1 was 45% greater in 2016, being influenced by the two speed-up events during the measurement period (Fig. 4d). The mean speed at Site 2 was nearly twice as great in 2016, which was due to the large acceleration that peaked on 11 February (Fig. 4j). At Site 2, ice motion from 7 to 14 February accounted for ~70% of the total displacement over the measurement period from 27 January to 21 February. Therefore, glacier motion in the region of study is greatly affected by the frequency and magnitude of speed-up events, which is related to atmospheric conditions.
Influence of surface meltwater production on glacier motion is evident from the diurnal speed variations observed at Site 1. Clear diurnal signals were obtained from 31 January to 8 February 2016, between the two speed-up events (Fig. 4d). Timing of the daily speed maxima is difficult to assess because of the smoothing applied to the GPS data, but the speed changes are correlated with the pronounced diurnal air temperature variations (Fig. 4f). GPS data also showed glacier surface uplift during the first event and subsidence after the second event (Fig. 4d), suggesting separation of the glacier from the bed due to water pressure elevating to the overburden level (Iken and Bindschadler, Reference Iken and Bindschadler1986; Hooke and others, Reference Hooke, Calla, Holmlund, Nilsson and Stroeven1989; Sugiyama and Gudmundsson, Reference Sugiyama and Gudmundsson2004). Basal sliding speed is sensitive to meltwater input under such a high-pressure condition (Iken and Bindschadler, Reference Iken and Bindschadler1986; Jansson, Reference Jansson1995; Iken and Truffer, Reference Iken and Truffer1997; Sugiyama and Gudmundsson, Reference Sugiyama and Gudmundsson2004; Sugiyama and others, Reference Sugiyama2011), thus clear diurnal speed variations were generated. Surface uplift was observed during other speed-up events, implying the critical influence of elevated subglacial water pressure on ice dynamics.
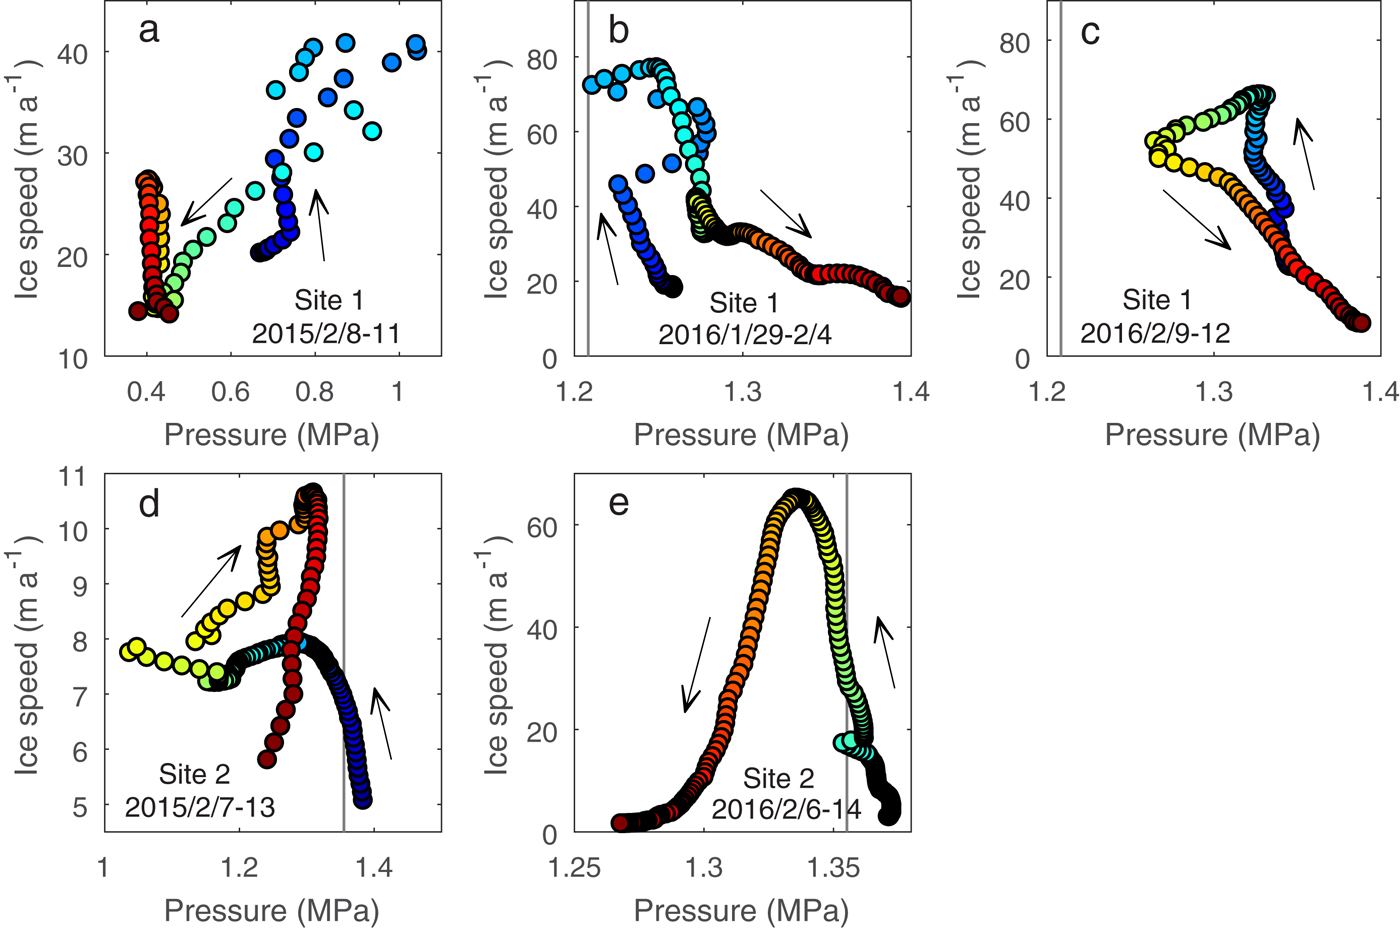
The influence of the subglacial hydraulic condition on ice dynamics is evident, but a relationship between ice speed and borehole pressure data is not clear. At Site 1, during the second event in 2015, the acceleration on 8 February coincided with a sharp increase in water pressure up to ~90% of the overburden level (Figs 4a and c). Ice speed and pressure showed a positive correlation during this period (Fig. 6a). With the exception of this event, none of the accelerations showed a positive correlation with the subglacial water pressure. Rather, ice speed at Site 1 was negatively correlated to pressure during the two speed-up events in 2016 (Figs 6b and c). The speed–pressure relationships are more complex at Site 2. The water pressure was elevated to the overburden level during the speed-up events in 2015 and 2016, but ice accelerated/decelerated irrespective of pressure variations (Figs 6d and e).
Scatter plots showing relationships between ice speed and subglacial water pressure at Site 1 (a–c) and Site 2 (d and e). Hourly speed and pressure data are presented (a) from 8 to 11 February 2015, (b) from 29 January to 4 February 2016, (c) from 9 to 12 February 2016, (d) from 7 to 13 February 2015 and (e) from 6 to 14 February 2016. Progress of time is shown by cold to warm colour gradation. The vertical lines in (b)–(e) indicate the overburden pressure.
It is common to observe no clear relationship between ice speed and borehole water pressure. This is because local pressure measured in a borehole does not necessarily represent a spatially averaged subglacial water pressure and also because ice speed is not a simple function of pressure. The subglacial drainage system is commonly categorized into two regimes: an inefficient channelized cavity system, and an efficient conduit system (e.g. Röthlisberger, Reference Röthlisberger1972; Kamb, Reference Kamb1987). These systems can coexist and evolve from one to the other, thus the subglacial hydraulic condition is spatially and temporally variable. Inhomogeneous hydraulic conditions are expected also for the bed consisting of a permeable sediment layer (e.g. Flowers, Reference Flowers2015). Even when a borehole is connected to an efficient system, the phase and amplitude of pressure variations may be dependent on the distance to the conduit and the hydraulic connectivity of the system (e.g. Hubbard and others, Reference Hubbard, Sharp, Willis, Nielsen and Smart1995; Fudge and others, Reference Fudge, Humphrey, Harper and Pfeffer2008). Moreover, several different mechanisms are proposed for fast basal ice motion, and high subglacial water pressure is not a prerequisite for fast flow (e.g. Blake and others, Reference Blake, Fischer and Clarke1994; Harper and others, Reference Harper, Humphrey, Pfeffer and Lazar2007). A possible interpretation of the anticorrelation between ice speed and pressure at Site 1 is the connection of the borehole to a drainage system caused by fast basal sliding. During the summer observation period in 2016, subglacial pressure at Site 1 was above the overburden level, except for a drop during the speed-up events (Figs 4b and d). The dropped pressure is close to the overburden level, suggesting a connection of the borehole to a highly pressurized ambient hydraulic system. At Site 2, the large acceleration in 2016 occurred several days after the pressure increased close to the overburden level (Figs 4h and j). The high-water pressure was accompanied by surface uplift, suggesting the speed-up was driven by basal separation or cavity opening. The slight pressure decrease during the acceleration is similar to the spring speed-up event observed in Bench Glacier in Alaska, which was attributed to subglacial cavity opening (Harper and others, Reference Harper, Humphrey, Pfeffer and Lazar2007). Given the available data, it is difficult to draw concrete interpretations for each of the ice speed and pressure variations. Nevertheless, changing subglacial hydraulic conditions should have played a key role in the observed short-term ice-speed changes.
5.3. Ice temperature
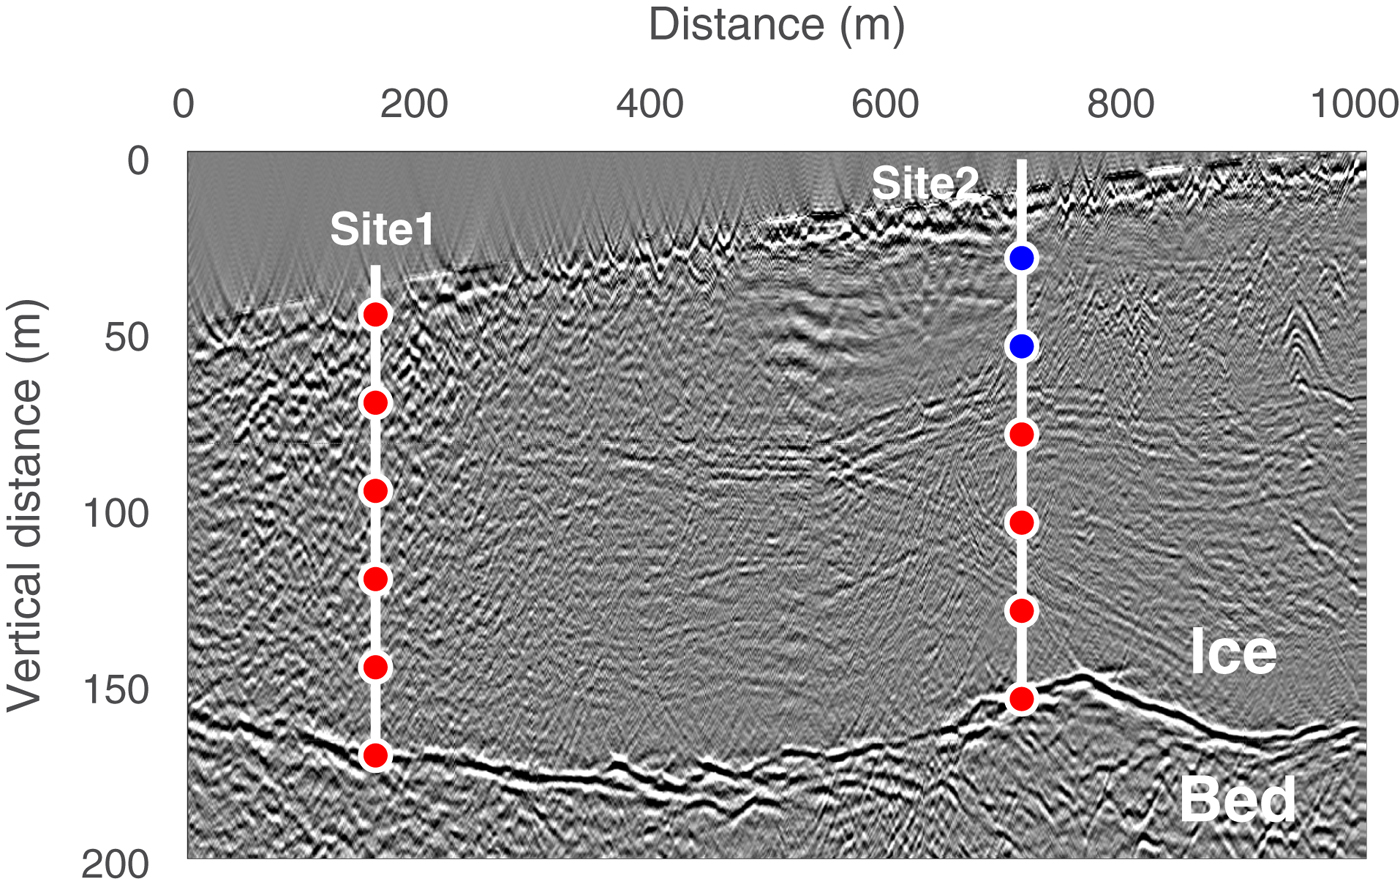
Glaciers and ice caps on Livingston Island used to be considered temperate. However, radar echo soundings, as well as geomorphological features (Navarro and others, Reference Navarro2009) suggested the existence of cold ice in the ablation area of Hurd Glacier. Our ice temperature data provide evidence of polythermal structure of Johnsons Glacier. Ice near the surface is cold at Site 2, whereas ~700 m down-glacier at Site 1, the ice is temperate through the entire depth (Fig. 5). In an ice-radar diagram (Fig. 7), the location of the cold ice layer coincides with a zone of little diffraction. The radargram along the drilling sites shows such a zone near the glacier surface, suggesting that a ~50 m thick and ~200 m long cold layer extends down-glacier from Site 2.
Locations of the thermistors in the boreholes. Colour of the markers indicates whether ice was at pressure melting (red) or freezing (blue). The background is an ice-radar diagram showing the diffraction of radar waves within the glacier.
The presence of cold ice near the surface in the ablation area is consistent with Hurd Glacier (Navarro and others, Reference Navarro2009). Similar thermal structures are observed in polythermal glaciers in Scandinavia and Svalbard (e.g. Blatter and Hutter, Reference Blatter and Hutter1991). Ice is temperate in the accumulation area of these glaciers, because meltwater percolates, refreezes and releases latent heat in a firn layer. A near-surface cold ice layer forms in the ablation area, where the heating due to refreezing is insignificant and winter cold temperature penetrates deeper through a thinner layer of snow (e.g. Pettersson and others, Reference Pettersson, Jansson, Huwald and Blatter2007). The temperature and extent of the cold layer are influenced by various parameters, including atmospheric temperature, ice velocity field, surface accumulation and ablation. No statistically significant trend is observed in the annual mean air temperatures at JCI from 2005 to 2016 (between −2.63 and −0.90 °C, with a mean over the 12 years of −1.67 °C). Nevertheless, snow accumulation is increasing on Livingston Island as a result of a greater amount of solid precipitation and colder summer temperatures (Navarro and others, Reference Navarro, Jonsell, Corcuera and Martín-Español2013). Presence of surface snow in the low elevation area has the potential to raise the temperature of the cold ice layer. Changes in the thermal structure under the climatic forcing are of critical importance in glacier hydrology (e.g. Irvine-Fynn and others, Reference Irvine-Fynn, Hodson, Moorman, Vatne and Hubbard2011) and would greatly impact glacier dynamics, as revealed in this study.
6. CONCLUSIONS
To investigate basal and englacial conditions of glaciers in the Antarctic Peninsula region, we performed hot-water drilling on Johnsons Glacier on Livingston Island. Boreholes were drilled at 500 and 1200 m from the glacier front, and subglacial water pressure and ice temperature were measured in the boreholes from January 2015 to March 2017. Short-term ice-speed variations were measured by operating GPS stations at the borehole sites for two summer seasons in 2015 and 2016. Measurement results were analyzed to investigate short-term and seasonal variations in the subglacial water pressure and glacier dynamics.
Subglacial water pressure showed seasonal and short-term variations. During the summer melt seasons, typically from January to April, water pressure showed high-frequency variations (days–weeks) below the overburden pressure. This observation confirmed the drainage of surface melt and rain water to an active subglacial hydrological system. Pressure increased soon after air temperature dropped below freezing, and then remained near the overburden level during the rest of the year. During the quiescent period, we observed short episodes of sudden pressure drop and recovery within a few days, which we attribute to a reorganization of the subglacial hydraulic system.
Ice flow speed also indicated short-term variations and speed-up events during the melt seasons. During the fast flow events, ice speed increased to several times greater than the background level and such events substantially contributed to glacier motion. For instance, at the upper GPS station (Site 2), ice displacement from 7 to 14 February 2016 accounted for ~70% of the total motion from 27 January to 21 February. No clear correlation was obtained between the ice speed and subglacial water pressure. Presumably, hydraulic conditions under Johnsons Glacier are highly inhomogeneous, and thus are not properly represented by the borehole pressure data. Ice temperature measurements in the boreholes indicated polythermal structure, suggesting that the subglacial hydraulic conditions are affected by a complex englacial hydrology.
Our measurements revealed subglacial hydraulics and its link to glacier motion, which were previously unexplored in the Antarctic Peninsula region. The data demonstrated temporal variabilities in subglacial water pressure and their influence on ice speed during a melt season. Rapidly changing climatic conditions in the Antarctic Peninsula have the potential to impact subglacial conditions and glacier dynamics in the region.
ACKNOWLEDGEMENT
Field activity was supported by the Juan Carlos I Station on Livingston Island. We thank the members of the field campaigns from 2014/15 to 2016/17. Thanks are also to two anonymous reviewers for providing helpful comments, and the Scientific Editor B. Kulessa for handling the paper. English text was corrected by A. Kidder. This study, Project CTM2014-56473-R was funded by the Spanish Polar Programme, and by Grants-in-Aid for Scientific Research (26550001, 16H05734 and 17H06320) from the Japan Society for the Promotion of Science.


 Open access