


Introduction
The aims of this research are to resurrect long-forgotten knowledge about the relationship between tuberculosis and diphtheria and to support it with statistical analysis of historical data. This research began with an exploration of co-infections and associations between common infectious diseases in the early 20th century using historical US public health records. Among other findings, the analysis turned up a possible but unexpected correlation between tuberculosis and diphtheria. This was investigated subsequently in historical medical reports, as described below, revealing that, indeed, such a relationship was known to medicine in the last decades of the 19th century and first years of the 20th century. But knowledge of this seems to have waned as vaccination reduced the incidence of diphtheria. The historical relationship between diphtheria and tuberculosis is tested with modern statistical methods that were unavailable in that era. The statistical analysis focuses on the relationship between the two diseases in five American cities in the early 20th century using weekly public health reports over a period of several years.
Medical authorities of the past did not have an explanation for the connection between tuberculosis and diphtheria, and this holds true today. Alternative explanations for the association are discussed here with a focus on how the two diseases assimilate iron in the body. Tuberculosis and diphtheria have a close phylogenetic relationship in the Actinobacteria phylum, order Corynebacteriales. As such, they share important commonalities in their cell biology and, specifically, in their iron-dependent repressor genes that uniquely control the assimilation of iron in both diseases.
Method of analysis
Historical review
The historical relationship between tuberculosis and diphtheria was investigated by an online search of historical medical texts, primarily from the late 19th century and early 20th century. At that time both diseases were still very common and deadly. In the 1880s, the diphtheria bacterium had been identified by Klebs and Loeffler and the tuberculosis bacterium by Koch. The literature search was done in English, German and French through Google, Google Scholar and Google Book Search beginning in the 1880s. Search terms were used to find medical accounts that referred to close or timely associations between the two diseases, such as, ‘with’, ‘in connection with’, ‘after’, ‘secondary infection’ and ‘mixed infection (Mischinfektion).’
A search of contemporary medical reports did not find any references to a causal or correlational association between the two diseases, but records from the late 19th century tell a different story. Among German reports, an 1885 publication describes co-infections of diphtheria and tuberculosis among children with tuberculosis of bones and joints [Reference Winter1]. Diphtheria affected about 10% of such cases. A report from 1899 relates how tuberculosis can follow diphtheria and that diphtheria can infect persons with long-term tuberculosis infections [Reference Duerck, Oberndorfer, Lubarsch and Ostertag2]. The author writes that of 459 persons who died of diphtheria over an 8-year period 95 (21%) had tuberculosis. Moreover, in 37% of long-term tuberculosis cases, there was a new eruption of tuberculosis with diphtheria and almost one-third of children who had previously had tuberculosis got a new outbreak when infected with diphtheria. Additional research shows tuberculosis often appearing after diphtheria, or diphtheria occurring when there was primary tuberculosis of the intestines [Reference Heller and Spatz3]. The author reports that of 714 sections taken from diphtheria patients who died between 1873 and 1894, tuberculosis was found 140 times (20%) in various organs.
A French study in 1894 on the relationship between tuberculosis and diphtheria discusses these as family diseases, as they often occurred together in the same family [Reference Revilliod and Masson4]. The author asserts that neither directly causes the other, but each creates ‘favourable ground’ for the other. A French analysis of children dying of diphtheria finds 41% with latent tuberculosis; and diphtheria is aggravated by tuberculosis, while diphtheria also wakes up latent tuberculosis [Reference Barbikr and Bouchard5]. Similarly, an 1896 study of 150 children with diphtheria in St. Petersburg reports that 39 (26%) had tuberculosis, affecting various organs [Reference Broido and Bouchard6]. The author concludes that the presence of tuberculosis predisposes to diphtheria, diminishes resistance and worsens prognosis.
Statistical analysis
As the historical review from about 1880 to 1902 reveals, at least 20% of diphtheria cases and possibly more involved co-infections with tuberculosis. The task of statistical analysis is to try to detect and estimate this association. Both tuberculosis and diphtheria are highly infectious airborne diseases. After infection, however, their pathogenesis and progression are very different. Tuberculosis was an endemic disease historically, while diphtheria had annual cycles. Tuberculosis is slow to develop and a person can have either an active case or a latent case, which can become active after a long delay. It affects lungs but also body organs and bones. Diphtheria has a short incubation period before it becomes fully established and it mainly attacks the throat and tonsils. The damage from diphtheria throughout the body is caused by a toxin produced by a virus that has infected the bacterial DNA. The diseases have two aspects in common than can contribute to co-infections: both often attack children at young ages and people can be asymptomatic carriers of either disease. These factors also foster the spread of infection within families.
This analysis relies on cases of diphtheria and tuberculosis reported to public health authorities in five American cities in the early 20th century. These include the four largest American cities of the time – New York City, Chicago, Philadelphia and Detroit – and Boston. These data are available from Project Tycho at the University of Pittsburgh [7]. This database was used previously to study the historical associations between measles and pertussis [Reference Coleman8] and between varicella and scarlet fever [Reference Coleman9]. Cases were reported on a weekly basis. Data on diphtheria extend from about 1916 to 1947 for most cities (from 1915 in Detroit) and is fairly complete back to 1907 in Philadelphia. Tuberculosis data runs from about 1906 to 1923. So the analysis for each city is based on the years when data on both diseases was available. An unresolved question is how cases might have been reported when both diphtheria and tuberculosis might have been involved. There is no designation for co-infections in the data. As with aggregate data generally, it is not possible to determine how often an association between the two diseases might involve the same person, the same person at different times, or whether it may represent an association at the family or community level. Note also that there is an inherent delay between the time a disease is diagnosed and when it appears in a public health report.
The relationship between diphtheria and tuberculosis is estimated with an ordinary least squares (OLS) regression model of weekly diphtheria reports for each city over the entire span of years with data. Diphtheria cases are considered the dependent variable, as it is more likely that among individuals tuberculosis preceded a diphtheria infection, although there may be a reciprocal effect.
Independent variables in the model include weekly tuberculosis reports and terms that can model the annual cyclic trend in weekly diphtheria cases as well as yearly changes in diphtheria cases. Because the number of diphtheria cases varies during the year, usually being highest in the winter and lowest in late summer, the regression model includes polynomial terms to the fourth degree as a function of week to model the annual cycle. (Higher order polynomial terms were not statistically significant.) Sometimes a sinusoidal model is used to estimate diseases with annual cycles, but it is not the best approach here. The peaks in the diphtheria cycles are too steep for a sinusoidal model and the number of diphtheria cases varies substantially from year to year. (There are no weeks with zero diphtheria cases, which might otherwise be a problem for the regression model.) Because of the strong yearly variation in diphtheria rates, dummy variables are included in the model to account for annual changes.
The weekly diphtheria data have a strong autocorrelation across time, which can cause problems for a regression analysis. The estimated coefficient for tuberculosis in the regression model is not affected, but the estimate of the standard error in the coefficient is likely to be underestimated, making the results more certain then deserved. To avoid this problem, OLS analysis was done using Gretl, an econometric software package that estimates a robust standard error, correcting any estimation problems caused by heteroskedasticity and autocorrelation [Reference Cottrell and Lucchetti10].
Because of a large number of coefficients in the model, only the coefficient for tuberculosis is reported along with summary information about the model. The estimated model for weekly diphtheria and tuberculosis case data is
 $$\eqalign{{\rm Diphtheria}\,{\rm cases} =\,& {\rm constant} + b_1\,{\rm t}{\rm uberculosis}\,{\rm cases} + b_2\,{\rm week} \cr &+ b_3\,{\rm wee}{\rm k}^2 + b_4\,{\rm wee}{\rm k}^3 + \,b_5\,{\rm wee}{\rm k}^4 \cr & + {\rm dummy}\,{\rm variables}\,{\rm for}\,{\rm each}\,{\rm year}\,(0\,\,{\rm or}\,\,1)} $$
Results
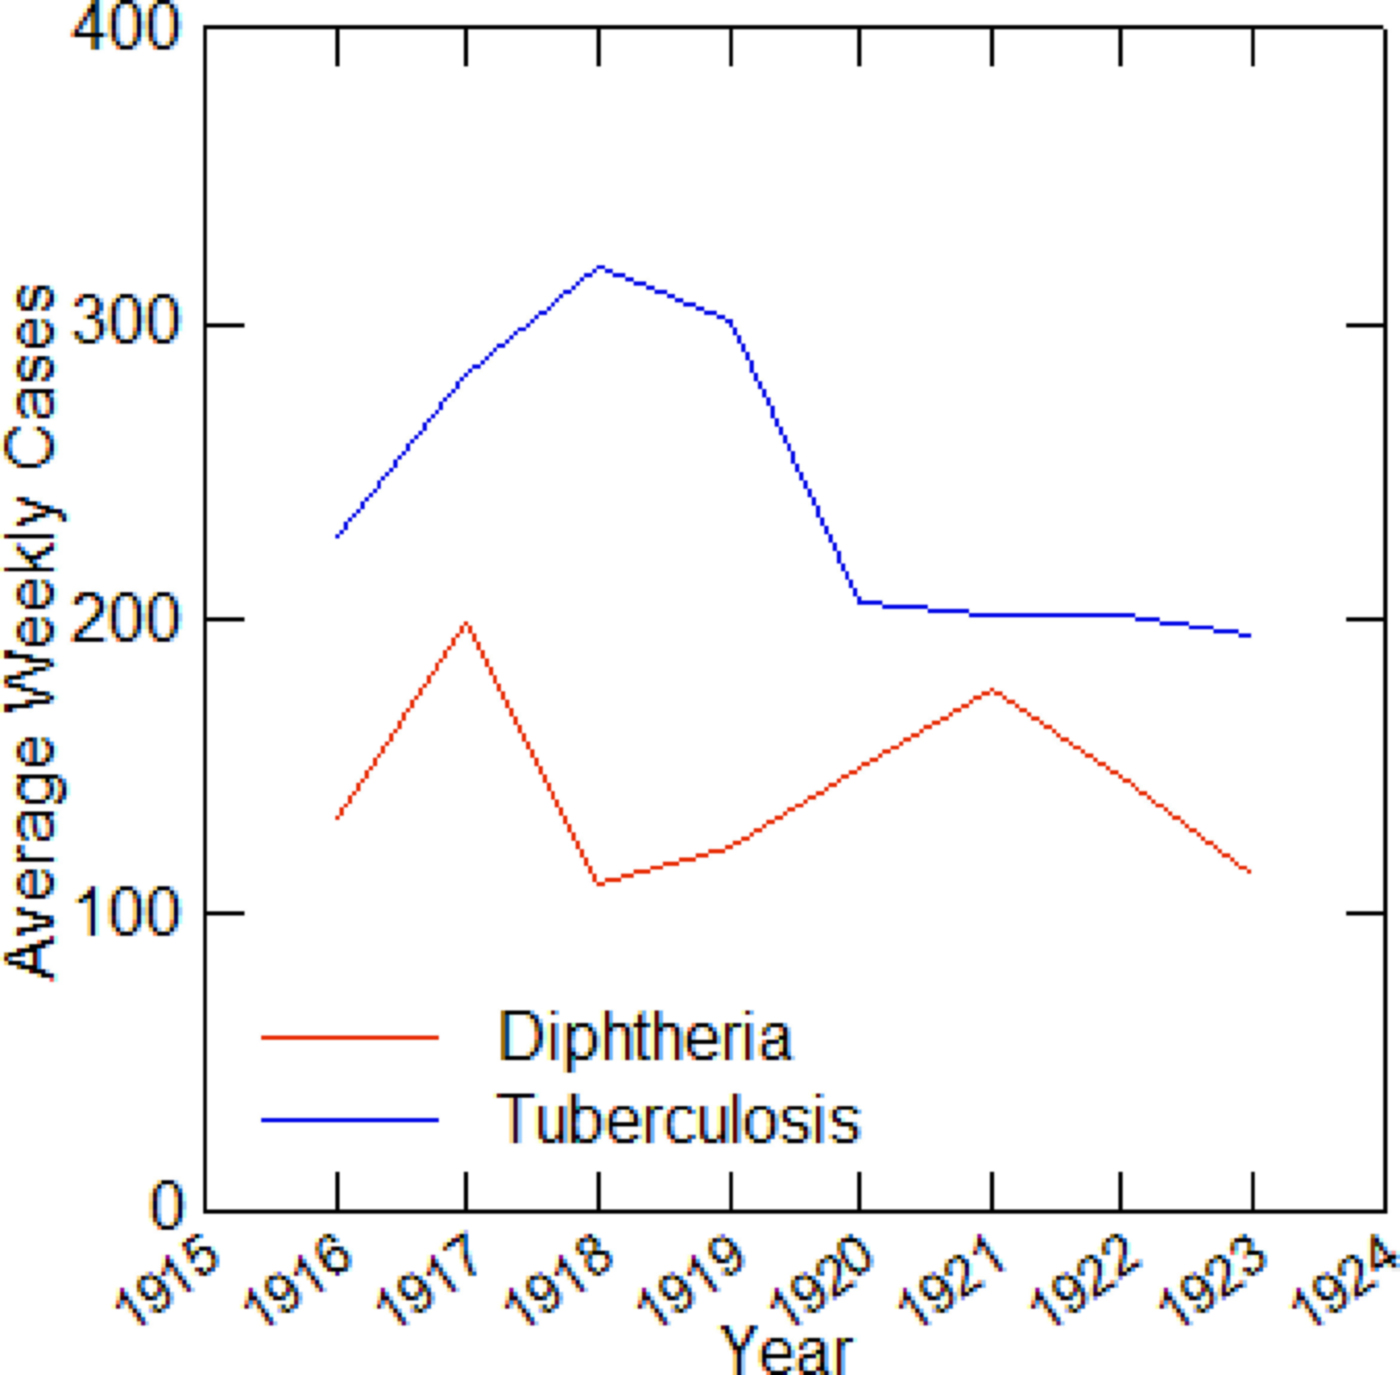
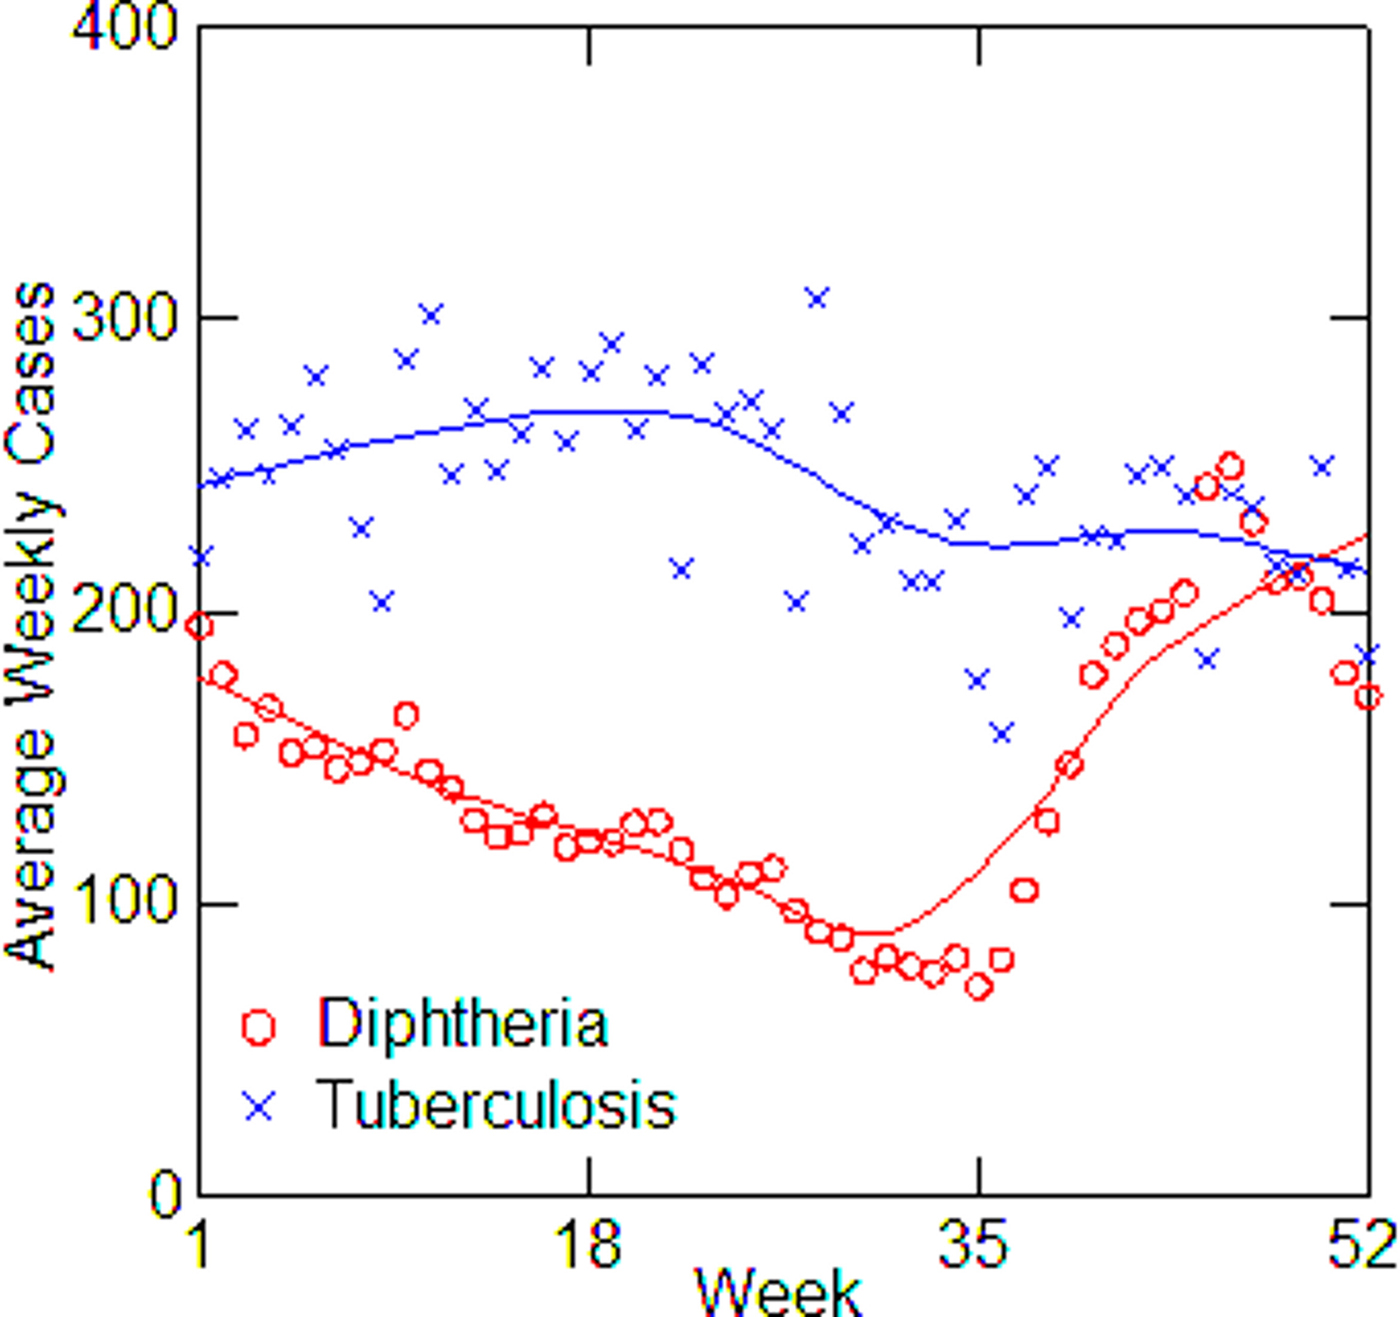
The five cities vary from year to year in the number of tuberculosis and diphtheria cases, as well as in weekly totals. Data on total reported cases for each city in each year from 1916 to 1923 (from 1915 for Detroit) are in Tables 1–5. Chicago (Fig. 1) shows a typical pattern across years, with tuberculosis cases exceeding diphtheria. But tuberculosis rates were, in general, declining in the last few years of data. This yearly pattern is similar to the other cities except for Boston where diphtheria cases exceeded tuberculosis in some years. The reasons for such variations over time and across cities are unknown. The trend in weekly cases within a year, averaging across all the years, is illustrated in Figure 2 for Chicago. As mentioned above, diphtheria had a strong annual cycle peaking in the winter, while tuberculosis cases were relatively steady from week to week but increased slightly in the first half of the year.
Average weekly diphtheria and tuberculosis cases for each year in Chicago, 1916–1923.
Average diphtheria and tuberculosis cases for each week of the year in Chicago, averaging over all years from 1916 to 1923, with LOWESS smoothing.
Boston, TB and diphtheria cases by year, 1916–1923
Chicago, TB and diphtheria cases by year, 1916–1923
Detroit, TB and diphtheria cases by year, 1915–1923
New York City, TB and diphtheria cases by year, 1916–1923
Philadelphia, TB and diphtheria cases, 1916–1923
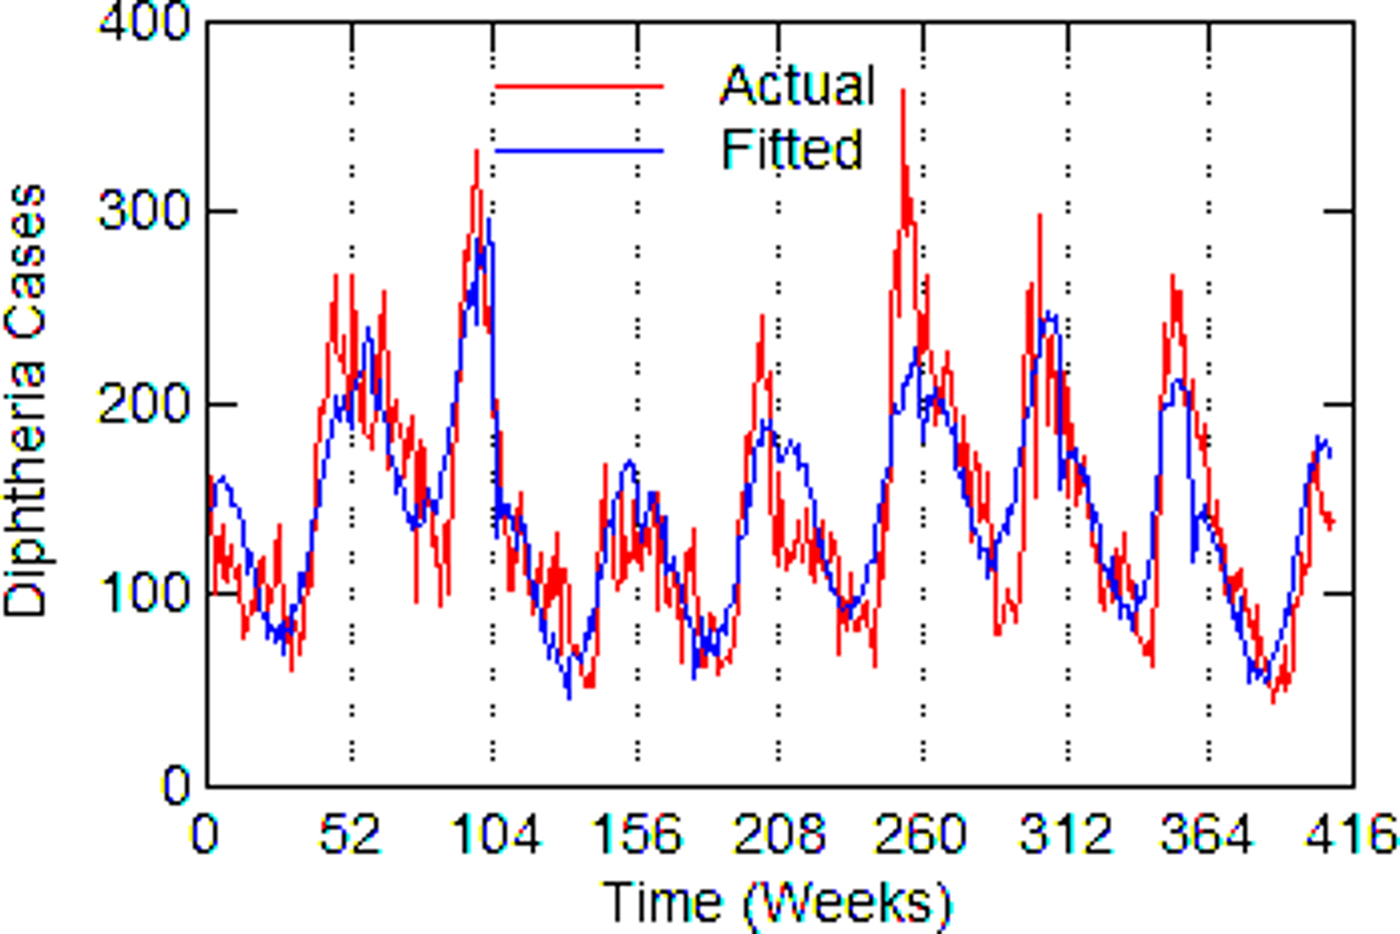
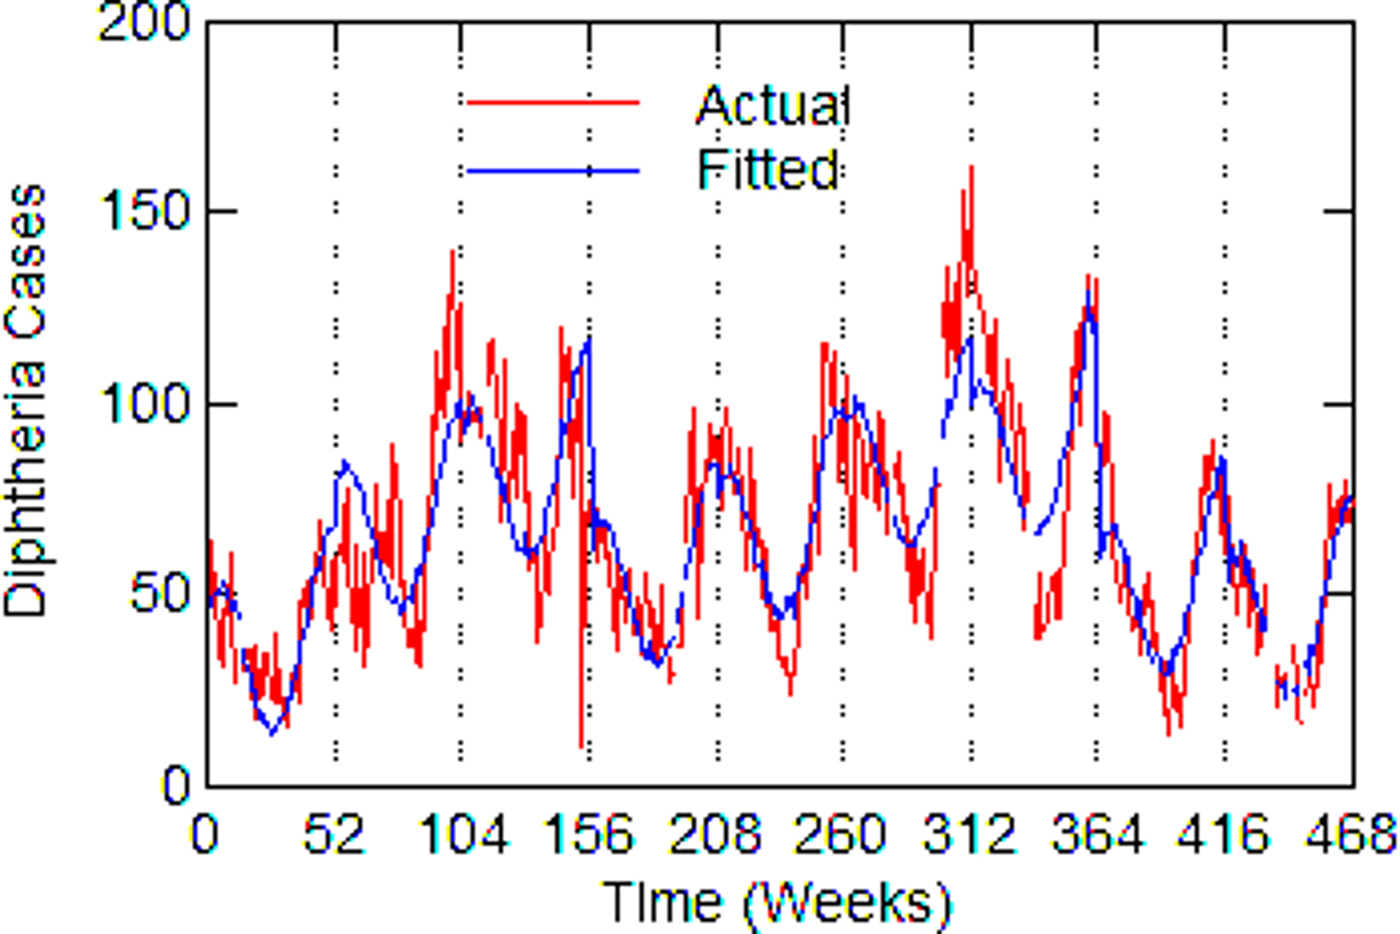
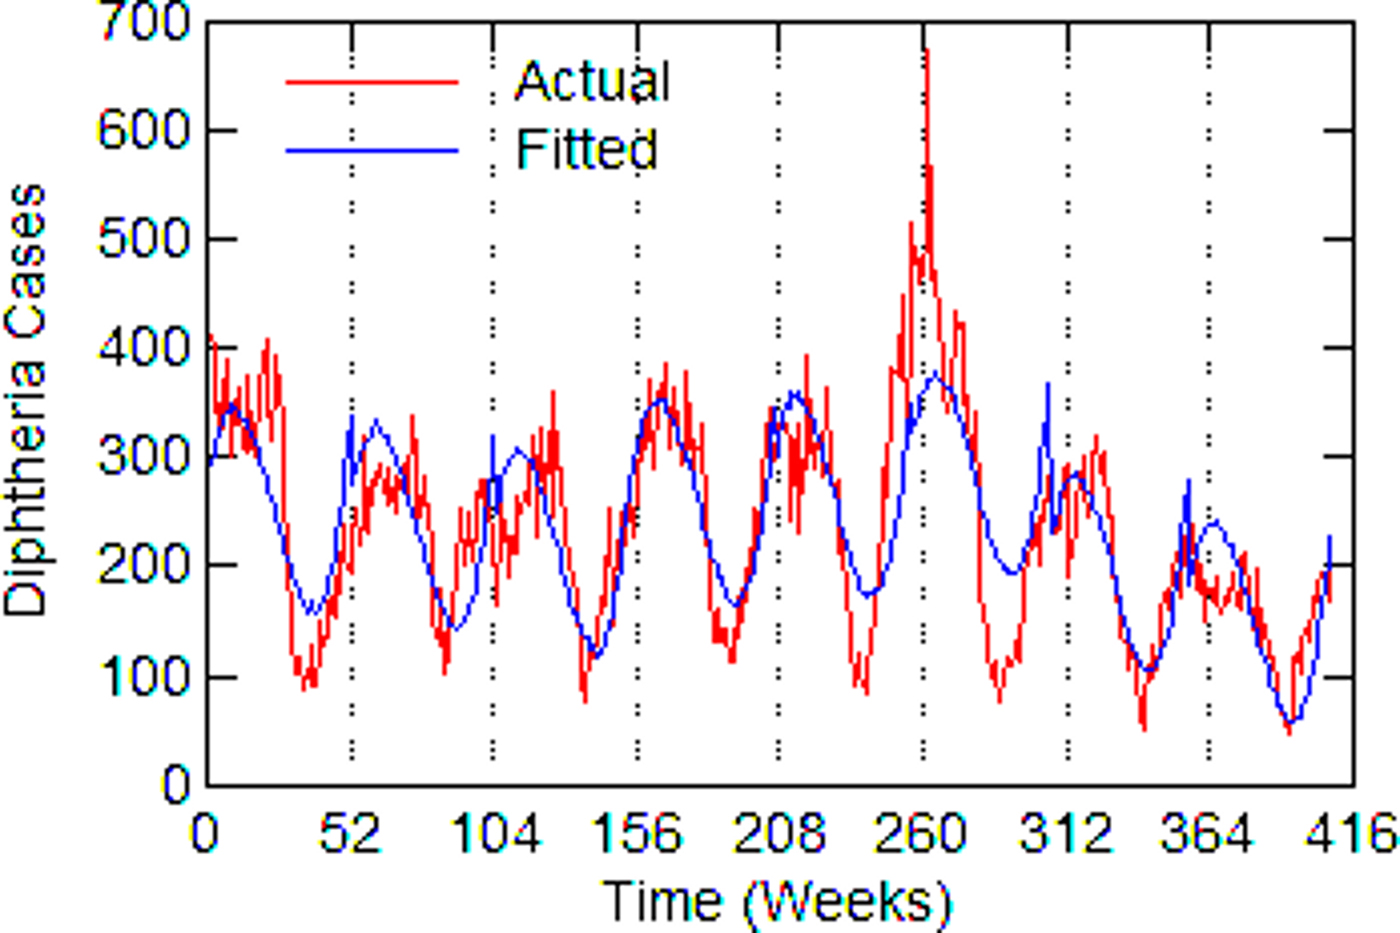
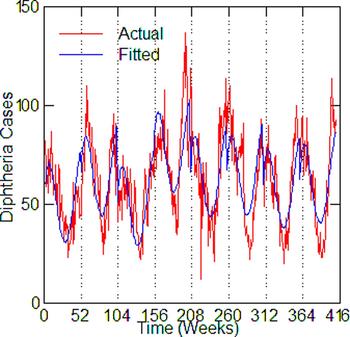
Regression models for each city have about the same strength of fit as measured by R 2 (Table 6), ranging from 0.51 in Boston to 0.68 in Detroit. Figures 3–7 show the estimated model plotted against the actual weekly diphtheria values for each city from 1916 to 1923 (from 1915 for Detroit). Most of the explained variation is accounted for by the polynomial and dummy terms, which capture the strong annual and weekly changes in diphtheria. Further analysis also showed that there was a large diphtheria epidemic in New York in 1921 continuing into early 1922, which made the model less successful. In fact, 1921 had the highest number of recorded diphtheria cases in American history for the country as a whole. So New York was re-estimated without 1921 data; both results are in Table 6. The coefficient for tuberculosis is statistically significant in all the cities, with 1921 excluded in New York. Given the standard errors, estimates of the tuberculosis coefficient are most accurate in Boston, Chicago and Detroit, where it varies from 0.11 to 0.14 – a very narrow range; the difference among these values is not statistically significant. The Chicago estimate at 0.11 is likely the most accurate. Further inspection of the graphs shows that the timing of the annual peaks of diphtheria cases in Philadelphia and especially, in New York City (Fig. 6) are more irregular, less seasonal, than in the other cities. The reason for this is unknown, but it likely makes it harder to detect a consistent relationship between diphtheria and tuberculosis.
Boston, actual and fitted (estimated) diphtheria cases by a week from 1916 to 1923.
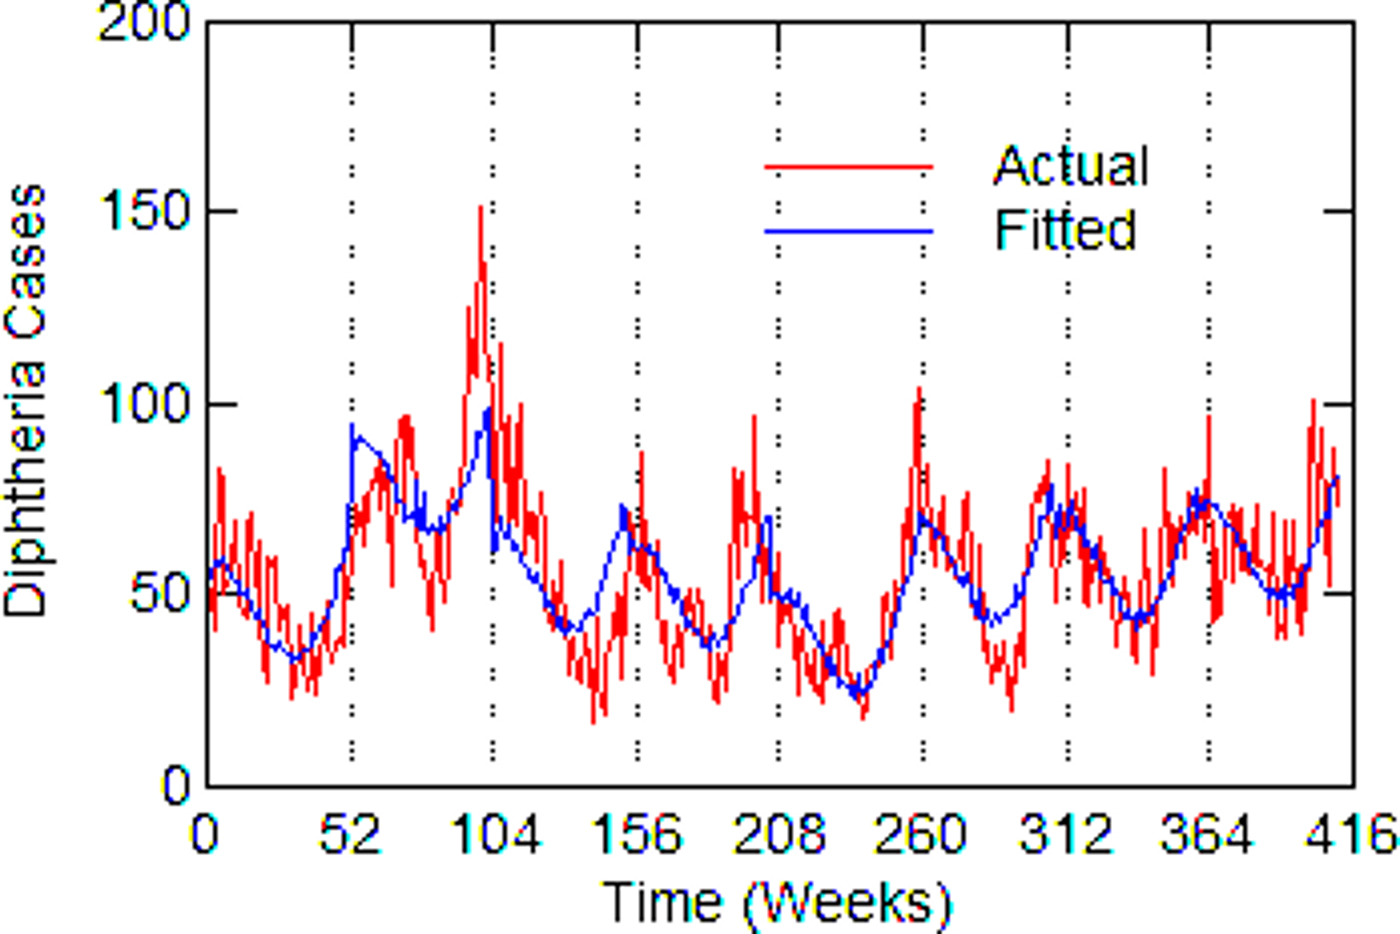
Chicago, actual and fitted (estimated) diphtheria cases by a week from 1916 to 1923.
Detroit, actual and fitted (estimated) diphtheria cases by a week from 1915 to 1923.
New York City, actual and fitted (estimated) diphtheria cases by a week from 1916 to 1923.
Philadelphia, actual and fitted (estimated) diphtheria cases by a week from 1916 to 1923.
Estimated regression coefficient for tuberculosis in the diphtheria time-series model; polynomial and dummy variable coefficients not reported
With Chicago as the best case estimate, one can work out roughly how many diphtheria cases might have been associated with tuberculosis. In 1920, in the middle of the time series, after any influence or the First World War and the influenza epidemic of 1918/1919, there were 10 684 reported tuberculosis cases. For a coefficient value of 0.11 with 95% CI (0.05–0.17), this would mean that about 1175 (534–1816) diphtheria cases or 15% (7–23%) of the total 7741 diphtheria cases had involved tuberculosis that year. This percentage is similar to rates of association reported in the historical literature.
Discussion
The statistical analysis supports the historical reports within the inherent limitations of aggregate data analysis, which is that one does not know how strongly the findings apply at the individual level. But it is the best one can do with historical public health data. In any case, the results of both the historical review and statistical analysis call on us to consider possible explanations for a connection between tuberculosis and diphtheria. The medical literature does not offer an immediate answer for this.
Several alternative explanations come to mind. First is the fact that both diseases are fostered by poverty, malnourishment and overcrowding. These factors may explain differences between cities or how incidence in a city may change over a long time-period, but these factors are unlikely to affect short-term or week-to-week variation in disease incidence. Another possibility is the spread of disease by contaminated milk before pasteurisation. Milk-borne diseases included diphtheria, scarlet fever and strep throat, tuberculosis and bovine tuberculosis, and typhoid fever. Analysis of milk-borne diseases in Massachusetts from 1909 to 1913 concluded, however, that transmission of diphtheria through milk was negligible [Reference Kelley11].
One must look more closely at the cell biology of tuberculosis and diphtheria for clues to their association. As different as the two diseases are, both bacteria have the same type of protective cell wall – an extra layer of fatty cells – which heightens pathogenicity [Reference Mishra12, Reference Baumgart13]. This may give a synergistic benefit to both diseases in a co-infection and it is also a potential target for drug development against both [14].
A better clue to the association of tuberculosis and diphtheria may be how the bacteria obtain and use iron. Bacteria need iron to grow, although the amount of iron must be carefully controlled for survival. The body defends itself against disease by strategies to withhold iron [Reference Skaar15]. Tuberculosis is highly dependent on the availability of iron in the body and is so effective at obtaining iron that it can cause anaemia; but a person with iron-deprivation anaemia has greater resistance to tuberculosis [Reference Ratledge16, Reference Boelaert17].
Diphtheria has a more complex response to iron. Iron activates a gene that represses the production of diphtheria toxin and other components of its iron acquisition system making the disease less virulent, whereas a low level of extracellular iron causes diphtheria to release its dangerous toxin [Reference Pappenheimer and Johnson18, Reference Schmitt and Holmes19]. Because of the effect of low iron levels on the virulence of diphtheria, one might suspect that diphtheria could be treated with an iron-based therapy. And, in fact, in the late 1800s compounds of iron, such as ferric subsulphate (Monsel's styptic), were used as a topical treatment for diphtheria [Reference Nelson20]. It is now known that tuberculosis and diphtheria have the same, unique type of iron-dependent repressor genes, which control the assimilation of iron [Reference Manabe21]. With this information, one can consider the possible result of a co-infection. Tuberculosis, by extracting available iron in the body, would in a co-infection enhance the production of diphtheria toxin, substantially worsening the outcome of that disease. Debilitation caused by a severe diphtheria infection might then exacerbate or ‘wake up’ a preexisting tuberculosis infection, as described in the historical literature.
Conclusion
This research revives historical medical information about the relationship between diphtheria and tuberculosis while adding a statistical analysis that would not have been possible in an earlier era. Past medical research has not given a specific cause for the relationship between diphtheria and tuberculosis. However, contemporary research on their bacterial cell walls, iron assimilation and iron-dependent repressor genes point toward possible bases for their association. Although no in vitro research has been done that would confirm the proposed relationship between diphtheria and iron deprivation caused by tuberculosis, this type of experimental research can be done in vitro by the induction of diphtheria in the setting of tuberculosis growth.
One might think of diphtheria epidemics as long-ago events, but this is not necessarily true. Tuberculosis is still widespread in many parts of the world and diphtheria remains a threat if a nation's health system fails. After the collapse of the Soviet Union in the 1990s, for example, there was a resurgence of several epidemic diseases including the first large-scale diphtheria epidemic in over three decades with over 140 000 cases [Reference Vitel and Wharton22]. The combination of a failure to vaccinate children and susceptible adults quickly brought diphtheria back. But, as in the historical period, the resurgence of diphtheria may have been accelerated because tuberculosis is widespread in Russia and often drug resistant. By the end of the 1990s there were over 300 000 new tuberculosis cases, a million or more recovered patients and as many again with positive tuberculin tests [Reference Netesov and Conrad23]. Further research on the possible relationship between diphtheria and tuberculosis in Russia is warranted.
Acknowledgements
This research received no funding, grant, or support from any funding agency in the public, commercial, or not-for-profit sectors.
Declaration of interests
The author has no competing interests.
Ethical statement
This research used only aggregate, historical, statistical public health data that is in the public domain. No human subjects were involved.
Data accessibility
These data are available to the public at no cost from Project Tycho at the University of Pittsburgh (https://www.tycho.pitt.edu/). The city-level data used here is ‘Level 2’ data available at https://www.tycho.pitt.edu/data/level2.php in downloadable Excel files.


