


Introduction
As the COVID-19 pandemic has surged on the research agendas across academic disciplines, a key task for political scientists is to explain observed variations in countries’ pandemic response strategies (e.g. Hale et al. Reference Hale, Angrist, Goldszmidt, Kira, Petherick, Phillips, Webster, Cameron-Blake, Hallas, Majumdar and Tatlow2021). In doing so, researchers may also exploit the pandemic as an opportunity to re-evaluate and refine established theoretical arguments about policymaking in times of crisis and test them on a truly global scale.
This study aims to serve both these purposes, by investigating how countries’ initial pandemic response was shaped by two institutional factors of long-standing scientific interest—which were quickly brought up also in the conversation on COVID-19 (e.g. Fukuyama Reference Fukuyama2020; Przeworski Reference Przeworski2020)—namely democratic political institutions and the state’s administrative capacity. It seeks to make one theoretical and one empirical contribution to the literature.
First, drawing on existing case-oriented research, the study outlines a theoretical framework in which the strategic choice facing decision-makers in a pandemic is understood as a trade-off between precaution and proportionality, to which the two key groups of actors in pandemic management—political leaders and health agency experts—tend to have different predispositions (Baekkeskov and Rubin Reference Baekkeskov and Rubin2014; Rubin and de Vries Reference Rubin and de Vries2020). The institutional environment in which these actors operate, I argue, will matter for their strategic choice in two important ways. First, politicians in countries with democratic political institutions—whose survival in office is determined through competitive elections—will feel more pressure than politicians in more autocratic countries to adopt a more precautionary and disruptive strategy, to avoid electorally harmful blame for jeopardising public health. Second, precautionary considerations will be less prominent in countries where a professional and independent state bureaucracy is involved in pandemic decision-making, which makes proportional strategies more administratively and politically feasible by facilitating less-disruptive initial measures and a shift of responsibility for major decisions from politicians to experts.
The study’s second contribution is to submit this theory to an empirical evaluation, with a scope that includes all theoretically relevant institutional configurations around the world. This evaluation operationalises a precautionary strategy in terms of how rapidly a country implements disruptive containment measures in response to a given epidemiological situation. The measure of primary interest here is the initial implementation of school closures, which, as elaborated in later sections, lends itself particularly nicely to this investigation. As Figure 1 demonstrates, already by early April 2020, school closures had been implemented in virtually all countries in the world regardless of institutional configuration. There is, however, significant variation in the timing of this implementation, which can be exploited for our purposes by means of duration analysis.
School closures and COVID-19 cases among 173 countries, January 28–April 7, 2020. Sources: Dong et al. (Reference Dong, Du and Gardner2020), UNESCO (2021), Hale et al. (Reference Hale, Angrist, Goldszmidt, Kira, Petherick, Phillips, Webster, Cameron-Blake, Hallas, Majumdar and Tatlow2021).

These analyses, covering up to 96% of the world’s sovereign countries, yield strong support for the theorised links between democratic political competition, bureaucratic policy influence, and time to school closure. The results are robust to a variety of sensitivity analyses, and reassuringly, similar patterns exist for other disruptive containment measures such as workplace closures and movement restrictions, but not for less-disruptive health measures such as comprehensive testing and tracing. Thus, the study demonstrates the usefulness of theorising pandemic strategies in terms of precaution and proportionality, as well as the relevance of considering the interplay between political and bureaucratic institutions when analysing pandemic responses on a global scale.
Timing of school closures as an indicator of pandemic response strategy
Pandemic response strategies can be meaningfully described in terms of a trade-off between two logics—a precautionary logic and a proportionality logic (Baekkeskov and Rubin Reference Baekkeskov and Rubin2014; Rubin and de Vries Reference Rubin and de Vries2020; Salajan et al. Reference Salajan, Tsolova, Ciotti and Suk2020). As defined by Baekkeskov and Rubin (Reference Baekkeskov and Rubin2014, p. 85), a precautionary response strategy is one that “privileges sanitation by which the entire population is led to make sacrifices for the sake of vulnerable individuals”, whereas a proportional response strategy “privileges isolation by calling on vulnerable individuals to protect themselves or infected individuals to stay clear of healthy ones”.
In a pandemic situation, the timing of school closures—as well as other disruptive containment measures—is at heart of the trade-off between precaution and proportionality. On the one hand, as recognised in research and strategies by the WHO (2019), ECDC (2020a) and others, school closures have for long been known as a potentially effective intervention for reducing the spread of infectious diseases by increasing social distancing (Hatchett et al. Reference Hatchett, Mecher and Lipsitch2007; Jackson et al. Reference Jackson, Vynnycky, Hawker, Olowokure and Mangtani2013). Judgments about the optimal timing however diverge, with some favouring an early and decisive implementation (e.g. Hatchett et al. Reference Hatchett, Mecher and Lipsitch2007; ECDC 2020b) and others recommending postponement in favour of less disruptive measures until there is an ongoing community transmission (e.g. CDC 2020; ECDC 2020a). On the other hand, once implemented, school closures tend to impose major collateral costs to society and the economy. Among the most significant costs highlighted in research and policy documents available at the beginning of the pandemic are that they decrease the workforce in health care and other important capacities by prompting more parents to stay home with children, and are likely to have detrimental effects on student performance and well-being (e.g. Brown et al. Reference Brown, Tai, Bailey, Cooley, Wheaton, Potter, Vorehees, LeJeune, Grefenstette, Burke, McGlone and Lee2011; CDC 2020). Thus, put in relation to the definitions outlined above, a more rapid school closure would be indicative of a more precautionary strategy that imposes higher immediate costs on the society as a whole, whereas a more proportional strategy would imply that school closures are postponed longer, in favour of less-disruptive initial measures aimed at isolating vulnerable or infected individuals, which, if sufficiently effective, may make costlier interventions avoidable.
Politicians, health agency experts, and the institutions that shape pandemic response
A useful starting point for analysing what determines countries’ trade-off between precaution and proportionality is to consider how decision-makers make sense of the situation they face. As theorised by Rubin and de Vries (Reference Rubin and de Vries2020), a proportional strategy is more likely to come about when decision-makers perceive that several solutions are available for the problem at hand, and that it is possible to gather the information necessary to design the optimal policy for the given situation. A precautionary strategy, by contrast, is more likely to come about when decision-makers perceive the situation as chaotic and turbulent. In these cases, there is no scope for incremental adjustments directed towards any optimal policy; instead fast and disruptive decisions are perceived as necessary to avoid an impending disaster.
Previous scholarship has in turn linked these two crisis decision-making situations to the two key groups of actors involved in pandemic response—epidemiological and medical experts in state health agencies, and political leaders (Baekkeskov and Rubin Reference Baekkeskov and Rubin2014). For instance, an in-depth analysis of the early COVID-19 response in Denmark found that even there—where relationships between politicians and experts are normally frictionless and depoliticised—a sharp clash occurred between the health authorities’ scientific and incremental approach, and the politicians’ precautionary gut response, presumably triggered by a political pressure to avoid a dire pandemic situation like the Italian at all costs (Rubin and de Vries Reference Rubin and de Vries2020).
These insights, I argue, are important for understanding why countries differed in their trade-off between precaution and proportionality, for two reasons: First, because the pressure facing political leaders are likely to vary between political systems with different degrees of democratic rule, and second, because cross-national variations in the administrative capacity of the state bureaucracy and its involvement in pandemic decision-making should matter for the extent to which experts’ proportionality considerations influence pandemic responses.
Democratic institutions, accountability, and blame avoidance considerations
Let us first consider how a country’s crisis response is affected by the extent to which its political institutions are democratic—a concept that refers to whether the political leaders and the policy choices they make are accountable and responsive to citizens, as achieved through competitive elections combined with extensive political participation (Dahl Reference Dahl1971).
Most research concerned with the role of democratic political institutions for crisis response centres on the competitive aspect of these institutions. These studies take as their starting point the assumption that politicians in all political systems are primarily guided (whether for programmatic or personal reasons) by a strive to remain in office (Schumpeter Reference Schumpeter1950). The coalition whose support is needed to ensure political survival varies, however, between democracies and autocracies in ways that shape political incentives (Bueno de Mesquita et al. Reference Bueno de Mesquita, Alastair Smith, Siverson and Morrow2003). In democratic countries, politicians’ fate is ultimately determined in electoral competition between parties or candidates. This makes the evaluations of the voters—typically all adult citizens—of primary concern, and it incentivises politicians to behave in ways that appeal to the general public and that shields them from electorally harmful blame from political competitors or mass media (e.g. Besley and Burgess Reference Besley and Burgess2002; Baekkeskov and Rubin Reference Baekkeskov and Rubin2014). In autocratic countries, by contrast, political leaders’ survival in office is dependent on ensuring the support of a much smaller coalition—typically comprised by aristocrats, military leaders, or other cronies—which weakens the link between leaders’ behaviour towards the general public and their survival in office. This link is often further undermined by autocrats’ efforts to suppress political competition and restrict the freedom of press (e.g. Besley and Kudamatsu Reference Besley and Kudamatsu2006, Bollyky et al. Reference Bollyky, Templin, Cohen, Schoder, Dieleman and Wigley2019).
Thus, from a political competition perspective, there are reasons to expect that leaders in democratic countries face stronger pressure to follow the precautionary decision-making logic discussed in the previous section, by acting rapidly and disruptively (Baekkeskov and Rubin Reference Baekkeskov and Rubin2014; Baekkeskov Reference Baekkeskov2016; Rubin and de Vries Reference Rubin and de Vries2020). This expectation relies on two key assumptions. A first assumption is that politicians expect that voters take their actions into consideration retrospectively when making vote choices. There is evidence that voters’ evaluations indeed tend to consider politicians’ actions in the realm of natural disasters—in terms of both provision of relief payments (Healy and Malhotra Reference Healy and Malhotra2009; Bechtel and Hainmueller Reference Bechtel and Hainmueller2011), and on-site visits (Butzek Reference Butzek, Boin, McConnell and Hart2008; Lazarev et al. Reference Lazarev, Sobolev, Soboleva and Sokolov2014)—albeit there is still uncertainty about how long voters’ memory lasts (see, e.g. Rubin Reference Rubin2020).
A second assumption is that politicians expect that by opting for a precautionary strategy involving rapid containment measures, they will be rewarded by the voters or at least reduce the risk of harmful blame. Why that would be the case—despite the potentially high economic costs of such measures—deserves some discussion. To begin with, research has suggested that citizens generally expect politicians to step forward in a crisis situation (e.g. Boin et al. Reference Boin, McConnell and Hart2008; Lazarev et al. Reference Lazarev, Sobolev, Soboleva and Sokolov2014; Rubin Reference Rubin2020; Rubin and de Vries Reference Rubin and de Vries2020) and to do so promptly (Butzek Reference Butzek, Boin, McConnell and Hart2008). But said assumption can also be linked to the particularly high salience of health considerations in democratic politics. A large body of research has found that democratic governments put higher priority on safeguarding the population’s well-being (e.g. Kahn Reference Kahn2005; Besley and Kudamatsu Reference Besley and Kudamatsu2006; Kudamatsu Reference Kudamatsu2012; Flores and Smith Reference Flores and Smith2013; Pieters et al. Reference Pieters, Curzi, Olper and Swinnen2016; Bollyky et al. Reference Bollyky, Templin, Cohen, Schoder, Dieleman and Wigley2019; Cronert and Hadenius Reference Cronert and Hadenius2021). Evaluating possible mechanisms behind this effect, Bollyky et al. (Reference Bollyky, Templin, Cohen, Schoder, Dieleman and Wigley2019) recently concluded that it was specifically the existence of competitive elections that promoted better health outcomes, likely by improving political leaders’ accountability and responsiveness concerning health issues.
With regards specifically to pandemic responses, case studies of the 2009 H1N1 influenza outbreak in Denmark and Netherlands have shown that fear of being blamed for doing too little to protect people’s health affected decisions taken by political leaders (Baekkeskov Reference Baekkeskov2016). This finding is particularly relevant here, considering that political evaluations at the early stages of the COVID-19 pandemic outbreak focused almost exclusively on health outcomes, with mass media in many countries providing daily updates on the number of infected and deaths, and making international comparisons (Rubin and de Vries Reference Rubin and de Vries2020). There is also some cross-national evidence suggesting that voters looked favourably on politicians who adopted a precautionary strategy during the initial phase. Bol et al. (Reference Bol, Giani, Blais and Loewen2021) found that people in Western Europe who had experienced a lockdown reported 4% stronger support for their Prime Minister’s party than those who had not yet experienced one. School closures too appear to have been closely linked to health concerns among the public. In early May of 2020, a survey found that in 14 out of 16 countries across 6 continents, a clear majority of people responded still not being comfortable with allowing their children back to school (IPSOS 2020).Footnote 1
Importantly, what has been stated above is not to suggest that autocratic governments take no interest at all in public health or are indifferent to pandemic outbreaks. These governments oftentimes base their claims to legitimacy on their capability to care for their population (Rubin Reference Rubin, Dahlberg, Rubin and Vendelø2016; Baekkeskov and Rubin Reference Baekkeskov and Rubin2017), and as documented above virtually all countries regardless of political system eventually decided to close schools. What the political survival logic implies is merely that because autocratic leaders’ stay in office is less dependent on their ability to shield themselves from public disapproval, they should generally feel less pressure to adopt a precautionary strategy involving rapid containment measures. This reasoning is in line with historical evidence by Flores and Smith (Reference Flores and Smith2013) regarding the distinct consequences of occurrences and fatalities of natural disasters for the survival in office of autocratic and democratic leaders. Their study found that autocratic leaders are more threatened by the mere occurrence of disasters—which can facilitate revolutionary protests by concentrating displaced individuals—but less affected by how well they manage to prevent deaths.
Two counterarguments are worth addressing here. A first argument posits that democratic governments oftentimes face higher degrees of constraints from other political bodies, such as additional independent branches of government and sub-federal political entities, which may limit how quickly they can respond to a crisis (e.g. Rubin Reference Rubin, Dahlberg, Rubin and Vendelø2016). Two remarks are warranted in response. First, although such political constraints are on average more common in democracies, the two are distinct concepts and far from perfectly correlated empirically.Footnote 2 Second, to the extent that these other political bodies are also populated by office-seeking politicians eager to avoid blame for jeopardising public health, they too might favour precaution and seek to facilitate a rapid response. Nevertheless, these concerns motivate that the role of political constraints is investigated empirically.
A related counterargument concerns the political involvement of citizens and civil society—i.e. the participatory dimension of democracy. Disruptive containment measures may be more difficult to enact quickly where the population—many of whom will be personally and immediately affected—have a stronger institutionalised voice in politics, whether individually or through civil associations. Thus, considering that democracy—as per Dahl’s (Reference Dahl1971) seminal definition—requires a high degree of both electoral competition and popular participation, it becomes an interesting empirical question how these two dimensions relate to the timing of school closures, and which mechanism dominates.
The state’s administrative capacity and political–administrative relationships
Returning to Rubin and de Vries’s (Reference Rubin and de Vries2020) discussion about the different sense-making approaches of political leaders and health experts, it follows that to understand cross-national variations in pandemic response strategies, we need to consider how the state bureaucracy’s role in pandemic management is affected by its administrative capacity and its relationship with the politicians. State administrative capacity is an elusive concept (Bäck and Hadenius Reference Bäck and Hadenius2008), closely related to concepts such as quality of government (e.g. Rothstein and Teorell Reference Rothstein and Teorell2008; Nistotskaya and Cingolani Reference Nistotskaya and Cingolani2016), government effectiveness (e.g. Dahlström and Lapuente Reference Dahlström and Lapuente2017; Kaufmann et al. Reference Kaufmann, Kraay and Mastruzzi2011), and bureaucratic quality (PRS Group 2019). At heart of this concept, however, is a state bureaucracy populated by professional and impartial staff, who are hired based on their competence and exert an influence on policy independently from political pressures.
A first way in which cross-national variation in state administrative capacity is likely to matter is that countries with more professional state agencies will have a larger set of policy tools available for consideration when deciding on their pandemic responses. As noted by Capano (Reference Capano2020), many less-disruptive non-pharmaceutical interventions—such as developing testing and tracing capabilities, ensuring an adequate supply of personal protective equipment, and devising strategies to isolate patients and at-risk groups—require relatively high administrative capacity. Thus, such countries should be in a better position to implement a more proportional strategy that suspends disruptive and potentially costly containment measures like school closures longer, in favour of less disruptive initial responses.
Second, it is likely to matter because we should expect the experts at the involved health agencies to be more predisposed to a proportional policy strategy than political leaders (Baekkeskov and Rubin Reference Baekkeskov and Rubin2014). This is not to suggest that these experts cannot make different judgments about the appropriateness of different strategies (cf. Baekkeskov and Rubin Reference Baekkeskov and Rubin2014; Weible et al. Reference Weible, Nohrstedt, Cairney, Carter, Crow, Durnová, Heikkila, Ingold, McConnell and Stone2020). The point is simply that their judgments on school closures and other containment measures should be guided relatively more by criteria related to proportionality than by a presumed political pressure for a precautionary response. Corroborating this assumption, a survey has documented the predominance of proportionality considerations over political considerations in public health officials’ decisions on school closures during the 2009 H1N1 influenza outbreak in the USA (Kayman et al. Reference Kayman, Salter, Mittal, Scott, Santos, Tran and Ma2015).
However, what ultimately determines a government’s response strategy might not be the mere existence of a professional bureaucracy—but rather how the relationships between politicians and the bureaucracy are organised. A long-standing topic in public administration research, political–administrative relationships have been identified as important for understanding variations in corruption (Dahlström and Lapuente Reference Dahlström and Lapuente2017), regulatory quality (Nistotskaya and Cingolani Reference Nistotskaya and Cingolani2016), bureaucrats’ pro-innovation attitudes (Lapuente and Suzuki Reference Lapuente and Suzuki2020), as well as pandemic response (Baekkeskov Reference Baekkeskov2016; Moon et al. Reference Moon, Suzuki, Park and Sakuwa2021).
For pandemic response, what should specifically matter is how involved the health experts in the relevant agencies are in strategic decision-making. There are two possible, non-rival mechanisms here. First, granted that the experts tend to be more predisposed to proportional policy strategies than political leaders, it follows that the larger influence they have over a country’s pandemic strategy, the more proportional it should become. Second, if authoritative experts are involved in policy-making, it may make it easier for political leaders to shield themselves from potential blame, by shifting the responsibility for important decisions to the certified expertise (Baekkeskov and Öberg Reference Baekkeskov and Öberg2017; Weible et al. Reference Weible, Nohrstedt, Cairney, Carter, Crow, Durnová, Heikkila, Ingold, McConnell and Stone2020). An implication of the latter argument is that state administrative capacity might have a moderating impact on the hypothesised expediting effect of democracy. More specifically, the democratic political survival logic discussed above should be more dominant in the absence of a professional and influential state bureaucracy that can serve to obscure political accountability.
Lastly, it should be emphasised that several other factors are also likely to affect the time to school closure, not least the severity of the threat posed by the pandemic—which affects need perceptions of both decision-makers and voters (Bechtel and Mannino Reference Bechtel and Mannino2022)—and the increasing likelihood of learning as the pandemic progresses (Sebhatu et al. Reference Sebhatu, Wennberg, Arora-Jonsson and Lindberg2020; Weible et al. Reference Weible, Nohrstedt, Cairney, Carter, Crow, Durnová, Heikkila, Ingold, McConnell and Stone2020). Several such factors will be discussed and accounted for in the statistical analysis.
Illustrative examples
Before the statistical analysis, four brief examples may illuminate how decision-makers’ considerations regarding the timing of school closures in early 2020 varied across countries with different combinations of democracy and administrative capacity (for country-wise data, see the Supplementary Material, Table S6).
The most precautionary response would be expected in countries where leaders come to power through free and fair elections, but the state’s administrative capacity is weak. One such case is El Salvador. In a move described by observers as an attempt to “put him and El Salvador on the right side of history” (Eulich Reference Eulich2020), President Nayib Bukele opted for an unmistakably precautionary strategy in the initial stage of the pandemic. On March 11, he announced a 3-week school closure along with a number of other containment measures—well before any COVID-19 case had been reported in the country. President Bukele’s motivation when announcing his move demonstrates the prominence of health over economic considerations, and refers explicitly to the state’s lack of capacity for pandemic management:
“What’s most important right now is the health of every Salvadoran […]” (Reuters 2020)
“The economic impact that this is going to have has been evaluated, but the economic impact pales beside the number of deaths that we could have […] with a pandemic that neither Italy nor South Korea are prepared for [and] not Germany […] Much less El Salvador or any country in the region.” (López Reference López2020)
Egypt, next, has a similar level of administrative capacity as El Salvador but is considerably less democratic. The country was the first on the African continent to confirm a COVID-19 case on February 14, but rather than opting for a precautionary response, the Egyptian government initially downplayed the seriousness of the disease. In a February 29 interview, for instance, Minister of Health Hala Zayed emphasised the high proportion of cases globally for which only mild symptoms had been reported, urging her audience to avoid panic (Middle East Eye 2020).
Whereas some hygiene measures were soon implemented in schools, the government openly rejected calls from the public for school closures, at least partly out of concerns for the economic consequences. An example of this comes from a televised interview on March 9, where Minister of Education Tarek Shawki stated that a suspension of schools will not be determined by social media pressures. Closing schools due to a disease implies that there is a pandemic, which is not the case in Egypt, he said, adding that such a decision “will affect Egypt’s economy, stock exchange, tourism, and civil aviation” (quoted in Lotfi Reference Lotfi2020). A few days later, a country-wide school closure was nevertheless implemented, 30 days after the first confirmed case.
Singapore, next, is a country with a low level of democracy but very high administrative capacity. The first pandemic measures were introduced already on January 2, targeted at identifying and isolating suspect cases travelling from Wuhan, China. Indicative of a proportional strategy, measures were gradually ramped up after the country confirmed its first case on January 23, while the more disruptive interventions, including school closures, were long avoided (Hale et al. Reference Hale, Angrist, Goldszmidt, Kira, Petherick, Phillips, Webster, Cameron-Blake, Hallas, Majumdar and Tatlow2021). Explaining this choice, Minister of Education Ong Ye Kung highlighted Singapore’s high capacity for pandemic management:
“[F]or schools, which are a major part of people’s lives, we have also been stepping up [measures]. So, we will not want to do something dramatic, sudden, that will result in school closure […] We still have options. We are not like many countries, where they are forced into sudden school closures” (quoted in Teng and Davie Reference Teng and Davie2020).
On April 3, when the government eventually announced a nation-wide school closure effective April 7 (75 days after the first confirmed case), Mr. Ong specifically emphasised that the time was now right, and that public pressure for a more precautionary strategy—which had been voiced through letters and petitions—had not been taken into consideration (Hui Min Reference Hui Min2020).
United Kingdom, next, ranks high in both democracy and state administrative capacity. Particularly relevant for pandemic management is the Scientific Advisory Group for Emergencies—previously activated during the 2009 H1N1 influenza and other disease outbreaks—which was re-activated in late January 2020. Indicative of a proportional strategy, the country was among the first in Europe to implement policies for testing and tracing, yet among the very last to implement more disruptive containment measures, including school closures. At a press briefing on March 12, Prime Minister Boris Johnson—flanked by the government’s Chief Medical Officer and Chief Scientific Adviser—outlined the government’s motivation:
“The Chief Medical Officer will set out our lines of defence. We have to deploy these at the right time to maximise their effect. The most important task will be to protect our elderly and most vulnerable people during the peak weeks […] At all stages, we have been guided by the science, and we will do the right thing at the right time. We are not—repeat not—closing schools now. The scientific advice is that this could do more harm than good at this time.” (Prime Minister’s Office 2020)
The following days, an escalating caseload alongside growing concerns among both the public and teachers put increasing pressure on the government to reconsider its strategy, and on March 18 a school closure was eventually declared, effective March 23 (47 days after the first confirmed case). Whereas this decision was announced with reference to the scientific expertise, government officials have later indicated that it was a change of tack initiated by the Prime Minister’s office in response to the growing urgency of the epidemiological situation (Timmins Reference Timmins2021; House of Commons 2021, Q1003), which—as noted by Cairney (Reference Cairney2021, p. 109)—had “helped change radically the political feasibility of new measures.”
Blame deflection motivations behind the government’s references to science have been reported but are contested (cf. House of Commons 2021, Q1204 vs. Q1270). However, parliamentary testimonies by both Minister of Health Matt Hancock and Prime Minister Johnson’s former Chief Advisor Dominic Cummings reveal another variant of blame avoidance consideration, linked not to deflection but to the political difficulties involved in overruling a strategy endorsed by scientific authorities (House of Commons, 2021 Q1008, Q1300). Mr. Cummings’s explanation of why he did not advice the Prime Minister to change tack sooner illustrates these considerations:
“I was incredibly frightened—I guess is the word—about the consequences of me kind of pulling a massive emergency string […] because what if I’m wrong? What if I persuade him to change tack and that is a disaster? Everyone is telling me that if we go down this alternative path, it is going to be five times worse in the winter, and what if that is the consequence?” (House of Commons 2021, Q1008)
These brief examples illustrate that school closures can be part of both precautionary and proportional pandemic response strategies, and that the mechanisms theorised above appear to have some bearing on a number of real-world cases. However, to establish whether these are representative of countries across the globe, we need a more extensive statistical analysis.
Empirical strategy
Three considerations motivate the choice to focus this analysis primarily on school closures implemented during the early phase of the pandemic. First, considering that academic calendars are typically not embedded in constitutions or even in laws, and that temporary school cancellations due to adverse weather conditions etc. are routine (Cheibub et al. Reference Cheibub, Hong and Przeworski2020), it should be rather doable for most governments to make school closures part of their pandemic response and time them approximately as they see fit. Second, because school closures were indeed implemented in virtually all countries already by early April 2020, I can reliably observe and exploit the timing of the intervention, rather than whether or not it was eventually part of the response, to make inferences about the precaution versus proportionality trade-off. That gives me a more comparable and conceptually clear measure than, say, a composite index of the overall stringency of government response at various points during the pandemic—and a measure for which measurement error can be minimised. Third, analyses of the early phase of the pandemic are less affected by factors that impact both the need for additional interventions (such as the effectiveness of earlier interventions) and the values of other important variables (such as the amount of testing, which will in turn affect the number of confirmed cases).
The statistical analysis combines simple graphical description of cross-country variations with duration analysis of country-date panel data. To make these analyses as comprehensive as possible, efforts have been made to include all countries that enjoy at least some degree of functional and/or formal sovereignty as defined by the V-Dem Institute (Coppedge et al. Reference Coppedge, Gerring, Knutsen, Lindberg, Teorell, Alizada, Altman, Bernhard, Cornell, Fish, Gastaldi, Gjerløw, Glynn, Hicken, Hindle, Ilchenko, Krusell, Lührmann, Maerz, Marquardt, McMann, Mechkova, Medzihorsky, Paxton, Pemstein, Pernes, Römer, Seim, Sigman, Skaaning, Staton, Sundström, Tzelgov, Wang, Wig, Wilson and Ziblatt2021). Out of these 178 countries, 5 must be excluded since they lack the necessary data on confirmed COVID-19 cases reported by the Johns Hopkins UniversityFootnote 3 (Dong et al. Reference Dong, Du and Gardner2020).
To enable a meaningful comparison of timings, a common starting point for the analyses is needed. To reconcile comparability and inclusiveness, I choose two different starting points. For the descriptive analysis, the point of reference is the day of the first confirmed case of COVID-19. However, given that many countries closed schools already before having their first confirmed case, this starting point is inappropriate for the duration analyses. In these models, the starting point for all countries is instead January 28; 1 day after the first school closures were implemented in China, Hong Kong and Mongolia, and 2 days before the WHO declared a Public Health Emergency of International Concern. Accordingly, these analyses include at most 170 countries, only one of which (Nicaragua) had not implemented a school closure by April 7 when the study ends.
Key variables
The baseline analyses rely on the V-Dem Institute’s electoral democracy index, which is based on sub-indices capturing freedom of association, clean elections, freedom of expression, elected officials, and suffrage (Coppedge et al. Reference Coppedge, Gerring, Knutsen, Lindberg, Teorell, Alizada, Altman, Bernhard, Cornell, Fish, Gastaldi, Gjerløw, Glynn, Hicken, Hindle, Ilchenko, Krusell, Lührmann, Maerz, Marquardt, McMann, Mechkova, Medzihorsky, Paxton, Pemstein, Pernes, Römer, Seim, Sigman, Skaaning, Staton, Sundström, Tzelgov, Wang, Wig, Wilson and Ziblatt2021). For state administrative capacity, the best available indicator with sufficient country coverage is the Worldwide Governance Indicators’ (WGI) estimate of government effectiveness, which considers the quality of public service provision, the quality of the bureaucracy, the competence of civil servants, the independence of the civil service from political pressures, and the credibility of the government’s commitment to policies (Kaufmann et al. Reference Kaufmann, Kraay and Mastruzzi2011). Both indicators are rescaled to range between 0 and 10. I use indicators for 2019 to avoid endogeneity concerns stemming from the risk that the expert assessments informing these measures are influenced by countries’ pandemic responses. Recognising that both indicators represent multi-dimensional constructs, supplementary analyses take steps to disentangle their relevant dimensions using more fine-grained measures that are available for fewer countries.
The dichotomous indicator on incidents of school closures is measured daily and based primarily on information from two data collection efforts carried out by UNESCO (2021) and Hale et al. (Reference Hale, Angrist, Goldszmidt, Kira, Petherick, Phillips, Webster, Cameron-Blake, Hallas, Majumdar and Tatlow2021). In each case where the sources disagree, an independent opinion has been formed based on reviews of the original sources as well as the CoronaNet event dataset (Cheng et al. Reference Cheng, Barceló, Hartnett, Kubinec and Messerschmidt2020) and various newspaper reports. The variable records the first day with ordered or advised school closures, typically set to the first working day after announcement, or the day of announcement in cases where ongoing school breaks were extended. The baseline version of this variable considers both national and sub-national measures. From a theoretical perspective, this choice relies on the assumption that in countries where schools are the responsibility of regional or local governments, similar political and bureaucratic dynamics are in play regardless of level. Occasional reports on spontaneous school closures ahead of government decisions (e.g. UK in late February) are, however, disregarded. Measures that only pertain to universities (e.g. Hungary on March 11 and Nigeria on March 20) or nurseries (e.g. United Arab Emirates on March 1) are also disregarded, and in all cases, they are shortly followed by more general school closures.
Daily data on logged cumulative confirmed cases of COVID-19 come from Johns Hopkins UniversityFootnote 4 (Dong et al. Reference Dong, Du and Gardner2020). Although the confirmed cases almost certainly underestimate the true caseload, they are still highly relevant here since they fuelled media reports and political discussions at this stage of the pandemic. However, although by early April confirmed cases had been reported for 98% of all countries, the quality of this information likely varies across countries and time in a non-random manner due to variations in reporting practices and testing. A supplementary analysis has been conducted to check that my results are not sensitive to systematic delays or under-reporting in highly autocratic or administratively weak countries.
Additional variables are discussed subsequently. The Supplementary Material lists definitions and sources, and Tables S1 and S6 therein provides summary statistics and a country-wise list of key variables.
Results
Descriptive results
Let us first consider some simple descriptive evidence. For all countries included in the subsequent analysis, Figure 2 plots the number of days between the country’s closure (or April 7 for the right censored case of Nicaragua) and the day of its first confirmed COVID-19 case against the country’s government effectiveness rating. The colour and shape of the markers indicate whether the country has an above-median (grey circles) or below-median (black triangles) democracy rating.
Timing of school closures in 170 countries.
Note: Includes 170 countries, omitting China, Hong Kong, and Mongolia. Values for above-median democratic Lesotho (−55), Solomon Islands (−206), and Vanuatu (−254) have been truncated at the minimum value among below-median democratic countries (−41). Sources: Dong et al. (Reference Dong, Du and Gardner2020), UNESCO (2021), Hale et al. (Reference Hale, Angrist, Goldszmidt, Kira, Petherick, Phillips, Webster, Cameron-Blake, Hallas, Majumdar and Tatlow2021), Coppedge et al. (Reference Coppedge, Gerring, Knutsen, Lindberg, Teorell, Alizada, Altman, Bernhard, Cornell, Fish, Gastaldi, Gjerløw, Glynn, Hicken, Hindle, Ilchenko, Krusell, Lührmann, Maerz, Marquardt, McMann, Mechkova, Medzihorsky, Paxton, Pemstein, Pernes, Römer, Seim, Sigman, Skaaning, Staton, Sundström, Tzelgov, Wang, Wig, Wilson and Ziblatt2021), Kaufmann et al. (Reference Kaufmann, Kraay and Mastruzzi2011).
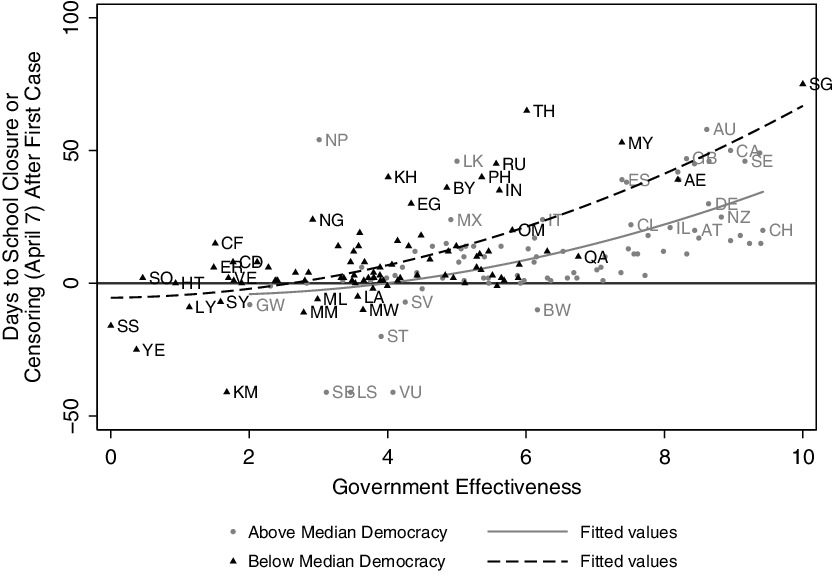
Two key observations can be made from the two lines that represent quadratic predictions fitted to the two subsets of the observations. First, the slopes show a clear positive relationship between government effectiveness and time to school closure. Second, judging from the positive difference between the black (dashed) and the grey (solid) lines at all values of government effectiveness, it appears that on average, less democratic countries tended to implement school closures later than more democratic countries.
Cox proportional hazards models
The duration analyses, next, are based on the Cox proportional hazards model, which is a widely used method for studying the relationship between the time it takes before a specific event occurs and a set of covariates. Like other types of duration models, the Cox model is built around the concept of hazard, which denotes the risk that the event of interest will occur at a particular point in time, given that it has not done so up to that point. Unlike fully parametric models like the Weibull model and the log-normal model, the semi-parametric Cox model does not require any assumption about the shape of the baseline hazard. This makes it a particularly attractive option in the case at hand, since we do not have good reason to expect that the duration dependency of school closures exhibits a particular form (Box-Steffensmeier and Jones Reference Box-Steffensmeier and Jones2004). The coefficient estimates derived from the Cox regression are typically used to compute hazard ratios that denote the average multiplicative change in the hazard rate associated with to a one-unit increase in a covariate of interest. To facilitate more substantive interpretations of the results, I will also use these estimates to compute the marginal change in expected time to event associated with such increases.
The data used in these analyses are structured as country-date panels, which begin on January 28 and end on the day of the country’s first school closure event, as the school closure variable switches from 0 to 1. Exploratory analyses indicate that no country-specific frailties are needed in these models, but to satisfy the proportional hazards assumption that underpins the Cox model, the observations are stratified by the day of the country’s first confirmed COVID-19 case. This stratification accounts for the generally higher baseline hazard of school closure among countries that were hit later by the pandemic, which is likely in part due to their opportunity to learn from the policy responses in countries that were affected earlier (Sebhatu et al. Reference Sebhatu, Wennberg, Arora-Jonsson and Lindberg2020; Weible et al. Reference Weible, Nohrstedt, Cairney, Carter, Crow, Durnová, Heikkila, Ingold, McConnell and Stone2020). In effect, it ensures that coefficient estimates are based only on variation among countries that registered their first case the same day.Footnote 5
The baseline model A includes the aforementioned indicators of democracy and state administrative capacity and, as controls, the daily (logged) number of cumulative confirmed COVID-19 cases as well as a set of seven region dummies that serve to reduce endogeneity concerns by absorbing any unobserved regional confounders.Footnote 6 To control for the possibility that a faster spread of the virus in a country’s region may prompt a more rapid response, the model furthermore includes a daily indicator of the share of countries in the region—excluding the country itself—that had at least one confirmed case of COVID-19.Footnote 7 It furthermore adds a time-varying dummy indicating country-specific weekend days, considering that a school closure should be much more likely to begin on a working day.
The results from model A show that when holding region and the spread of the virus constant, democratic countries are on average likely to implement school closures sooner than those with a more autocratic regime. The hazard ratios reported in Figure 3 indicate that an increase in democracy by one unit (on a 0–10 scale) is associated with an average increase in the hazard of school closure of around 35%. As to government effectiveness, a one-unit increase is associated, on average, with a 32% lower hazard of school closure. Both results are statistically significant at conventional levels. There is furthermore an expected significant positive relationship between confirmed COVID-19 cases—both domestically and regionally—and the relative risk of school closures.
Hazard ratio estimates from Cox models of school closures in up to 170 countries.
Note: 95% confidence intervals based on robust standard errors clustered by country. Observations are stratified on date of first confirmed COVID-19 case. All models include a set of region indicators and an indicator of weekend days. For full model output, see the Supplementary Material, Table S2.

Model B includes five additional control variables, which may be correlated with democracy and administrative capacity, and which may also affect the time to school closure. The first is a measure of (logged) GDP per capita, which has been found positively associated with the timing of social distancing policies among US states (Adolph et al. Reference Adolph, Amano, Bang-Jensen, Fullman and Wilkerson2021). The second is the number of hospital beds per 1,000 people, which may reduce the urgency of precautionary measures (Toshkov et al. Reference Toshkov, Carroll and Yesilkagit2021). The third is the share of the population aged 0–14, intended to capture that a larger youth population might make school closures costlier and more difficult to implement. The fourth is a measure of urbanisation, which might make school closures both more urgent and easier to implement.
The fifth variable represents the core features of a country’s family system, by capturing the proportion of its current population whose ancestors resided in nuclear or stem families, rather than polygamous or community families. The variable is defined based on Rijpma and Carmichael (Reference Rijpma and Carmichael2016) and measured using data from Giuliano and Nunn (Reference Giuliano and Nunn2018). In countries with a tradition of nuclear or stem families, households tend to be smaller (Rijpma and Carmichael Reference Rijpma and Carmichael2016), pre-primary and primary school enrolment tends to be higher (Teorell et al. Reference Teorell, Dahlberg, Holmberg, Rothstein, Alvarado Pachon and Axelsson2020), and retirement ages tend to be higher (author’s data). These are all factors that may make school closures costlier to implement and sustain, but since reliable data is lacking for a sufficient number of countries, I instead rely on this family system-based proxy.
Model B indicates that a younger population and a nuclear or stem family system are associated with a significantly lower relative risk of school closure. Including these control variables reduces the sample size by eight countries while increasing the coefficient for government effectiveness and leaving the coefficient for democracy essentially unaltered.
To investigate the theorised moderating impact of a well-functioning state bureaucracy on the expediting effect of democratic institutions, I also run extended versions of the aforementioned models, which add an interaction term between democracy and government effectiveness. As discussed in the subsequent section and reported in the Supplementary Material, Table S2, the results from these models (A+ and B+) are in line with expectations.
Substantive interpretation of the results
To help interpret the results from the baseline models in policy-relevant terms, Figure 4 reports the marginal changes in expected time to school closure given a change in government effectiveness or democracy from the 25th to the 75th percentile, respectively, estimated using the Cox ED procedure (Kropko and Harden Reference Kropko and Harden2020). The estimates for these models indicate that such an increase in the level of government effectiveness—roughly equivalent to a change from that of Egypt to that of Italy—corresponds to an increase in the average expected time to school closure by around 8 days. A change in democracy of an equivalent magnitude—i.e. from that of Turkey to that of Chile—is on average associated with a reduction in expected duration of 8–11 days depending on specification.
Expected difference in time to school closure, by institutional factor.
Note: Estimates of average marginal effects obtained by post-estimation simulation from baseline models A and B and interaction models A+ and B+, using the non-parametric step-function version of the Cox ED procedure (Kropko and Harden Reference Kropko and Harden2020). 95% confidence intervals based on standard errors bootstrapped by country with 200 iterations. A+ (Interaction) and B+ (Interaction) replicate models A and B but add an interaction between democracy and government effectiveness. High and low levels are the 25th and 75th percentiles, respectively. For full model output, see the Supplementary Material, Table S2.

However, the estimates from the two interaction models plotted in the Figure (A+ and B+), suggest that the marginal effect of democracy varies across countries with different levels of government effectiveness in line with theoretical expectations. At low levels, the estimated change in expected duration given a change in democracy is substantially higher (12–16 days at the 25th percentile) than at high levels (5–7 days at the 75th percentile). Correspondingly, the marginal effect of government effectiveness varies across regimes; at the 25th percentile of democracy an increase is associated with a delay of 4–6 days, as compared to 13–14 days at the 75th percentile.
Which dimension of democracy expedites response?
As discussed above, the full realisation of democracy is commonly seen as requiring a high degree of both electoral competition and popular participation (Dahl Reference Dahl1971), and these two dimensions may have different effects on the time to school closure. To investigate whether it is indeed competition that drives democracies’ quicker response, I run two models that substitute the baseline democracy indicator for the two 2018 indicators on political competition and political participation developed by Vanhanen (Reference Vanhanen2019); the most recent measures available for most countries (rescaled to 0–10). Computed primarily based on the size of the largest party, the competition indicator has been found to be empirically related to the likelihood that the incumbent executive is ousted from office at the next election (Cronert and Nyman Reference Cronert and Nyman2021). The models in question (C and D in Figure 3 and Table S2) indicate that it is indeed this competitive aspect of democracies that accounts for their higher hazard of school closures. By contrast, participation—a measure based on voter turnout and referendums—is insignificant and not at all or even negatively associated with the hazard of school closures.
To illustrate the substantive implication of the results from these two models, I estimate the expected time to school closure for three fictive regime types: a closed authoritarian regime with relatively low (25th percentile) values on both dimensions (similar to Iran), a democratic regime with fairly high (75th percentile) values on both dimensions (e.g. Spain), and an electoral authoritarian regime with low competition but high participation (e.g. Belarus). The estimated differences between the closed authoritarian regime and the two others are reported in Figure 5. These results suggest that while the democratic regime is expected to take 4–7 days less to close its schools, the electoral authoritarian regime is expected to take about the same time or even slightly longer.
Expected difference in time to school closure, by regime type.
Note: Estimates of average marginal effects obtained by post-estimation simulation from models C and D using the nonparametric step-function version of the Cox ED procedure (Kropko and Harden Reference Kropko and Harden2020). 95% confidence intervals based on standard errors bootstrapped by country with 200 iterations. For full model output, see the Supplementary Material, Table S2.

Supplementary analyses
Several supplementary analyses have been conducted to substantiate the results above. First, it follows from the theory that similar relationships should be expected for other disruptive domestic containment measures, such as workplace closures and movement restrictions, but not for the less-disruptive and more administratively demanding health measures that are at heart of a proportional strategy, such as comprehensive testing and tracing, and isolation of elderly. Figure 6 reports replications of models A and B using Hale et al.’s (Reference Hale, Angrist, Goldszmidt, Kira, Petherick, Phillips, Webster, Cameron-Blake, Hallas, Majumdar and Tatlow2021) data—as is—for six other containment measures as well as for four health measures, covering 146–160 countries. Since these data are not cross-checked with other sources, measurement errors are likely larger and estimates consequently less precise. Nevertheless, although coefficients are less precisely estimated, the overall patterns are reassuringly well in line with expectations: The results for the other containment measures (upper panel) are generally similar to those for school closures—except that stay-at-home policies are not more rapidly implemented in more democratic countries—whereas, in sharp contrast, the health measures (lower panel) are implemented sooner in countries with higher government effectiveness.
Hazard ratio estimates from Cox models of other non-pharmaceutical interventions.
Note: These analyses re-estimate baseline models A and B on different events, and are run on the available data (as is) from Hale et al. (Reference Hale, Angrist, Goldszmidt, Kira, Petherick, Phillips, Webster, Cameron-Blake, Hallas, Majumdar and Tatlow2021), covering 146–161 countries. 95% confidence intervals based on robust standard errors clustered by country.

Next, reported in the online Supplementary Material (Figures S1 and S2, Table S3), models E–F+ replicate models A–B+, but substitute the baseline democracy and government effectiveness measures for the 2019 Freedom House/Imputed Polity level of democracy indicator and the 2016 ICRG indicator of quality of government. The samples are reduced but the baseline results remain intact. Models G and H (Figure S3, Table S3) substitute Vanhanen’s indicators on competition and participation by two Polity measures capturing these two dimensions of democracy (Marshall and Jaggers Reference Marshall and Jaggers2020). These results corroborate that political competition is what dominates and drives democracies’ faster response.
Third, to illuminate the mechanism by which state administrative capacity delays the implementation of school closures, Models I, I+, J, and J+ (Table S4) replace the government effectiveness indicator by two indices produced using data from Dahlström et al.’s (Reference Dahlström, Teorell, Dahlberg, Hartmann, Lindberg and Nistotskaya2015) QoG Expert Survey to capture the two relevant aspects of bureaucratic capacity: professionalism and independent policy influence. These results suggest that it is the bureaucracy’s policy influence that matters the most, and is what counteracts the expediting effect of democracy. In addition, to verify that it is the administrative aspect of the state’s capacity that matters, models K and L (Table S4) replicate model A and B, but add two indicators commonly used to capture two other much-analysed dimensions of state capacity: extractive capacity and coercive capacity (see Hanson Reference Hanson2018). Neither of them is found relevant here.
Fourth, to investigate the possible delaying function of political constraints, discussed in the theory section, the three models M–O (Table S5) replicate model A but add, in turn, Henisz’s (Reference Henisz2017) political constraints index, Scartascini et al.’s (Reference Scartascini, Cruz and Keefer2018) indicator for presidential political system, and Coppedge et al.’s (Reference Coppedge, Gerring, Knutsen, Lindberg, Teorell, Alizada, Altman, Bernhard, Cornell, Fish, Gastaldi, Gjerløw, Glynn, Hicken, Hindle, Ilchenko, Krusell, Lührmann, Maerz, Marquardt, McMann, Mechkova, Medzihorsky, Paxton, Pemstein, Pernes, Römer, Seim, Sigman, Skaaning, Staton, Sundström, Tzelgov, Wang, Wig, Wilson and Ziblatt2021) division of power index that captures the strength of subnational-level governments. None is statistically significant and none affects the baseline results. Models P and Q (Table S5), next, confirm that very similar results are retrieved if only national-level school closures are considered.
Fifth, to assess the sensitivity of the results to the risk of non-random inaccuracies in the data on confirmed cases, models R and S (Table S5) replicate models A and B but assume a 1-week delay and 50% under-reporting of COVID-19 cases in countries that are in the bottom decile with respect to democracy and/or government effectiveness (17% of countries). Reassuringly, the baseline results remain intact. Lastly, Figure S4 summarises the key results for 170 versions of model A and B that exclude one country at a time. The figure shows that the conclusions drawn here are not driven by any particular country.
Concluding remarks
This study has proposed a theory of how the trade-off governments make between a more precautionary and a more proportional pandemic response strategy is impacted by two institutional factors—democratic political institutions and state administrative capacity—that shape the incentives and roles of political leaders and health agency experts. The theory has then been evaluated in a global analysis of the timing of governments’ implementation of school closures in the early phase of the COVID-19 pandemic.
This evaluation shows that on average—holding the epidemiological situation and other factors constant—a higher level of democracy in a country is associated with a more precautionary response, indicated by a several days’ shorter time to school closure, whereas higher administrative capacity is associated with a more delayed implementation. The results furthermore indicate that it is the political survival logic triggered by electoral competition that drives democratic leaders’ more precautionary response, and that the expediting effect of democracy is less dominant in countries where a professional bureaucracy is involved in pandemic decision-making.
The validity and the geographical generalisability of these analyses are supported by the fact that they focus on the timing of an easily observable and widely implemented policy and includes up to 96% of the world’s countries, and that similar patterns appear for other precautionary containment policies—but not for less-disruptive health measures—in smaller samples. As such, these findings substantiate the relevance of a long-standing research tradition in political science and public administration that emphasises how political and bureaucratic institutions and their interactions shape policy-making incentives and outcomes.
It is worth commenting on how these findings relate to previous research on the state’s administrative capacity and political–bureaucratic relationships. At first sight, it might seem surprising that containment measures were implemented later in countries with higher administrative capacity, considering that a professional bureaucracy is oftentimes found positively associated both with the successful implementation of policy programs and with various social and economic outcomes (e.g. Dahlström and Lapuente Reference Dahlström and Lapuente2017; Nistotskaya Reference Nistotskaya2020). However, the findings reported here are not directly interpretable in terms of policy success or failure. What they say is merely that administrative capacity favours proportionality over precaution in pandemic response strategies; indeed, as shown in Figure 6, the less-disruptive but more administratively demanding health measures that are at heart of a proportional strategy were expectedly implemented more rapidly in countries with higher government effectiveness. In case the choice of a more proportional strategy would in turn prove to have yielded worse outcomes in such countries, it would suggest that high administrative capacity might have had an unintended side effect by spurring overconfidence among decision-makers in their ability to manage the crisis (cf. Toshkov et al. Reference Toshkov, Carroll and Yesilkagit2021). Yet, to be able to tell, we would first need to systematically analyse a variety of pandemic outcomes across countries.
Two caveats are warranted regarding the reported analyses. First, the applied model inevitably does not exhaust all observed variation, and some interesting deviant cases warrant further investigation. Especially so autocratic states with high administrative capacity, such as Bahrain, Saudi Arabia, and Qatar, where—unlike in Egypt—political leaders closed schools rather rapidly considering the pandemic situation. Second, given that this is an observational study, we cannot fully rule out endogeneity concerns, despite the efforts taken to avoid reverse causality, reduce the risk of omitted variable bias, and close in on the theorised mechanisms. Thus, causal interpretations of the observed correlations should be made with caution.
As highlighted above, a fundamental follow-up question is what the cross-national variations in pandemic strategies entails for the educational, economic, and health-related outcomes that are supposedly at stake in the trade-off between precaution and proportionality. Although the jury will likely still be out for some time, global simulations as well as initial evidence suggest that the trade-offs might be real and the consequences substantial and inequality enhancing (e.g. Haug et al. Reference Haug, Geyrhofer, Londei, Dervic, Desvars-Larrive, Loreto, Pinior, Thurner and Klimek2020; Azevedo et al., Reference Azevedo, Hasan, Goldemberg, Geven and Iqbal2021; Engzell et al. Reference Engzell, Frey and Verhagen2021). From a political science perspective, another important follow-up question is how well leaders’ strategic choices—and their consequences—are received by their respective support coalitions and in turn affect their survival in office. Answers to these questions will be not only scientifically but also practically relevant by informing the strategies that leaders adopt in future crises.
Supplementary material
To view supplementary material for this article, please visit https://doi.org/10.1017/S0143814X22000101
Data availability statement
Replication materials are available in the Journal of Public Policy Dataverse at https://doi.org/10.7910/DVN/PQ2GEQ.
Acknowledgements
An earlier version of this study was presented at Lund University and Uppsala University in April and May 2020. The author is grateful for constructive comments by participants at these seminars, as well as by the three anonymous reviewers, Rafael Ahlskog, Marcus Österman, Michal Smrek, and Erik Vestin.
Competing interests
The author declares none.
Funding information
Funding from the Swedish Research Council [grant 2018-04898] is gratefully acknowledged.


 Open access