





Nomenclature
- AM
-
additive manufacturing
- ANOVA
-
analysis of variance
- CNC
-
computer numerical control
- HV
-
Vickers microhardness
- ISO
-
International Organization for Standardization
- LPB
-
low plasticity burnishing
- RB
-
roller burnishing
- SEM
-
scanning electron microscopy
- SLM
-
selective laser melting
Greek symbol
- σ
-
normal stress, MPa
Latin symbol
- d
-
minimum specimen diameter, mm
- F
-
applied load, N
- L
-
lever arm length, mm
- n
-
number of fatigue cycles
- Ra
-
average surface roughness, µm
- R
-
stress ratio (σmin/σmax)
- Sa
-
maximum bending stress, MPa
- σa
-
stress amplitude, MPa
1.0 Introduction
In engineering components exposed to high temperatures and dynamic load conditions, superalloys with enhanced mechanical properties are of great importance. For this reason, Inconel 718 is widely used in high-technology sectors such as aerospace and energy due to its superior properties such as high temperature resistance, corrosion resistance, fatigue strength and weldability [Reference Baicheng, Xiaohua, Jiaming, Junfeng, Pan, Chen-Nan, Muiling, Guojun and Jun1, Reference Jia and Gu2]. However, despite these advantages, Inconel 718 is classified as a difficult-to-machine material because of its high strength at elevated temperatures, severe work-hardening tendency and low thermal conductivity. These characteristics promote excessive heat generation during machining, accelerate tool wear and adversely affect surface integrity, making the achievement of high surface quality particularly challenging [Reference Liu, Wan, Zhang and Yang3–Reference Petropoulos, Pandazaras, Davim and Davim7].
Low surface quality and accumulated residual stresses negatively affect the fatigue life of the material [Reference Yaman, Sunay, Kaya and Kaynak8]. To overcome the surface integrity problems generated during machining, several post-processing techniques, such as shot peening, deep rolling, laser shock peening, ultrasonic surface treatment and roller burnishing (RB), have been applied to Inconel 718 [Reference Lesyk, Martinez, Mordyuk, Pedash, Dzhemelinskyi and Lamikiz9–Reference Klotz, Delbergue, Bocher, Lévesque and Brochu13]. Among these methods, RB has attracted considerable attention because it simultaneously improves surface roughness, induces work hardening and generates beneficial compressive residual stresses without material removal. The RB process fills the peaks and valleys by allowing the material at the contact point to flow, thereby achieving a mirror-like surface. In the method, rollers in the form of hard cylinders or balls are moved over the workpiece surface with constant pressure, applying local deformation that exceeds the surface’s yield strength (Fig. 1) [Reference Çelik14]. In this way, the surface is finished without chip removal, reducing operational costs and processing time; additionally, even with limited lubrication, surface roughness can be reduced to Ra < 0.1 µm [Reference Rodriguez, de Lacalle, Pereira, Fernandez and Ayesta15].
Schematic representation of roller burnishing [Reference Çelik14].

In practical manufacturing processes, RB is considered a secondary surface treatment process applied after the component has been machined to its final geometry, rather than a primary material shaping process. RB is used to improve surface integrity by reducing surface roughness, triggering near-surface plastic deformation and improving fatigue performance without material removal.
Numerous studies in the literature investigated the effects of roller and ball burnishing methods on surface and mechanical properties. The majority of these studies demonstrate that burnishing significantly improves fatigue performance by reducing surface roughness through subsurface plastic deformation and work hardening. For example, Duncheva et al. reported that RB of AISI 304 stainless steel significantly improved surface properties and increased axial fatigue strength [Reference Duncheva, Maximov, Anchev, Dunchev, Anastasov and Argirov16]. Similarly, Çelik demonstrated that significant improvements in fatigue life were achieved after RB of the Ti6Al4V alloy, and that these improvements were mainly due to surface work hardening [Reference Çelik17]. The effects of burnishing on fatigue behaviour have been addressed, particularly in the context of crack initiation mechanisms. Thit and colleagues reported that shot burnishing via plastic deformation increased the high-cycle fatigue life of laser-deposited AISI 431 alloy, and that this improvement was directly related to changes in crack initiation behaviour [Reference Thit, Rocissano, Hatem, Uddin, Hall and Schlaefer18]. Aydın and Türköz reported that RB effectively increased the axial fatigue strength of AISI 4340 steel, emphasising that the method is a suitable surface improvement technique for high-strength steels [Reference Aydın and Türköz19]. Studies conducted specifically on Ni-based alloys also clearly demonstrate the effectiveness of the RB method. Alharbi demonstrated significant improvements in both surface integrity and fatigue life by applying electric current-assisted burnishing to Inconel 718 alloy produced by additive manufacturing [Reference Alharbi20]. Skoczylas and Zaleski reported that the combined application of shot peening and RB significantly altered the mechanism of fatigue crack initiation and improved fatigue performance [Reference Skoczylas, Zaleski, Skoczylas and Zaleski21]. Borkar et al. achieved significant improvements in surface roughness and microhardness by applying RB to rod specimens of Inconel 718 alloy and demonstrating that the method is advantageous for improving surface properties [Reference Borkar, Kamble and Seemikeri22].
In recent years, studies aimed at increasing the effectiveness of the RB method, especially on additively manufactured Inconel 718 alloy, have also attracted attention. Yaman et al. significantly improved the surface integrity of additively manufactured Inconel 718 alloy by applying RB with cylindrical rollers [Reference Yaman, Sunay, Kaya and Kaynak8]. Casarin et al. evaluated an approach of heating the workpiece before burnishing in Inconel 718 alloy and reported that samples heated with infrared radiation exhibited lower surface roughness and smaller circularity deviation compared to conventional burnishing [Reference Casarin, De Angelo Sanchez, Bianchi, Scalon, Fragelli, Godoi and Fonsencha23]. Similarly, Shen et al. developed an innovative approach to enhance surface modification by combining RB with heat treatment and ultrasonic support [Reference Shen, Gong, Wang, He, Xu and Su24].
Recently, a robotic rotary burnishing approach utilising spontaneously generated frictional heat has also been proposed for Inconel 718; in this method, thanks to the heat and plastic flow generated by the high-speed rotating burnishing tool, compressive residual stresses exceeding 1000 MPa and hardened layers deeper than 500 µm are obtained on the surface, and it has been reported that the method provides similar surface integrity gains for both forged and additively manufactured Inconel 718 [Reference Qi, Chai, Huang, Guo, Ren, Chen and Chen25].
The current literature clearly demonstrates that RB significantly reduces surface roughness in Inconel 718 alloy and consequently improves fatigue performance [Reference Yaman, Sunay, Kaya and Kaynak8, Reference Alharbi20, Reference Borkar, Kamble and Seemikeri22–Reference Shen, Gong, Wang, He, Xu and Su24]. In particular, improvements in surface integrity, plastic deformation-induced hardening and delayed fatigue crack initiation associated with burnishing-induced compressive residual stresses have been widely reported in the literature for various metallic materials [Reference Alharbi20, Reference Skoczylas, Zaleski, Skoczylas and Zaleski21, Reference Shen, Gong, Wang, He, Xu and Su26, Reference Hua, Pei, Cai, Teimouri and Liu27]. Previous investigations have also examined the influence of burnishing parameters on the surface integrity and fatigue-related properties of Inconel 718 [Reference Hua, Liu, Wang and Hou28]. While parametric studies of RB on Inconel 718 exist, the specific combination of an L16 design examining force, feed and passes on conventionally turned material with quantified ANOVA contributions to fatigue life has not been previously reported for this exact parameter range.
In this study, the effects of the RB process on the fatigue strength of Inconel 718 alloy have been systematically examined. The effects of the process parameters (burnishing force, number of passes, feed rate) on surface roughness, microhardness and fatigue strength have been determined. Additionally, ANOVA analyses were conducted to determine the statistical effects of the parameters on the outputs. Thus, by optimising the RB process, significant insights have been gained to improve the performance of Inconel 718, and the material’s potential for use in high-performance engineering applications has been strengthened.
2.0 Materials and methods
2.1 Roller burnishing tool
RB experiments were performed using a commercially available Yamato SKU-V20R/2.5R cylindrical burnishing apparatus. The apparatus consists of a single cylindrical rolling element manufactured from hardened steel with a 2.5 mm contact radius, mounted on a rigid holder and supported by precision bearings to ensure smooth rolling contact with the workpiece surface. The highly polished cylindrical burnishing roll is free to rotate about its own axis during the burnishing process, while the workpiece rotates on the lathe spindle. Thus, plastic deformation occurs through rolling contact rather than sliding action. The apparatus incorporates a calibrated internal compression spring that allows for controlled application of the normal burnishing force during the process. Since the manufacturer-provided spring stiffness constant is known, the applied burnishing force is determined from the linear force-displacement relationship. In this study, the burnishing force was treated as an independent process parameter and adjusted by compressing the spring during setup. By precisely defining the spring compression amount, the desired burnishing force levels were achieved. This approach ensured stable, repeatable and well-defined control of the applied burnishing force throughout all experiments.
2.2 Preparation of specimens
All specimens used in this study were prepared from cylindrical bars made of Inconel 718 alloy. The chemical composition of Inconel 718 consists of Ni (53.37 wt.%), Cr (18.37 wt.%), Fe (17.80 wt.%), Mo (3.04 wt.%), Nb (5.34 wt.%) and Ti (0.98 wt.%).
Specimens were machined on a TAKSAN TTC-630 CNC lathe equipped with a FANUC control unit, using TNMG160404N-EG geometry cutting inserts supplied by Sumitomo Electric, specifically designed for superalloy machining (AC5025S series). Based on preliminary experiments and the cutting tool manufacturer’s recommendations, the machining operations were performed at a cutting speed of 50 m/min, a feed rate of 0.1 mm/rev, and a depth of cut of 0.5 mm. The specimens were manufactured in accordance with ISO 1143:2021, as illustrated in Fig. 2, with a minimum gauge diameter of 4 mm and a total length of 63.4 mm. The RB process was applied to the gauge section of the fatigue specimens.
Surface roughness measurements were performed on cylindrical surfaces that were also prepared under the same machining conditions as the fatigue specimens and subjected to RB. For microhardness measurements, cross-sections were taken from the specimens after roughness measurements, and microhardness profiles were extracted from the surface to the centre. Fracture surface morphology analyses were performed on the fracture surfaces of specimens damaged as a result of fatigue tests. Thus, all measurements were conducted under comparable machining and burnishing conditions.
2.3 Experimental design
While numerous process parameters influence RB, this study considers three fundamental parameters known in the literature to be most effective and commonly controlled in industrial applications: burnishing force, feed rate and number of passes [Reference Yaman, Sunay, Kaya and Kaynak8, Reference Rodriguez, de Lacalle, Pereira, Fernandez and Ayesta15, Reference Aydın and Türköz19, Reference Borkar, Kamble and Seemikeri22]. Parameter levels were determined based on preliminary trials, tool manufacturer recommendations and practical ranges that provide effective plastic deformation without causing surface damage.
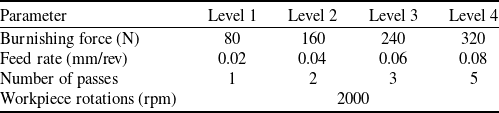
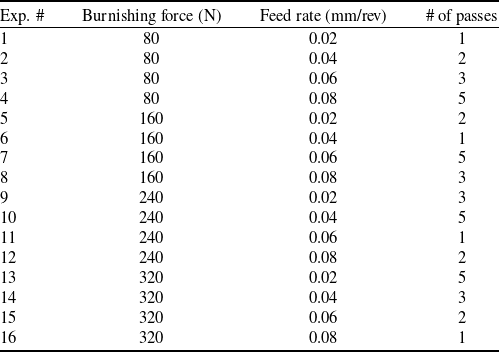
Burnishing force was selected at four levels to observe the transition between insufficient deformation and excessive surface damage. Feed rate was graded from low to high to represent the tool-surface contact time. The number of passes was determined to evaluate the effects of excessive work hardening, which was assessed through changes in near-surface microhardness and hardened layer depth, while still providing sufficient surface improvement. To keep the number of experiments at a reasonable level and systematically evaluate the effects of the parameters, the Taguchi L16 orthogonal experimental design was chosen. The selected parameter levels and experimental design are presented in Tables 1 and 2, respectively.
Factor levels

Table 1. Long description
A table comparing burnishing force, feed rate, number of passes, and workpiece rotations at four levels. The table has four rows and four columns. The column headers are Parameter, Level 1, Level 2, Level 3, and Level 4. The row labels are Burnishing force (N), Feed rate (mm/rev), Number of passes, and Workpiece rotations (rpm). Row 1: Burnishing force (N), Level 1: 80, Level 2: 160, Level 3: 240, Level 4: 320. Row 2: Feed rate (mm/rev), Level 1: 0.02, Level 2: 0.04, Level 3: 0.06, Level 4: 0.08. Row 3: Number of passes, Level 1: 1, Level 2: 2, Level 3: 3, Level 4: 5. Row 4: Workpiece rotations (rpm), Level 1: 2000, Level 2: 2000, Level 3: 2000, Level 4: 2000.
Experimental setup.

Figure 2. Long description
The image contains one photo, one diagram, and one illustration. The photo and illustration are side-by-side. The diagram is overlaid on the photo. The purpose of combining the images is to show the experimental setup for burnishing a specimen. The main subject is the burnishing process. The photo shows a close-up view of a burnishing tool in contact with a specimen. The burnishing tool is labeled, and the burnished area on the specimen is indicated. The diagram shows the dimensions of the specimen, including a length of 31.70 centimeters, a diameter of 2.0 centimeters, and a reduced diameter section of 0.9 centimeters. The illustration provides a broader view of the experimental setup, including the machine and the positioning of the specimen.
Design of experiments

Table 2. Long description
A table with four columns and sixteen rows. The columns are labeled Exp. #, Burnishing force (N), Feed rate (mm/rev), and # of passes. The rows present the following data: Row 1: Exp. # 1, Burnishing force 80, Feed rate 0.02, # of passes 1. Row 2: Exp. # 2, Burnishing force 80, Feed rate 0.04, # of passes 2. Row 3: Exp. # 3, Burnishing force 80, Feed rate 0.06, # of passes 3. Row 4: Exp. # 4, Burnishing force 80, Feed rate 0.08, # of passes 5. Row 5: Exp. # 5, Burnishing force 160, Feed rate 0.02, # of passes 2. Row 6: Exp. # 6, Burnishing force 160, Feed rate 0.04, # of passes 1. Row 7: Exp. # 7, Burnishing force 160, Feed rate 0.06, # of passes 5. Row 8: Exp. # 8, Burnishing force 160, Feed rate 0.08, # of passes 3. Row 9: Exp. # 9, Burnishing force 240, Feed rate 0.02, # of passes 3. Row 10: Exp. # 10, Burnishing force 240, Feed rate 0.04, # of passes 5. Row 11: Exp. # 11, Burnishing force 240, Feed rate 0.06, # of passes 1. Row 12: Exp. # 12, Burnishing force 240, Feed rate 0.08, # of passes 2. Row 13: Exp. # 13, Burnishing force 320, Feed rate 0.02, # of passes 5. Row 14: Exp. # 14, Burnishing force 320, Feed rate 0.04, # of passes 3. Row 15: Exp. # 15, Burnishing force 320, Feed rate 0.06, # of passes 2. Row 16: Exp. # 16, Burnishing force 320, Feed rate 0.08, # of passes 1.
2.4 Experimentation
2.4.1 Roller burnishing of specimens
According to the parameters given in Table 2, the machined fatigue specimens were roller burnished using a CNC lathe under dry conditions. During RB, the Inconel 718 workpiece was rotated by the lathe spindle, while the burnishing tool was fed along the specimen surface under the selected process conditions. The workpiece rotation speed (rpm) given in Table 2 refers to the rotational speed of the specimen during the RB operation. Figure 2 shows an illustration of the experimental setup and a technical drawing of the fatigue specimen.
2.4.2 Performing fatigue tests and fracture analysis
High-cycle fatigue tests were performed at room temperature and under fully reversible loading conditions (R = −1) using a rotary bending fatigue testing machine of the HI-TECH SCIENTIFIC brand (Fig. 3).
Rotary bending high-cycle fatigue test machine.

The relationship between the stress applied to the specimen and the load was calculated using Equation (1).
 \begin{align}{S_a} = \frac{{32FL}}{{\pi {d^3}}}\end{align}
where Sa is the greatest bending moment stress, F is the load that is applied, L is the length of the lever arm and d is the smallest beam diameter.
In light of preliminary experiments and previous studies in the literature on determining the stress to achieve a finite fatigue life, the stress was set at 700 MPa, and a load of 35 N was applied to the device [Reference Prevéy, Ravindranath, Shepard and Gabb29].
A single stress level was preferred to rank the relative effects of RB parameters on fatigue life and to determine an optimal operating range. While this experimental approach allows for controlled comparison of parameter effects, it does not provide a complete S–N (stress–life) characterisation. Changes in absolute fatigue lives and obtained recovery rates can be expected at different stress amplitudes.
In general, improvements in surface integrity (reduced surface roughness, subsurface hardening and burnishing-induced plastic deformation) have a greater effect on fatigue performance when crack initiation mechanisms are dominant – usually at lower stress levels [Reference Liu, Huang, Zhao, Wang and Sun30]. At higher stress levels, this effect may decrease due to the dominance of volume-controlled crack propagation. Therefore, while the general trends observed in this study and the predominance of burnishing force as a parameter are expected to be maintained, the optimum parameter combination and recovery rates are predicted to vary with stress level. This indicates the need for future experiments at different stress levels to create S-N curves and evaluate stress-dependent optimisation.
Fatigue tests were conducted until the specimens fractured, and the number of cycles until fracture was recorded as the fatigue life. To improve the statistical reliability and reproducibility of fatigue experiments, tests were performed with three samples per condition (n = 3). Following the fatigue tests, the fracture surfaces of the fractured specimens were analysed using a high-resolution digital microscope to investigate fatigue damage mechanisms. Fracture surface examinations were performed at 150× magnification level; crack initiation zones, fatigue crack propagation zones and final fracture zones were evaluated comparatively. These analyses were used to qualitatively determine the effects of RB on crack initiation and propagation behaviour.
2.5 Measurements
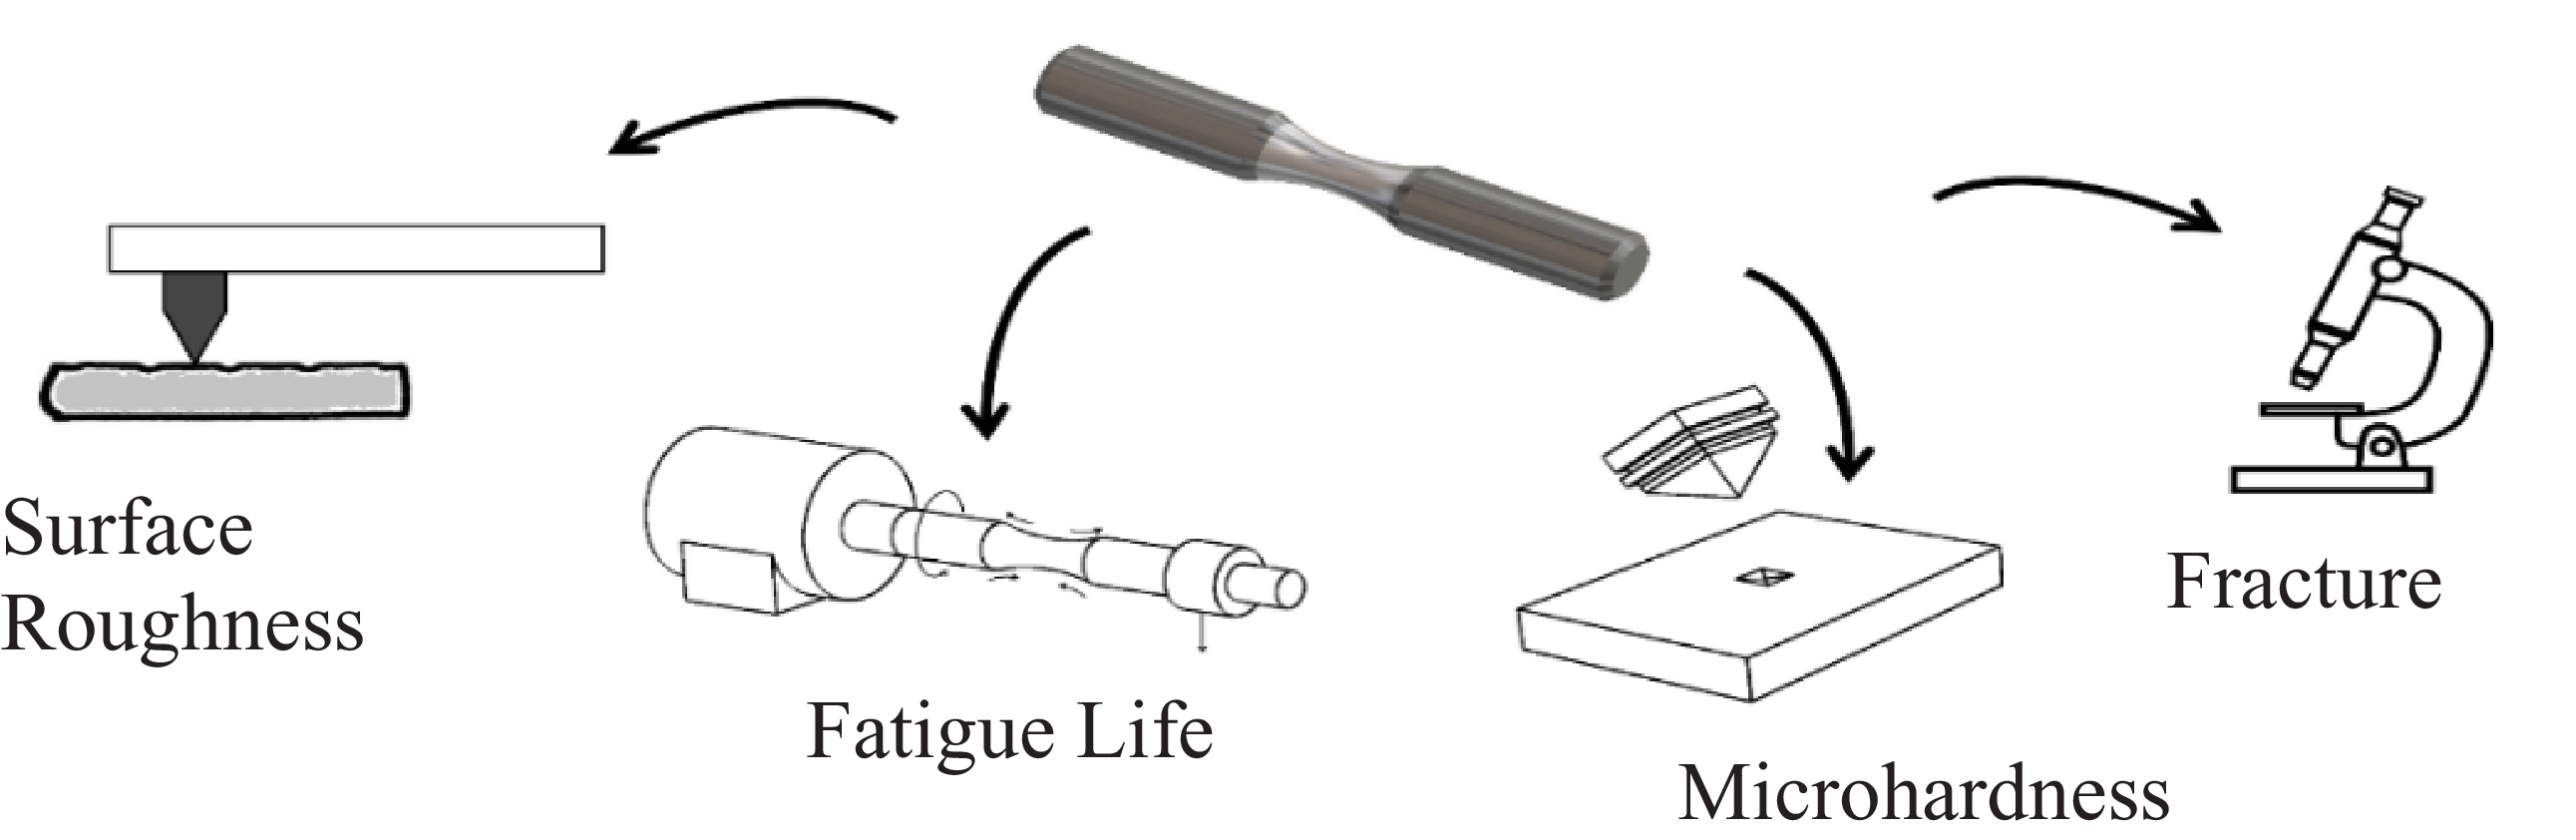
The study assessed four specific features of Inconel 718 alloy concerning the effects of the RB process. The features include surface characteristics, fatigue life, surface microhardness and fracture morphology (Fig. 4).
Measurements performed in the study.

2.5.1 Surface roughness measurements
The surface roughness values of the specimens specifically manufactured for measurement before and after the RB process were assessed using the Accretech Handysurf +45 portable skid-type contact stylus profilometer. The device employs a diamond stylus with a 5 µm tip radius and a 90° conical tip geometry for surface profile measurements. Surface roughness measurements were performed at a 5 mm sampling length and a measurement speed of 1 mm/s from three different locations parallel to the specimen axis, and the average of these measurements was recorded as the mean Ra value.
2.5.2 Microhardness Measurements
Microhardness measurements were performed using an EMCO TEST Duroscan microhardness tester under a load of 300 g (HV 0.3). For subsurface microhardness distribution measurements, the specimens were sectioned perpendicular to the burnished surface after the RB process and mounted in Bakelite. The cross-sectional surfaces were prepared by grinding with SiC abrasive papers ranging from 200 to 2000 mesh, followed by polishing on a polishing cloth using 1 µm diamond paste. After surface preparation, microhardness measurements were conducted from the burnished surface toward the specimen centre at 50 µm intervals until the bulk material hardness was reached. The depth of the hardened layer was determined from the region where the measured microhardness values gradually approached the untreated bulk hardness level.
2.5.3 Fatigue life measurements
The number of cycles to fracture for each sample during the fatigue test is measured by the counter and recorded as the fatigue life.
3.0 Experimental results
Although fatigue performance is the primary outcome of this study, surface roughness and microhardness results are presented first, as they constitute the underlying mechanisms of surface integrity governing fatigue behaviour and are therefore required for a physically meaningful interpretation of fatigue life.
3.1 Surface characteristics
Surface roughness is a measure of the geometric characteristics formed by micro-irregularities on the surface of a machine component due to the machining method, and it is generally expressed in micrometers (µm). These irregularities define the extent to which the surface deviates from the ideal geometry and are quantified using parameters such as Ra (average roughness). Surface roughness plays a critical role, especially for machine components subjected to repetitive loads, such as fatigue. Micro indentations and protrusions on the surface cause stress accumulations, making it easier for crack initiation points to form. These cracks grow over time, reducing the component’s fatigue life. Especially in high-cycle fatigue situations, surface quality is directly related to fatigue strength. Surfaces with lower roughness minimise stress concentrations and delay crack formation, thereby increasing fatigue strength. Therefore, optimising surface roughness is of great importance in extending the service life of parts subjected to fatigue, such as rotating shafts, gears and fasteners. In this context, mechanical surface improvement methods, such as RB, that reduce surface roughness are commonly used to improve the performance of such components.
Figure 5 presents the graphs of average surface roughness (Ra), roughness profiles and microscopic images of both roller-burnished and untreated specimens. The Ra value of the untreated specimen was recorded at 3.2 µm, whereas the average Ra values of the specimens after RB treatment were measured at 0.2 µm. This indicates that Ra levels have been enhanced by 93.75%. Upon examination of the roughness curves, it is evident that the peaks and valleys undergo plastic deformation, resulting in a significant reduction in surface roughness.
Comparison of surface roughness values, surface profiles and representative optical surface images of untreated and roller-burnished specimens under different experimental conditions.

Similar surface quality enhancements after RB have been reported in various superalloys and hard-to-machine materials. For instance, Lucio et al. [Reference Lucio, Escudero, del Olmo, Marin, Rodriguez and Lopez De Lacelle31] noted that RB treatment improved the surface quality by 81% on Inconel 718. Likewise, El-Taweel and El-Axir [Reference El-Taweel and El-Axir32] emphasised that low feed rates and moderate burnishing forces achieve superior surface finishes by effectively plastically deforming surface asperities without introducing surface damage.
A similar magnitude of surface roughness reduction (approximately 91.5%) was reported by Borkar et al. [Reference Borkar, Kamble and Seemikeri22] and Shen et al. [Reference Shen, Gong, Wang, He, Xu and Su26], reinforcing the effectiveness of RB for aerospace-grade Ni-based alloys.
3.2 Microhardness characteristics
Microhardness refers to the measurement of hardness under low loads applied to the surface of a material and is particularly useful for evaluating thin layers, surface treatments, and near-surface property variations. Plastic deformation processes generally lead to significant changes in hardness through work-hardening mechanisms occurring within the material. According to the literature, severe plastic deformation can promote grain refinement, increased dislocation density and strain hardening, thereby increasing microhardness [Reference Chomienne, Valiorgue, Rech and Verdu33]. In the present study, grain size and dislocation density were not directly characterised; therefore, these mechanisms are discussed only as possible explanations for the observed hardness increase based on previous studies [Reference Shell-De-Guzman, Neubauber, Flinn and Nix34, Reference Cui, Yu, Jiang, Sun, Peng, Lundgren and Moverare35]. Increased microhardness increases surface resistance to plastic deformation, thereby improving fatigue strength by making it more difficult for surface cracks to form. Therefore, plastic deformation processes are widely used not only for shaping purposes but also for improving surface properties and extending fatigue life.
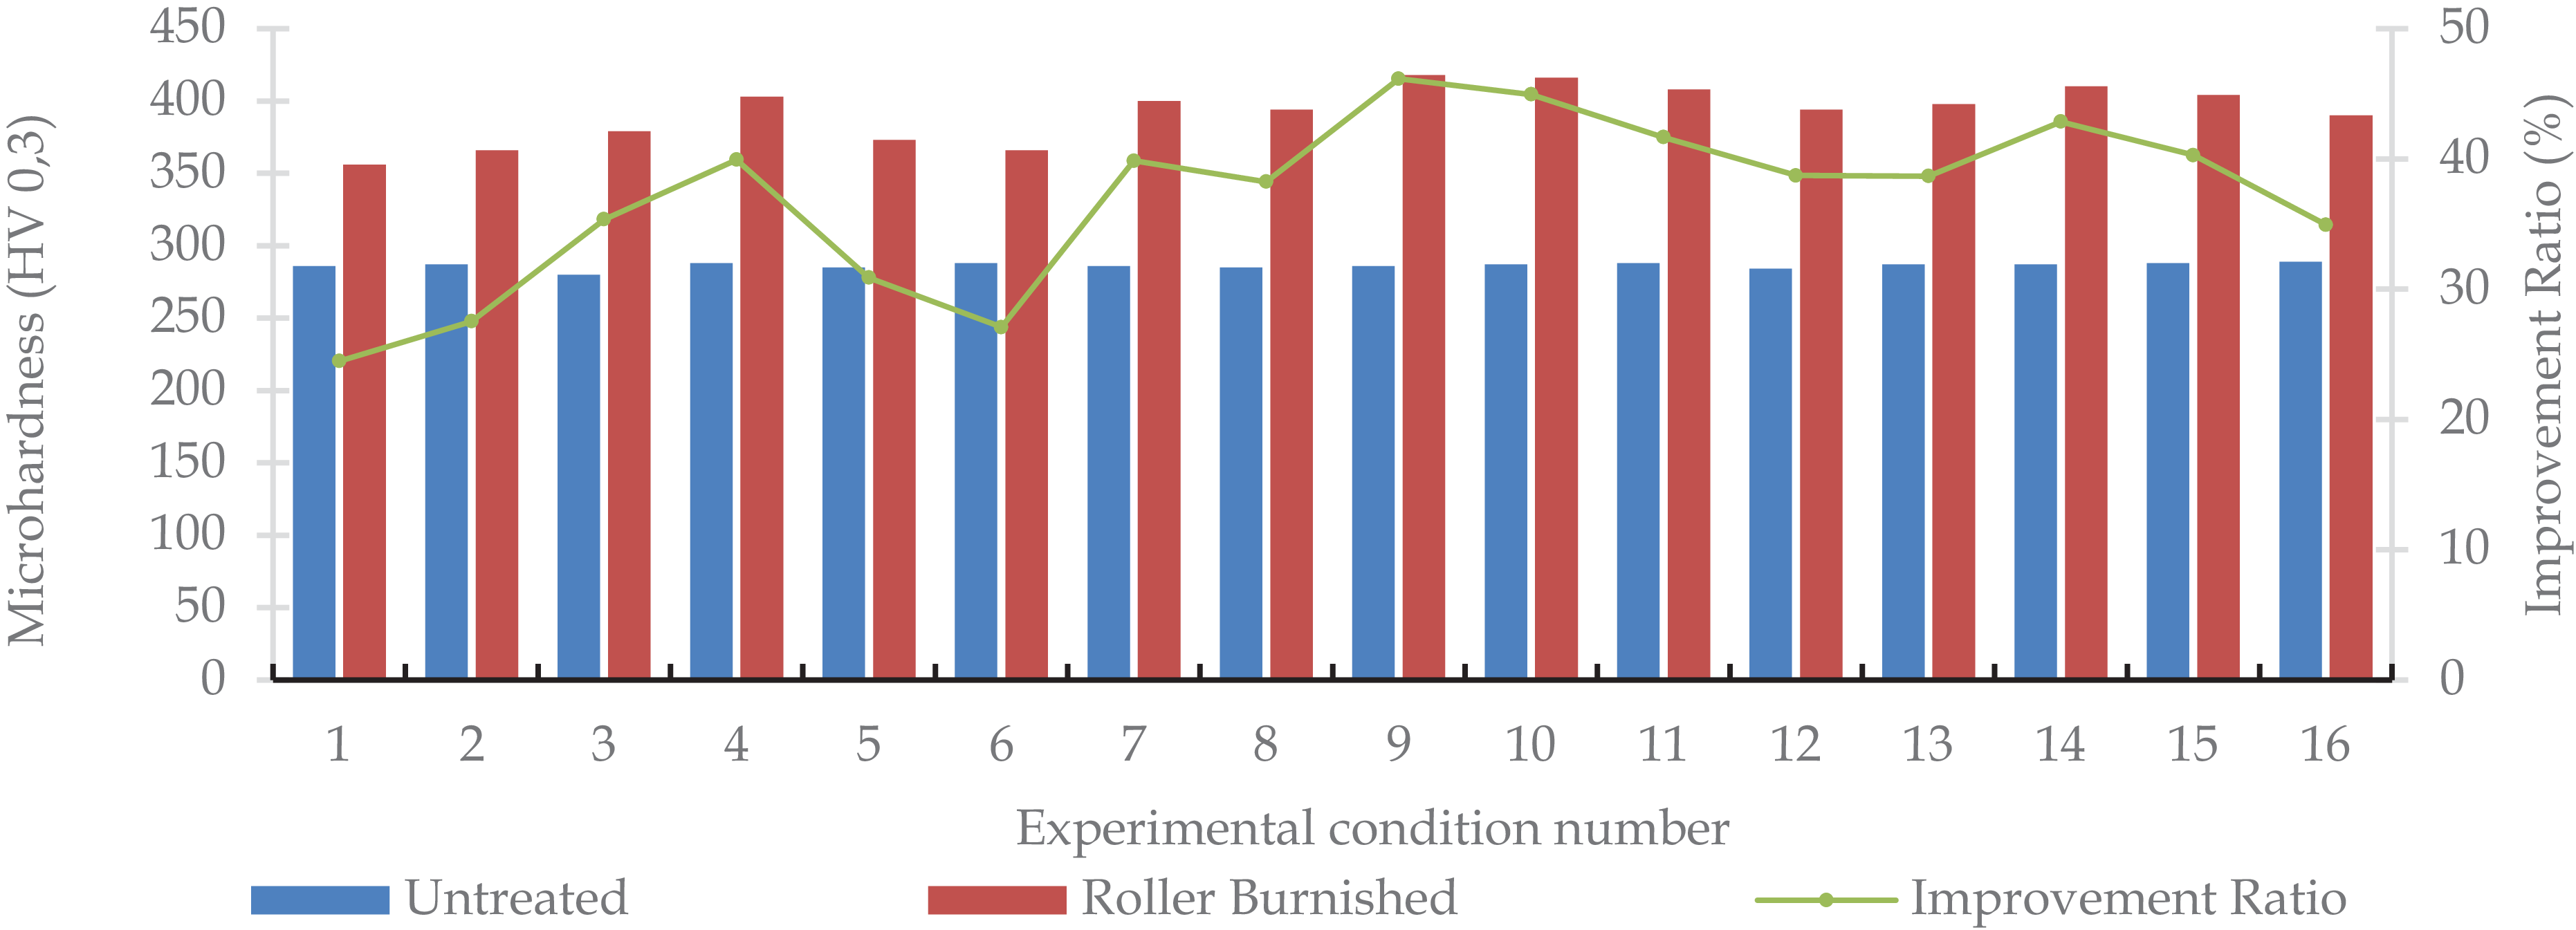
Figure 6 illustrates the variation in maximum surface microhardness values of both RB and untreated specimens. The figure shows that the RB process resulted in an average improvement of 37.3% in microhardness, reaching 46.2% under optimal experimental conditions.
Maximum microhardness values of untreated and roller-burnished specimens under different experimental conditions.

Figure 7 illustrates the subsurface microhardness distribution of the RB specimens measured from the treated surface towards the specimen centre. The microhardness near the surface increased significantly due to RB-induced plastic deformation. The variation in microhardness values extended from the workpiece surface to a depth of approximately 350–450 µm, indicating the thickness of the deformation-affected layer.
Subsurface microhardness distributions of roller burnished and untreated specimens.

The observed hardening depth (350–450 µm) is consistent with previous findings on Inconel 718 and Ti6Al4V alloys, where RB increased surface hardness by up to 37% [Reference Shen, Gong, Wang, He, Xu and Su26]. This enhanced microhardness improves wear resistance and delays crack initiation under cyclic loading [Reference Ibrahim36].
3.3 Fatigue properties
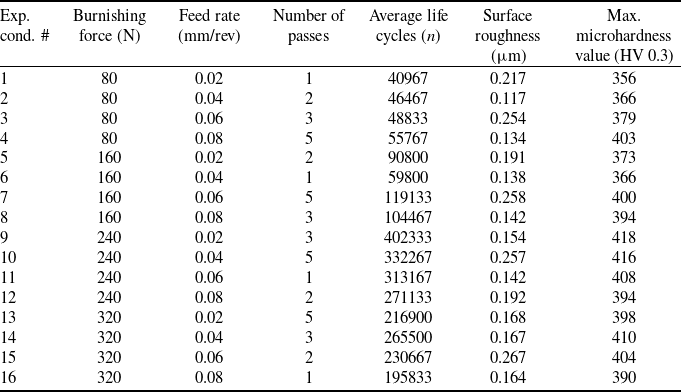
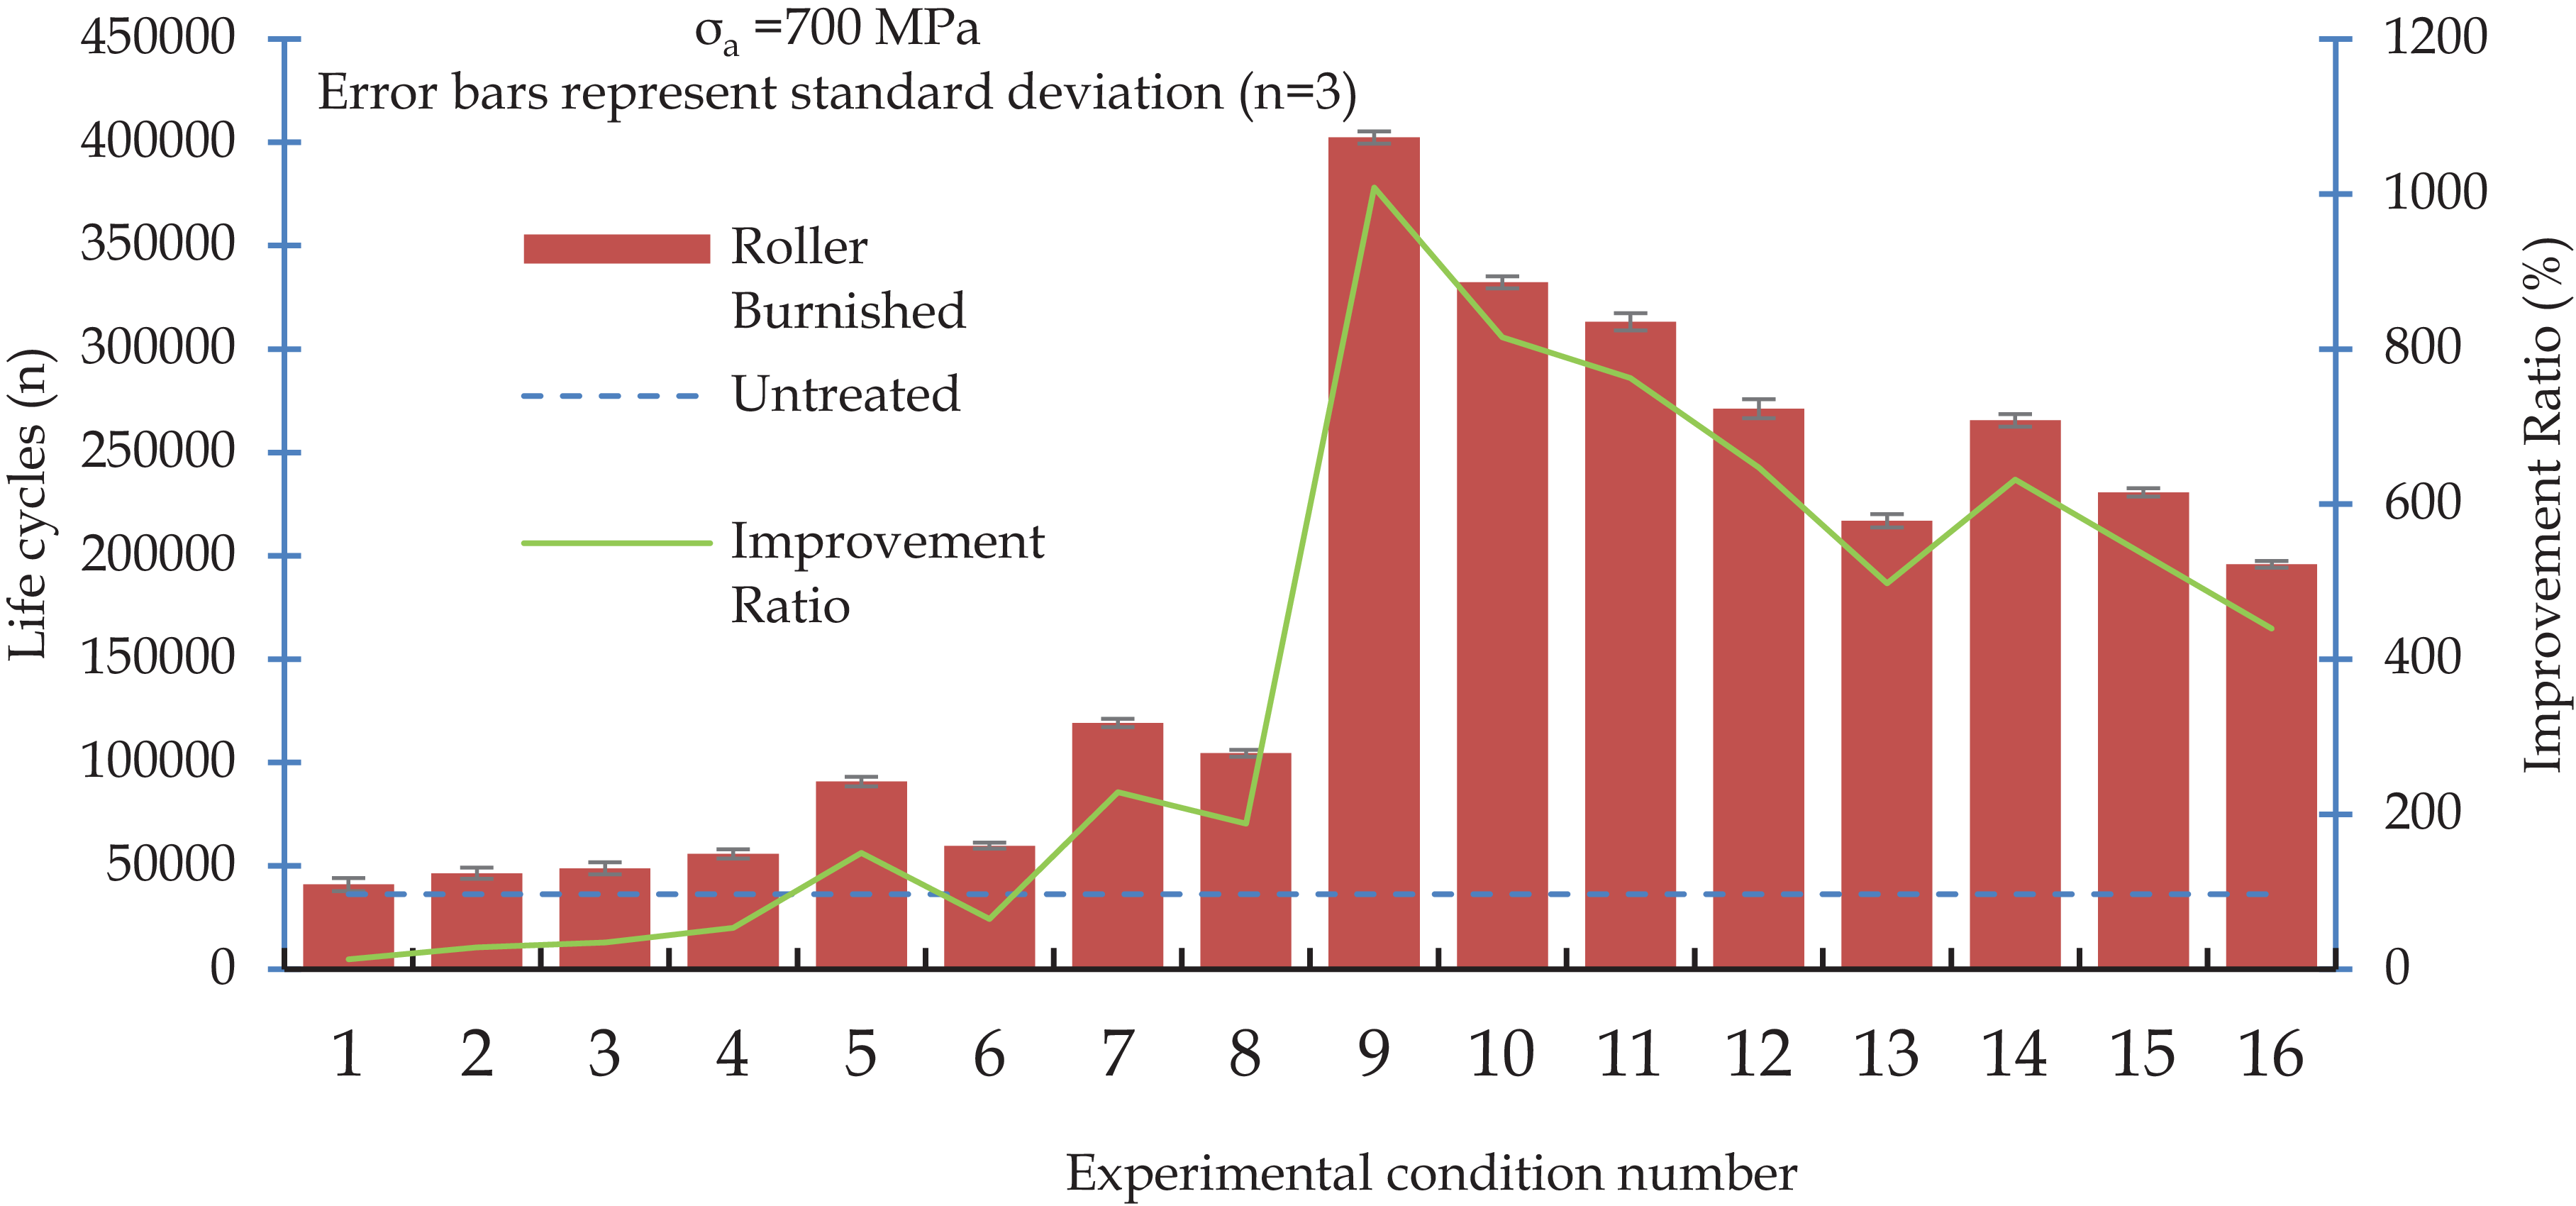
The life cycle values derived from the high-cycle fatigue test are presented in Table 3. The average fatigue life of the untreated specimen was 36,300 cycles. The RB process resulted in an average increase of 383% in fatigue life. The highest improvement ratio recorded was 1018% in the ninth trial. Fatigue life is determined by quantifying the number of cycles a specimen endures before failure under a constant dynamic load. Figure 8 illustrates the fatigue life of both roller-burnished and untreated specimens, as well as the graphical enhancement in fatigue life. Fatigue damage occurs in three fundamental stages: crack initiation, crack propagation and fracture. Fracture initiation is directly associated with surface flaws, but fracture propagation is influenced by residual stress, microstructure and hardness. Consequently, to assess the influence of any parameter on fatigue life, it is essential to additionally evaluate its impact on surface roughness and microhardness [Reference Chomienne, Valiorgue, Rech and Verdu33, Reference Yıldız37]. Table 3 also presents the surface roughness and microhardness values.
Fatigue life, surface roughness and microhardness results

Table 3. Long description
The table presents data on experimental conditions, burnishing force, feed rate, number of passes, average life cycles, surface roughness, and maximum microhardness value. It has 16 rows and 7 columns. The columns are labeled as follows: Exp. cond. #, Burnishing force (N), Feed rate (mm/rev), Number of passes, Average life cycles (n), Surface roughness (μm), and Max. microhardness value (HV 0.3). The table lists specific values for each experimental condition, detailing the burnishing force in Newtons, feed rate in millimeters per revolution, number of passes, average life cycles, surface roughness in micrometers, and maximum microhardness value in HV 0.3. Each row provides a unique set of data points for the respective experimental condition.
Fatigue life and improvement ratios of the specimens.

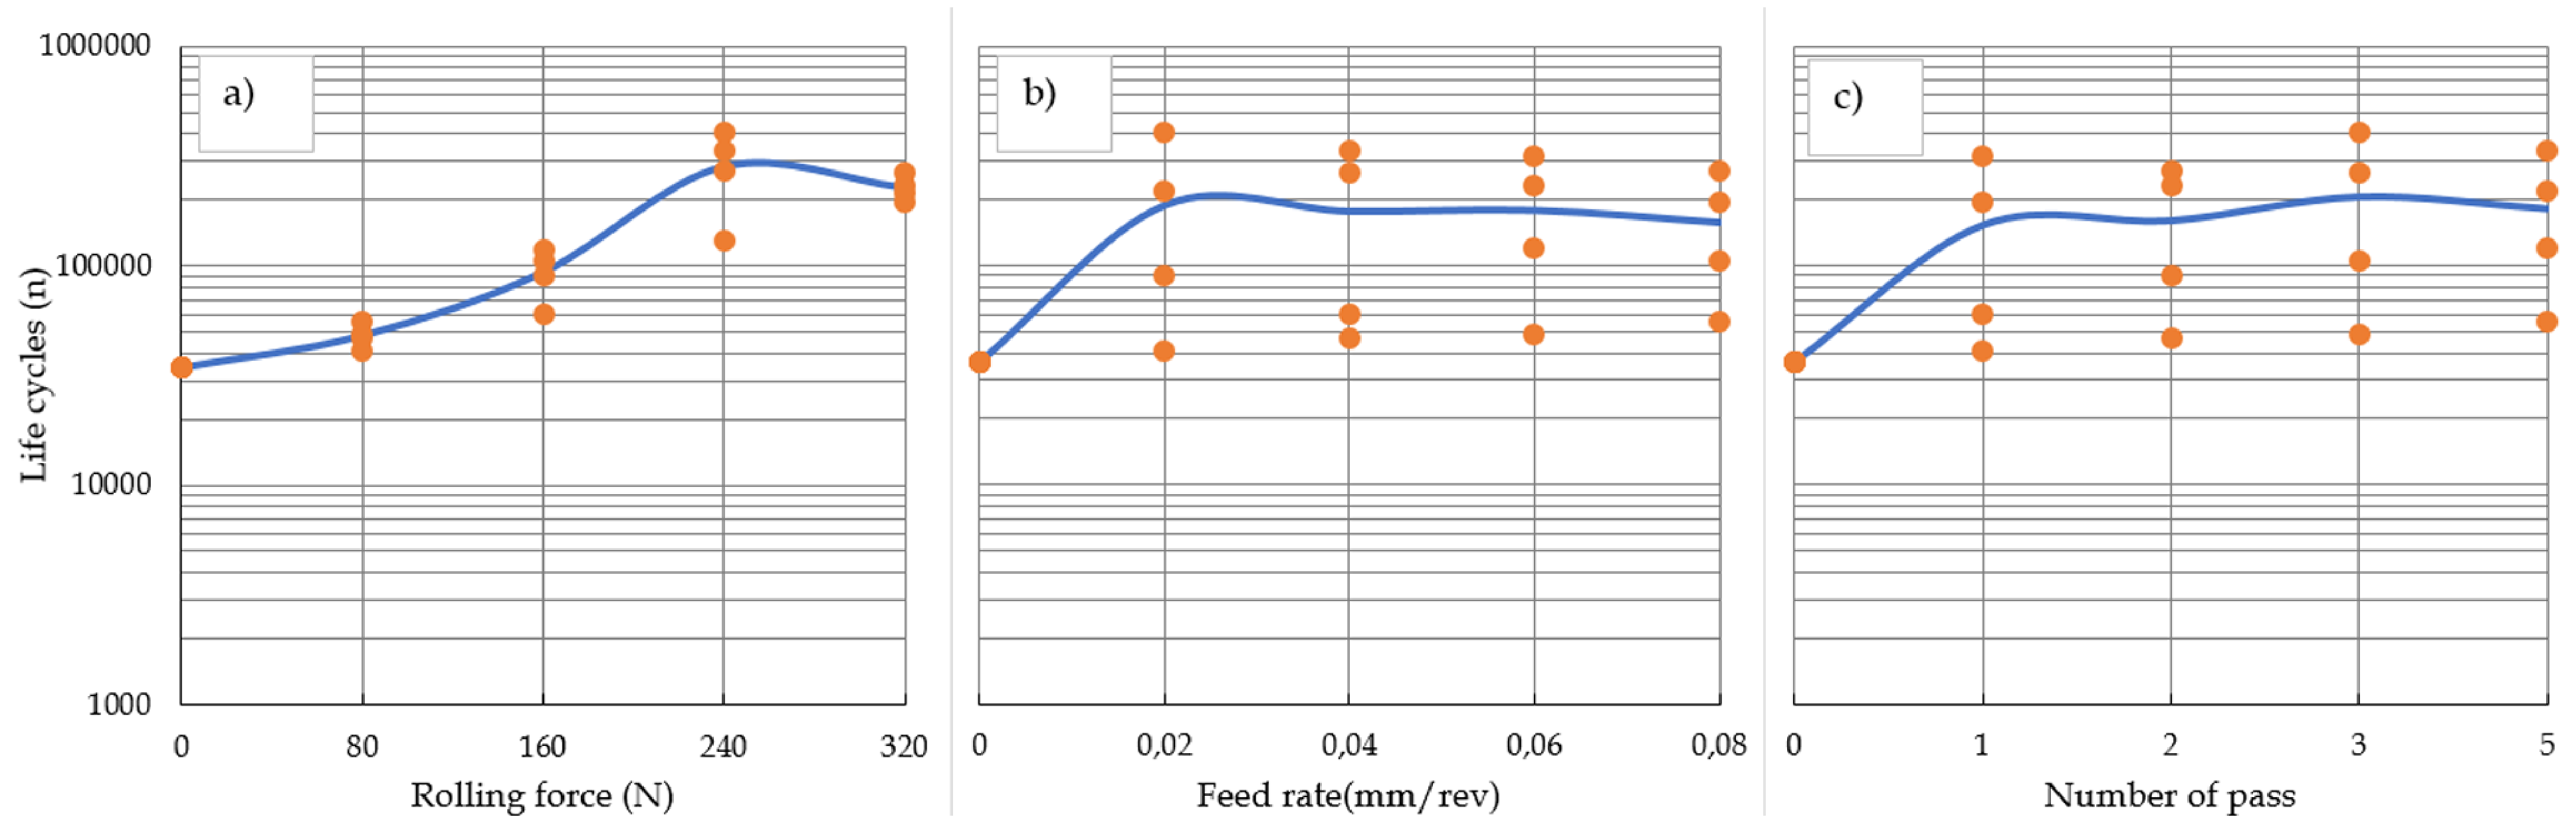
Figure 9 illustrates the effect of burnishing parameters on fatigue life at σa = 700 MPa. Fatigue life increased markedly with increasing burnishing force up to 240 N, where the maximum average fatigue life was obtained. A further increase in burnishing force to 320 N resulted in a slight reduction in fatigue life, indicating that 240 N is the optimum burnishing force under the present experimental conditions. This behaviour is attributed to excessive plastic deformation and the possible formation of surface microcracks or local surface damage at higher burnishing forces, which partially offset the beneficial effects of work hardening and compressive residual stresses [Reference Ibrahim36, Reference Celik38, Reference Zhang and Lindemann39]. The optimal rolling force for fatigue life is established at 240 N.
Fatigue life vs. RB process parameters (a) rolling force (b) feed rate (c) number of pass.

Figure 9. Long description
Three line graphs depict the relationship between fatigue life and roller burnishing process parameters. Panel A: A line graph shows the relationship between rolling force in Newtons and life cycles in revolutions. The x-axis ranges from 0 to 320 Newtons, and the y-axis ranges from 1000 to 1000000 revolutions. The data points are represented by orange circles, and a blue line indicates the trend. The trend shows an increase in life cycles with an increase in rolling force up to a certain point, after which it slightly decreases. Panel B: A line graph shows the relationship between feed rate in millimeters per revolution and life cycles in revolutions. The x-axis ranges from 0 to 0.08 millimeters per revolution, and the y-axis ranges from 1000 to 1000000 revolutions. The data points are represented by orange circles, and a blue line indicates the trend. The trend shows a slight increase in life cycles with an increase in feed rate, followed by a plateau. Panel C: A line graph shows the relationship between the number of passes and life cycles in revolutions. The x-axis ranges from 0 to 5 passes, and the y-axis ranges from 1000 to 1000000 revolutions. The data points are represented by orange circles, and a blue line indicates the trend. The trend shows an increase in life cycles with an increase in the number of passes, followed by a plateau.
Furthermore, an analysis of microhardness distributions relative to the burnishing force reveals that the maximum microhardness is achieved at 240 N, with deeper penetration throughout the burnishing process, followed by 320 N, 160 N and 80 N, respectively (Fig. 10).
Microhardness vs. RB process parameters (a) burnishing force (b) feed rate (c) number of pass.

Compressive residual stress is generally reported to increase with increasing burnishing force [Reference Chomienne, Valiorgue, Rech and Verdu33]. These conditions can act as a resistance mechanism against crack initiation and propagation, thereby explaining the observed improvement in fatigue life. During the burnishing process, severe plastic deformation occurs in the near-surface region and is commonly associated with grain refinement, increased dislocation density and work hardening effects reported in the literature. In the present study, grain size, dislocation density and residual stresses were not directly measured; therefore, their contribution is discussed only based on the established mechanisms of RB reported in previous studies. The increased microhardness improves fatigue resistance by making the initiation and propagation of surface microcracks more difficult. In addition, compressive residual stresses formed near the surface can partially counterbalance externally applied tensile stresses, thereby delaying fatigue crack initiation and propagation [Reference Meletlioğlu, Sadeler and Atasoy40–Reference Özerkan42].
On the other hand, the feed rate and number of passes parameters exhibit minimal impact on fatigue life. The subsequent subsection will conduct a statistical study of this circumstance using the analysis of variance (ANOVA) approach. Despite the feed rate parameter exhibiting comparable trends across all levels in the microhardness distribution, the optimal fatigue life value was observed at 0.02 mm/rev. An increase in feed rate reduced fatigue life. The feed rate is a characteristic that dictates the duration of roller contact with the workpiece surface. A reduced feed rate increases the likelihood that the roller will contact the workpiece surface. This guarantees more efficient rolling of the surface peaks and enhances surface quality. A lower feed rate increases the contact duration and overlap between successive roller passes on the workpiece surface. This promotes more effective plastic deformation and flattening of surface asperities, resulting in improved surface quality and lower surface roughness values [Reference El-Taweel and El-Axir32].
A superior surface quality positively influences fatigue life by mitigating the notch effect. Upon analysing the surface roughness values in Table 3 and Fig. 5, it is evident that optimal surface quality is achieved with one or five passes; however, the highest surface microhardness is attained with three or five passes. While the RB process, which has a more profound impact, is evident in studies involving five passes, an analysis of surface quality and microhardness values indicates that the optimal fatigue life level is three passes.
Although the five passes condition produced a deeper hardened layer, excessive repeated deformation may have led to unfavourable surface and subsurface conditions. Therefore, the optimal fatigue performance was obtained with three passes, resulting in a more balanced combination of surface hardening and surface integrity.
3.4 ANOVA test
ANOVA is a theoretically simple and reliable method widely used for statistically comparing two or more groups. In this study, fatigue life tests were conducted with three independent specimens per experimental condition to account for the inherent scatter in fatigue data and improve statistical reliability. Subsequently, a multifactorial (main effects focused) ANOVA analysis was performed to statistically examine the effects of RB process parameters on fatigue life, surface roughness and maximum microhardness. Before the analysis, a normality test was applied to evaluate the suitability of the data for ANOVA. According to the normality test, p > 0.05 was obtained for all response variables, indicating that the data satisfied the assumption of normality [Reference Smalheiser43].
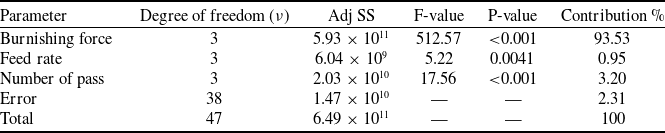
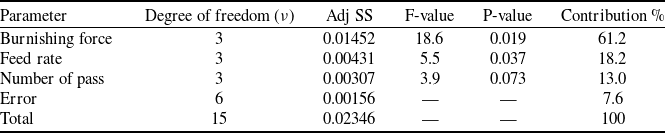
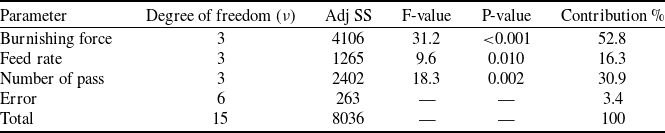
ANOVA results are presented in Tables 4, 5 and 6. In the statistical significance assessment, a p-value < 0.05 was accepted as the significance threshold. When the results obtained for fatigue life (life cycle) are examined, it is seen that the burnishing force was the dominant factor affecting fatigue life, accounting for 93.53% of the total variation (p < 0.001). The number of passes also had a statistically significant effect, contributing 3.20% (p < 0.001). Although feed rate was statistically significant (p = 0.004), its contribution remained limited to 0.95%. The low error contribution (2.31%) indicates good repeatability and reliability of the fatigue experiments. Therefore, fatigue performance was primarily governed by the applied burnishing force, while the effects of feed rate and number of passes were comparatively minor.
ANOVA results of the experiments for fatigue life

Table 4. Long description
A table with ANOVA results for fatigue life experiments. The table has six columns: Parameter, Degree of freedom, Adj SS, F-value, P-value, and Contribution percent. It has seven rows including the header row. Row 1: Parameter, Degree of freedom, Adj SS, F-value, P-value, Contribution percent. Row 2: Burnishing force, 3, 5.93 x 10^11, 512.57, <0.001, 93.53. Row 3: Feed rate, 3, 6.04 x 10^9, 5.22, 0.0041, 0.95. Row 4: Number of pass, 3, 2.03 x 10^10, 17.56, <0.001, 3.20. Row 5: Error, 38, 1.47 x 10^10, --, --, 2.31. Row 6: Total, 47, 6.49 x 10^11, --, --, 100. The table shows the statistical significance and contribution of different parameters on fatigue life.
Significance level: 0.05.
ANOVA results of the experiments for surface roughness

Table 5. Long description
A table with six rows and five columns presenting ANOVA results for surface roughness experiments. The columns are labeled Parameter, Degree of freedom (ν), Adj SS, F-value, P-value, and Contribution %. The rows list Burnishing force, Feed rate, Number of pass, Error, and Total. Burnishing force has a degree of freedom of 3, an adjusted sum of squares of 0.01452, an F-value of 18.6, a P-value of 0.019, and a contribution percentage of 61.2. Feed rate has a degree of freedom of 3, an adjusted sum of squares of 0.00431, an F-value of 5.5, a P-value of 0.037, and a contribution percentage of 18.2. Number of pass has a degree of freedom of 3, an adjusted sum of squares of 0.00307, an F-value of 3.9, a P-value of 0.073, and a contribution percentage of 13.0. Error has a degree of freedom of 6, an adjusted sum of squares of 0.00156, and a contribution percentage of 7.6. Total has a degree of freedom of 15, an adjusted sum of squares of 0.02346, and a contribution percentage of 100.
Significance level: 0.05.
ANOVA results of the experiments for surface microhardness

Table 6. Long description
The table presents ANOVA results for surface microhardness experiments. It has six rows and five columns. The columns are labeled Parameter, Degree of freedom, Adj SS, F-value, P-value, and Contribution percent. The rows are labeled Burnishing force, Feed rate, Number of pass, Error, and Total. Row 1: Burnishing force, 3, 4106, 31.2, less than 0.001, 52.8 percent. Row 2: Feed rate, 3, 1265, 9.6, 0.010, 16.3 percent. Row 3: Number of pass, 3, 2402, 18.3, 0.002, 30.9 percent. Row 4: Error, 6, 263, not applicable, not applicable, 3.4 percent. Row 5: Total, 15, 8036, not applicable, not applicable, 100 percent.
Significance level: 0.05.
In the ANOVA analysis of surface roughness (Ra), burnishing force remained the most dominant parameter, while feed rate also showed a statistically significant effect. The effect of the number of passes was more limited and approached the significance threshold. This situation can be explained by the fact that surface roughness after the RB process is already clustered within a narrow range, and the effects of parameter variations on this low band remain limited.
The ANOVA results for maximum microhardness revealed that, unlike surface roughness, the number of passes, along with burnishing force, is a statistically significant parameter. This finding shows that microhardness is sensitive not only to instantaneous contact pressure but also to cumulative plastic deformation. The effect of feed rate on microhardness remained secondary.
Although the ANOVA results clearly show that burnishing force is the dominant parameter for all response variables in terms of main effects, the interaction graphs show that feed rate and number of passes can exhibit secondary interactions under certain conditions. At low burnishing forces, the effects of changes in feed rate and the number of passes on fatigue life are limited, indicating a weak interaction regime (Figs 11–13). In contrast, at high burnishing forces, increasing the number of passes improves fatigue performance to a certain level; especially when this level is exceeded with high feed rates, a performance decrease is observed. This behaviour can be interpreted as a shift from a synergistic interaction where repeated deformation supports surface smoothness and homogeneous hardening, to an antagonistic interaction where combinations of excessive pass count and high feed rates lead to local over-hardening and surface damage.
Interaction plots for fatigue life.

Interaction plots for surface roughness.

Figure 12. Long description
The image contains three line graphs showing the interaction plots for surface roughness. Each graph represents different combinations of burnishing force and feed rate against the number of passes. The x-axis of each graph represents the number of passes, while the y-axis represents surface roughness in micrometers. The graphs are labeled with different burnishing forces and feed rates. Panel A shows the interaction plot for a burnishing force of 80 N, Panel B for 160 N, and Panel C for 240 N. Each graph includes data points for feed rates of 0.02, 0.04, 0.06, and 0.08 mm/rev, represented by different symbols and colors. The trends and patterns in the graphs indicate how surface roughness varies with the number of passes for different burnishing forces and feed rates.
Interaction plots for microhardness.

In this study, the interpretation of the main effects and interaction trends is based on first identifying the dominant parameters and then discussing the secondary interactions to guide process optimisation. This approach is an evaluation strategy that allows for the interpretation of statistical trends in production processes even without applying a complete response surface modeling and is widely used in similar manufacturing studies in the literature [Reference Kumar, Acherjee, Ghose and Chattopadhyaya44, Reference Acherjee, Misra, Bose and Venkadeshwaran45].
3.5 Fracture
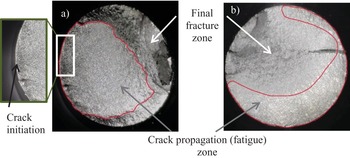
The fractured surfaces of the untreated and roller-burnished specimens were examined using a high-resolution digital microscope. Figure 14 displays the fracture surfaces of the untreated specimen and the ninth specimen, which exhibits the longest fatigue life of 402,333 cycles.
Fracture surface of the specimens (a) ninth specimen (b) untreated specimen.

Upon examination of Fig. 14, it is evident that the fatigue area of the untreated specimen is inferior to that of the burnished specimen. In contrast, the transition between the fatigue zone and the final fracture zone in the burnished specimen is distinctly observable, whereas it is less defined in the untreated specimen. This may be attributed to the untreated specimen fracturing after fewer cycles, thereby diminishing regional distinctiveness due to friction.
4.0 Discussion
In recent studies on RB of Inconel 718, most discussions focus on general trends in fatigue improvement. In this context, the present work provides a parameter-based, statistically supported assessment of fatigue behaviour. The ANOVA results show that burnishing force plays a decisive role, explaining 93.53% of the variation in fatigue life, while feed rate and number of passes have a comparatively limited influence. This finding provides practical guidance for selecting process parameters and optimising fatigue performance.
The mechanical, surface integrity and fatigue results obtained in this study clearly demonstrate that RB significantly enhances the surface integrity and high-cycle fatigue performance of conventionally machined Inconel 718. The considerable reduction in surface roughness (93.75%), together with the formation of a plastically deformed layer extending approximately 350–450 µm below the surface, indicates that the process induces severe plastic deformation and near-surface work hardening. These surface modifications are also evident in the digital optical microscope images (Fig. 5), which reveal a more homogeneous surface morphology after burnishing. Similar improvements in surface integrity have been reported for Inconel 718 and other high-strength alloys, where RB reduces surface asperities, homogenises the surface profile, and promotes strain hardening [Reference Borkar, Kamble and Seemikeri22, Reference Shen, Gong, Wang, He, Xu and Su24, Reference Lucio, Escudero, del Olmo, Marin, Rodriguez and Lopez De Lacelle31, Reference El-Taweel and El-Axir32]. Although comparable reductions in surface roughness have been reported by Lucio et al. [Reference Lucio, Escudero, del Olmo, Marin, Rodriguez and Lopez De Lacelle31] and Shen et al. [Reference Shen, Gong, Wang, He, Xu and Su24], the improvement achieved in the present study exceeds most previously published values, which may be attributed to the selected burnishing parameter range and stable tool–workpiece interaction provided by the CNC turning setup.
The observed increase in microhardness after RB, reaching 46.2% at optimal settings, is consistent with the work-hardening mechanism associated with plastic deformation. Similar hardening responses have also been reported for Inconel 718 and Ti6Al4V alloys [Reference Çelik17, Reference Shen, Gong, Wang, He, Xu and Su24]. The deformation depth measured in this study (350–450 µm) is also consistent with other publications involving high burnishing pressures or low plasticity burnishing (LPB)-type processes [Reference Alharbi20, Reference Chomienne, Valiorgue, Rech and Verdu33]. Although increased near-surface microhardness contributes positively to fatigue resistance, the improvement in fatigue performance cannot be attributed solely to changes in hardness. Surface roughness, near-surface work hardening and the beneficial compressive residual stresses commonly associated with RB also play important roles in delaying crack initiation and propagation.
The improvement in fatigue life observed after RB can be attributed primarily to near-surface work hardening and overall surface integrity improvement. The increase in microhardness reflects severe plastic deformation and plastic strain accumulation in the near-surface layer, thereby increasing resistance to cyclic deformation and delaying crack initiation. Although residual stresses were not directly measured in the present study, the observed increase in microhardness, deformation depth and fatigue life suggests that fatigue enhancement results from the combined effects of near-surface hardening and surface integrity modification. Therefore, the role of residual stresses is discussed only as an expected consequence of the burnishing process based on established findings reported in the literature [Reference Kaya, Yaman, Taşcioğlu and Kaynak46–Reference Kumari, Kanishka and Acherjee49].
It should also be noted that the measured hardened layer depth of approximately 350–450 µm represents only a small fraction of the specimen cross-section. Therefore, its influence on fatigue behaviour is associated primarily with surface-controlled crack initiation mechanisms rather than changes in the bulk material response. Consequently, while the present results are directly applicable to components of comparable dimensions, caution should be exercised when extending these findings to thin-walled structures.
When considering RB parameters, feed rate and number of passes exhibit secondary effects that primarily influence the duration and frequency of surface contact, rather than the magnitude of the applied contact stress. At a given burnishing force, variations in feed rate mainly alter the local contact time, while additional passes increase the accumulated plastic strain up to a saturation level. Once a sufficiently hardened surface layer has formed, further increases in contact time or repeated passes contribute little to additional hardening and may even promote irregular deformation.
At very high burnishing forces, the benefits of surface smoothing and work hardening may begin to diminish. Excessive contact pressure can cause localised over-deformation in the near-surface layer, leading to uneven hardening and pronounced hardness gradients. While these conditions tend to create localised stress concentrations, surface features such as exfoliation and microcracks observed at peak force levels can serve as preferred areas for crack formation during cyclic loading. While an increase in burnishing force is generally expected to increase compressive residual stresses, excessive deformation can disrupt their uniformity and cause localised stress relaxation in damaged areas. Taken together, the presence of surface micro-damage, uneven hardening and varying residual stress distributions provides a consistent explanation for the decrease in fatigue life observed at excessive burnishing forces. The superior fatigue performance at 240 N burnishing force confirms the existence of an optimal burnishing force range reported in previous studies [Reference Zhang and Lindemann39, Reference Klocke and Liermann50].
Despite the limitations associated with excessive burnishing loads, the overall fatigue performance improvements achieved through RB remain remarkable. Average fatigue life increased by 383%, while improvements exceeding 1000% were obtained under the optimum burnishing conditions. Although this exceptionally great improvement is partly associated with the relatively poor initial surface integrity of the untreated machined specimens, repeated fatigue experiments (n = 3) confirmed the reproducibility of the observed trend. As detailed above, this substantial enhancement stems from the combined effects of improved surface topography and sub-surface strain hardening. These findings are consistent with established observations that improved surface integrity reduces stress concentrations and delays fatigue crack initiation and propagation [Reference Zhang and Lindemann39, Reference Meletlioğlu, Sadeler and Atasoy40, Reference Özerkan42].
Fractographic analysis also supports these conclusions. Burnished specimens exhibit wider fatigue zones and clearer transitions between the crack initiation and final fracture regions, indicating slower crack growth and a delayed transition from Stage I to Stage II fatigue. This is in line with the mechanisms described by Thit et al. [Reference Thit, Rocissano, Hatem, Uddin, Hall and Schlaefer18] and Alharbi [Reference Alharbi20], where improved surface integrity altered crack initiation sites and residual stress fields. Untreated specimens, on the other hand, exhibit smaller, more irregular fatigue regions, characteristic of components failing after fewer cycles.
Several limitations of the present study should be acknowledged. First, fatigue testing was conducted at a single stress amplitude (σ a = 700 MPa, R = −1), which does not allow the construction of a complete S–N curve and therefore limits the results to a comparative evaluation of fatigue performance under the selected loading condition. Second, residual stresses were not directly measured; consequently, their role is discussed only as an expected outcome of the RB process based on established findings reported in the literature. Third, all experiments were performed under laboratory conditions at room temperature using cylindrical fatigue specimens. Therefore, although the identified mechanisms and parameter trends are expected to remain valid, the magnitude of the fatigue improvement may vary under different stress amplitudes, elevated temperatures, complex loading conditions or component geometries. Future studies should include direct residual stress measurements, multiple stress levels and representative service conditions to provide a more comprehensive understanding of the fatigue behaviour of roller-burnished Inconel 718.
Overall, the present study provides a detailed, parameter-dependent interpretation of the RB–fatigue relationship for conventionally machined Inconel 718. The findings strengthen the growing consensus in the literature that RB is a highly effective fatigue-enhancement technology for Ni-based superalloys, and they further quantify the statistical significance of key parameters and demonstrate the existence of a clear optimal burnishing regime.
5.0 Conclusion
This study examined the influence of RB parameters on surface integrity and high-cycle fatigue behaviour of conventionally machined Inconel 718. The experimental results lead to the following conclusions.
-
• RB significantly improved the surface quality of Inconel 718 specimens. The lowest surface roughness value was 0.117 µm with a burnishing force of 80 N, a feed rate of 0.04 mm/rev and two passes. Compared to the untreated condition, the surface roughness decreased from 3.2 µm to 0.117 µm, corresponding to an improvement of approximately 96.25%.
-
• The RB process considerably increased the near-surface microhardness due to severe plastic deformation and work hardening effects. The maximum microhardness increased from 288 HV to 418 HV with a burnishing force of 240 N, a feed rate of 0.02 mm/rev, and three passes, corresponding to an improvement of approximately 45.1%. In addition, a plastically deformed, hardened layer extending to approximately 350–450 µm in depth was observed after the burnishing process.
-
• RB substantially enhanced the high-cycle fatigue performance of Inconel 718. The highest fatigue life was obtained with a burnishing force of 240 N, a feed rate of 0.02 mm/rev, and three passes, reaching 405600 cycles. Compared with untreated specimens, fatigue life improvements exceeding 1000% were achieved, with an average improvement of 383%. However, excessively high burnishing force levels (greater than 240 N) and repeated deformation (more than three passes) may lead to unfavourable surface and subsurface conditions, resulting in deterioration of fatigue performance.
-
• Statistical evaluation using ANOVA revealed that burnishing force is the dominant process parameter affecting fatigue life, accounting for 93.53% of the total variation. In general, increasing the burnishing force and decreasing the feed rate improved fatigue performance by enhancing surface smoothing and plastic deformation. However, excessively high burnishing force levels and repeated deformation may lead to unfavourable surface and subsurface conditions, resulting in deterioration of fatigue performance.
-
• In addition, since the fatigue experiments were conducted at a single stress amplitude, the obtained results do not represent a complete S–N characterisation of the material. Therefore, future studies with varying stress amplitudes are required to establish comprehensive S–N curves and to evaluate stress-dependent fatigue behaviour.
Overall, the findings confirm that RB is an effective secondary surface finishing technique for improving the fatigue performance of Inconel 718, provided that key process parameters are carefully controlled and optimised.
Acknowledgements
During the preparation of this work, the author used ChatGPT (OpenAI) and Grammarly for language editing and proofreading purposes. After using this tool/service, the author(s) reviewed and edited the content as needed and take(s) full responsibility for the content of the published article.
Financial support
This work was supported by Erciyes University Projects of Scientific Investigation Unit (FKB-2021-11178). Conflict of interest: the author has no relevant financial or non-financial interests to disclose.









 Open access

