


Introduction
This article uses data on 67,000 articles published in 100 high-impact political science journals in the twenty years between 2000 and 2019 to analyse the publication output of national scholarly communities. Highly regarded journals have a wide readership and international circulation and are commonly referred to as “international journals.” Publishing in such journals means contributing to the international scientific scholarship. For these reasons, patterns of publishing in international journals can be analysed as possible indicators of internationalisation (see Tronconi and Engeli in this symposium) — although clearly just one among many (and see also Engeli et al.).
Bibliographic data permit the analysis of publications at the level of journals, articles, authors, academic institutions, and countries. This article focuses on the country level to provide a bibliometric analysis of the internationalisation of European political science against the background of the global scientific production. For each country, or national scholarly community, I use two simple indicators of internationalisation: articles published in the journals selected for this study; and co-authorship of publications, within the same set of journals, with scholars based in different countries. I analyse both indicators in turn and then look more closely into patterns of international authorships through social network analysis.
This approach has some limitations. First, books and book chapters are excluded from this analysis, but they are still highly cited in political science (Jensen and Moses Reference Jensen and Moses2021). Second, the journals selected for analysis are not a random sample of journals in the field, but those with the higher five-year impact factor according to the 2020 Journal Citation Report of the Web of Science. The broader community of scholars that publish primarily in other outlets may pursue different paths to internationalisation. Third, the selected journals publish articles in English, and one may argue that this biases the analysis in favour of scholars working in English-speaking countries. Moreover, other internationalised (or regionalised) communities—for example, those publishing in Spanish—would not be captured by this analysis.
These limitations notwithstanding, publications in high-impact academic journals do provide a relevant perspective to the internationalisation of political science. Publishing in highly regarded international journals is central to academic careers and to the measurement of academic performance (Grossman Reference Grossman2020), and it also means contributing to the international scientific debate. Scholarly communities in English-speaking countries are indeed dominant in these journals. But English is the lingua franca of science, so the language bias is probably unavoidable in a study of internationalisation. By focussing on a large sample of leading journals, this study should still “capture the core of the discipline” (Metz and Jäckle Reference Metz and Jäckle2017, 157)—arguably its most internationalised core.
By mapping a significant part of the international scientific production of a large number of countries over two decades, and describing patterns of international collaboration, this article expands upon the niche of studies using bibliometric analysis to assess the status of political science. Political scientists have “a tradition of reflecting on the evolution and state of their discipline” (Fisher et al. Reference Fisher, Cobane, Ven Vander and Cullen1998, 847). Relevant contributions have focussed on the analysis of subdisciplines, such as public administration (Forrester Reference Forrester1996), international relations (Kristensen Reference Kristensen2012), or EU studies (Keeler Reference Keeler2005; Jensen and Kristensen Reference Jensen and Kristensen2013). Gender biases (Williams et al. Reference Williams, Bates, Jenkins, Luke and Rogers2015; Closa et al. Reference Closa, Moury, Novakova, Qvortrup and Ribeiro2020; Grossman Reference Grossman2020), single national scholarly communities (e.g. Plümper and Radaelli Reference Plümper and Radaelli2004; Leifeld et al. Reference Leifeld, Wankmüller, Berger, Ingold and Steiner2017) or regional groupings such as Central and Eastern Europe (Jokić et al. Reference Jokić, Mervar and Mateljan2019) also have been the object of some important studies (for a more recent, in-depth discussion of the internationalisation of political science in Central and Eastern Europe, see Kapidžić et al. in this symposium).
Recent bibliometric studies include some contributions to a special symposium in this journal, a focus on influential books and articles (Jensen and Moses Reference Jensen and Moses2021), long-term analyses of the articles published in the journals of the European scholarly associations (Ghica Reference Ghica2021), and other articles published in this journal since its launch (Mas-Verdu et al. Reference Mas-Verdu, Garcia-Alvarez-Coque, Nieto-Aleman and Roig-Tierno2021). Indeed, single journals can provide a relevant perspective on patterns of developments within the discipline, factors of success, and biases; also from the side of editorial work (Closa et al. Reference Closa, Moury, Novakova, Qvortrup and Ribeiro2020). Contributions taking a bibliographic network analysis approach (Batagelj and Cerinšek Reference Batagelj and Cerinšek2013) still represent a small, but growing, share of bibliometric studies in political science (Kristensen Reference Kristensen2012; Leifeld et al. Reference Leifeld, Wankmüller, Berger, Ingold and Steiner2017; Mas-Verdu et al. Reference Mas-Verdu, Garcia-Alvarez-Coque, Nieto-Aleman and Roig-Tierno2021; Jensen and Kristensen Reference Jensen and Kristensen2013; Russett and Arnold Reference Russett and Arnold2010; Metz and Jäckle Reference Metz and Jäckle2017).
The article proceeds as follows. The next section presents the dataset. In the findings section, I first provide some descriptive indicators of the contributions of national scholarly communities to the analysed scientific production, and of the involvement in international collaborative publications. I then present a network analysis of international collaborations. In both the descriptive and network analysis sections, I slice the data in two decades—2000–2009 and 2010–2019—to observe the change in patterns of publications and collaborations over time.
Data
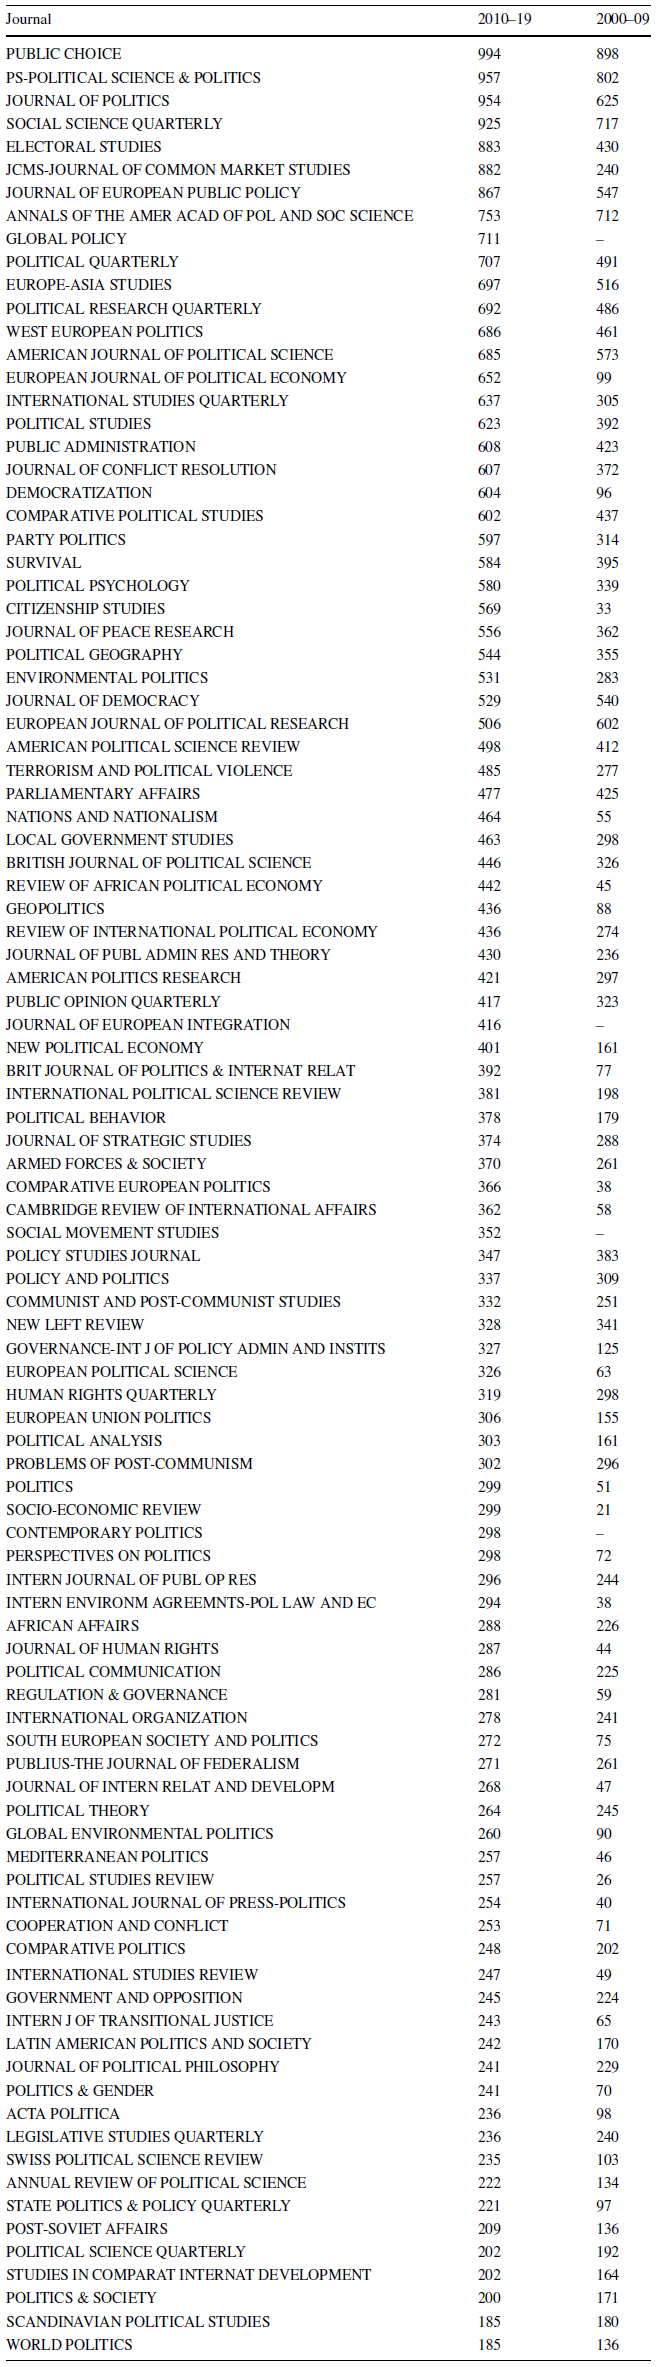
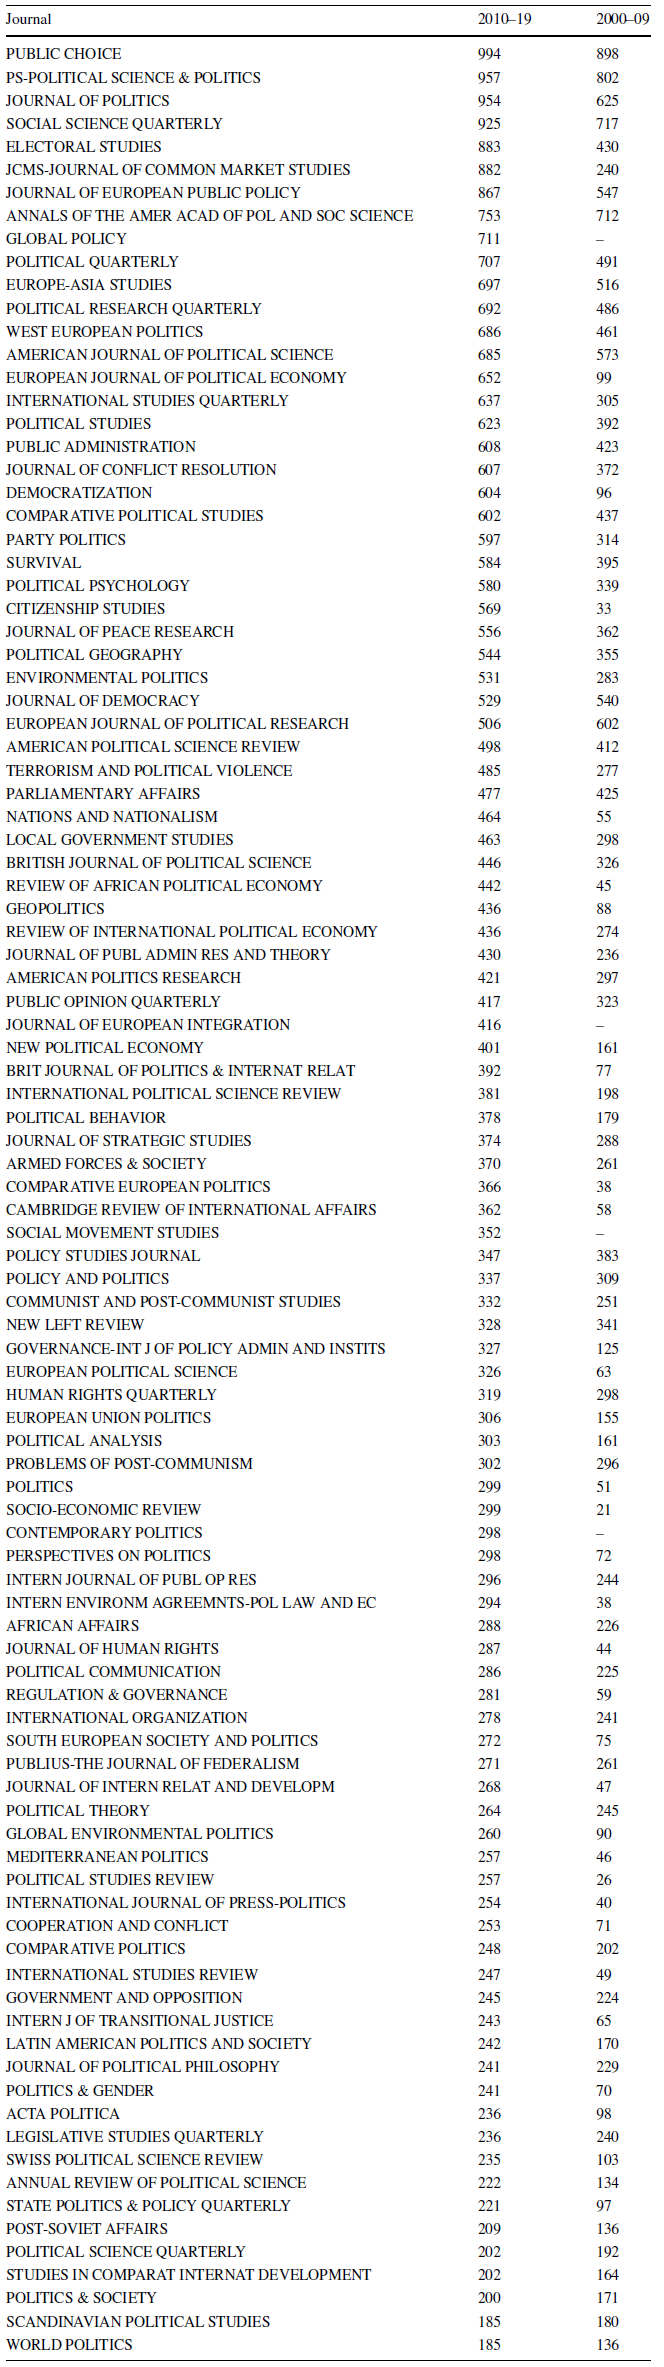
My dataset consists of 67,081 articles published between 2000 and 2019 in 100 journals classified as “political science” in the Social Science Citation Index.Footnote 1 I selected the top-100 journals that in 2019 had a five-year impact factor greater than one (cf. Metz and Jäckle Reference Metz and Jäckle2017). Table 4 in the Appendix provides the list of selected journals, and the number of articles published in each journal, in the two decades, covered by this article.
The bibliographic record of each article includes a rich set of information, including author details, institutional affiliation, keywords, or journal. The text of each bibliometric record can then be parsed to extract additional information from existing fields.Footnote 2 To parse, process and analyse the large number of bibliometric data downloaded, I used the R package Bibliometrix (Aria and Cuccurullo Reference Aria and Cuccurullo2017), which permits leverage of the power and richness of bibliographic data at multiple levels.
To analyse the internationalisation of national scholarly communities, the article focuses on countries as a level of aggregation. This information is extracted from each record by taking the country indicated in the authors’ affiliation details. The analysis is centred on European countries, but they are discussed in the context of the broader global political science community: between 2000 and 2019, the political scientists that contributed to the scientific production of the selected journals were based in 127 countries.Footnote 3
Findings
Contribution to the international scientific production
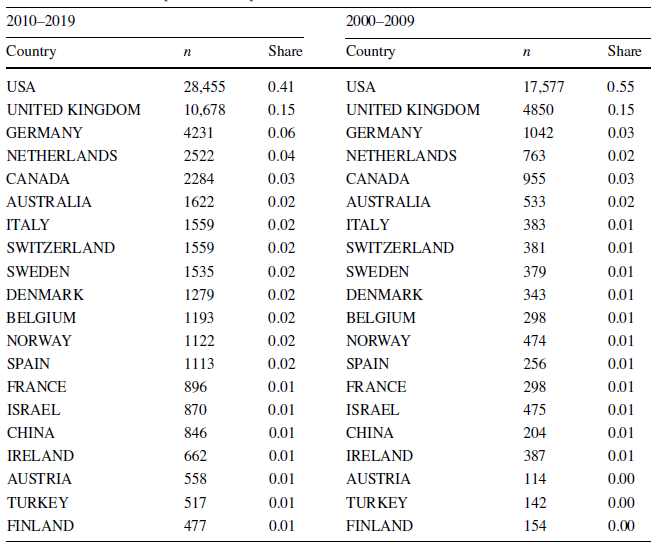
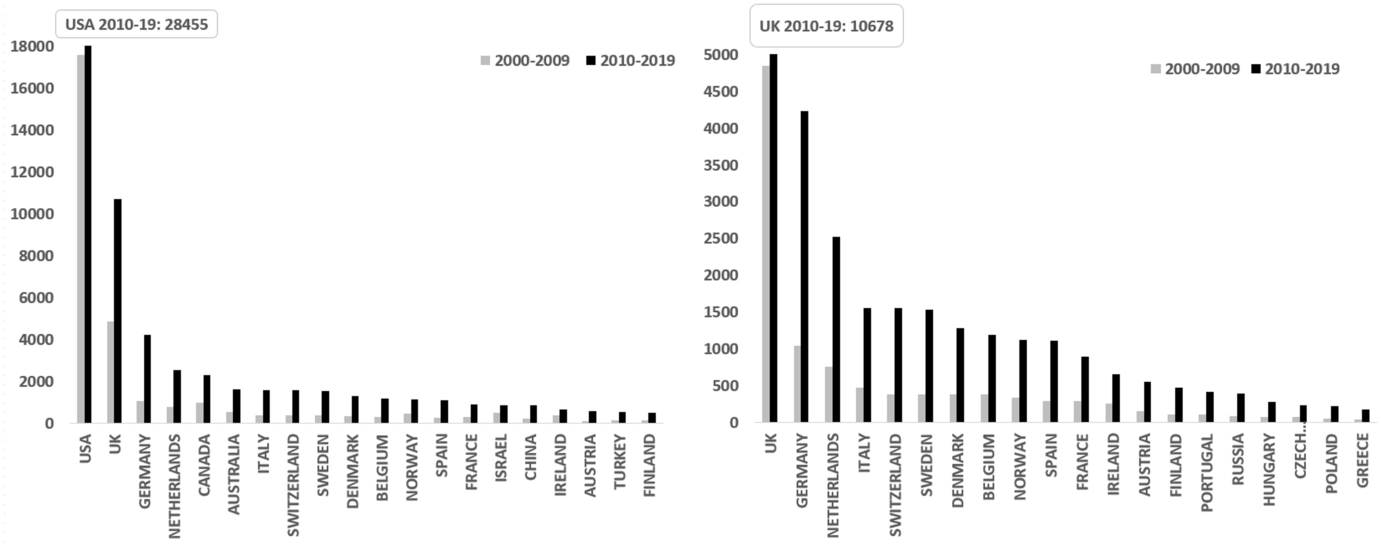
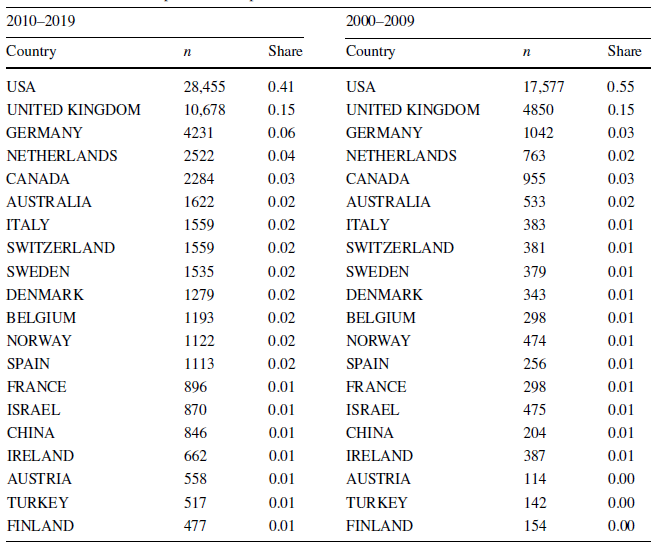
Our first indicator of internationalisation of national scholarly communities is the contribution given by scholars, affiliated to institutions based in the respective countries, noting the overall number of articles published by the selected international journals.Footnote 4 For simplicity, and with the caveats discussed above in mind, let us call this a measure of “international scientific production”. This is shown in Fig. 1. The left quadrant includes the world’s top-20 countries for scientific production, while the European top-20 are shown in the right quadrant. The grey bars display figures for the decade 2000–2009, while black bars are for 2010–2019. Additional indicators are available in Tables 5 and 6 in the Appendix.
Contribution to international scientific production. World's top-20 (left quadrant) and European top-20 countries (right quadrant)
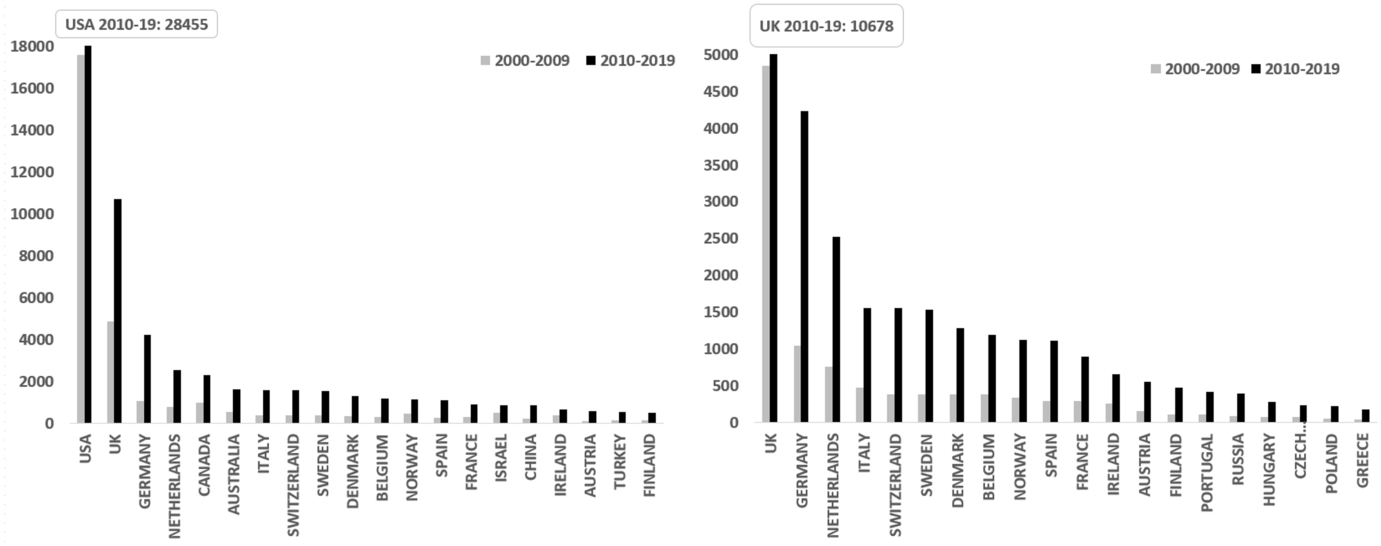
The scientific production of political scientists is highly concentrated in relatively few countries. Indeed in both quadrants, the y-axis is scaled down (truncated) to make the figures for smaller national communities visible; the data for the US and the UK are displayed in a call-out. In the decade 2010–2019, US (41%) and British (15%) institutions together hosted more than half of the (co-)authors of the articles published in the top-100 journals. Just ten countries hosted the authors of 80% of all articles. European countries were largely represented in this highly productive core: seven among the top-10 for scientific production and fourteen among the top-20 were European countries.
Within the general picture of a scientific production concentrated in a relatively small number of countries, however, the data also reveal a tendency towards diversification. In the previous decade (2000–2009), more than 70% of the scholars who published in the top-100 journals were based in the US or the UK. The top-10 countries hosted 87%, and the top-20 hosted 95%, of all authors. Over time, the international scientific production became relatively less concentrated across countries.Footnote 5
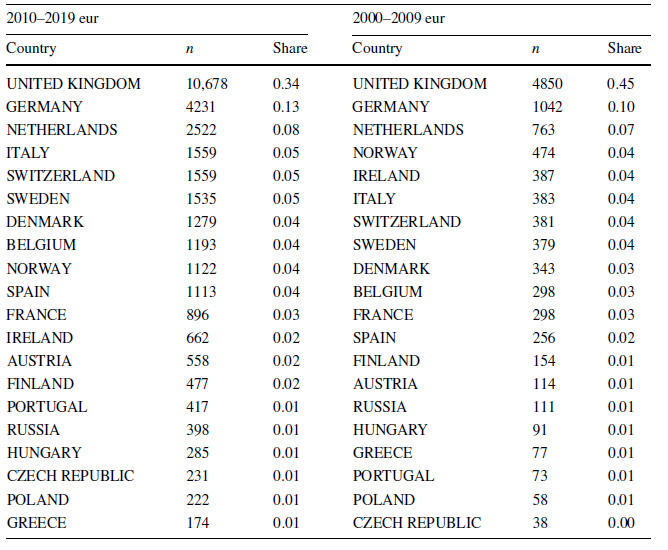
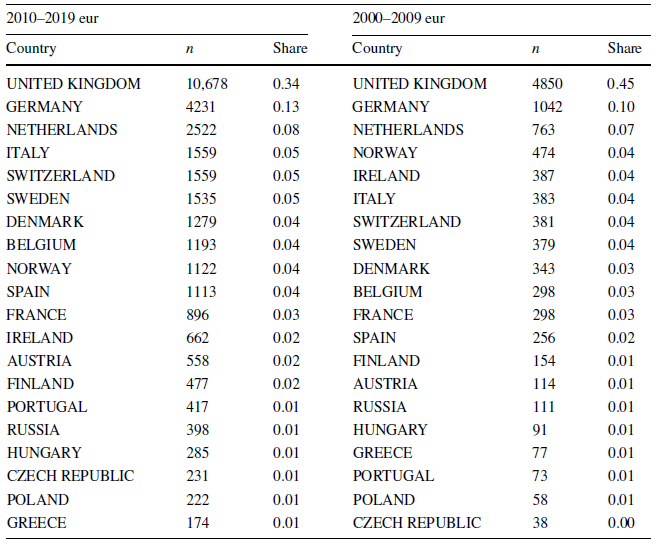
European countries were key to the increased diversification of international scientific production, in two ways. On the one hand, the European scientific production increased markedly. On the other hand, the contributions to the international scientific production became much more evenly distributed among European countries themselves (see Table 5). To be sure, even in 2010–2019 the UK still provided an affiliation to a large share—roughly one third—of European contributors to publications in the top-100 political science journals; but down from 45% of Europe’s contributions in the previous decade. And while in the second decade, the British contribution more than doubled in absolute numbers (from less than 5000 to more than 10,000), so did the scientific production of the 20 more productive European countries. Meanwhile, contributions by scholars based in Germany, Ireland, Italy, Austria and Hungary more than tripled.Footnote 6
Clearly, UK-based institutions still provide a large share of the European contributions to publications in leading international political science journals. Yet, the increase in the amount of contributions from + other European countries has been remarkable.
Participation in international collaborative publications
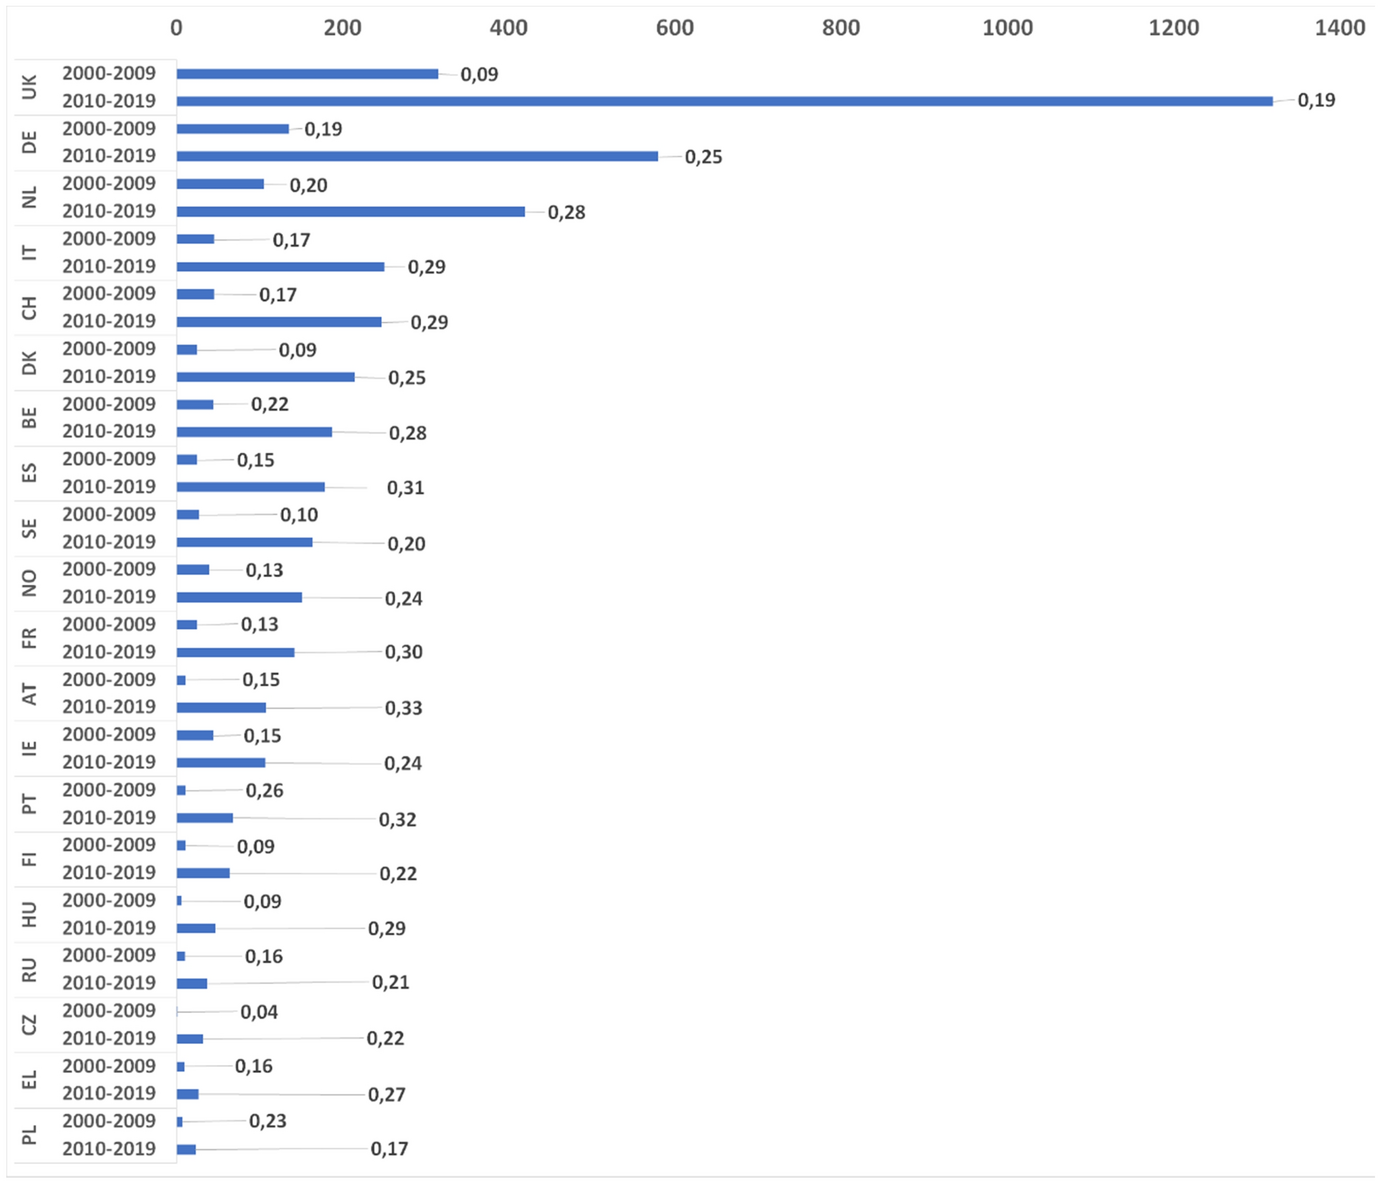
Our second indicator of internationalisation of national scholarships is the contribution to collaborative studies co-authored by scholars based in different countries. Multiple country publications (MCP) are shown in Fig. 2, this time only for the 20 European countries with the higher contribution to the international scientific production. For each country, the bars indicate the absolute number of MCP; alongside each bar, the share of MCP on the total number of publications contributed by that country is included. Separate bars for each country show figures for the first and second decades under analysis.
Involvement in collaborative work by country, European top-20
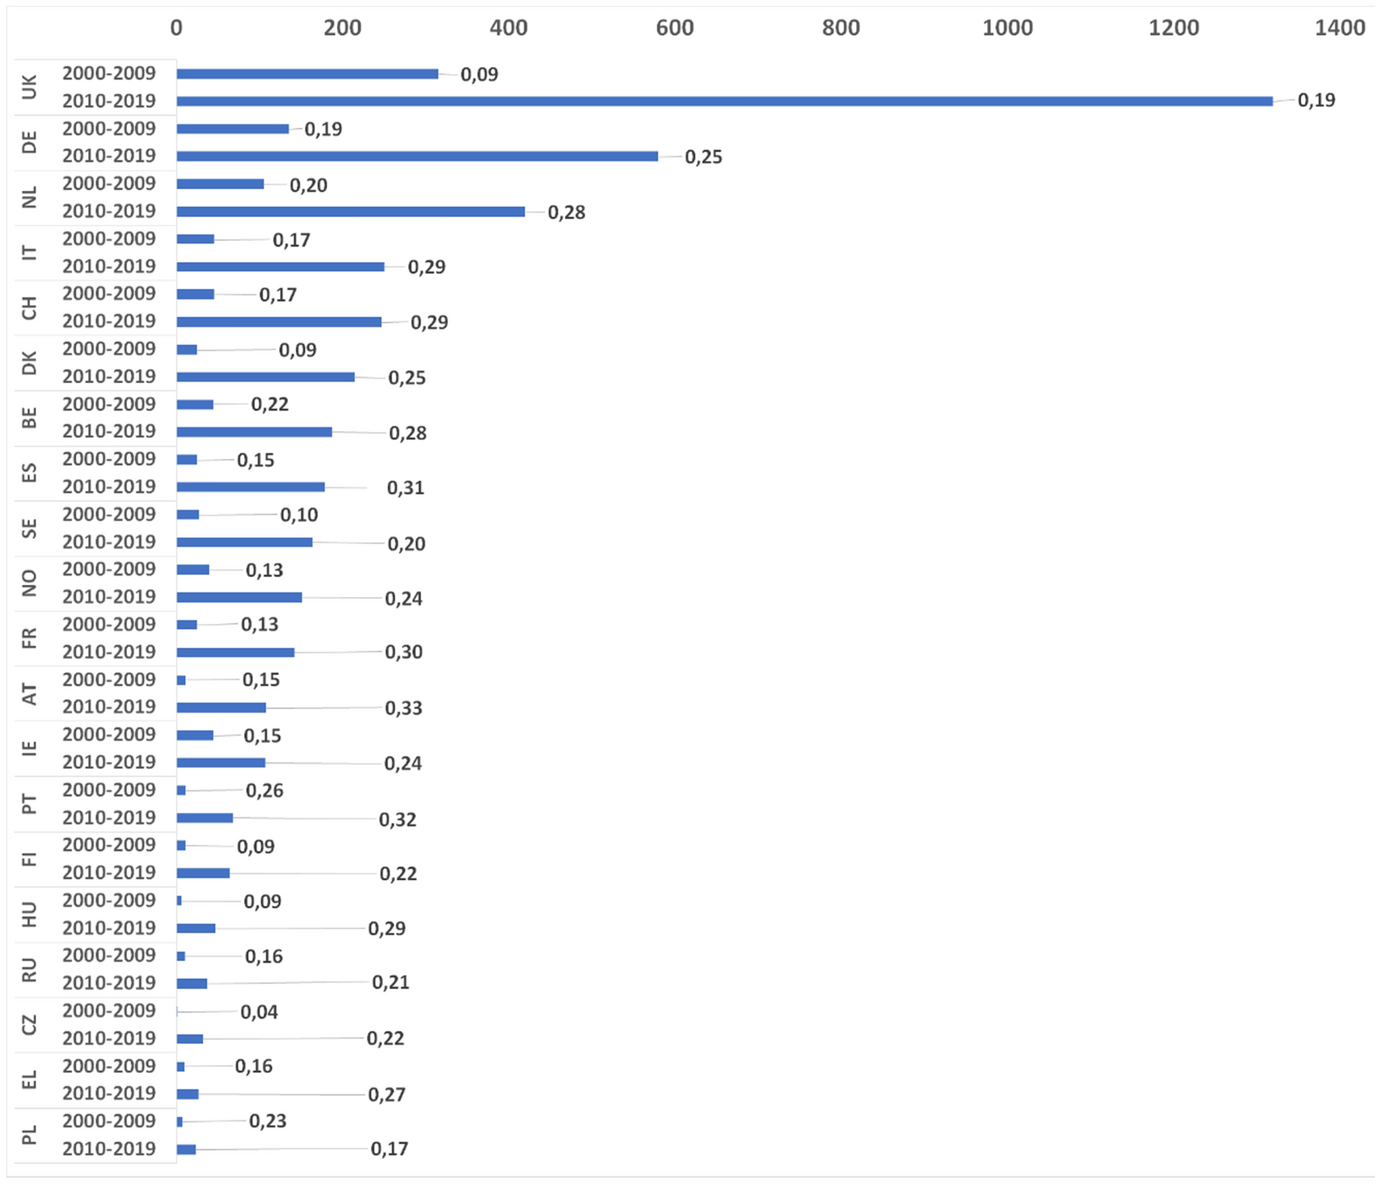
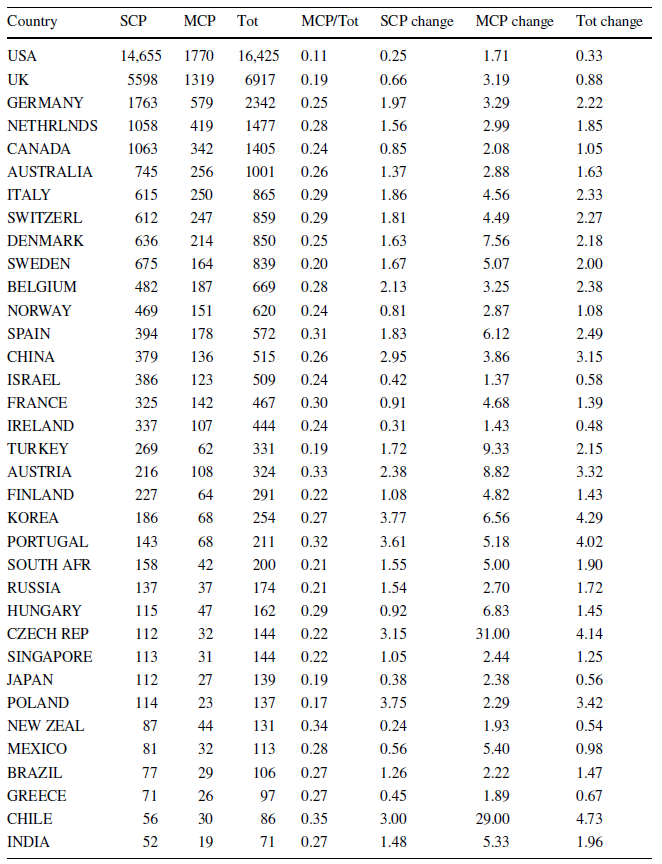
The generalised tendency towards an increased involvement in international collaborative publications outpaced the broader growth of the global scientific production. If we consider the top-35 countries for scientific production (which include the European top-20), single-country publications (SCP) increased by 1.57 (about 150%) between decades; meanwhile, MCP increased by 5.56 (or about 550%) on the average.
This is better appreciated by observing the performance of single countries. In the decade 2000–2009, MCP represented 20% or more of the total scientific production in seven European countries: the Netherlands (20%), Belgium (22%), Portugal (26%), Poland (23%), Romania (25%), Ukraine (20%) and Bulgaria (33%). Except for Belgium and the Netherlands, these were relatively small political science communities producing a limited number of publications. The European average was 17%. In the following decade, MCP grew to 27% of the total production on the average. They were 20% or more of the total scientific production in the large majority of European countries, with just eight exceptions.Footnote 7 In relative terms, MCP had increased massively in most European countries. In 2010–2019, they were between four and five times as numerous as in the previous decade in Italy, Switzerland, France and Finland; and between five and eight times more numerous in Denmark, Spain, Sweden, Austria, Portugal and Hungary.
International collaborative publications seem to have been an important component of the general growth of the international scientific production between the two decades. This was a generalised tendency in the large majority of national political science communities. It was certainly so in European countries, where the change was indeed even more marked. These figures complement the description of a growing presence of Europe-based political scientists in the international political science scholarship, with a broader and more diverse geographic basis and a parallel massive increase in collaborative publications. International collaborative research seems to be establishing itself as a key engine for scientific production, in Europe as well as globally. The next section discusses how international collaboration works in practice, and how it has changed along the two decades observed.
Country collaboration network analysis
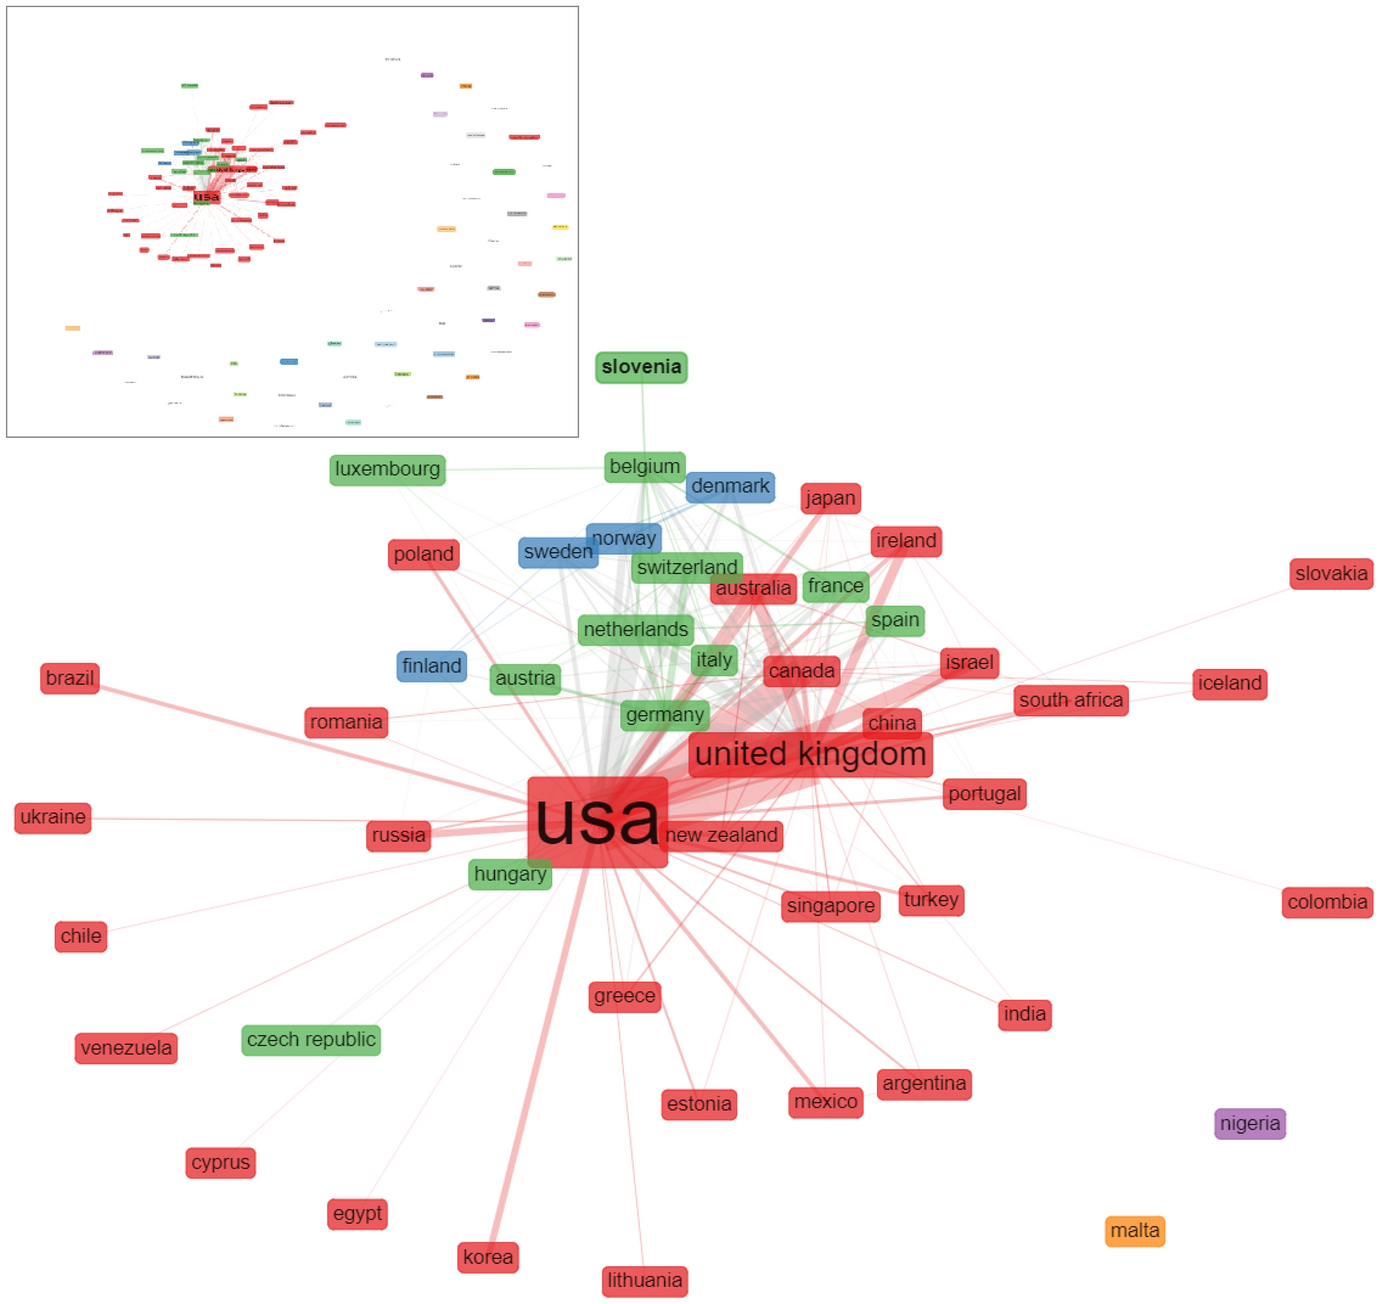
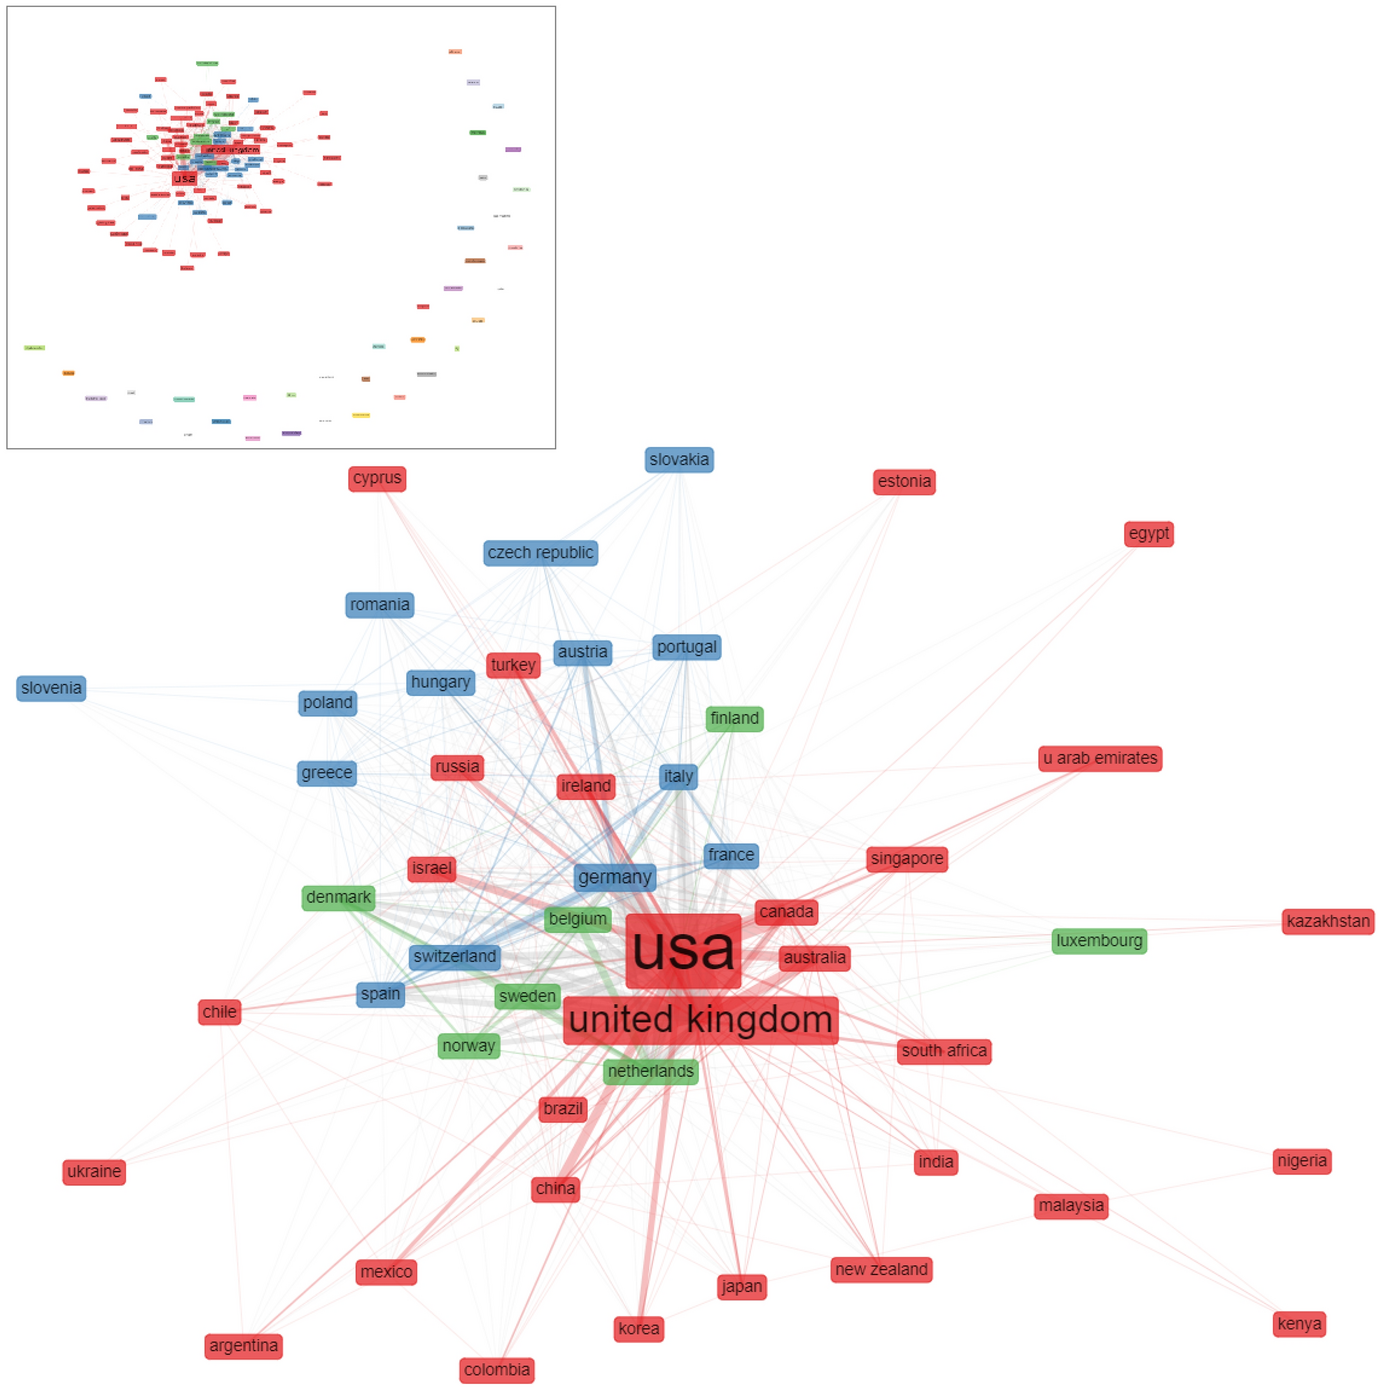
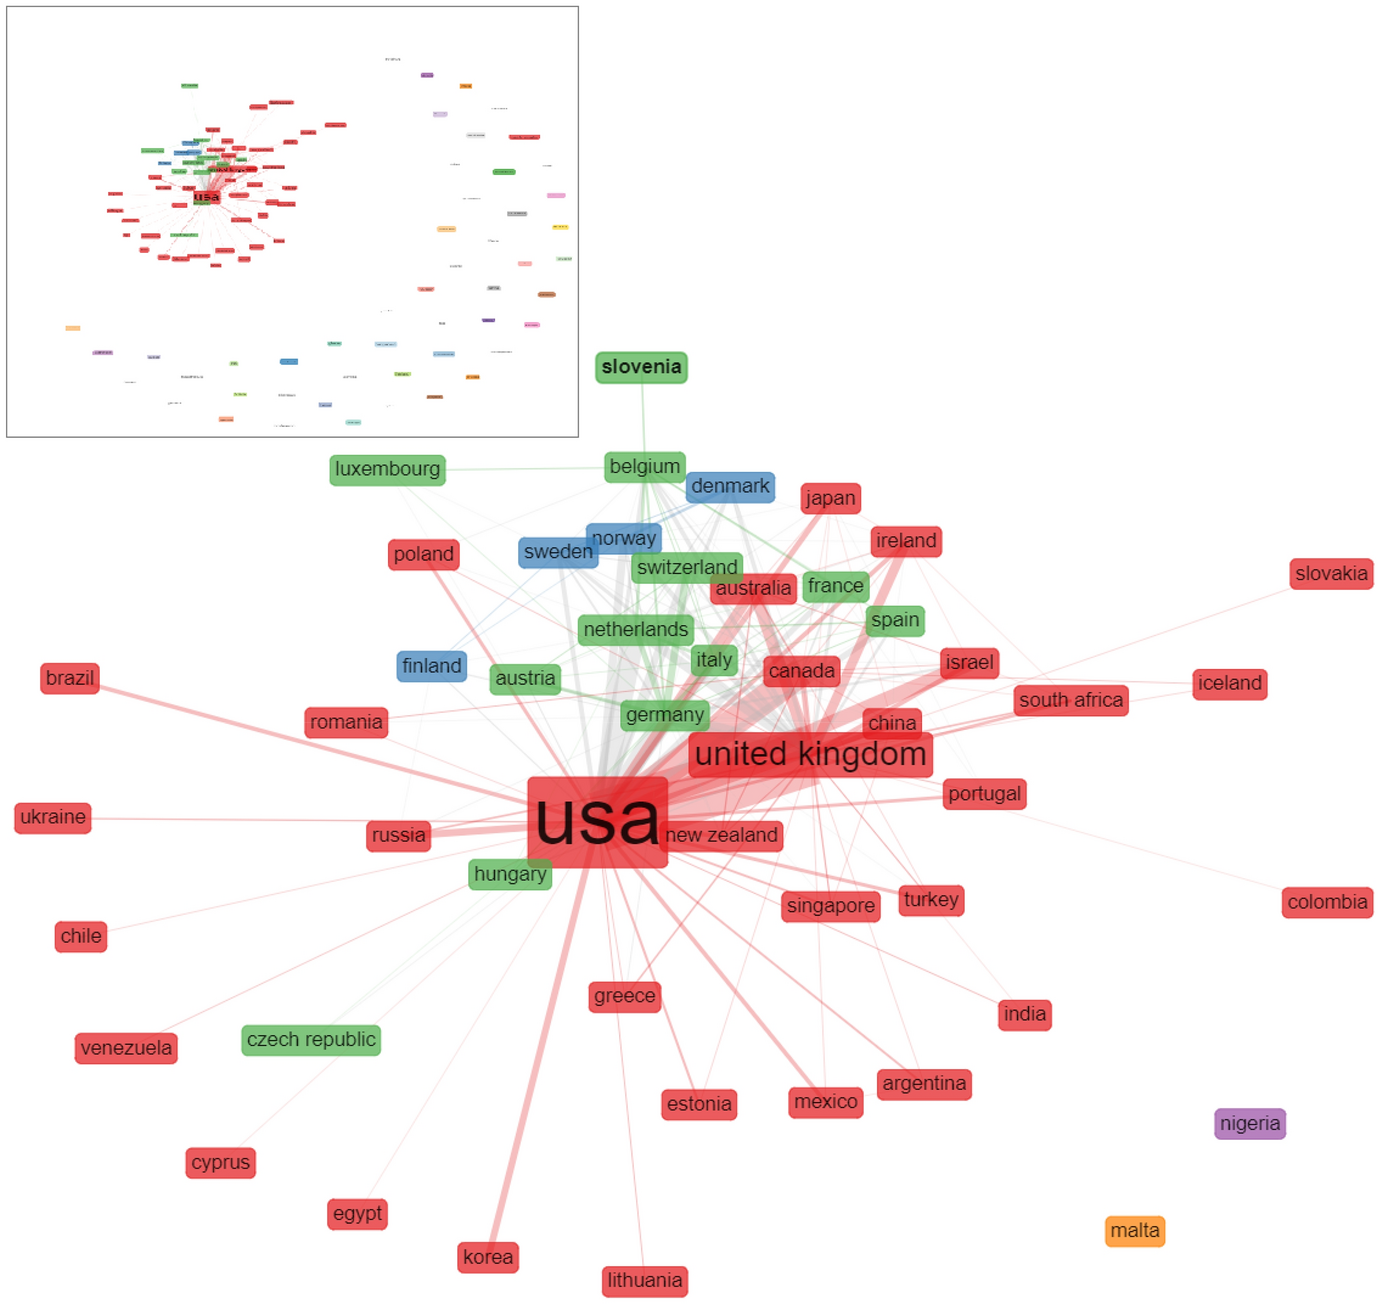
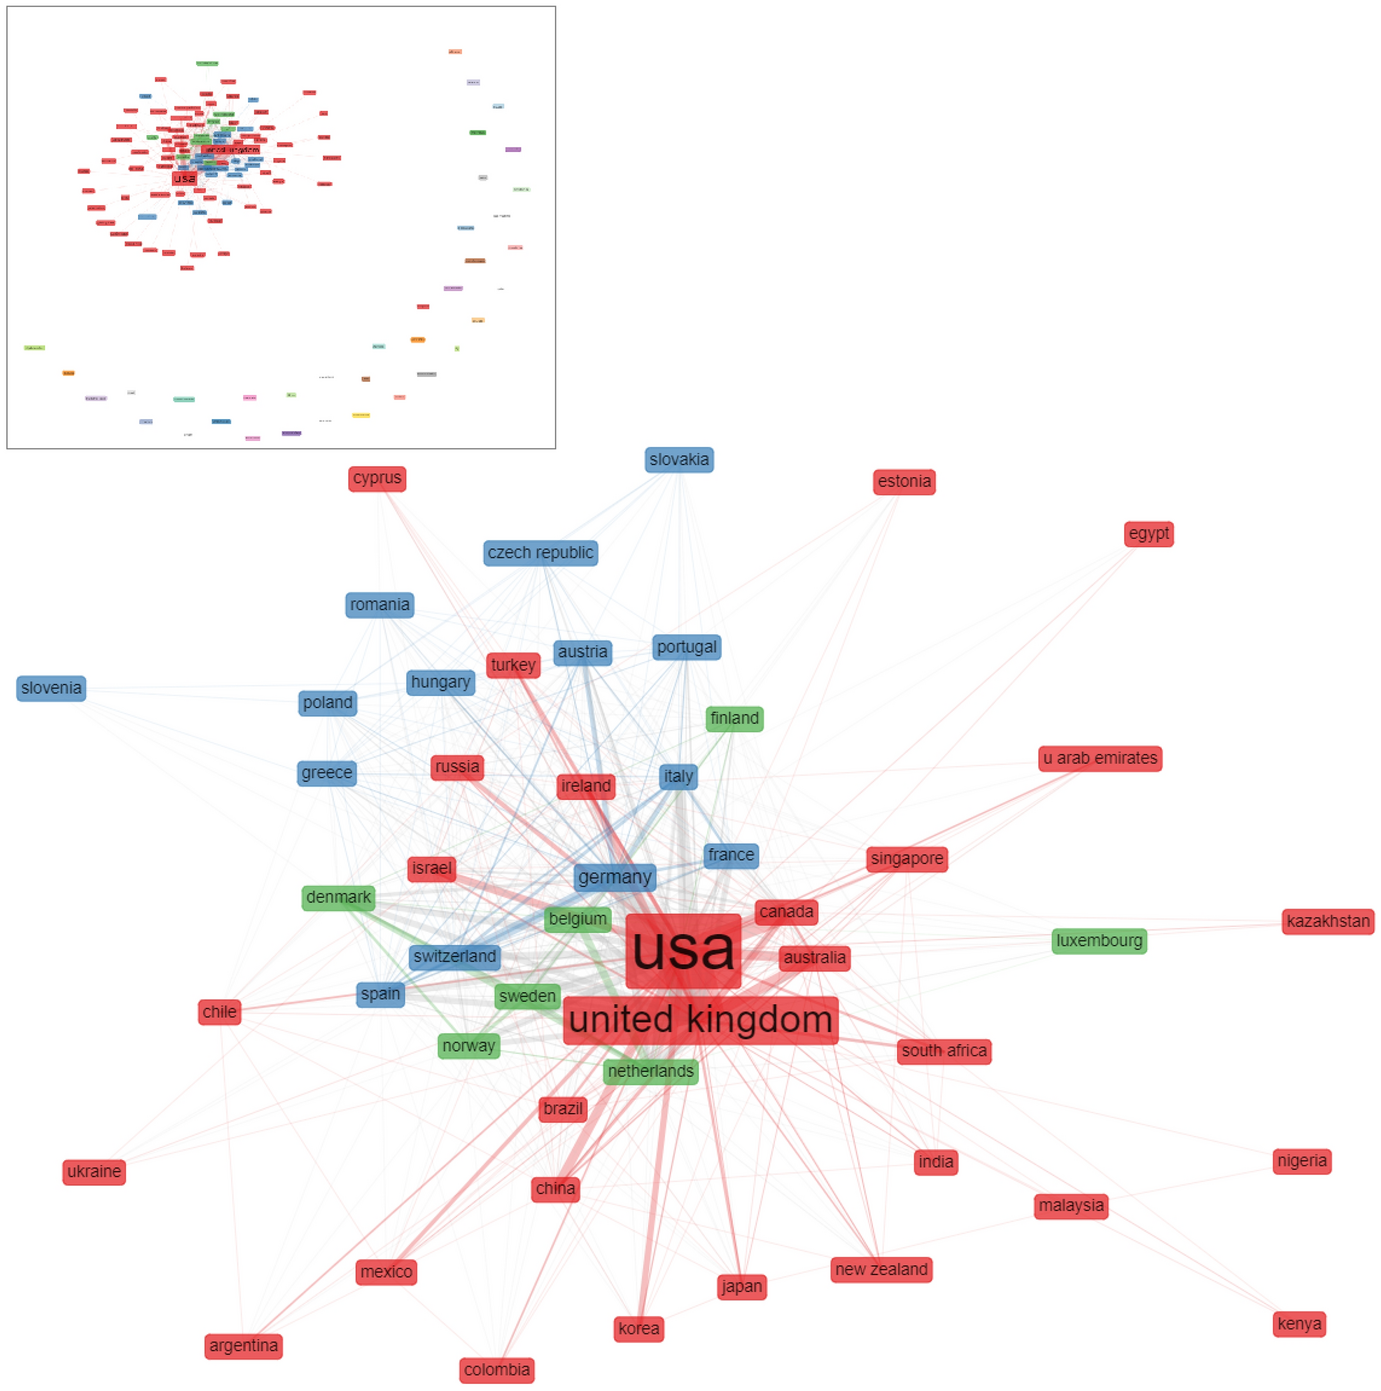
Social network analysis permits to look closely into actual patterns of international cooperation. Single countries can be represented as nodes in a network of country collaborations, as in Figs. 3 and 4. Two countries are connected if at least one article was co-authored by scholars working in institutions based in those countries. The higher the number of co-authorships between scholars based in two countries, the stronger the connection between those countries (and the larger the edge joining the related nodes in the network).
Country collaboration network, 2000–2009. Entire network in the inset, and fifty most connected countries zoomed in in the chart
Country collaboration network, 2010–2019. Entire network in the inset, and fifty most connected countries zoomed in in the chart
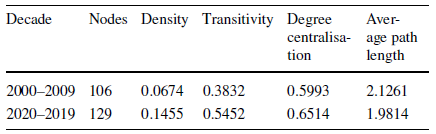
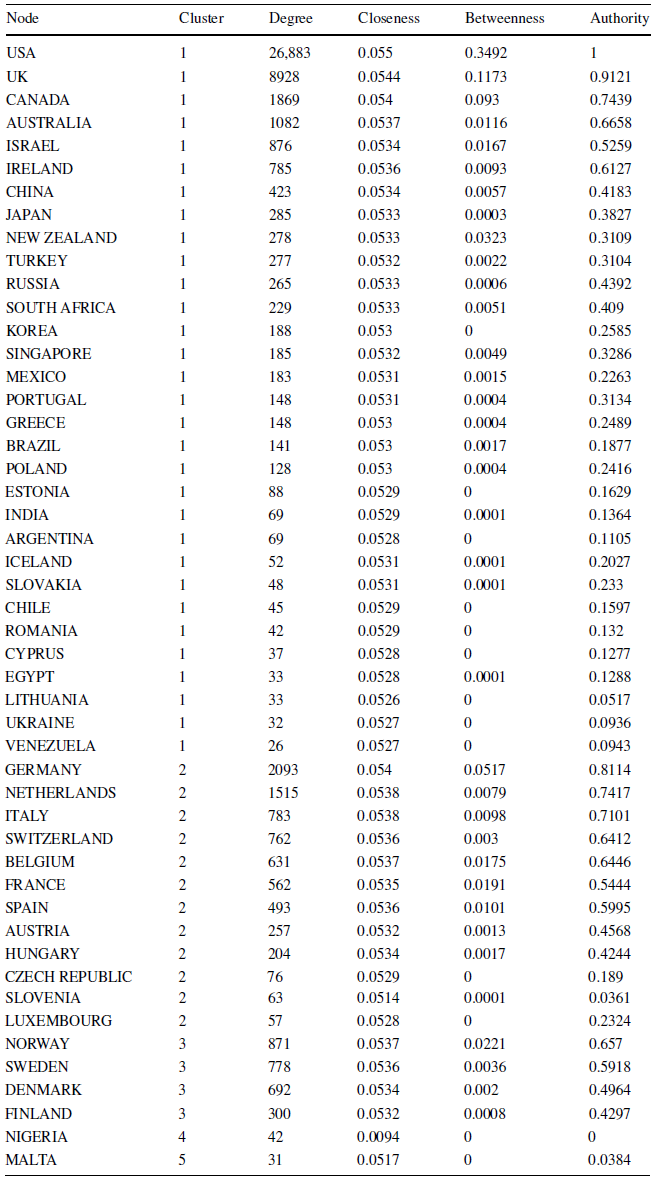
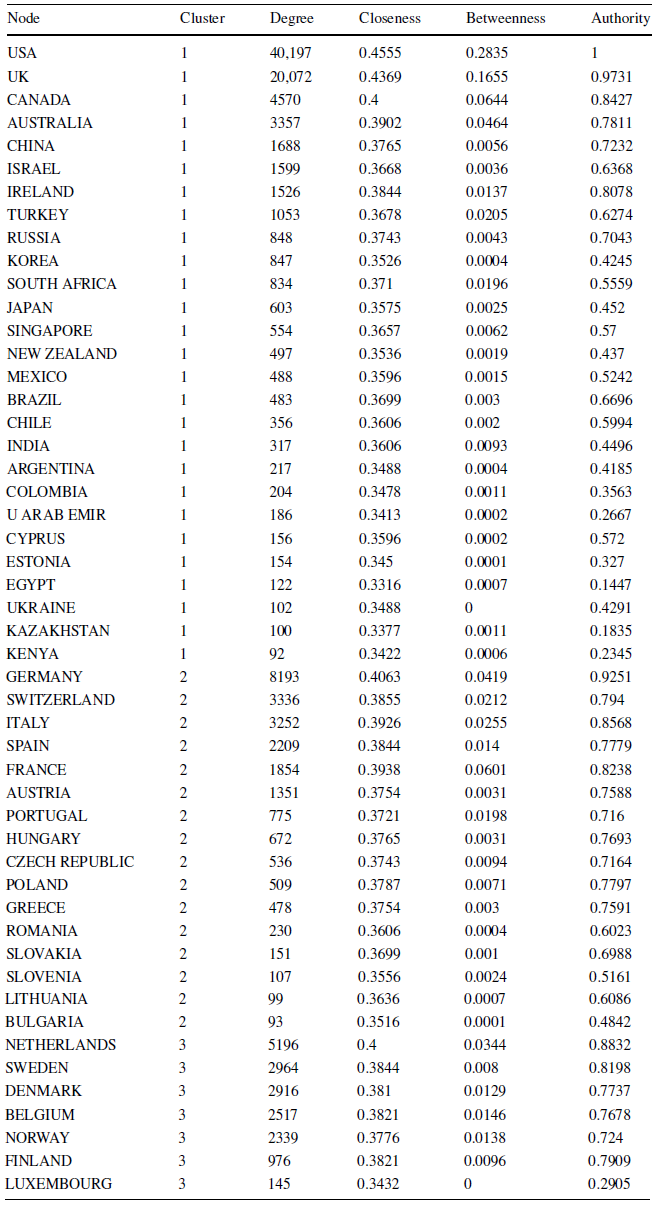
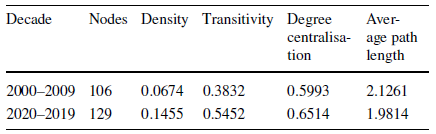
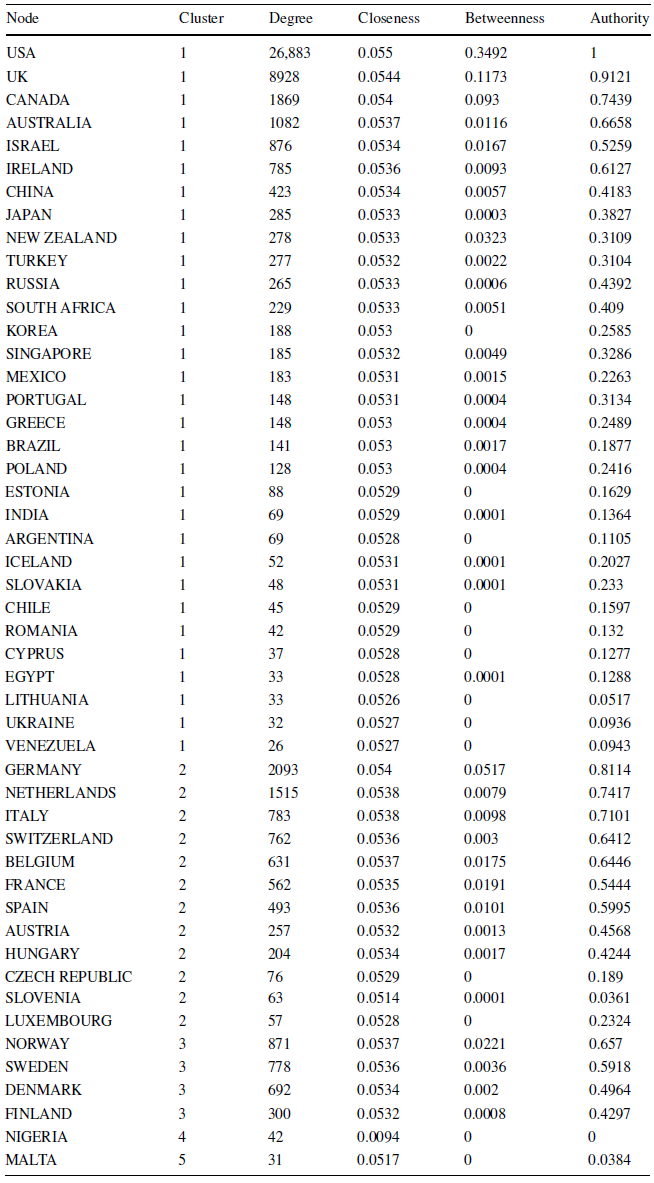
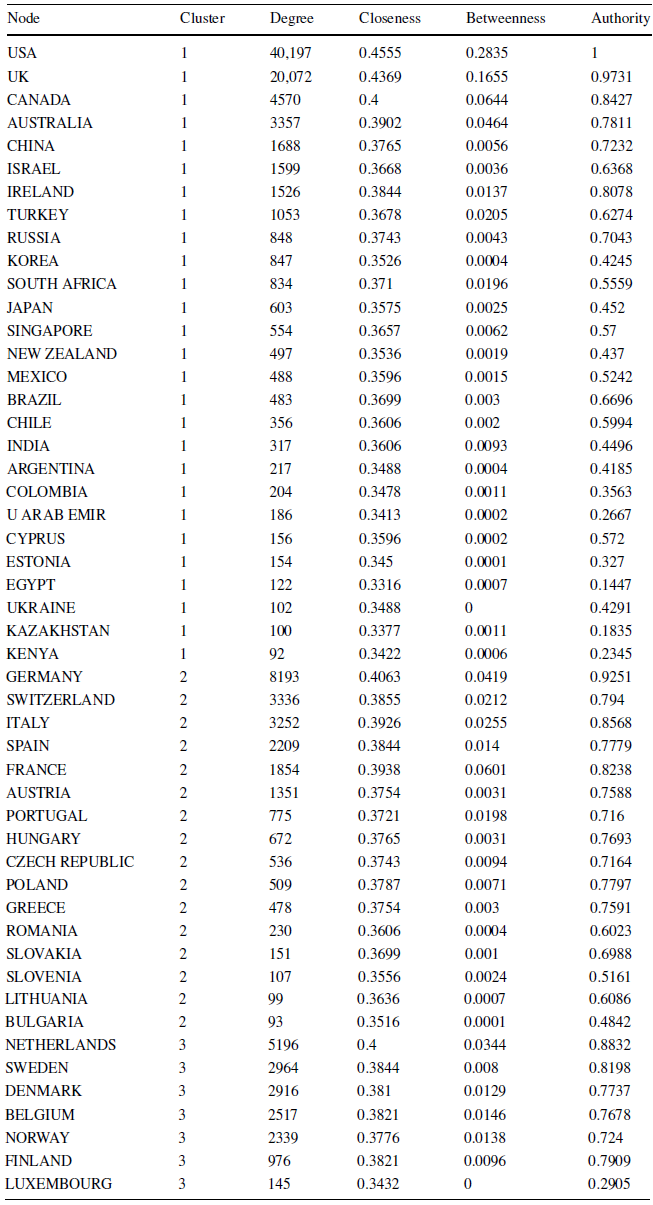
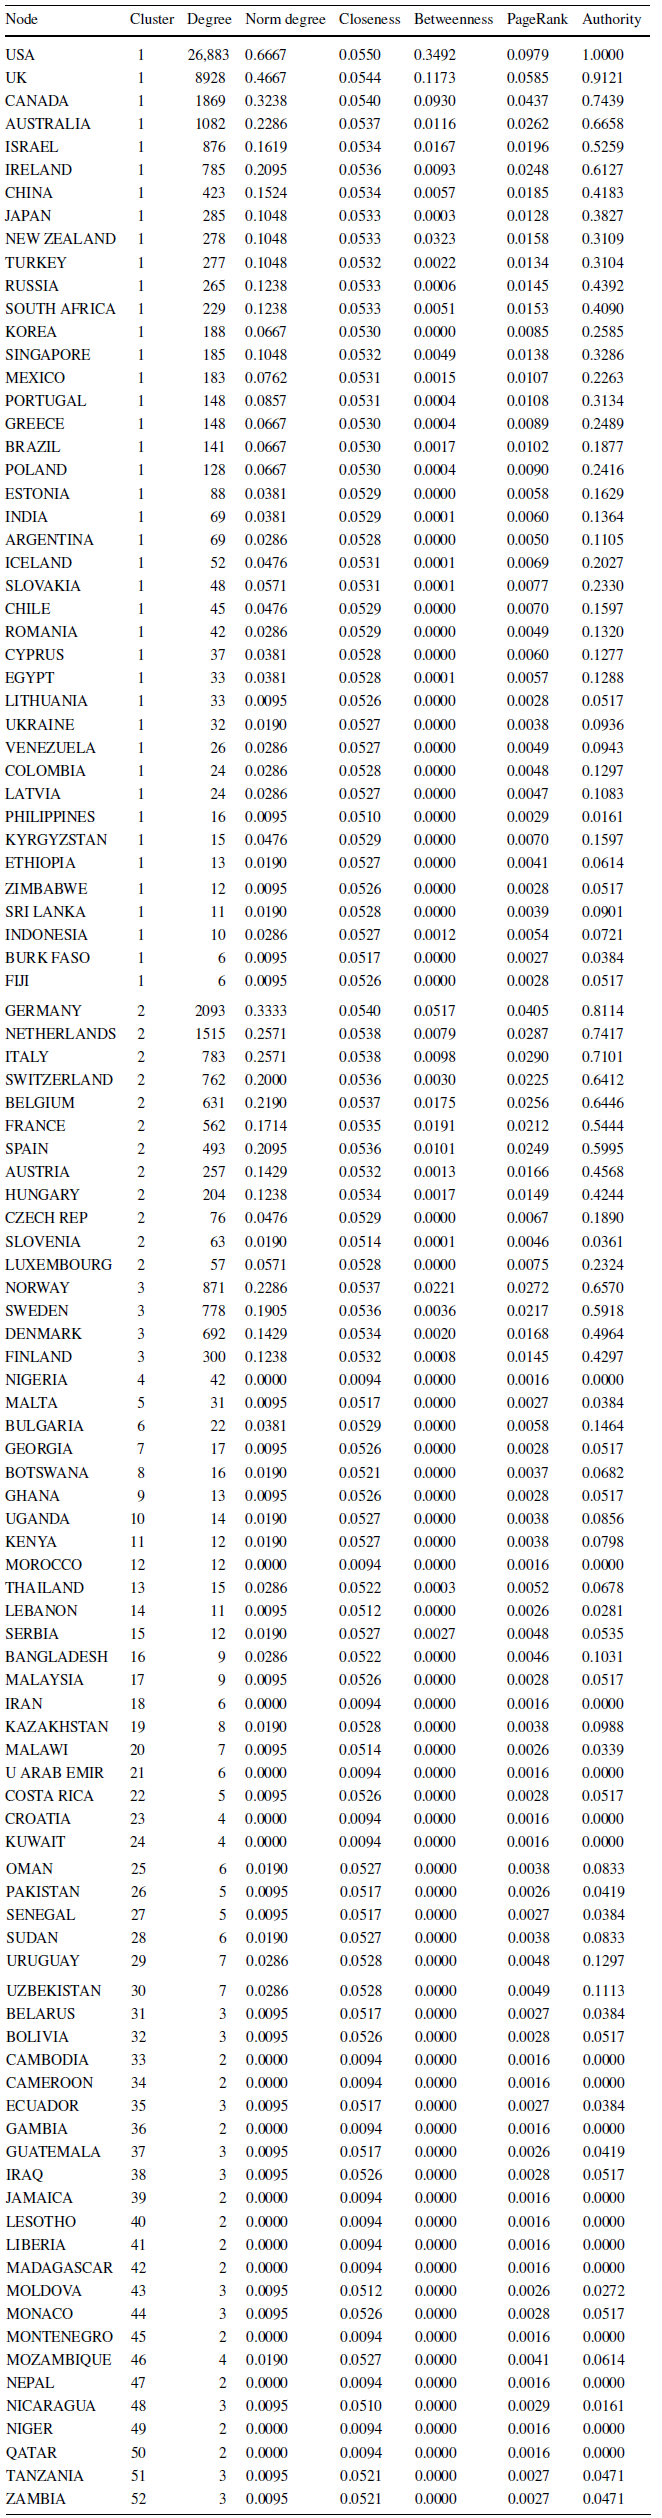
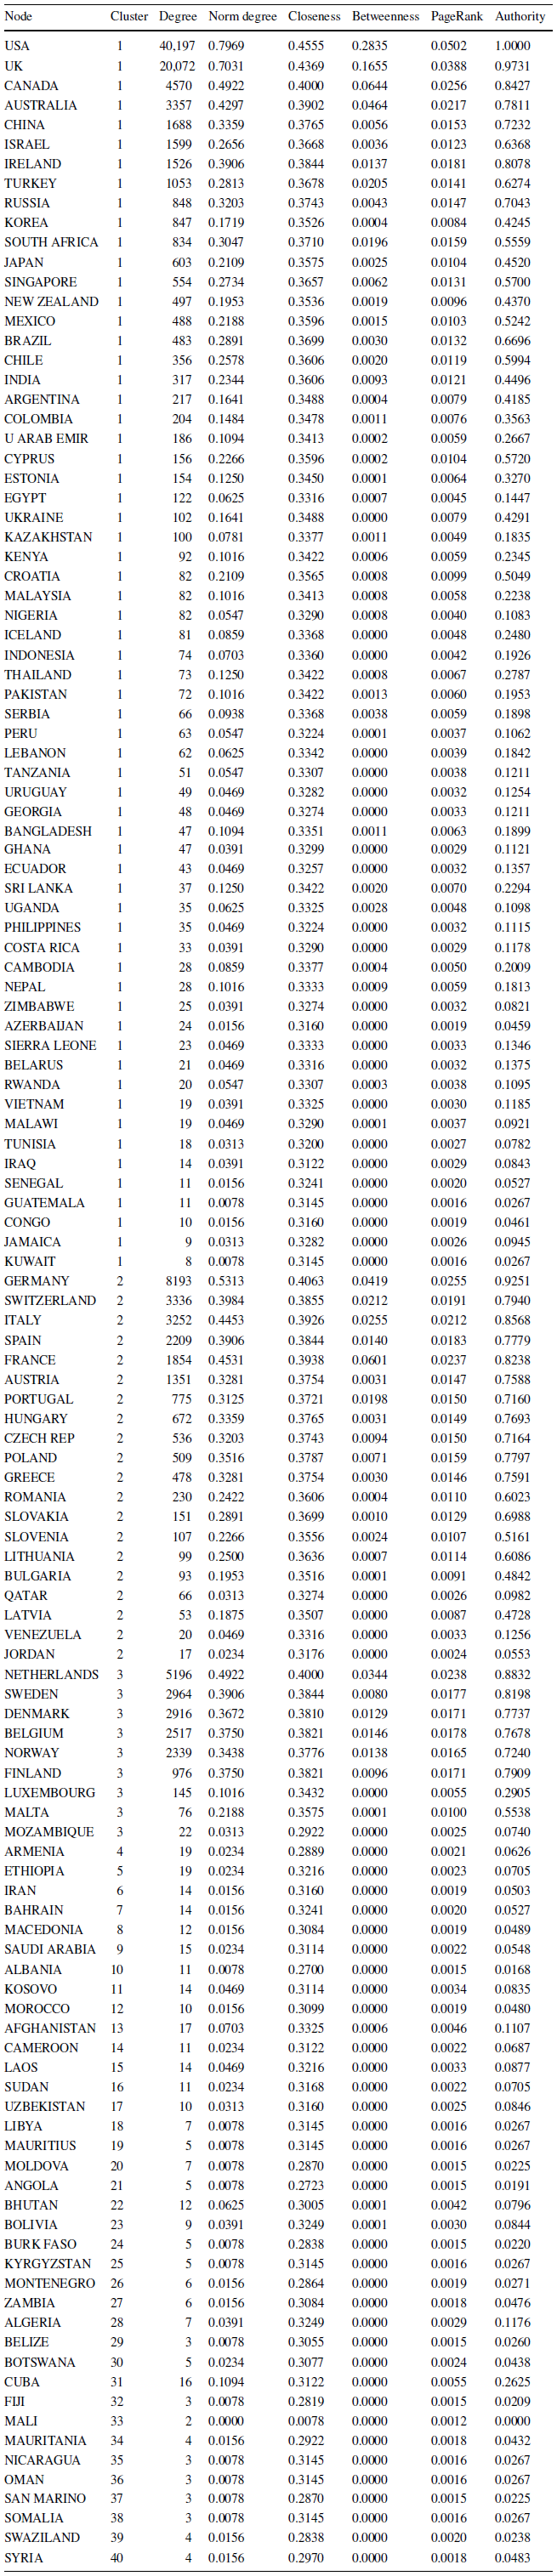
Several indicators of connectedness and centrality can be used to obtain a deeper understanding of the network configuration. Table 1 presents some aggregate network-level indicators describing the internal structure of the network and its development over time. Tables 2 and 3 instead provide core 8network statistics at the level of single countries for the 50 nodes with the higher degree (most connections) in the network. Statistics about all countries are shown in Tables 10 and 11in the Appendix that also include some additional indicators of centrality.
Network connectedness and development
Country collaboration network. Clustering and centrality of single countries within the network. Fifty most connected countries, 2000–2009
Country collaboration network. Clustering and centrality of single countries within the network. Fifty most connected countries, 2010–2019
Structure and evolution of the network
Aggregate network indicators, shown in Table 1 separately for the two decades, consistently point to a broadening and tightening of the network. While it expanded from 106 to 129 countries from the first to the second decade, the network also became twice as densely connected. Despite the larger network size, communication flows (that is, connections between scholars based in different countries) did not become more difficult; the average length of the shortest path connecting two countries actually decreased slightly.
Transitivity measures the extent to which the relations connecting two nodes in the network are “passed on” to other nodes (Wasserman and Faust Reference Wasserman and Faust1994: 243): how probable is it that if, say, scholars in the US are connected to scholars in Estonia, and scholars in Estonia are connected to scholars in Lithuania, then scholars in Lithuania are also connected to scholars in the US?Footnote 8 This indicator also increased markedly from the first to the second decade, which points to the development of more inclusive clusters in the second decade.
Finally, the network became slightly more centralised. Degree centralisation equals one when all nodes connect to a single one, and not to each other (as in a star); it is zero when all nodes are equal (as in a circle). Higher degree centralisation therefore means that there are relatively less very central nodes. This development is consistent with network theory, which sees centralisation as an indicator of network efficiency and posits that while networks grow in size, they will also become more centralised.Footnote 9
What are these best-connected countries? How did the structure of the collaboration network change over time, and what did it mean for the general organisation of international collaborations? To address these questions, we now turn to the descriptive analysis of the network.
2000–2009
Let us begin with the network of international collaboration in the period 2000–2009. For ease of visualisation, Fig. 3 zooms in on the more connected core comprising 50 countries; the entire network is shown in the inset. Nodes (countries) are coloured according to the cluster in which they are placed.Footnote 10 Table 2 complements the graphical visualisation of the network with several centrality indices for single nodes: the cluster to which countries belong; their degree (number of connections); normalised closeness (the steps required to access every other node); betweenness (brokerage potential, measured as the normalised number of shortest paths crossing each node); and authority (connection to nodes that link many other nodes).
In the first decade, the network of 106 countries hosting scholars who published in the political science journals selected for this study included three main clusters, comprising overall 57 countries. The remaining 49 countries were isolated nodes in the network (as can be seen in the inset of Fig. 3). The main cluster (red in the figure) included 41 countries and had the US—the country scoring highest on all network indicators by far—at the centre. We may call this the global cluster. The UK was the second most central actor in this cluster (and in the broader network), alongside of other countries to which it is historically connected, such as Canada, Australia, New Zealand—as well as Ireland in the first place. This cluster has a few more well-connected countries, notably Israel, China, and Japan.
Importantly, 12 European countries were part of this cluster. In addition to Ireland and the UK, these were Cyprus, Estonia, Greece, Iceland, Latvia, Lithuania, Poland, Portugal, Romania, Russia, Slovakia and Ukraine. Of these, Greece, Portugal and to some extent Estonia had a relatively high degree compared to other countries within the cluster, but limited network centrality and virtually no brokering potential. The other European countries were part of this collaboration cluster primarily because scholars based there had collaborated with colleagues from the main hubs within the cluster.
Most remaining countries within the global cluster were weakly connected in all respects. These included the larger Latin American countries (Argentina, Brazil, Colombia, Chile, Mexico, Venezuela), as well as several African (Burkina Faso, Egypt, Ethiopia, South Africa, Zimbabwe,), Asian (India, Indonesia, Korea, Kyrgyzstan, Philippines, Singapore, Sri Lanka) and Pacific (Fiji) countries. Such countries had a low degree (number of connections) and no brokering capacity; in general, they scored poorly on all connection indices. Overall, they were peripheral to the global cluster and were part of it because of their collaborations with few countries from its core.
Most European countries were part of the two remaining clusters. One larger European cluster included 12 nodes, with Germany and the Netherlands at the centre. They clearly had a key brokering role within the European cluster, being pivotal to collaborations among scholars from many other European countries; but their degree and centrality scores made them actually quite central to the entire network. To a relatively smaller extent, this was also the case for Italy and Switzerland, and less so for Spain and France.
Belgium was a somehow special country within the European cluster. Its betweenness was extremely high compared to its degree (still relatively high compared to the size of the country). Although limited in mass, scholars based in Belgium were able to place themselves at the centre of a tight web of international collaborations, particularly with other European colleagues. Austria and Hungary were the remaining European countries with a marked degree and some betweenness in the network. The Czech Republic, Slovenia and Luxembourg had some degree but no brokering capacity.
The second cluster of European countries was composed of the Scandinavian countries: Denmark, Finland, Norway and Sweden. Their relatively high degree, as well as the web of collaboration within and outside the cluster, is what placed these countries in a cluster of their own. Among them, Norway, Sweden and Denmark had the higher degree (comparable to such countries as Italy or Switzerland in the main European cluster, or Ireland and Israel in the global cluster) and also a significant centrality. Sweden was second by degree, but it was by far the main hub, both within the cluster and with other countries.
Finally, the network included a set of 49 individual nodes with no systematic relations with any cluster of countries. Scholars based in these countries either did not publish collaborative work with colleagues based in other countries, or (in a smaller number of instances) their collaborations happened mainly or exclusively with single countries. In short, they were not systematically connected to international networks of collaboration for articles published in the top-100 international journals. This set of countries, that constituted about half of the entire network, included eight European countries: Malta, Bulgaria, Serbia, Croatia, Belarus, Moldova, Monaco and Montenegro (in decreasing order of network degree). None of them had any significant centrality or brokering capacity within the overall network.
2010–2019
Figure 4 displays the network of country collaborations in the decade 2010–2019. Again, the figure zooms in on the top-50 countries for degree within the network, while the entire network is shown in the inset; single countries are coloured based on the subgroup to which they belong. Indicators of centrality and connectedness of single countries are shown in Table 3 for the 50 most connected countries within the network. Table 8in the Appendix provides centrality indicators for all countries in the network.
By 2010–2019, the network had expanded in size, but the isolated nodes had decreased both in relative and absolute terms: less than one third of the countries—37 out of 129 countries—were now excluded from collaboration clusters, compared to almost half of the 106 countries composing the network in the previous decade. International collaborations were still organised around three clusters of scholarly communities, and these groupings maintained their overall identity: one global cluster and two (mainly) European clusters. However, all expanded in size and deepened in terms of interactions.
The global cluster expanded to include 62 nodes. The US and UK maintained their centrality within the cluster (as well as within the broader network): their score on degree and centrality measures actually increased markedly in the second decade. Canada and Australia followed, also part of the top-10 most connected, central, and in-between countries in the broader network. More countries within the global cluster became tightly connected (see Table 3). Canada, Australia, Israel, China, Ireland and Turkey all had a degree (number of international co-authorships) higher than 1000; Russia, South Africa, Korea, Japan, Singapore, Brazil, Mexico and New Zealand higher than 500.
Although significantly lower in network degree, Ireland and Turkey stood out for their high centrality score and brokering capacity within the network (as shown by the betweenness and hub indicators). The latter in particular was rather well connected to many countries in the European cluster, as was the case for some Latin American countries, such as Brazil and Chile. Korea, Japan and Singapore also were quite well connected within the global cluster; less so with countries in the European cluster.
The global cluster included ten European countries (down from fourteen in the previous decade), four of which were European Union members. In addition to the UK and Ireland, European countries in the global cluster were Russia, Cyprus, Estonia, Ukraine, Serbia, Iceland, Croatia, and Belarus. Russian scholars stood out for the scope of their connections with Europe, having co-published with scholars from 18 (other) European countries — a massive increase from the previous decade, when Russian scholars only published collaborative work with scholars from the UK, Germany and Finland. With the partial exception of Cyprus and Estonia, the remaining European countries within the global cluster had limited connections within, and poor or no connection outside of it.
By 2010–2019, most of the scholars from European countries had tightened their collaboration with European colleagues. As a result, the larger European cluster grew to include 20 nodes; up from 12 in the previous decade, and now also comprising three non-European countries (Qatar, Jordan and Venezuela). The top-three countries for connection, authority and centrality within the main European cluster—Germany, Switzerland and Italy—were also among the top-10 most connected countries of the broader network of international collaborations. France was among the top-10 for most centrality indicators, although not for degree. In general, most countries within the European cluster were well connected within and outside of it; relatively less so were scholars in Slovenia, Lithuania and Bulgaria, as well as the three non-European countries.
The second European cluster also grew in size, from four to nine nodes. The four Scandinavian countries were joined by Belgium, Luxembourg, and the Netherlands—another well-connected and internationalised community of scholars—as well as Malta and Mozambique. While no longer a Scandinavian cluster, this was still a Northern European one. Malta was part of it because of some repeated collaborations between a few productive scholars with colleagues in the Netherlands, and Mozambique because of co-authored publications with scholars in Norway and Denmark.Footnote 11
The Northern European cluster was tightly connected internally as well as externally. Scholars based in the countries that were part of this cluster used to collaborate systematically with colleagues from other countries of the same group. However, this was also a highly internationalised cluster—and a very successful one in terms of scientific production. Three countries—the Netherlands, Sweden, and Denmark—ranked among the world’s top-10 for degree and on most other indicators of centrality and authority. Belgium and Norway followed shortly after.
The Netherlands can be considered an exceptionally successful case. Despite its small size, it ranked fourth globally on most indicators; after the US, the UK and Germany but before Italy, Canada, Australia, or France. Although to a slightly smaller degree, Switzerland, Sweden, Denmark, Belgium and Norway are comparable cases of relatively small but extremely productive and internationalised political science communities. All of them, except Switzerland, were part of the Northern European cluster.
Conclusions
Based on an original dataset of more than 67,000 articles published in high-impact political science journals between 2000 and 2019, this article has provided a bibliometric analysis of the internationalisation of European political science against the broader context of the global scholarship.
The contribution to the international scientific production, as defined for the purposes of this article, is highly concentrated in relatively few countries. In the decade 2010–2019, scholars based in the US contributed more than 40%, and British scholars 15%, of the total production. However, their combined share of the total production was much smaller than in the previous decade. This was to a large extent a consequence of the growth in the output of European political science communities.
The scientific production grew massively between decades, and it became relatively more evenly distributed among countries. This was especially the case in Europe. In 2010–2019, the UK contributed by about one third to the European scientific production; still a large share, but down from 45% in the previous decade. The publication output more than doubled in all but one of the top-20 European countries, and tripled in five of them.
International collaborative research—in the form of co-authorships between scholars based in different countries—is establishing itself as a key engine of scientific production. This is a generalised global trend, and a sustained one in Europe where publications co-authored by scholars based in different countries accounted for more than one fourth of the entire output. They were between four and five times as numerous in 2010–2019 as in the previous decade in Italy, Switzerland, France and Finland; and between five and eight times more in Denmark, Spain, Sweden, Austria, Portugal and Hungary.
Over the past two decades, the global political science scholarship has multiplied its output, broadened its geographic basis, and tightened international collaborations. European political scientists have been central to this development. This is nicely illustrated by the analysis of the international network of country collaborations, which became larger, denser, better connected, and more centralised over time. Three clusters of closer country collaborations were already present in the first observed decade. They all consolidated and increased in size in the second decade. Meanwhile, isolated countries in the network—that is, national scholarly communities publishing in high-ranking journals but with limited or no collaboration with scholars from other countries—went down from almost half to less than one third of the network.
The US and the UK are still central to the global cluster, which comprises almost half of the entire network. European political scientists cluster around two sub-communities: a larger group of scholars based in seventeen countries; and an even more integrated, highly productive and connected core of scholars based in seven Northern European countries.
Against the context of a massively growing scholarly production, and a tightening network of international collaborations, some European countries had an exceptional performance. But all bibliometric indicators consistently point to a generalised growth in the output and internationalisation of the scientific contribution of the European political science community.
Acknowledgements
I am grateful to Massimo Aria and the Bibliometrix Team for advice and suggestions on the use of the Bibliometrix R package. I would also like to thank the guest editors and anonymous reviewers for useful comments and suggestions.
Funding
Open access funding provided by Università degli Studi di Catania within the CRUI-CARE Agreement.
Appendix
A bibliometric analysis of the internationalisation of political science in Europe
Sources
See Table
List of journals included in the analysis, and number of articles by journal in the first and second decade
Contribution to the international scientific production
See Tables
Global scientific production, top-20 countries
5 and
European scientific production, top-20 countries
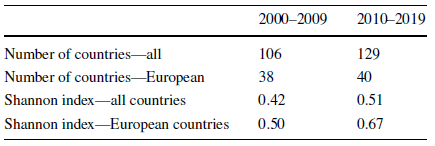
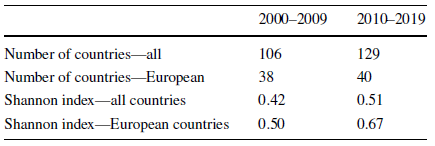
The Shannon index has been developed in information theory and is used across disciplines (including in political science, Boydstun et al. Reference Boydstun, Bevan and Thomas2014) to measure diversity in distributions. Shannon’s index is normalised in Table 4 so that it would take the value of one in case of equal distribution (that is, if authors were spread in equal number across countries), while a value of zero would indicate full concentration (if all authors were based in a single country). As can be seen, Shannon is markedly higher in the second than in the first decade; and this is even more the case when we look at scientific production in the European subset of countries.
See Tables
Indicators of concentration of the international scientific production in the two decades
7 and
International publications. Average country collaborations indices and change
Participation in international collaborative publications
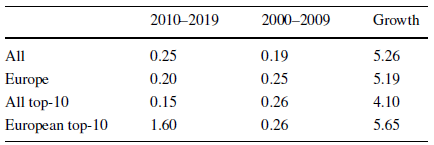
Comparing MCP publications among countries is not straightforward. On the one hand, big scholarly communities tend to be integrated in the international community; the scholars based there may have more resources and opportunities to collaborate internationally. On the other hand, relatively smaller and/or less internationally productive scientific communities have stronger incentives to pursue international collaborations, also in order to get access to more opportunities and resources. For several small scholarly communities, MCP represents most or all of their entire scholarly production.
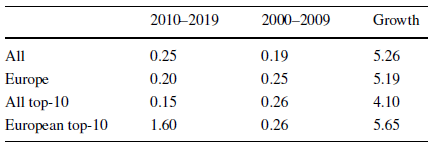
For the same reasons, comparing MCP between European and non-European countries should be done with caution. Several European countries tend to be large contributors to the international scientific production. Therefore, national political science communities in Europe are on the average much larger than scholarly communities in non-European countries, which may bias the comparison. The difference between European and non-European averages should be read against this background. Although rather high in absolute numbers and as a proportion of total publications, in 2010–2019, the average share of MCP was smaller in European countries than in the rest of the world—but it had increased massively from the previous decade. The extent and increase of MCP in Europe can be better appreciated if we compare the top-10 European and the top-10 non-European countries, as in Table 5.
See Table
Single-country publications (SCP) and multiple country publications (MCP), top-35 countries, 2010–2019
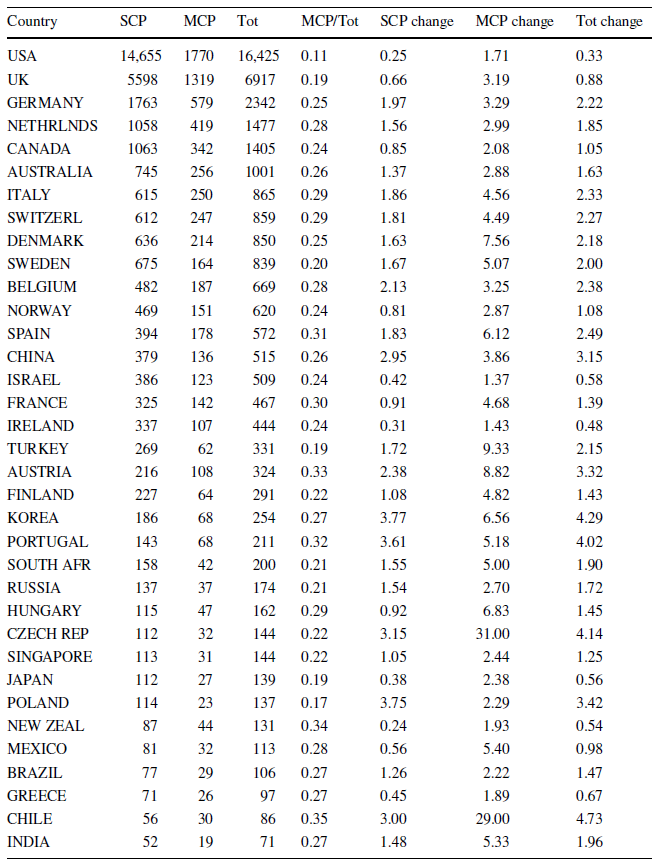
Countries are ranked by Tot (SCP + MPC) number of publications
MCP/Tot: share of multiple country publications on total publications
SCP change: relative increment of single-country publications from previous decade
MCP change: relative increment of multiple country publications from previous decade
Tot change: increment of publications from previous decade
Country collaboration network. Clustering and centrality Indices
See Tables
Country collaboration network. Clustering and centrality of single countries within the network. All countries, 2000–2009
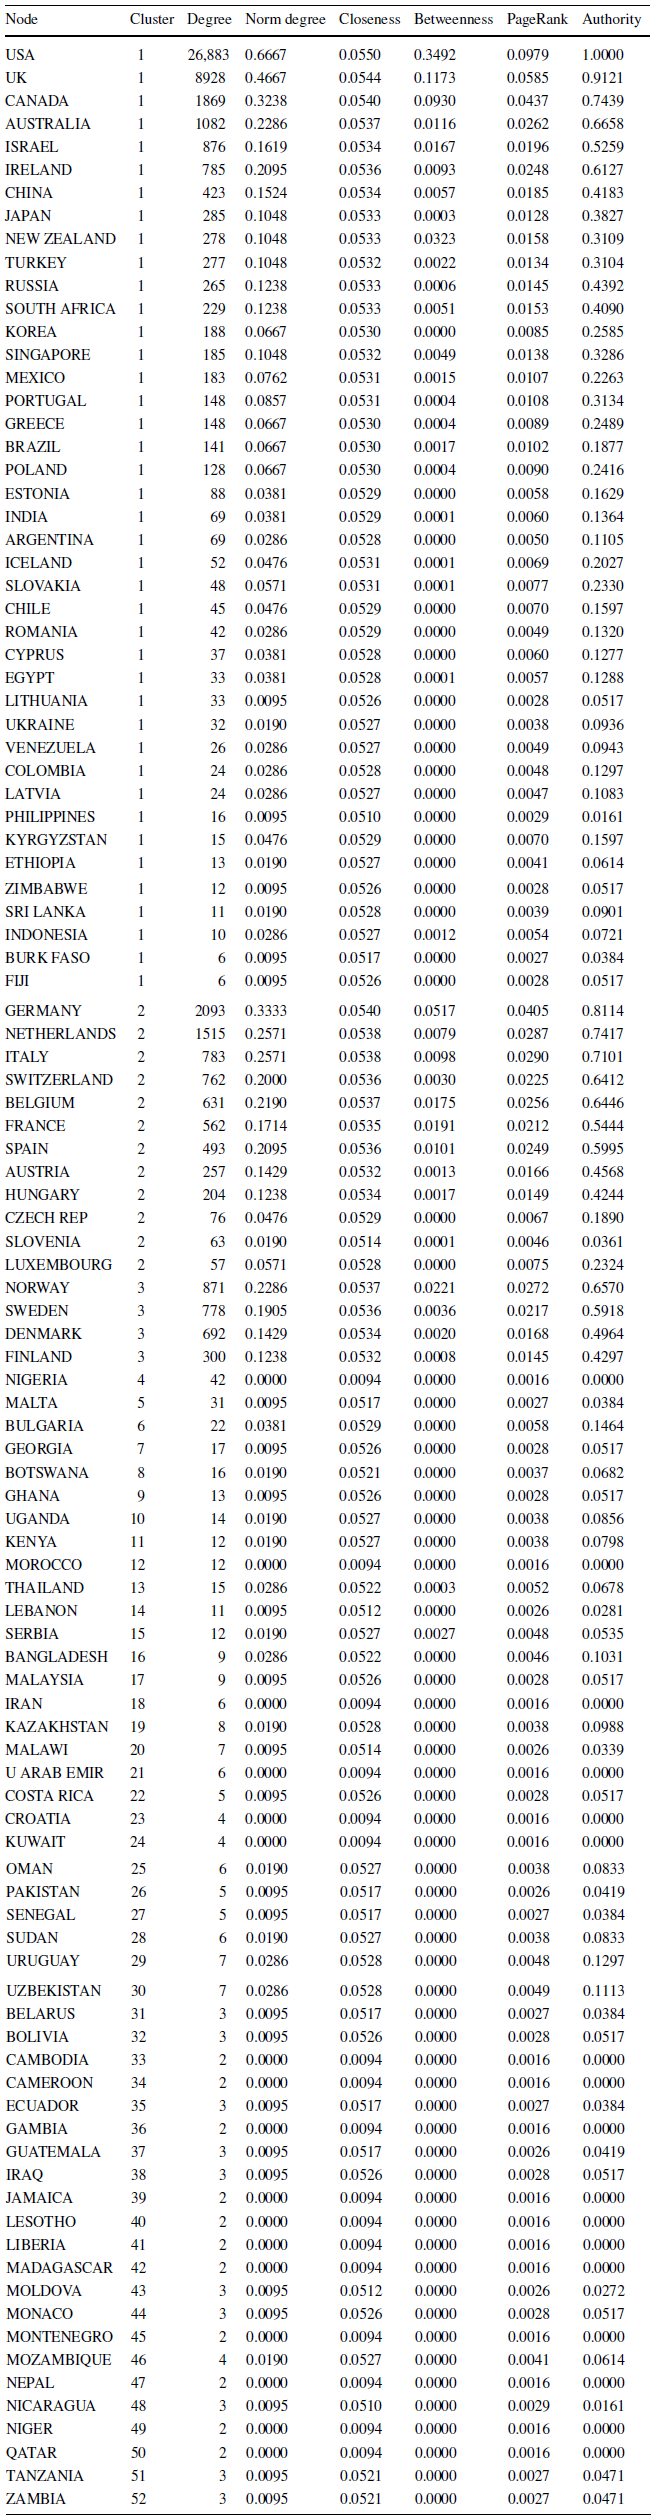
10 and
Country collaboration network. Clustering and centrality of single countries within the network. All countries, 2010–2019
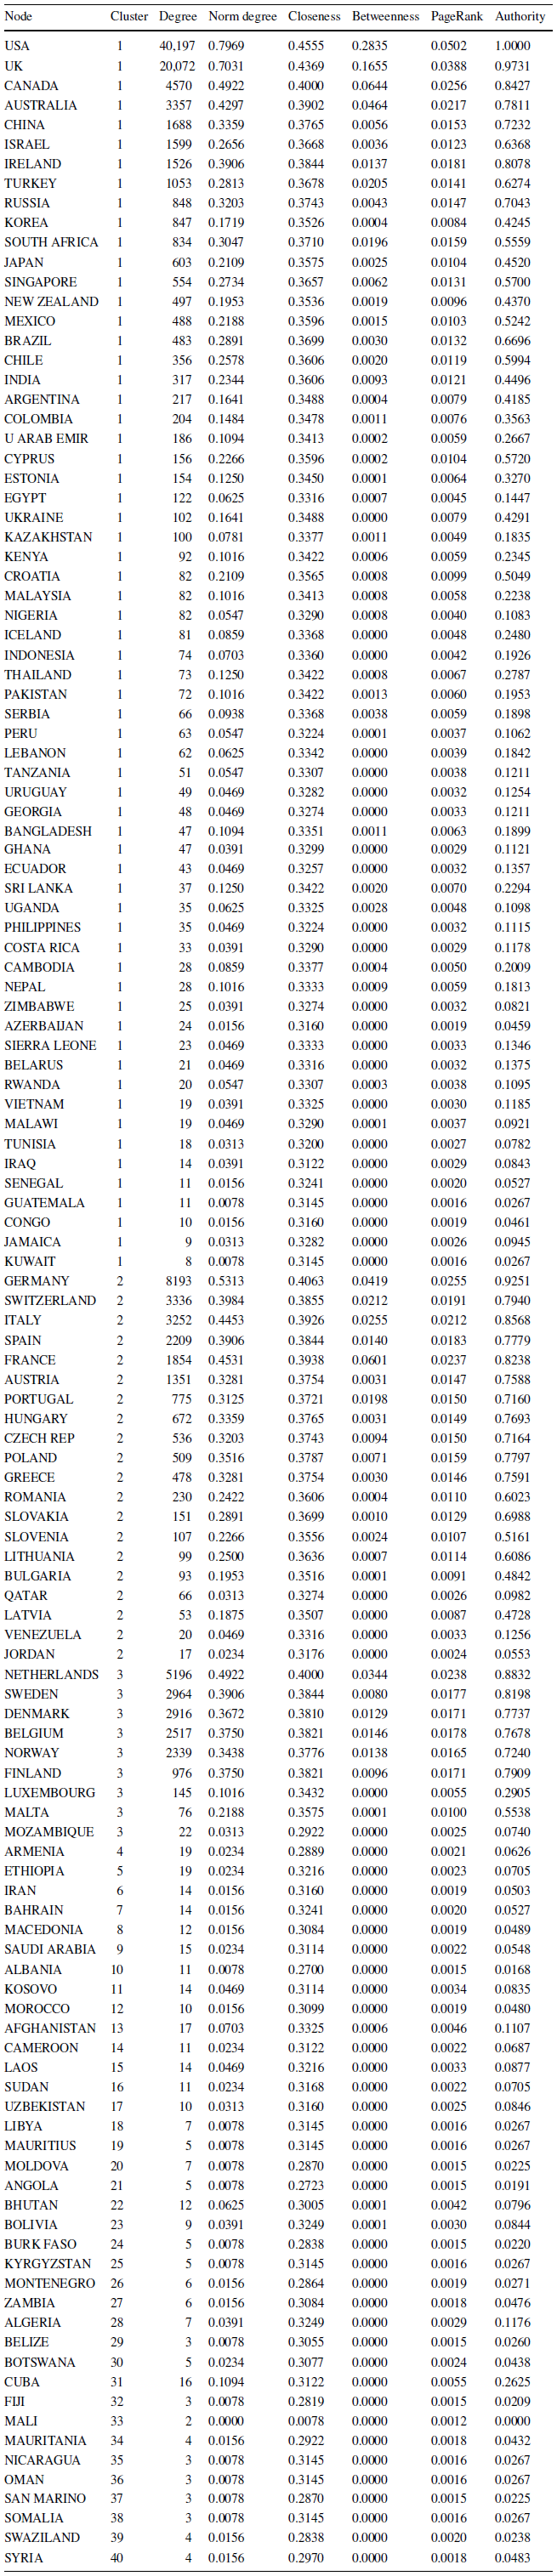

 Open access

