

A Problem of Applied and Pure GlagiolÜgy
laguna parón has filled over 2.9 km of a U-shaped east-west valley, 0.6 km wide, since time immemorial. The nature of the dam across the valley is twofold. On the northern side there is a small and steep alluvial fan, over which flows a little stream, without any spring on its periphery; it can therefore be considered as impervious. On the southern side there is a huge moraine, nearly 300 m high, with at its foot, down-valley, a score of springs. The water comes from Laguna Paron. Although this lake has no open outflow channel, its level remains at a fixed altitude, ±2 m (see Reference Lliboutry, Lliboutry, Morales, Pautre and SchneiderLliboutry and others, 1977 and Fig. 1)
The big moraine turns abruptly by 90° in the middle of the valley without any visible cause. Its lower half supports a narrow glacier tongue, 2 000 m long, 120 m wide, entirely debris-covered ( Fig. 2). An aerial view of this singular glacier has been already published in this journal (Reference ClappertonClapperton, 1972, p. 260). Clapperton calls it “dead ice”. Our picture, Figure 3, shows the active glacier, fed in part by avalanches, from which this so-called dead ice is continuously flowing. This glacier (No. 50ÖA in the CCLCB inventory) was called Glaciar Hatunraju by the Peruvian Geological Service in 1947 (in fact Hatunraju is another name for Huandoy).
Map of the area, as surveyed by CPS. 1 = limit between bare rock and scree; 2 = streams; 3 = limit of debris-covered glacier; 4 = mule tracks {there is an earth road to the tip of the lake by now); 5 = conductivity profiles; 6= tunnel under construction; 7 = springs; 8 = marks on big boulders which were surveyed.

How such a big moraine was built up and why the glacier is crooked are intriguing questions. Glacier sliding over moraine could be better studied there than in any other geographical situation. On the other hand the facilities given to the author were not to do pure science, but to solve, within a limited time, the following practical questions:
(1) Does the bottom of the tongue dip below the lake level? In other words, does the glacier itself contribute to the water-tightness of the dam?
(2) Must we fear any fast evolution in the future, either the formation of a dangerous small lake within the glacier tongue, or a glacier advance which would upset the morainic dam?
Aerial view of the slender tongue of Glaciar Hatunraju.

Unfortunately four planned borings across the glacier could not be made. Because he was relying on these borings, the author had not given instructions to insert ablation stakes in the rare spots where ice was apparent, to determine the vertical movement of ice. (Assuming a stationary glacier, this would give the balance, and thus the discharge.) It appears necessary always to plan to acquire redundant information, since such short-comings are common.
Although the glaciological study has been incomplete, it is worthwhile publishing it to show how to handle insufficient data. Several important conclusions can be drawn in spite of this. They will encourage the young Peruvian glaciological centre under Benjamin Morales to resume the investigation of this most interesting and easily accessible glacier.
Morphological Work
The surface moraine is made of blocks of granodiorite, in general a few decimetres long, reaching sometimes 3 m. With the exception of rolls of sand in places, most of the sand and silt present in the lateral moraine has been Hushed away. Some running water can be heard below, and at least two supraglacial ponds of water exist. The largest one, at 4 525 m, is about 20 m wide. The author rambled over the first kilometre of the glacier tongue and found only two exposures of ice. The main one is a small cliff 6 m long, showing bubbly ice with blue bands and no morainic inclusion
Upper part of Glaciar Hatunraju, and three summits of Hnandoy, improperly named eastern (6030 m, left), northern (6 394 m) and western (6 356 m, right).

On both sides the lateral moraine in 1967 overhung the glacier surface by about 4 m, the upper half being inflated. Thus the glacier surface had lowered by 2 m in the last 20 to 40 years.
The first work done by Corporación Peruana del Santa (CPS), under the supervision of Dr-Ing. B. Schneider, was accurate bathymetry of Laguna Parón. Between a seasonally swamped shelf of fine alluvial clay at the head of the lake and the morainic dam, the bottom was found to be fairly flat, with a slope of only 0.75% ( Fig. 4). The line of springs are exactly along the prolongation of this bottom. Afterwards, down-valley, the slope increases progressively. If there exists any over-deepening of the bedrock, it has been completely infilled with lacustrine sediments.
Longitudinal profile of Laguna Parón, Vertical exaggeration: × 4.

Only one lateral moraine can be seen on the banks of the lake: that on the left. It reaches the water level 1 km from the head of the lake and seems to correspond to a transverse bulge in the bottom, only about 1 m high (there are two such bumps indicated by arrows on Figure 4).
These observations disprove the earlier speculations of Torres Vargas (unpublished) to explain the crooked path of Glaciar Hatunraju. It would not have turned if it had been lying in the middle of a flat, horizontal valley. So he suggested two possibilities:
-
(a) The glacier abuts against an outcrop of granodiorite hidden by the moraine. In fact no Riegel across the valley seems to exist; the valley runs identically, at the same level, on both sides of the moraine.
-
(b) Glaciar Hatunraju and its moraines arc superimposed on an old moraine of the ice age, coming from the head of the valley. If such were the case, some remnants of this old moraine should be seen on the banks of the lake.
The whole huge moraine has indeed been formed by Glaciar Hatunraju. Of course this cannot be only during the small glacier advance of 1923-24 as Reference ClappertonClapperton (1972) says; its construction began as soon as the valley was left by ice, at least ten thousand years ago. Torres Vargas ruled out this hypothesis because he thought that in this case the only explanation for the termination of the moraine in the middle of the valley should be fluvial erosion, and there are no traces of it. Nevertheless this shape can be explained otherwise.
·Sketch to explain how Glaciar Hatunraju may have taken a crooked path.

We suggest that in former times the tongue of Glaciar Hatunraju was straight and ended in the middle of the valley, tying on moraine and surrounded by a thick moraine. There are actually several examples of this situation in Cordillera Bianca. Then came a period of recession, a proglacial lake was formed, which was emptied by an alumón event. A gap was thus formed on the down-valley side of the moraine ( Fig. 5). When, later on, the glacier advanced, it flowed down through this lateral gap. The building up of the moraine continued and there was no reason for the bend to disappear.
Study of the Springs
The springs at about 4 125 m give perfectly transparent water, and their temperatures span between 9°C and 4.5°C. During the dry season the lake temperature is 9°C at the surface, and 5°C at 40-50 m depth (as measured by divers, Reference Lliboutry, Lliboutry, Morales, Pautre and SchneiderLliboutry and others, 1977). It can be therefore assumed that the water of these springs has not been in contact with ice.
Besides these springs, which discharge in total i-a mJ/s, there are a few small milky springs at higher altitudes on the lateral moraines ( Fig. 1). Temperatures and discharges are given in Table I.
Water flowing from the glacier

Since these measurements were made at the end of the dry season, we may state that all this water (7·4±0·4 1/s) comes from the glacier. Nevertheless some évapotranspiration must be taken into account, since in places there are wisps of grass and even small trees (queñua = Polylepis). Moreover, as suggested by a referee, some water may reach the lowest level and mix with the water of Laguna Parón, where the discharge is 200 times larger. Thus the total annual ablation on Glaciar Hatunraju must be larger than the total discharge of the milky springs which is 260 000 m3 per year. We shall estimate the discharge of ice through the highest cross-section, more or less equal to the ablation of ice over the studied tongue, to be 110 000-150 000 m3 per year.
Electrical Exploration
In April 1967, at the end of the rainy season, Ing. J. Arce Helberg made five electrical d.c. profiles following the author's instructions. With his standard geoelectrical equipment, which had too low an impedance, it would have been useless to set electrodes on the ice (Reference RöthlisbeigerRöthlisberger, 1967). So the electrodes were set on both sides of the glacier and the resistance of glacier ice considered as infinite.
The cross-sections of the big moraine are fairly symmetrical, with slopes equal to two-thirds. Thus the Schlumberger configuration was adopted. Electrodes M and N were put on the two sides of the glacier, separated by 2a = 140 m; series of electrodes A and B on both slopes, separated from each other (along the surface) by 2L. An “apparent resistivity” was calculated by the standard formula:

where ΔV is the potential difference between M and N and I the current between A and B. These field data are given on Figure 6. To interpret them, standard master curves for a plane surface and layers of uniform thickness cannot be used. Appropriate curves were drawn at the Laboratoire de Glaciologie in Grenoble by D. Dupont by using resistant paper.
In order to lower the number of unknowns, some shape of the cross-section of the glacier must be assumed. Since the recent lowering of the glacier surface left bare small vertical cliffs of earth, we can say that both sides of the glacier near the surface are vertical. We assumed a semi-circular cross-section, before having other data to hand. Later it became apparent that the depth was actually larger but, since the input of its precise value would not have changed the results consistently, new experiments were not made.
“Apparent resistivity ” fir the profiles P1 to P5

“Apparent resistivity ” curves found with resistant paper (grey), without or with a conducting layer at depth (black).

Dupont's results are given on Figure 7. In order to obtain the observed maximum of the apparent resistivity, a more conducting layer at depth is necessary. Curves were drawn with a conducting layer 200 m below the surface. The position of the maximum (at L = 185 m) was found to be rather insensitive to the existence or absence of a layer of moraine on the surface of the glacier. Thus other depths of the conducting layer were not investigated, to save time. It was said in the final report to CPS that a conductive layer should exist at a depth equal to about 1.08 times the value of L giving the maximum in apparent resistivity, These conclusions, which may be challenged, are given in Table II.
Analysis of d.c. exploration

The fact that there is no conducting layer at depth under the lowest profile P1 excludes the possibility that the conducting layer is an aquifer related to Laguna Parón. We suggest that it consists of rather impervious lucustrine sediments embedded within the moraine.
These layers are indicated on a cross-section in Figure 10. The layer under profile P3 seems to be the origin of springs v, w, x; the layer under P4 and P5, the origin of springs Y, z. The altitude of spring u seems to correspond to the altitude of bedrock at the highest cross-section, where the basin of Glaciar Hatunraju discharges into the main valley.
Surface Velocities
Forty-three marks for topographic, surveying were painted by the author on the biggest boulders of the morainic cover. Some were chosen very near the borders of the glacier with the aim of estimating the sliding, but in several places the precise limit of the glacier was difficult to determine. They were surveyed by CPS on 11 October 1967, 8 February 1968, and 4 June 1968. We have thus the displacements during almost equal intervals of lime (120 and 117d respectively), both belonging to the rainy season. Since the moraine is permeable no basal water layer can form, and thus no seasonal variation of the horizontal velocities is to be expected.
Horizontal displacements of paint marks during two successive internals of 120 d (tails of the arrows) and 117 d (heads of the arrows). Rough data, to be corrected.

The rough data sent by CPS to France are drawn on Figure 8. There appear to be considerable systematic errors, and since the author has not had the note books of the survey to hand, their elimination raises quite a problem. The vectors can be divided into four groups, according to the directions of the differences between the given displacements (slope of the arrows on Fig. 8): 1-7, 8-13, 14-39, and 40-43. It was assumed that the systematic error is the same within each group. Within the main group (14-39), there exists one mark (24) which is undoubtedly outside the glacier. Its displacements were subtracted from the corresponding other ones. For the first and last groups (after multiplying the second displacements by 120/117 to equalize the two intervals of time), opposite corrections were added to both groups of displacements such that their difference vanishes on average. Lastly for group 8-13, both kind of corrections were tried: cither consider mark 13 as motionless, or make the average differences vanish. The movement of mark 12 becomes plausible only with the first correction, which was therefore adopted.
Displacements and velocities on glaciar hatunraju

The corrected displacements and the annual velocities are given in Table III. The two last columns give the coordinates in a curvilinear orthogonal system, with x along the axis of the glacier tongue and O at the front (— 1 ≤y/a ≤ 1).
Horizontal velocities are plotted against the reduced transverse coordinatey/a in Figure 9. For x > 610 m, that is up-valley of the bend, the velocity is almost uniform over 80% of any cross-section. For 250 m < x < 610 m, that is within the bend, the velocities increase almost linearly from the inner to the outer side; the bulk of the glacier bends almost without shear.
Horizontal velocities of Glaciar Hatunraju plotted against the reduced distance from the axis, y/a. The numbers are the values of x, distance from the front along the axis.

Vertical Velocities at the Surface
The vertical movement of the ice may be deduced from the vertical movement of the biggest boulders, the most efficient in protecting ice from ablation. More precisely, if there were no measuring errors (ray curvatures, rotation of some boulders) one could obtain in this way lower limits for the vertical movements.
Since Glaciar Hatunraju is almost stationary, it can be said that the upwards annual velocity of ice relative to the surface equals the ablation of ice (negative balance), averaged over the area and over time. The difficulty is to determine the necessary surface slope. First an average surface profile was drawn by plotting the centre of gravity of the three points where any contour line intersects the curves y = 0 and y = ±a/2. The precise topographic map of CPS at 1: 2 000, with contour lines every 5 m was used for this work ( Fig. 10). The mean surface slope of the glacier tongue over I 150 m, is 0.257, but when taken over 20 m, the surface slope varies between 0.17 and 0.40.
Now we are dealing with the deformation of the whole glacier, about 120 m wide and at least 60 m thick. Thus a mean slope averaged over 120 m was adopted. It still varies between 0.218 and 0.284. The vertical movements of the marks relative to this mean surface over 120 m and reduced to one year, are plotted on Figure 11.
Longitudinal section of Glaciar Hatunraju along its axis. (Vertical exaggeration: X2.5.) The surface profile is an average of the profiles for y = o and y = ±a/2.

Vertical movements of the marks (reduced to one year), relative to a mean surface over 120 m. They give lower limits for the mean negative balances.
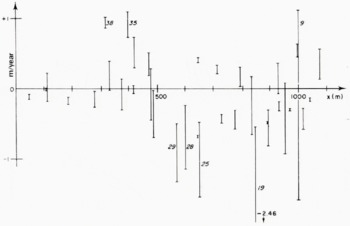
If the ablation under the boulder exactly balanced the upwards movement of ice, points would lie on the, x-axis. Actually the ablation is irregular. It has been higher under boulders 29, 28, 25, 19 and 9 (during the first period). One may fear some slippage of these boulders, leading to inaccurate horizontal velocities. The comparison of the movements during both periods shows that this has only been the case for 28 and, to a lesser degree, for 25. By contrast, boulders 38, 35 and 9 (during the second period) rise to form glacier tables.
Two conclusions can be drawn from Figure 11
-
(a) The smoothed balance seems to be uniform all over the glacier tongue. A progressive thickening of the debris cover towards the front should compensate for a lowering of 300 m in altitude.
-
(b) The mean ablation of ice, say b, is at least 1,1 m of ice per year.
On the other hand the discharge of springs (260 000 m3 coming from about 130 000 m2) shows that it should be less than 2.0 m of ice per year.
Mechanical Model
It will be assumed that the glacier cross-section is a semi-ellipse. For most valley glaciers the cross-section is more like a parabola, but Glaciar Hatunraju lies entirely on moraine; some heat should reach the upper part of the sides across the lateral moraines. Thus, starting from the surface, the glacier width should not decrease very much, or even increase with depth. It has been said that the lowering of the surface has left small vertical cliffs. In any case, since the glacier is entirely embedded within moraine, its cross-section must be of a smooth, convex shape, and its departure from a semi-ellipse cannot alter significantly our estimations.
With the exception of the very end, vertical and transverse velocities are an order of magnitude smaller than the forward velocities. We may therefore use the numerical solutions for parallel flow in an elliptical channel given by Reference NyeNye (1965).
Nye's boundary conditions are a zero velocity at the bed. The stresses and strain-rates remain unchanged if a uniform velocity ub , is added everywhere. Actually there exists some friction law relating ub to the shear stress at the bed Tb ,. Since the bed is permeable and no water layer can form, Weertman's friction law may be assumed as a first approximation (a more precise calculation, to be published, gives an additive term depending upon the ice thickness, which amounts to at most 20% of the total friction, and cannot alter our conclusions):
For a bed with “white roughness ”, m = ½ (n+l), where n is the exponent in Glen's law of ice creep. DuvalFootnote * has definitely shown that, within the stress range involved, n = 3. A simplification of Kamb's theory (Reference LliboutryLliboutry, 1975) leads, in the metre-bar-year system, to:
where m* is the mean quadratic slope of a conveniently filtered bedrock. (In the case of white roughness, m* is related to Kamb's parameter ζ by m* = 6.43 ζ). m* may vary from 0.11 to 0.23, and thus C is an unknown parameter.
A denoting the area of a cross-section and p the wetted (better to say: “glacierized") perimeter, the average friction on it is
Let us consider the flow solution for a given discharge with ub = CTb m everywhere as boundary condition. If the cross-section profile is more hollow than a semi-circle (major axis of the ellipse vertical) Tb is then smaller at the bottom than on the sides. If we change the boundary condition to condition (1), the difference must decrease. Simultaneously ub, must decrease at the bottom and increase on the sides. Thus the velocity at the centre of the ellipse u o and the average velocity on the cross-section ū must not change very much. This consideration enables us to use Nye's solution although his boundary condition is not strictly fulfilled. (Actually it will be found that Weertman's law is not fulfilled either, and probably the boundary condition is nearer to one of uniform velocity,)
The stresses arising from the bend of the glacier, from the changes in the 120 m average slope and from the variations in the longitudinal velocity (ū, averaged over a cross-section), will be neglected.
In the equilibrium equation (z downwards, tensile stresses taken as positive):

An estimate of the last term is, since ūa is approximately constant,

where a is the half-width of the glacier and η an average viscosity.
It reaches his highest value at the head of the studied area: û ≈ 8 m/year, a ≈ 70 m, η ≈10 bar year, d2a/dx2 ≈ (1/500) m-1. It is therefore one order of magnitude lower than pg sin α ≈ 0.02 bar m-1, and may be neglected. (This point is important since it will be shown that the velocities in this area are unexpectedly low.)
Pertinent Equations
Glen's law for ice creep will be written:

Contrary to Nye, we shall take the half-width a as our unit of length (and not the maximum depth h, which is the unknown of the problem). W = a/h will keep the same meaning. We shall also find it more convenient to introduce as unit of stress the known quantity τo = ρg(a/2) α sin α, and as unit of velocity the known quantity V = Baτo¾. Then Equations (4) and (6) may be written in dimensionless form:

Let us note that, contrary to Nye, OZ is downwards, XY along the surface. The solution of Equation (7) with the boundary conditions

leads to a velocity Uo on the X-axis, and an average velocity over the cross-section Ü, which are functions of W only. They can be written:
Nye has shown that

He has computed the solution for three values which become, in our notation, W = ½ ⅓ , ¼ and For W = 1, it is easily shown that cve (1) — 1, ave (1) = ⅔. Interpolating relations valid in the range 0.20 < W < 1.25 are found to be:

For W > 1.25, relations (10) must be used. It may be shown that eve (o) = 8 and ave (o) = 4 (a rigorous demonstration will be published elsewhere).
Turning back to the dimensional variables and the boundary condition ub = constant, we get, q denoting the discharge of ice through a cross-section,

hence

which allows to compute W from the measured quantities a, tan α., q and uo. (In fact, Equation (14) gives two solutions for W, but the smallest one is obviously inadequate.) The first two decimal places may be found from the intersection of a curve giving W as a function [cve (W)— ave (W)] by a straight line; we made a precise calculation to obtain the third one. Then h = a/W is calculated, and ub is drawn from Equation (12).
In order to calculate the average friction <Tb > (Equation (3)), one must calculate:

The integral is Legendre's complete integral of the second kind, denoted E(k2), which is given for instance by Reference Jahnke and EmdeJahnke and Emde (1945, p. 80). Then:

Calculation of Thickness and Friction Law
Six marks were put on the glacier axis. With a weighted mean of the results for two neighbouring marks, one on each side of the axis, six other points on the axis may be considered. Twelve cross-sections can then be studied.
Since b has been assumed to be a constant, the discharge q equals b times the glacier area S between the cross-section considered and the glacier end.
Some values for b and B must be assumed. For increasing values of b, and then of the discharge, we find higher values of A (lower values of W), and then lower values of ub, the lower as B becomes higher. Since ub cannot become negative, this gives at any cross-section, an upper limit for b for a given B. The limiting value will be found by calculating We such that
and then
Calculations have shown that the most stringent conditions are obtained for the uppermost cross-section, where 2S/πa2 = 11.68, V/B = 17.91 and uo = 9.784 (always in the metre-bar-year system). Limiting values be are given in Table IV.
Limiting; values b C for the ablation of ice drawn from glacier dynamics

Careful experiments by DuvalFootnote * on tertiary creep of temperate polycrystalline glacier ice, under a complex state of stress causing the peculiar four-maxima fabric, lead to values of B in the range 0.18 to 0.36 bar-3 year-4. Since
![]() , Table IV then gives little choice for the value of B: it must be the lowest possible.
, Table IV then gives little choice for the value of B: it must be the lowest possible.
Thicknesses, sliding: velocities, and frictions calculated with B = 0.17 bar-3 year-1

B increases with the liquid water content. Assuming that ice of Glaciar Hatunraju, at depth, where the strain-rates are the largest, is very dry because it was formed at very high altitudes, a value as low as 0.17 may be adopted, but not a lower one. (The fact that ice is at the melting point cannot be questioned: the o°C average isotherm is found at 5 500 m and the seasonal variations are insignificant.)
Values of u b and <Tb> calculated with B =0.17 and b = 1.1 arc given in Table V and in Figure 12. The expected Weertman's relation between them (Equation (1)) does not hold. Between x = 315 and x = 476, ub rises progressively from 2.65 m/year to twice this value, while <T b> remains equal to 0.79 bar. Between x = 836 and x = 1 150, ub diminishes from 8.27 to 2.09 m/year, while Tb, increases from 0.74 to 1.18 bar.
Calculations have been made with a lower ablation rate b =. 0.8 m/year, which is scarcely credible. Tb is then lowered everywhere by 8 to 16%, and wb increased everywhere by 3 to 30% (with the exception of the upper cross-section, where it is tripled). It is impossible to find a friction law of Weertman's type in this way.
Sliding velocities plotted against basal stresses calculated using B = 0.17 bar-3year~1 and b - 1.1 m/year (crosses)

Discussion: is Hatunraju Moraine a Rock Glacier?
The discrepancy between the results and Weertman's law cannot be explained by any inaccuracy in the input data, by the approximations made, or by the difference between the boundary condition ub = constant and the actual one. A major process has obviously been omitted. Since the bed is a permeable moraine and the sliding velocities are small it cannot be subglacial cavilation as in other cases.
A clue is given by the fact that the computed sliding velocity increases regularly with x as long as the moraine stands in the flat valley and its thickness increases. Next, as one enters the steep sides of the valley and the moraine thickness decreases, so does the sliding velocity. The biggest discrepancy is found with b = 1.1, at the uppermost cross-section, where the rock basement may be reached. So we suggest that the glacier bed is not motionless. The moraine is dragged by the glacier, the more so when it is thicker.
This last feature shows that the creep process cannot involve only a thin layer of moraine under the glacier, as assumed in Reference Boulton, Wright and MoseleyBoulton's (1975) theory. Hatunraju moraine has therefore some features of a rock glacier, in which the whole mass creeps. Velocities as high as 3.35 m/year have been measured, and over 5 m/year estimated, on a rock glacier of Ötztaler Alps (Reference VictoriaVietoris, 1972). These are consistent with the velocities of up to 6 m/year which must be assumed for the top of the bed in order to reduce the sliding of the glacier itself to values compatible with Weertman's law.
The author's observations in the Andes of Santiago (Reference LliboutryLliboutry, 1964-65, Tom. 2, p. 705-11) have shown that in the earliest stages of development the classical ridges and furrows of rock glaciers do not exist. They are a kind of patterned ground, caused by eluviation of silt and frost-heaving, which has been deformed by the movement. They are not a fundamental and characteristic feature, and we cannot say that Hatunraju moraine is not a rock glacier because such features are lacking.
Nevertheless most authors think that the movement of rock glaciers is due to interstitial ice (Reference Wahrhartig and CoxWahrhaftig and Cox, 1959). The presence of a core of frozen earth 4.5 m to more than 10 m under the surface has been detected by seismic soundings under rock glaciers of Engadine (Reference BarschBarsch, 1973). In the Andes of Santiago the author has observed how strata of debris cover the winter snow blanket, which turns into ice underground. (For this reason it is misleading to speak of this ice-earth mixture as being permafrost.) This cannot be the case in Cordillera Bianca today. The seasonal variations of temperature are insignificant, and Glaciar Hatunraju, where it could be observed, consists of clean ice.
Thus, if there exists an ice-earth mixture underneath, it must have been formed under another climate. More probable seems to be the existence at depth of a body of dead ice resulting from a former advance and retreat of Glaciar Hatunraju.
A third hypothesis would be that the moraine creeps without interstitial ice, owing to lubrication of its boulders by silt and water when dragged by the superimposed glacier. In other words that Boulton's process can involve an important layer of moraine.
This last statement solves an otherwise rather insoluble problem. The volume of Hatunraju moraine is about 92 × 106 m3 Now, the thickness of the debris cover is less than one metre, on average. Let us double this value to account for some basal debris-charged ice layer. This leads to 3 000 m3 of moraine entering into the valley per year at most. At this rate, the time necessary to build the whole moraine would have been over 30 000 years, which exceeds the duration of the Holocene by a factor three. Assuming that moraine is dragged over an average thickness of 15 m, al a velocity decreasing linearly from 5.0 m/year to zero, all along the wetted perimeter (about 170 m), a supplementary discharge of moraine into the valley amounting to 6 200 m2/year is found, which reduces the time for building up the moraine to 10 000 years. If one does not accept the idea of moraine creep without interstitial ice, one must conclude that, during most of Holocene, Glaciar Hatunraju was much richer in debris than it is today.
Let us note that the moraine is moving under the glacier, but we have no proof that it moves on the sides at an appreciable rate. The rough surveying data for mark 24. gave a motion in the direction opposite to that of ice. It has been assumed that this was an observational error. If” this mark actually moves a little forward, this velocity must be added to all the velocities of marks 14 to 39, making the estimated glacier thicknesses a little smaller.
Conclusions
It has been shown that, under favourable circumstances, values of the average ablation b and the thickness may be estimated from mere surveying. The author has reasonable confidence, sufficient for engineering purposes, in the value b = 1.1 m/year, which leads to the lower profiles in Figures 10 and 13. In one area, corresponding to the lower cross-section of Figure 13, the bottom of the glacier thus sinks a little below the level of Laguna Parón.
Cross-sections of Hatunraju moraine. No vertical exaggeration.

The basal velocity u b does not fit Weertman's law, although it should (no thick water layer under the glacier, homogeneous constitution of the bed). Only at the uppermost cross-section can a higher roughness be put forward to explain the very small sliding: the glacier there should lie directly on the rock basement. Elsewhere the discrepancy is explained by a substantial creep of the moraine under the glacier, up to about 6 m/year.
The process allowing this creep is conjectural and deserves more investigation. There may be at depth a rock and dead-ice mixture, or a body of pure dead ice, which was formed in other times. Another possibility would be viscous creep owing to interstial mud, without ice. In the first two cases the melting of this dead ice must be extremely slow, since it is protected by the superimposed thick Hatunraju glacier.
A plausible change of climate may raise the ablation on Glaciar Hatunraju by 0.1 to 0.3 m/year. It will thus take several centuries for this glacier tongue to disappear. The future lowering of Laguna Parón by about 20 m will prevent any catastrophic event caused by this recession.
Conductive layers, which are attributed to fine lacustrine sediments, exist under the glacier. Hatunraju moraine had a long and complex history throughout Holocene. It cannot be a Little Ice Age moraine as stated by Reference ClappertonClapperton (1972), even if the glacier had been larger then. An aluvión event in remote times can explain the strange crooked path of Glaciar Hatunraju.


