

In 2020, the United States experienced the threat of an authoritarian turn in domestic politics during the Black Lives Matter (BLM) protests in the wake of the murder of George Floyd on May 25, 2020, in Minneapolis. The Trump administration responded to the protests with an often massive show of force and political messages that closely resembled those commonly found in authoritarian contexts (Lupton, Burbach, and Cohn Reference Lupton, Burbach and Cohn2020). Trump’s rhetoric, including the threat of a violent crackdown,Footnote 1 and many of the videos and photographs distributed by his administration during the BLM protests stand out. As noted by scholars and journalists at the time (Haltiwanger Reference Haltiwanger2020), the rhetoric and images resembled the type of overt, even comical, display of strength and power usually only associated with authoritarian governments, such as staged images of the president accompanied by loyal bureaucrats and military leaders or surrounded by security forces. This so-called hard propaganda is regularly used to signal strength and deter antigovernment activities in authoritarian regimes (Carter and Carter Reference Carter and Carter2022; Reference Carter and Carter2023; Dukalskis Reference Dukalskis2017; Huang Reference Huang2015; Reference Huang2018; Lutscher and Donnay Reference Lutscher and Donnay2024; Rosenfeld and Wallace Reference Rosenfeld and Wallace2024; Wedeen Reference Wedeen2015). However, the perception of such propaganda in democracies remains poorly understood. Can overt and crude visual propaganda also project strength in these settings? Or does the use of hard propaganda in democracies potentially backfire?
The 2020 BLM protests were not only one of the most salient and polarized events in recent US history but they were also a rare instance in which this kind of propaganda was used in a democratic setting. In this study, we leverage this unique opportunity to empirically test how hard propaganda is perceived outside the autocratic settings in which it has been studied thus far. Following the literature on authoritarian information control (e.g., Huang Reference Huang2015; Roberts Reference Roberts2018; Rosenfeld and Wallace Reference Rosenfeld and Wallace2024), features of democracy (e.g., Dahl Reference Dahl1973; Weingast Reference Weingast1997), contentious politics (e.g., Gurr Reference Gurr2015), and political polarization (e.g., Taber and Lodge Reference Taber and Lodge2006), our theoretical argument is that partisanship matters decisively for how this kind of propaganda is perceived in democracies. Government opponents should perceive overt hard propaganda images as a sign of weakness and inappropriate in their use; instead, they may take this kind of propaganda as a motivation for further political action. Government supporters, in contrast, expect messages from their government that signal stability and social control. They should thus be more likely to perceive even authoritarian-style hard propaganda images as an appropriate display of strength.
We administered a preregistered survey to an online panel of about one thousand voting-age adults in the United States to robustly measure how respondents perceived different kinds of visual hard propaganda during the height of the BLM protests in June 2020 shortly after their actual use by the Trump administration. In the survey, our respondents, who closely resemble the US adult voting population with respect to key demographic dimensions and party affiliation, were shown randomized pairs of images depicting President Trump. The images show Trump either framed by security forces or surrounded by his loyal bureaucrats and were posted by the Trump administration in the context of the BLM protests. These images are typical examples of visual communication strategies used by his administration. The media at the time characterized these types of images and accompanying videos as overtly authoritarian propaganda.Footnote 2 Our design then tests whether the kinds of hard propaganda these images represent are perceived differently relative to a standard “presidential” messaging showing Trump sitting at his desk in the Oval Office. Specifically, we asked respondents to choose between and rate the images with regard to how each projected government strength, what image they found more appropriate to use, and the images’ mobilization potential.
We show that, contrary to our expectations, the potential of hard propaganda to communicate higher levels of government strength in a democratic setting is quite similar to that in autocracies (Huang Reference Huang2015; Reference Huang2018; Lutscher and Donnay Reference Lutscher and Donnay2024). Those among our respondents who were Trump supporters perceived hard propaganda as communicating more strength than standard political communication. And even though Trump opponents generally perceived messaging by the Trump administration as weak, the more coercive forms of hard propaganda also increased strength perceptions among Trump opponents: They were perceived as stronger (or less weak). Similar to findings from autocratic settings (cf. Lutscher and Donnay Reference Lutscher and Donnay2024), Trump opponents perceived this kind of messaging as less appropriate than standard presidential messaging, whereas Trump supporters did not perceive hard propaganda as any more or less appropriate. In line with our expectations, we also saw a clear rise in mobilization potential among Trump opponents.Footnote 3
Our findings therefore suggest that the kind of hard propaganda used by the Trump administration during the BLM protests can, relative to standard political communication, increase perceptions of government strength across partisan divides. Contrary to the expectations from the literature on hard propaganda in autocratic settings (Huang Reference Huang2015; Reference Huang2018; Lutscher and Donnay Reference Lutscher and Donnay2024), this does not necessarily mean that opponents perceive this kind of propaganda as communicating strength nor that it serves as a protest deterrent in a democratic setting. US citizens have the constitutional right to challenge the government and do not generally have to fear severe consequences from doing so, in contrast to citizens in autocratic regimes. What we find with respect to mobilization potential suggests that these differences in political context matter: Trump opponents indicated that they would be more willing to protest when exposed to hard propaganda. This is consistent with prior work that highlights the role of coercive messages in spurring antigovernment collective action (LeBas and Young Reference LeBas and Young2024; Lichbach Reference Lichbach1998; Martin Reference Martin2007; Sullivan and Davenport Reference Sullivan and Davenport2017).
In the present, highly polarized US political landscape, authoritarian practices seem to be increasingly accepted by a substantial portion of the electorate (Arceneaux and Truex Reference Arceneaux and Truex2023; Graham and Svolik Reference Graham and Svolik2020; Svolik Reference Svolik2019). This makes it all the more pressing to better understand whether practices such as hard propaganda (also) work and how exactly they are perceived in democracies. The answers that our findings provide are nuanced. Yes, the kind of hard propaganda used by the Trump administration during the BLM protests could have been effective in increasing the perception of the government’s strength and resolve across partisan lines. But, no, this kind of propaganda, even if perceived as stronger than typical political messaging, is unlikely to have the same deterrence effect in the US democratic setting as it has in autocracies. Disconcertingly, however, Trump supporters did not find the use of such hard propaganda images any more or less appropriate than the use of standard political communication. These findings thus contribute to a growing larger body of evidence that studies the potential impact of the erosion of political norms, democratic practices, and institutions in polarized democracies (Bowler, Carreras, and Merolla Reference Bowler, Carreras and Merolla2023; Clayton et al. Reference Clayton, Davis, Nyhan, Porter, Ryan and Wood2021; Fiorina and Abrams Reference Fiorina and Abrams2008; Graham and Svolik Reference Graham and Svolik2020; Hetherington and Weiler Reference Hetherington and Weiler2009; McCoy, Rahman, and Somer Reference McCoy, Rahman and Somer2018; Svolik Reference Svolik2019).
Hard Propaganda in Autocracies
Authoritarian governments rely on propaganda to stay in power (Rosenfeld and Wallace Reference Rosenfeld and Wallace2024). Early work in the literature on authoritarian politics emphasizes the reliance of totalitarian regimes on propaganda for indoctrination purposes (Friedrich and Brzezinski Reference Friedrich and Brzezinski1965). Modern-day autocracies instead tend to use propaganda to persuade citizens and display competence (Guriev and Treisman Reference Guriev and Treisman2019). This is not fundamentally different from political communication in democracies where politicians and partisan media aim to persuade voters (DellaVigna and Gentzkow Reference DellaVigna and Gentzkow2010). Yet, the main—and very visible—difference is that authoritarian governments often also employ relatively crude and heavy-handed forms of propaganda. This kind of propaganda typically relies strongly on visual imagery to convey simple but powerful messages that signal government strength and resolve. Examples include posters showing the regime leader in powerful and absurd poses, statues, or propaganda videos bluntly praising the government (Huang Reference Huang2015; Wedeen Reference Wedeen2015).
One branch of the literature describes such heavy-handed forms of propaganda as “hard propaganda” (Dukalskis Reference Dukalskis2017; Huang Reference Huang2015; Reference Huang2018). The goal of this type of propaganda is not to persuade citizens of the government’s competence or ideology but to signal regime strength, dominate, and deter antigovernment actions. To put it differently, the relatively obvious and heavy-handed presentation of such propaganda reflects the regime’s confidence and dominance (Dukalskis Reference Dukalskis2017). According to Huang (Reference Huang2015), hard propaganda works because citizens infer that the government is strong and capable of coercion from the fact that it can use such obvious and heavy-handed forms of propaganda. As a consequence, citizens perceive hard propaganda in the form of images or other visual content as signaling strength, which may make them less likely to participate in antigovernment activities for fear of government reprisals (see Young Reference Young2019 on the role of fear on antigovernment behavior). At the same time, this body of research finds that hard propaganda decreases the level of satisfaction with the government and that citizens in autocracies dislike such forms of propaganda (Huang Reference Huang2018; Lutscher and Donnay Reference Lutscher and Donnay2024).
Several theoretical models from autocratic politics show that—especially during contentious periods—regimes should leverage hard propaganda to prevent being overthrown and to signal resolve (Edmond Reference Edmond2013; Svolik Reference Svolik2012). Although there was no revolutionary threat in the US context, the carefully staged images and videos of the Trump administration during the BLM protests, which show the president surrounded by security forces or political elites, place the same kind of emphasis on the government’s political and coercive power. It is important to note that the use of coercive messaging in the context of mass protests in the United States is not new (see Thurston Reference Thurston2018 for a comprehensive discussion). For example, the Nixon administration catalyzed the criminalization of African Americans and framed the civil rights protests as riots (Stanley Reference Stanley2018). What is new, however, and is not yet well understood is how citizens in democracies perceive such overt and often even absurd forms of propaganda. This study aims to contribute to closing that research gap.
The Perception of Hard Propaganda in Democracies
Insights from the literature on authoritarian politics suggest that overt propaganda messages of government strength should, in principle, also be able to convey strength in democratic settings. Governments that use this form of propaganda send a signal of strength that distinguishes them from weak governments. Hence, based on an expected cost-benefit analysis, citizens should perceive the government as strong and believe that their fellow citizens think the same way (Huang and Cruz Reference Huang and Cruz2022), making them less willing to engage in antigovernment activities (Huang Reference Huang2015; Reference Huang2018). Moreover, and in line with the persuasive communication literature (DellaVigna and Gentzkow Reference DellaVigna and Gentzkow2010), the signal of strength is reinforced when the content of the propaganda message emphasizes political and coercive power more explicitly through direct threats (Carter and Carter Reference Carter and Carter2022) or images highlighting support of the security forces (Lutscher and Donnay Reference Lutscher and Donnay2024). Concerning the use of visual propaganda, there is a more general and large body of research showing that visual political communication such as images influences human behavior to a greater extent than rhetoric because it reinforces attention and emotional reactions (Grabe and Bucy Reference Grabe and Bucy2009). This is one reason why political leaders often rely on photographs, posters, and videos to convey messages (Schill Reference Schill2012). The baseline expectations derived from the literature on autocratic politics are thus: Relative to standard political communication, (1) citizens should perceive hard propaganda images as communicating greater strength and (2) also demobilizing in democracies. Finally, just as in autocratic settings, citizen in democracies should (3) be more disapproving of such forms of propaganda than of standard political messaging (cf. Huang Reference Huang2018; Lutscher and Donnay Reference Lutscher and Donnay2024).
However, there are several major differences between authoritarian and democratic regimes with regard to political competition, citizens’ rights, and information control. Foremost, democracies ensure free and fair elections, and in most cases, at least two or more parties compete for political power relying on citizen support (Skaaning, Gerring, and Bartusevičius Reference Skaaning, Gerring and Bartusevičius2015). Second, democracies ensure their citizens’ right to protest against the government and guarantee that they do not need to fear severe personal repercussions from doing so (Dahl Reference Dahl1973). Finally, government channels are not the only source of information citizens rely on, and the media is free to criticize the government and its actions (Cook Reference Cook1998). Although these factors are obviously not the only differences between democratic and authoritarian regimes,Footnote 4 they are relevant for the scope conditions of our study: fair political competition, which often comes with a certain degree of political polarization (Bowler, Carreras, and Merolla Reference Bowler, Carreras and Merolla2023); citizens’ rights to protest (Weingast Reference Weingast1997); and a free media system.
Taking these factors into account, it remains unclear whether overt hard propaganda shown by democratic leaders can universally signal strength and be perceived as a protest deterrent in democracies. Citizens in democratic settings may perceive the threatening signal of authoritarian hard propaganda as not credible enough or even as absurd. Although visual propaganda also has a long tradition in democracies—for example, in the form of mobilization posters for wars (Jowett and O’Donnell Reference Jowett and O’Donnell2012) or in political campaigns (Seidman Reference Seidman2008)—the kind of crude propaganda images used to signal strength and government power deployed in autocracies are the exception in democratic contexts. Following the literature on political polarization, we argue that, for citizens opposing the government, the use of threatening and polarizing messages should be less likely to effectively signal strength or may even have the opposite effect (cf. Taber and Lodge Reference Taber and Lodge2006). In addition, seeing threatening propaganda messages during contentious periods could further enrage citizens opposed to government policies, who might perceive such messaging as highly inappropriate (cf. Huang Reference Huang2018; Lutscher and Donnay Reference Lutscher and Donnay2024). This could spur resistance against the government and mobilize government opponents to take part in antigovernment collective action (e.g., Aytaç, Schiumerini, and Stokes Reference Aytaç, Schiumerini and Stokes2018; Gurr Reference Gurr2015; Martin Reference Martin2007; LeBas and Young Reference LeBas and Young2024; Lichbach Reference Lichbach1998; Sullivan and Davenport Reference Sullivan and Davenport2017).
Government supporters, in contrast, should be more likely to believe and accept even authoritarian propaganda messages by their government because it closely aligns with their own ideological preferences (e.g., Allcott and Gentzkow Reference Allcott and Gentzkow2017; Bullock Reference Bullock2011; Druckman, Peterson, and Slothuus Reference Druckman, Peterson and Slothuus2013; Gläßel and Paula Reference Gläßel and Paula2020; Jowett and O’Donnell Reference Jowett and O’Donnell2012; Taber and Lodge Reference Taber and Lodge2006). This should be true particularly in polarized settings such as the United States, in which citizens increasingly prioritize partisanship over democratic principles (see, e.g., Graham and Svolik Reference Graham and Svolik2020). In fact, as shown in Arceneaux and Truex (Reference Arceneaux and Truex2023), a substantial share of Trump supporters appear to believe Trump’s “big lie” of a stolen election in 2020, which can be regarded as another common practice borrowed from authoritarian politics. During contentious periods, supporters expect their government to show that it is in control of the situation and can guarantee social order; hence, they could regard the use of hard propaganda as appropriate. In the context of the highly polarized discourse surrounding the BLM protests, Trump supporters may also be more likely to perceive such messaging as an appropriate sign of strength because they see the protesters as rioters or criminals, in line with prior messaging in US history (Stanley Reference Stanley2018).
Therefore, the perception of hard propaganda in (polarized) democracies such as the United States can be expected to vary strongly between government supporters and opponents. Relative to standard political communication, government opponents should be less likely to perceive hard propaganda as a signal of government strength or to find its use to be appropriate; it should also increase their mobilization potential. In contrast, we expect government supporters to be more likely to perceive hard propaganda as communicating strength and as appropriate for the government to use. Our theoretical expectations are summarized in the following three preregistered hypotheses:Footnote 5
(H1) Relative to standard political communication, government opponents (supporters) are more likely to perceive hard propaganda as weakness (strength).
(H2) Relative to standard political communication, government opponents (supporters) are more likely to perceive hard propaganda as inappropriate (appropriate).
(H3) Relative to standard political communication, government opponents are more likely to perceive hard propaganda as having antigovernment mobilization potential.
Research Design
The use of images to boost the effect of political messaging has a long tradition in US politics (Grabe and Bucy Reference Grabe and Bucy2009; Seidman Reference Seidman2008; Veneti, Jackson, and Lilleker Reference Veneti, Jackson and Lilleker2019). The rise of online news portals and social media platforms has further increased the relevance of visual political communication (Veneti, Jackson, and Lilleker Reference Veneti, Jackson and Lilleker2019: chap. 9). The ability to instantly share and reshare images with a wide and even global audience was important in Trump’s first presidency, particularly for protesters during the wave of BLM protests in the summer of 2020 (see Bennett and Segerberg Reference Bennett and Segerberg2012 for the logic of connective action). In such a highly contested and polarized political and media setting, the choice of imagery used by the government is just as important as their reach and therefore closely scrutinized. How the US president is depicted, in turn, represents very deliberate and strategic choices that determine the kind of political messaging used by the administration. But how can we empirically test the impact of such different visual messaging (or propaganda) strategies?
Testing the impact of specific imagery on recipients’ perceptions and attitudes is notoriously difficult for several reasons. Images are usually not used in isolation; they are often accompanied by text or other media, and individuals could be exposed to them repeatedly and through different channels. In addition, the ability to easily reshare images on large social media platforms gives specific images (or corresponding memes) very significant reach beyond their original usage (Bennett and Segerberg Reference Bennett and Segerberg2012; Mina Reference Mina2019). But although studies illustrate the immediate effects of exposure to specific imagery or videos, this exposure typically has no lasting effects on individuals’ attitudes (Bush et al. Reference Bush, Erlich, Prather and Zeira2016; Wuttke, Sichart, and Foos Reference Wuttke, Sichart and Foos2024). Indeed, it is not plausible that short exposure to specific images could actually alter individuals’ attitudes or preferences, especially in the context of (hard) propaganda. What we are interested in here instead is how longer-term exposure to specific kinds of (visual) propaganda strategies affects perceptions of government strength and individuals’ mobilization potential.
The methodological challenge is then how to derive systematic evidence on the perceptions of such different (visual) communication strategies in the setting of a one-off anonymous online survey. We can plausibly assume that our respondents have already been exposed to different kinds of (visual) messaging or propaganda before taking the survey. President Trump’s statements during the BLM protests were widely reported on television, in print, online, and in social media. In addition, we ensured that all images used in this study were parts of official communications put out by the Trump administration shortly before our survey was fielded. Thus, we were not interested in the immediate effect of showing respondents specific images of President Trump but rather used them as a representation or reminder of the way in which he was depicted in carrying out his duties in the context of the BLM protests. By exposing respondents to images actually used by the Trump administration during our study period, we also avoided the risk of “misinforming” respondents (Barnfield Reference Barnfield2023).
We deliberately decided to use image- rather than text-based content for two reasons. First, hard propaganda is often transported visually, especially in autocratic settings (Lutscher and Donnay Reference Lutscher and Donnay2024). Although it is possible to communicate the same kind of propaganda messages through text, especially salient images such as the ones we used in this study carry the same message more directly and intuitively. This is the second reason why we opted for images: They are simply more intuitive and accessible to respondents than text-based vignettes describing different choices for how the Trump administration communicated in the BLM context.
However, only showing individual images to respondents does make it very difficult for them to reveal their preferences and, in turn, limits our ability to arrive at reliable comparisons.
Our research design addresses this issue by exposing them to typical examples of different pairs of visual communication (or propaganda) strategies—providing two images side by side and asking respondents to choose between and rate them along different dimensions. For two of our outcomes that relied on forced-choice comparisons of strength and appropriateness, the resulting comparisons between the different visual hard propaganda these images represented were then, by construction, only relative. Yet using these kinds of relative comparisons across all respondents at the same time ensures more reliable inferences. For the other two outcomes—political strength and mobilization potential—we elicited separate ratings for each image; thus, these measures were not strictly relative, even though respondents viewed these images in the same context. Because we fully randomized the image-pair assignment to our respondents, variations in the outcomes we observe were well identified. That is, we could use this setup to robustly explore differences in our measured outcomes relative to our reference image.
Finally, because we are interested in partisan differences, we designed our task such that randomization was performed independently for (self-identified) Trump supporters and opponents; that is, any effects we observe were well identified both within and across the two groups. In addition, we also looked at (correlational) subgroup differences or heterogeneous perceptions along other key dimensions, such as level of education, news consumption, or the respondents’ type of neighborhood.
The research design used in this study was fully preregistered. The pre-analysis plan registered with OSF is available at https://osf.io/gj2tc. We discuss our detailed design choices in this section, and all deviations from the pre-analysis plan are highlighted in the main text and summarized in table A.1 in online appendix A.Footnote 6
Survey Design
The online survey used in this study draws on a sample of 1,019 US respondents closely resembling the US adult voting population with respect to core demographics—including age, gender, race, and state of residency—and party affiliation. Specifically, we relied on the online service MySoapBox provided by Interviewing Service of America (ISA), which recruits panelists from multiple channels, including online, telephone, mobile, face-to-face, social media, and print. In online appendix B we provide additional details on the recruitment and our sample. The survey ran from June 12 to June 16, 2020, during a critical phase of the BLM protests in which the Trump administration actively employed visual messaging that had characteristics of overt and crude hard propaganda.
As already mentioned, we used randomized assignment of image pairs for which we elicited forced-choice and rating outcomes. Respondents were asked to choose between and rate perceptions of the pair of images shown to them along three dimensions: the ability of the images to project government strength, the appropriateness of their use in this situation, and—as a measure of the mobilization potential of each image—the respondent’s own willingness to join antigovernment protests after seeing both images.
The images we showed to our respondents all featured President Trump: Two represented hard propaganda messaging, and the third—our reference image—was a standard, presidential image in the Oval Office. Including a reference image in the set of images we displayed helped establish a common baseline for respondents’ perceptions.Footnote 7 The two propaganda images we used were distributed by the Trump administration approximately one week before the survey was fielded. That is, most of our respondents likely either already saw those specific images or comparable propaganda images depicting President Trump. In fact, 85% of respondents stated that they followed news daily or several times a week. Given the high salience of the BLM protests during that time, it is thus very likely that, even if they did not encounter these or similar images, they would have seen news reports about their use. The specific choice of images are discussed in more detail next.
Images
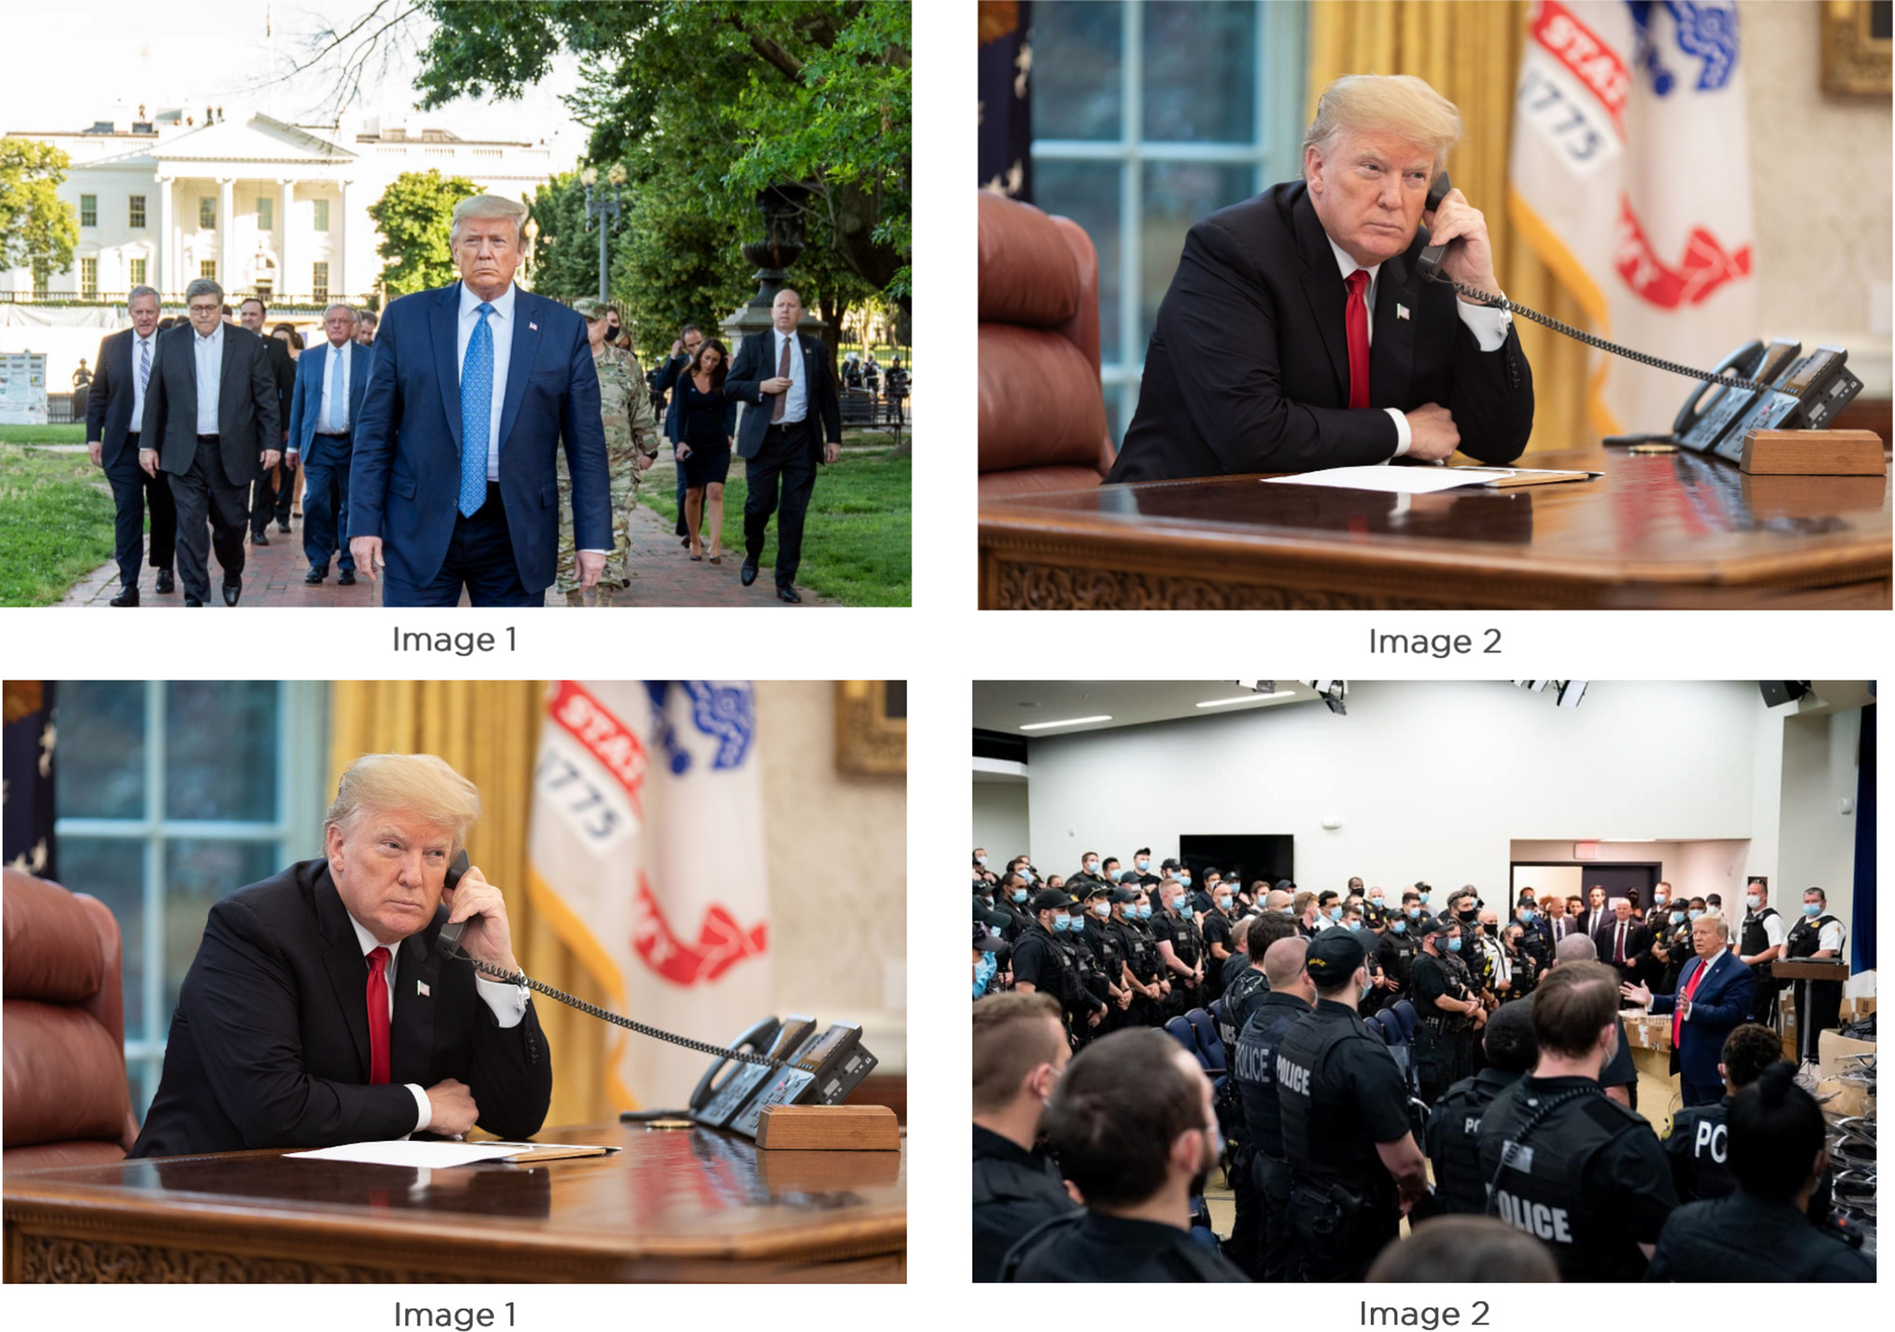
We used three images drawn from the social media communications of the official White House account and President Trump. Before showing respondents the images, we informed them that they had been posted on the administration’s official social media accounts. Respondents were each shown one randomized pair of two of those images. Figure 1 shows the images we used and two potential combinations of how respondents saw them.
Bureaucrats and Police Propaganda Images each shown next to the “Presidential” Reference Image.
Notes: Images are arranged side-by-side in two potential combinations of how respondents saw them. The image on the top left is the bureaucrats propaganda image showing Trump marching with his inner circle (posted June 2, 2020, viewing statistic of the related video: 13 million). The image was taken by the White House press photographer Shealah Craighead and downloaded from the Twitter Feed of the White House: https://twitter.com/WhiteHouse (accessed June 12, 2020, and again for the viewing statistics on August 27, 2020). The image on the bottom right is the police propaganda image focusing on the support of the security apparatus (posted June 6, 2020, engagement statistics: 3,900). This and the reference image (top right and bottom left) were taken from the Facebook page of President Trump, https://www.facebook.com/DonaldTrump (accessed: June 12, 2020, and again for the engagement statistics on August 27, 2020).

The bureaucrats propaganda image closely represents the concept of hard propaganda, showing Trump walking with his loyal bureaucrats and inner circle, including General Mark Milley, chairman of the Joint Chiefs of Staff, in front of the White House. This image was taken as part of a wider publicity campaign by President Trump on June 1, 2020, which also included his visit to St. John’s Church holding a bible. Many media outlets subsequently labeled the campaign as overtly authoritarian strongman propaganda.Footnote 8 The image therefore very closely resembles the heavy-handed and almost comical character of hard propaganda previously only known from authoritarian countries such as China, Syria, Venezuela, and North Korea (Huang Reference Huang2015; Lutscher and Donnay Reference Lutscher and Donnay2024; Wedeen Reference Wedeen2015). The second propaganda image, police propaganda, represents the coercive aspect of hard propaganda more explicitly and shows President Trump giving a speech to security forces. As shown in the literature, hard propaganda pertaining to coercive power and threat reduces the likelihood of antiregime activities the most (Carter and Carter Reference Carter and Carter2021; Huang Reference Huang2018; Lutscher and Donnay Reference Lutscher and Donnay2024). The third image—our reference image—represents a typical “presidential” image of Trump at his desk in the Oval Office.
We chose these specific images because they most closely align with the typical definition of hard propaganda in the unique context—the highly contentious political period surrounding the BLM protests in the United States in 2020—in which they were used. According to Huang, hard propaganda shows crude and heavy-handed forms of propaganda messages meant to signal regime strength; for example, “posters with wooden slogans” or “mawkish movies with patriotic themes” (Hernandez Reference Hernandez2016, as cited in Huang Reference Huang2018, 1034) that are often used “following major anti-government movements” (Huang Reference Huang2015, 435; see also Wedeen Reference Wedeen2015). The images showing Trump together with his loyal bureaucrats and with security forces follow this logic exactly, serving as an implicit reminder of coercive power and nonverbal threats in the context of a highly contentious political period.
The reference image shows perhaps the most well-known presidential pose that all, or nearly all, US presidents historically have used in their official communications: the Oval Office shot. The photo shows President Trump going about his duties but in a neutral, presidential setting that does not significantly differ from where his predecessors would have been conducting official business. Of course, our reference image may in itself elicit perceptions of strength of the Trump administration; even so, our results based on the relative comparison should then be more conservative estimates. It is important to note also that our reference image differs from the two other images because it is the only one to show Trump by himself. This could, of course, also influence perceptions of the reference image compared to the two hard propaganda images.
Outcome Questions
We are interested in four main outcomes related to how individuals perceive different types of propaganda in terms of government strength, their appropriateness, and their mobilization potential. After seeing an image pair, respondents answered the following outcome questions. First, in a forced-choice task, they chose the image in which they perceived the Trump administration to be stronger. Second, we asked them to rate each image separately as to how well it conveyed political strength. Third, respondents chose the image they personally found more appropriate for use in a press release. Finally, we asked respondents to rate for each image their own willingness to join antigovernment protests after seeing it (see online appendix B.2 for the exact question wording).
We used two strategies to measure strength perceptions—one using a forced-choice task and the other rating outcomes—because of the nature of the different constructs we were trying to measure. Given that the question on general strength perceptions is broader and more subjective, we therefore opted to measure it only as a relative comparison between images. The question about political strength is more specific, and we were also interested in capturing differences in respondents’ baseline perceptions of the Trump administration’s use of these images, which we measured as (absolute) strength ratings. Questions about appropriateness are again typically marred by different baseline expectations for what is appropriate; therefore, we elicited this response only as a relative measure.
Asking respondents to rate protest willingness is a standard question in many survey-based studies on protest, but because it asks for hypothetical behavior, it should not be interpreted as measuring actual changes in protest turnout (Kwak Reference Kwak2022)—even though there is some prior research suggesting that reported protest behavior often correlates with behavioral measures of dissent (Young Reference Young2019). In the anonymous setting of our survey, it is impossible to map individuals to actual behavioral data. Asking about intended or hypothetical behavior is the next best alternative. Mindful of the limitations of this measure, we here intentionally used it as a proxy for the broader mobilization potential of the communication strategy that these images represent and only interpret it as such.
Method
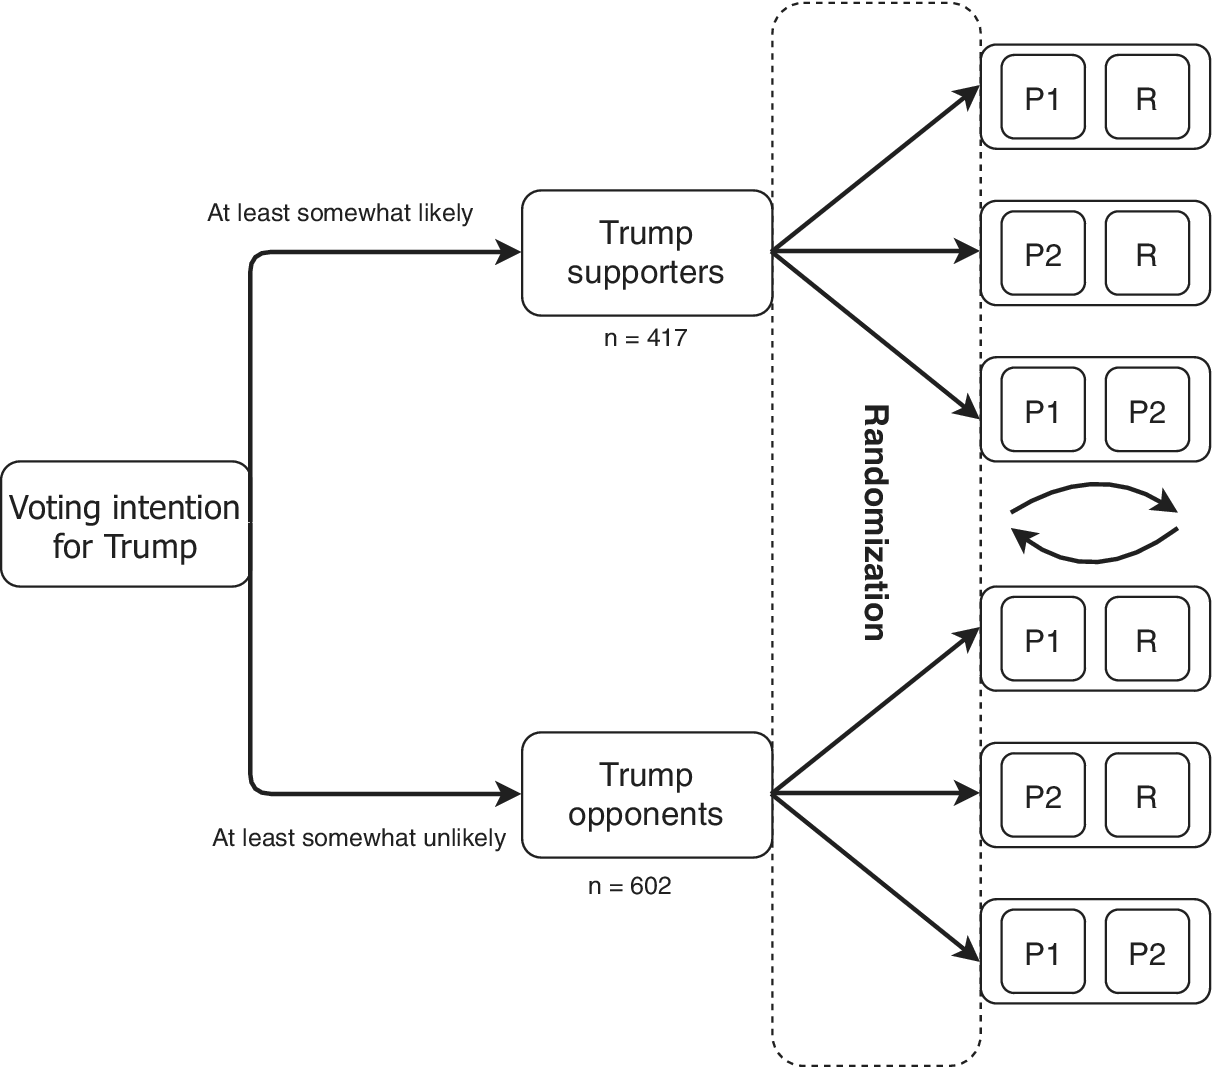
Figure 2 illustrates the strategy for our randomized image pair assignment. Given that our main theoretical expectation is that the perception of hard propaganda varies along partisan lines, we first split our sample using a six-point Likert scale question on respondents’ voting intentions in the next presidential election to classify them into either Trump supporters or Trump opponents. The fraction of 41% self-identified Trump supporters in our sample closely aligns with the president’s approval ratings reported by major polls during the period of study (see online appendix B.3).Footnote 9 Note that the broad distinction between Trump supporters and opponents we use in this study does not imply that either of the groups are homogeneous but simply reflects the main theoretical distinction that our research question implies. We investigated heterogeneity in perceptions along other important dimensions, including news consumption, neighborhood, education, and race of our respondents (see the section, “Heterogeneous Perceptions,” and online appendix D.2). Moreover, in the section on “Robustness and Sensitivity Checks,” we also present robustness tests using party affiliation instead of voting intention to split our sample.
Strategy for Randomized Image Pair Assignment

We randomly assigned respondents in each group to one of three image-pair combinations as depicted in figure 2: P1 represents bureaucrats propaganda, P2 police propaganda, and R is the reference image. To prevent profile-order effects, we further randomized the order within these image pairs. We specifically chose this design to ensure robust inferences both for the entire sample and separately for each of the two groups. Balance tests in online appendix B.4 indicate that our image groups are well balanced overall. Moreover, a power analysis provides strong evidence that our design is sufficiently powered to ensure robust inferences both for the full sample and separately for Trump opponents and supporters (see online appendix E.5).
In line with our theoretical expectations, we then estimated the relative differences in the perception of the propaganda images compared to our reference image. Deviating from our pre-analysis plan, we considered each type of hard propaganda—bureaucrats propaganda and police propaganda—separately because they differed significantly for some of the outcome dimensions.Footnote 10 In addition, as described earlier, the two images focus on different aspects of strength (political vs. coercive power) and were characterized as more (bureaucrats propaganda) or less (police propaganda) obvious forms of hard propaganda by media outlets. In a second deviation from our pre-analysis plan, we tested for the differences in perception between the Trump opponent and supporter group for our main results. Finally, we specified in our pre-analysis plan that we would leave out respondents who answered the protest question with “I would never protest” because we expected that they would provide this answer for both images shown. Because this was regularly not the case, we included this answer option when rescaling the outcome to avoid biases.
Results
Perceptions of Hard Propaganda
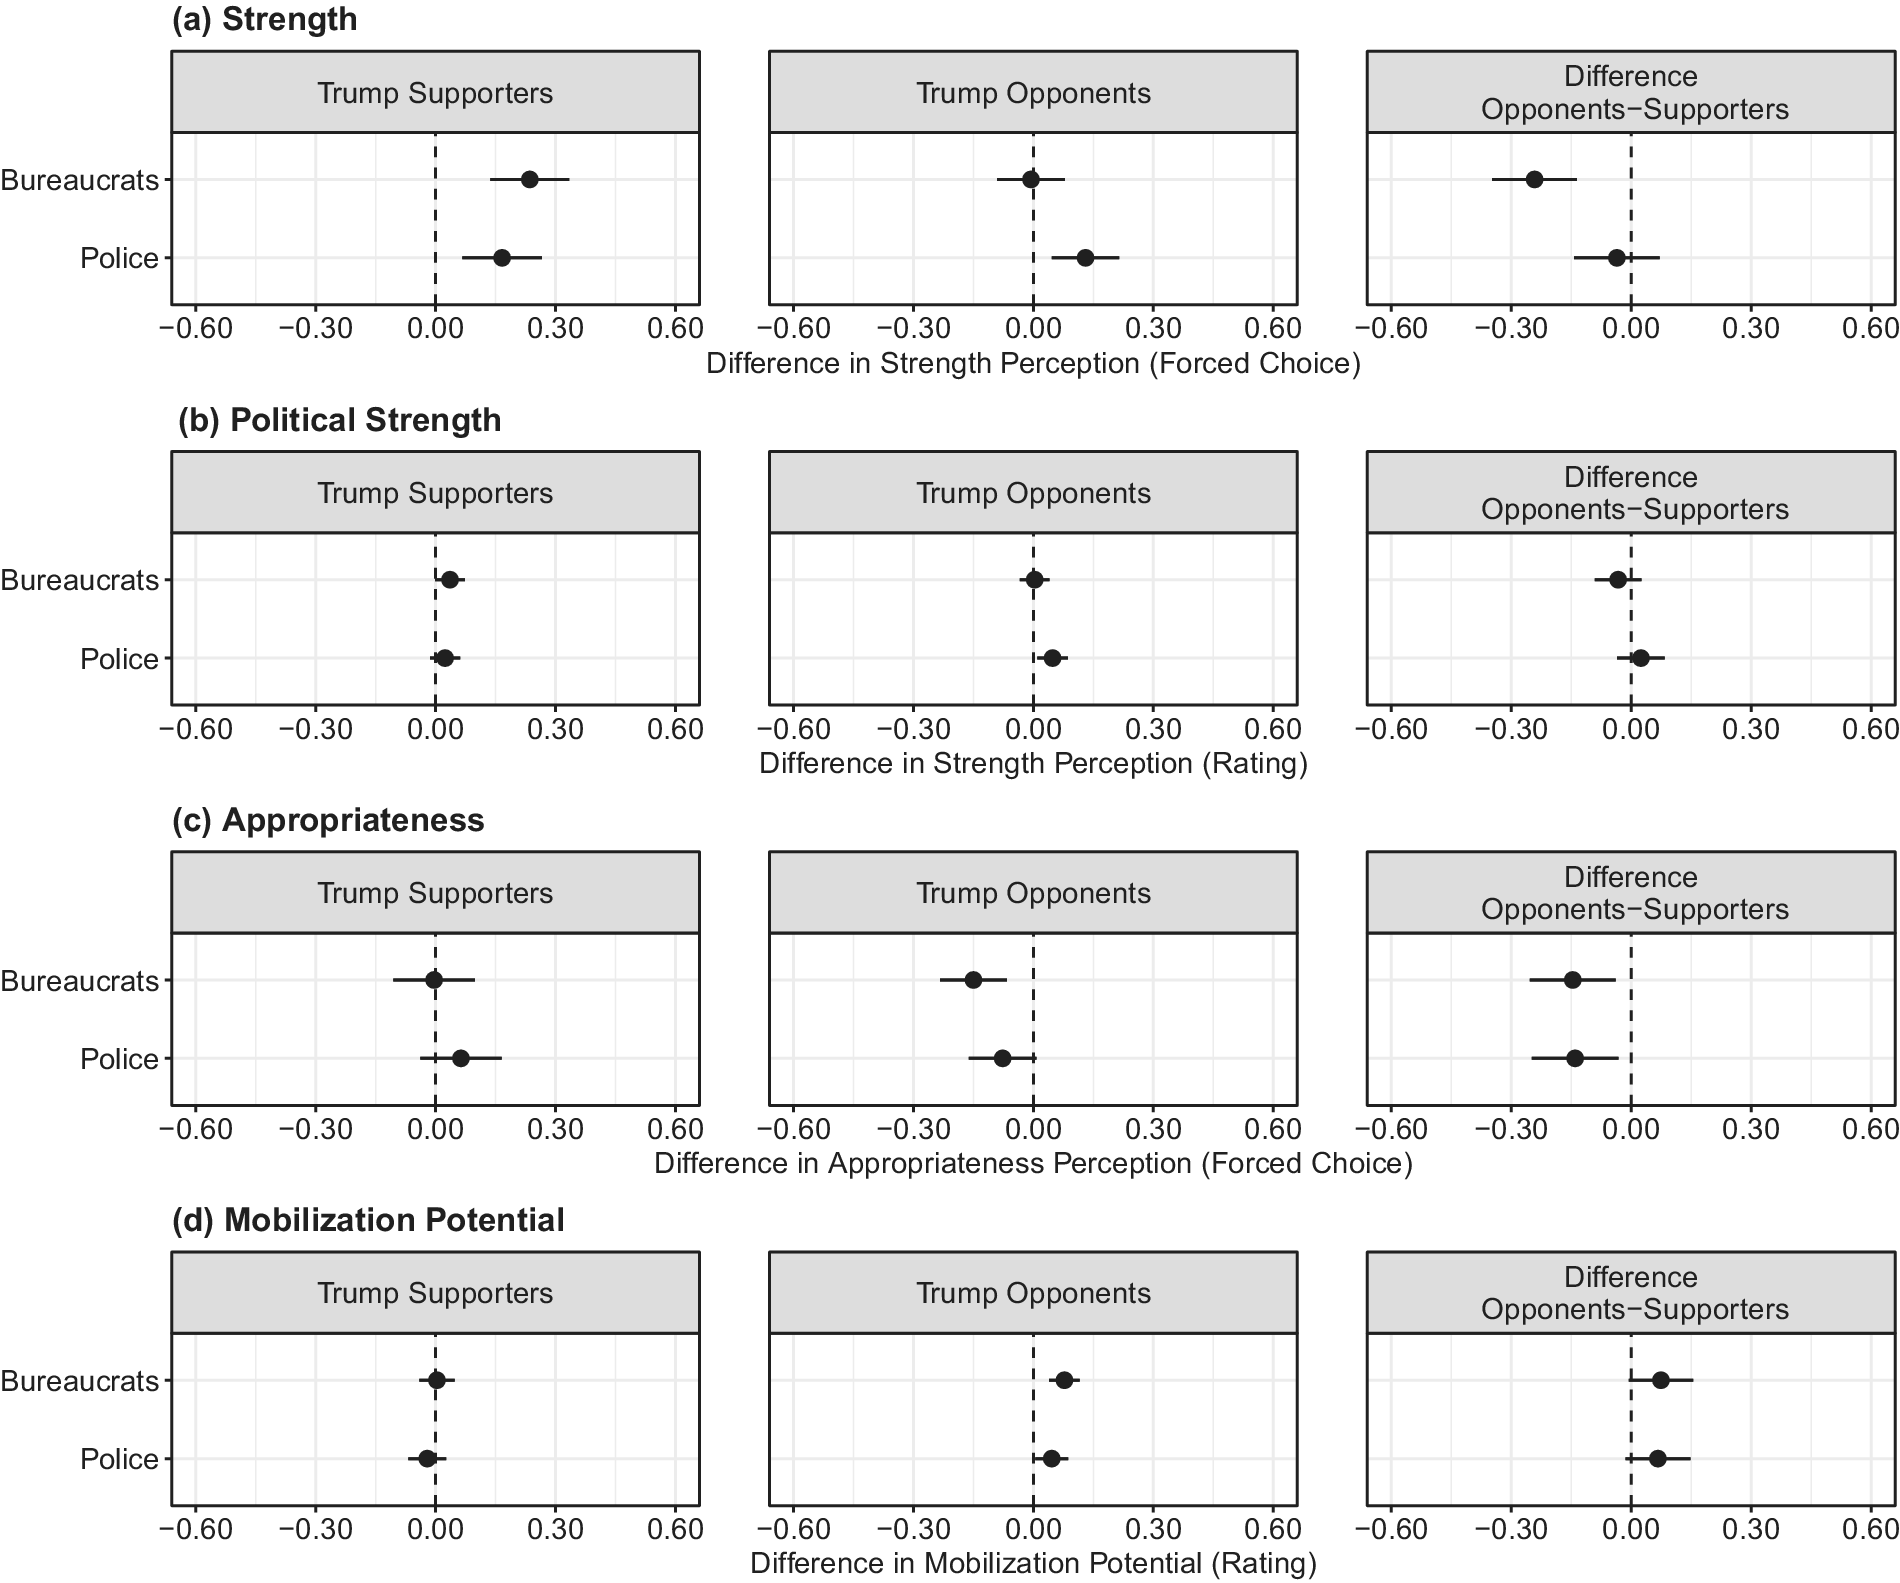
Figure 3 shows the differences in perception for the bureaucrats propaganda and police propaganda images relative to the reference “presidential” Oval Office image. It further distinguishes between Trump supporters (first column) and opponents (second column) and the differences between both groups (third column).
Results for Change in Perception of (a) Strength, (b) Political Strength, (c) Appropriateness, and (c) Mobilization Potential relative to the “Presidential” Reference Image for Trump Supporters and Opponents
Notes: 95% confidence intervals shown. Standard errors are clustered at respondent. Rating questions are normalized between 0 and 1. The dashed line represents 0.5 indicating indifference as compared to the reference images. The last column depicts the differences in coefficients between the Trump opponent and supporter groups. Tabular results are reported in appendix D.1.

Relative to our reference image, panel a illustrates that both types of propaganda are perceived as stronger for Trump supporters (bureaucrats propaganda: $ \beta $
=0.24,
$ \beta $
=0.24, $ p< $
0.01, and police propaganda:
$ p< $
0.01, and police propaganda: $ \beta $
=0.17,
$ \beta $
=0.17, $ p< $
0.01). In addition, panel c shows that their use is not perceived as more or less inappropriate by this group (bureaucrats propaganda:
$ p< $
0.01). In addition, panel c shows that their use is not perceived as more or less inappropriate by this group (bureaucrats propaganda: $ \beta $
=0,
$ \beta $
=0, $ p< $
0.94, and police propaganda:
$ p< $
0.94, and police propaganda: $ \beta $
=0.06,
$ \beta $
=0.06, $ p< $
0.22) nor, as illustrated in panel d, do supporters rate the hard propaganda’s mobilization potential any higher or lower than that of the reference image (bureaucrats propaganda:
$ p< $
0.22) nor, as illustrated in panel d, do supporters rate the hard propaganda’s mobilization potential any higher or lower than that of the reference image (bureaucrats propaganda: $ \beta $
=0,
$ \beta $
=0, $ p< $
0.88, and police propaganda:
$ p< $
0.88, and police propaganda: $ \beta $
=-0.02,
$ \beta $
=-0.02, $ p< $
0.39). The weaker patterns for the political strength outcome in panel b (bureaucrats propaganda:
$ p< $
0.39). The weaker patterns for the political strength outcome in panel b (bureaucrats propaganda: $ \beta $
=0.04,
$ \beta $
=0.04, $ p< $
0.06, and police propaganda:
$ p< $
0.06, and police propaganda: $ \beta $
=0.02,
$ \beta $
=0.02, $ p< $
0.22) can likely be explained by the different variable type used (rating vs. forced choice) and the fact that Trump supporters rated all three types of communication—including the reference image—as relatively high in their ability to convey political strength (see figure 4). This suggests that ceiling effects are a likely explanation for the smaller coefficient sizes we observe here.
$ p< $
0.22) can likely be explained by the different variable type used (rating vs. forced choice) and the fact that Trump supporters rated all three types of communication—including the reference image—as relatively high in their ability to convey political strength (see figure 4). This suggests that ceiling effects are a likely explanation for the smaller coefficient sizes we observe here.
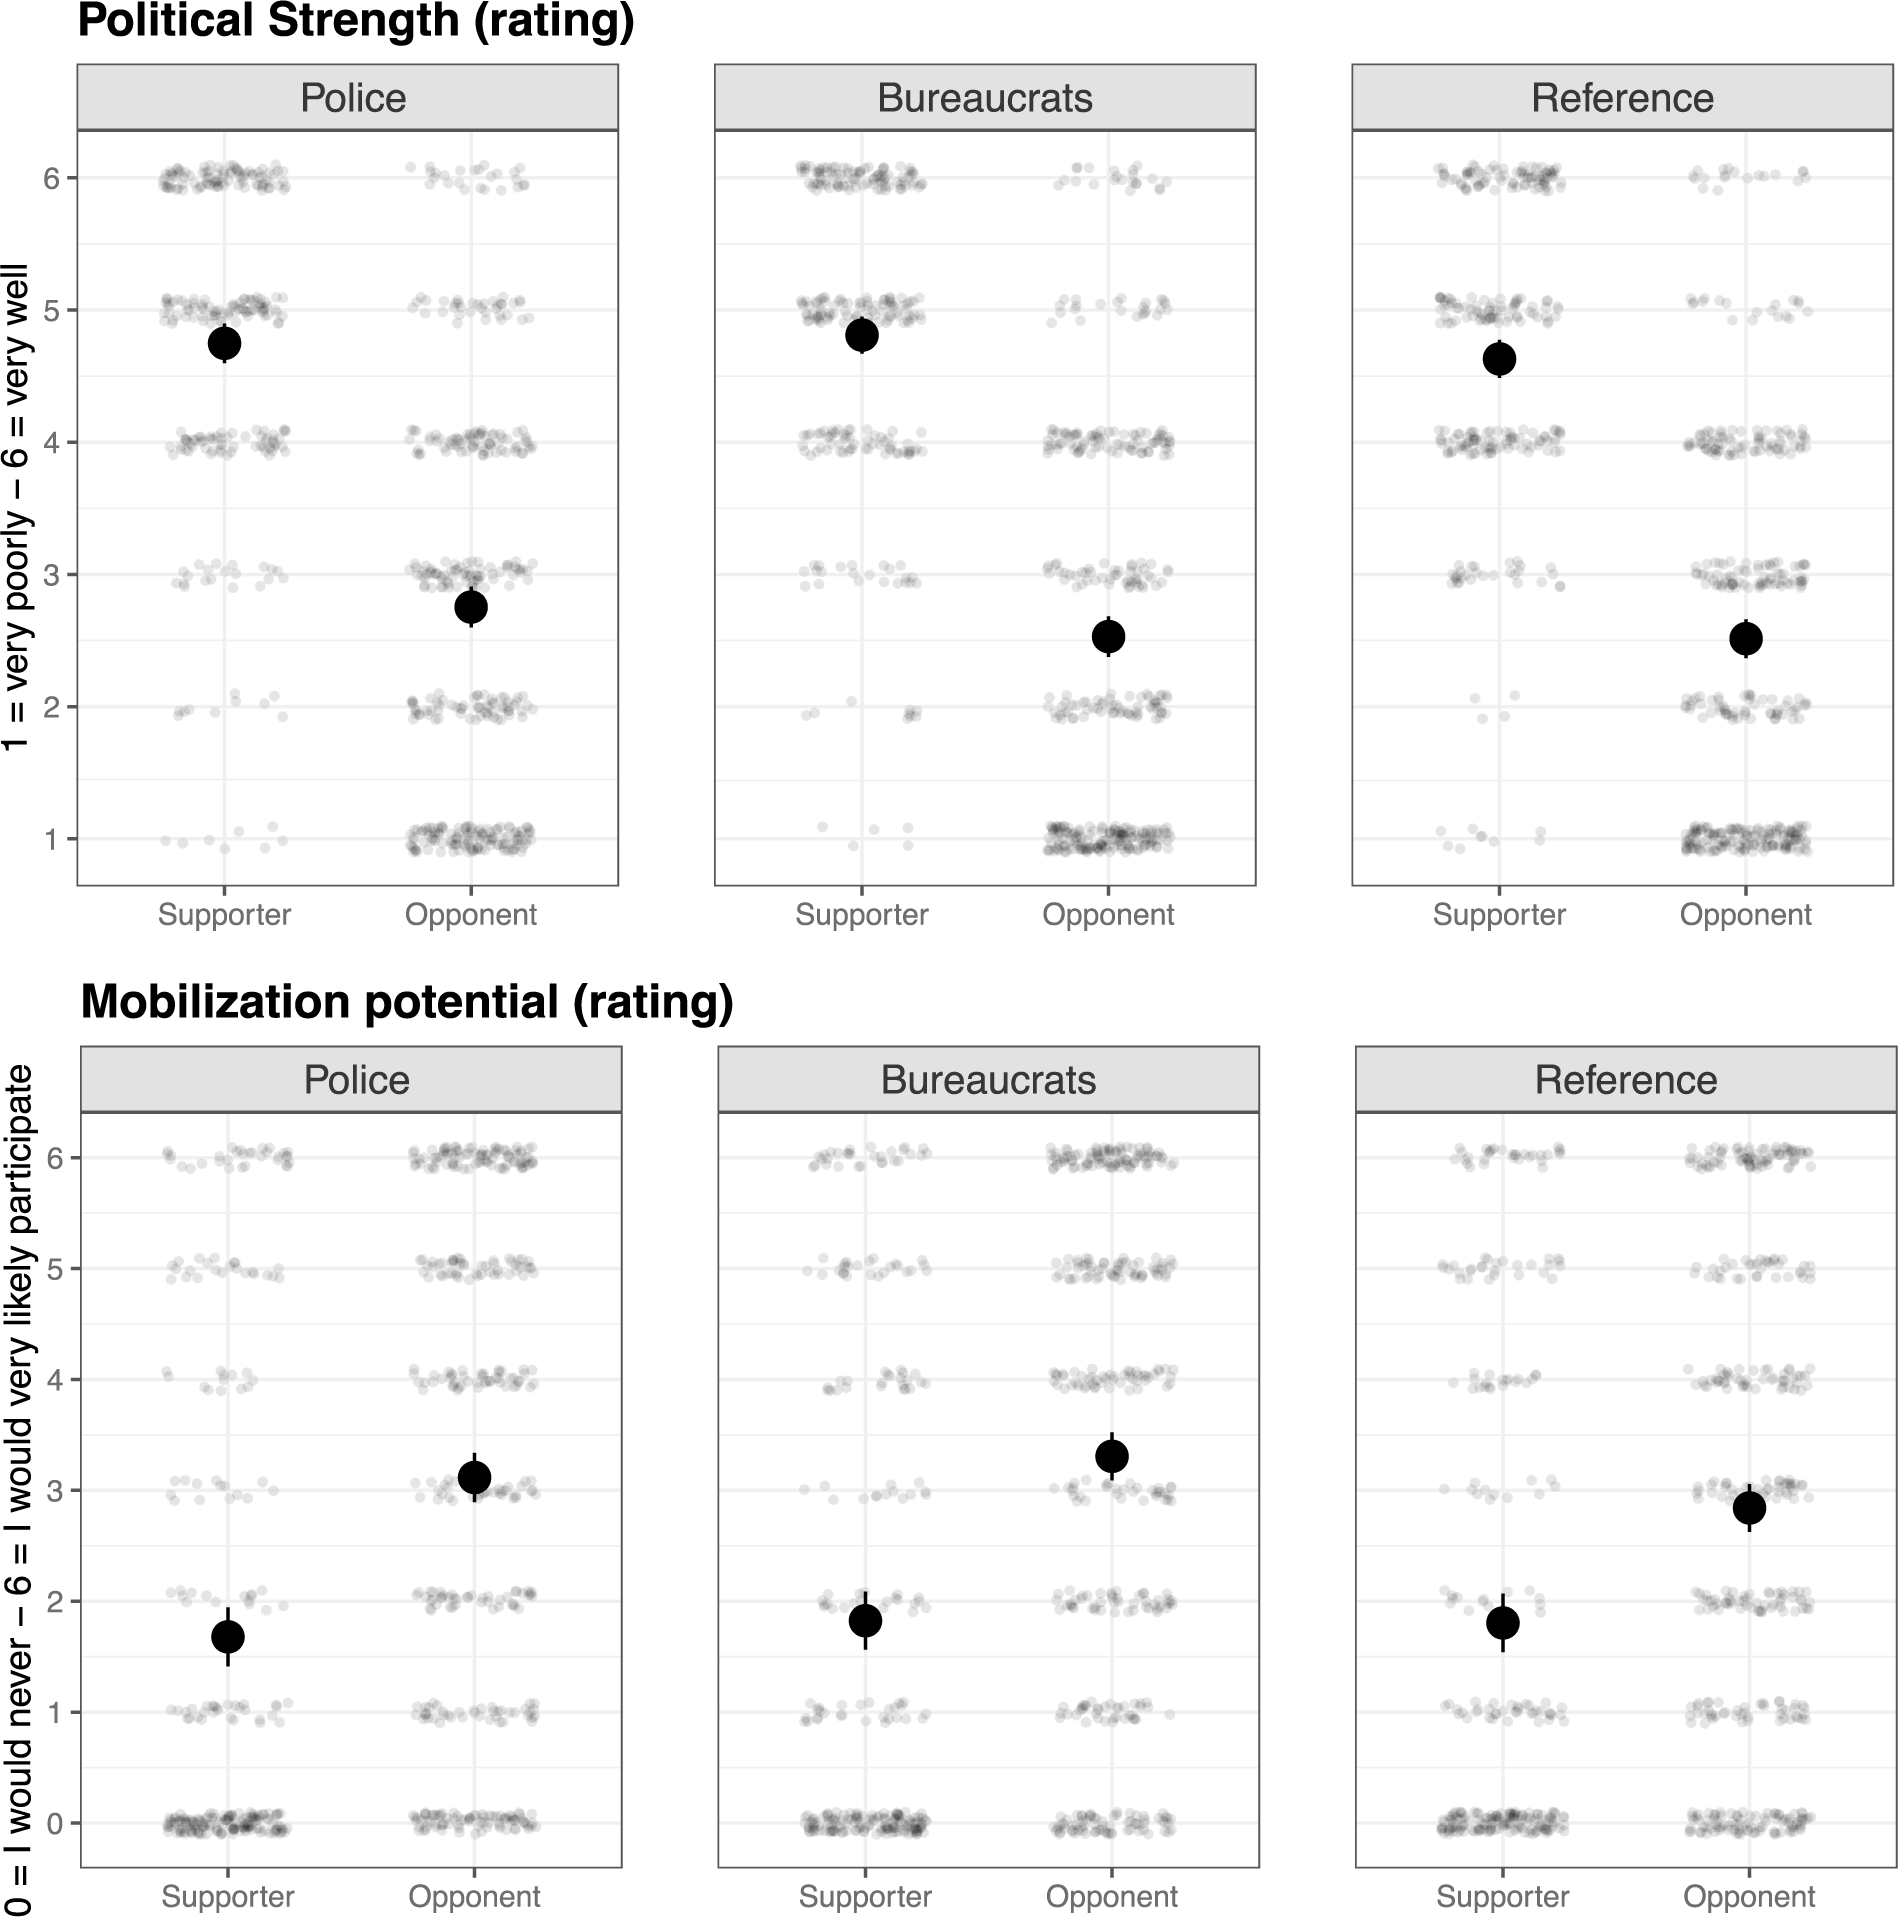
Absolute Ratings for Each Type of Hard Propaganda and Group
Notes: The visualization shows the distribution of the evaluation of bureaucrats and police propaganda for political strength (top panel) and mobilization potential (bottom panel) ratings. The point densities reflect the frequency of the chosen answers and the point estimate the average value; 95% confidence intervals shown.

In contrast, and as shown in panel c, Trump opponents find both types of propaganda more inappropriate in their use relative to our reference image (bureaucrats propaganda: $ \beta $
=-0.15,
$ \beta $
=-0.15, $ p< $
0.01, and police propaganda:
$ p< $
0.01, and police propaganda: $ \beta $
=-0.08,
$ \beta $
=-0.08, $ p< $
0.07). Furthermore, as shown in panel d, they rated their mobilization potential as higher (bureaucrats propaganda:
$ p< $
0.07). Furthermore, as shown in panel d, they rated their mobilization potential as higher (bureaucrats propaganda: $ \beta $
=0.08,
$ \beta $
=0.08, $ p< $
0.01, and police propaganda:
$ p< $
0.01, and police propaganda: $ \beta $
=0.05,
$ \beta $
=0.05, $ p< $
0.03). Surprisingly, the latter is true despite opponents perceiving the police propaganda image as stronger than the reference image (panel a,
$ p< $
0.03). Surprisingly, the latter is true despite opponents perceiving the police propaganda image as stronger than the reference image (panel a, $ \beta $
=0.13,
$ \beta $
=0.13, $ p< $
0.01, and panel b,
$ p< $
0.01, and panel b, $ \beta $
=0.05,
$ \beta $
=0.05, $ p< $
0.01).Footnote
11
$ p< $
0.01).Footnote
11
Taken together this suggests that even in a democratic setting coercive forms of hard propaganda can signal more strength (or at least less weakness) than standard political communication for both government supporters and opponents. But at the same time, we also see clear partisan differences in terms of appropriateness and mobilization potential.Footnote 12 Considering relative perceptions, however, only tells part of the story. In the context of the BLM protests and against the backdrop of high political polarization, we would expect that the absolute perception of different kinds of propaganda and general political communication would differ between supporters and opponents.
Figure 4 reports absolute values for the rating outcomes for how each image, those representing hard propaganda and our presidential reference image, were perceived. It highlights that the ratings for Trump opponents and supporters are overall very different. First, Trump supporters perceived the political strength of all three types of visual messaging as relatively high, whereas the opposite was the case for opponents. Second, and not very surprisingly, opponents reported a greater mobilization potential for all types of messages than did Trump supporters. More precisely, Trump supporters rated their own protest probability well below 2 (unlikely to participate) for all three images shown. Note that the mean value for the propaganda images in the opponent group was also only slightly above 3 (somewhat unlikely to participate). However, a large share of opponents chose the option “I would very likely participate,” and, on an aggregated level, 47% of opponents stated that they would be at least somewhat likely to participate in antigovernment protests.
How can we consolidate these findings on relative and absolute perceptions? The former are in line with the literature on propaganda in autocracies (Dukalskis Reference Dukalskis2017; Huang Reference Huang2018; Lutscher and Donnay Reference Lutscher and Donnay2024), suggesting that hard propaganda when pivoted against standard political communication shows the same patterns in autocratic and democratic settings. The findings on absolute perceptions at the same time clearly show that those respondents not supporting the government overall perceive its communication as weak. Yet, hard propaganda—in particular, more coercive types—can still communicate more strength (or less weakness) than standard political communication, even though it is also perceived as more inappropriate by this group.
The main difference we observe between democratic and autocratic settings is related to the contentious outcome. Whereas in autocratic settings the actual costs for protests and coordination are much higher and hard propaganda reduces the likelihood for citizens to protest, these costs are much lower in democracies. Citizens have the constitutional right to challenge the government’s encroachment on citizen rights (Weingast Reference Weingast1997), and government opponents have incentives to signal their disapproval of a government that uses overly authoritarian propaganda or other coercive means. In figure 4, the baseline protest probability of government opponents is, as should be expected, higher than that of supporters. The relative increase in mobilization potential among government opponents is not drastic but is visible, with a significant share of respondents indicating higher protest probability as compared to the reference image, especially for the bureaucrats propaganda image.
Taken together these findings illustrate that hard propaganda messaging has the potential to communicate strength even in democratic settings, albeit with the risk of a mobilization backlash among government opponents. The clear partisan differences in the relative perceptions of government strength we observe are in line with the stark partisan differences in baseline perceptions. Considering the literature on democratic backsliding (e.g., Arceneaux and Truex Reference Arceneaux and Truex2023; Graham and Svolik Reference Graham and Svolik2020; Svolik Reference Svolik2019), we only observe a potential backlash to the use of authoritarian-style messaging among those opposed to the government. This suggests that political polarization affects the efficiency and acceptance of hard propaganda and could be an indication that democratic leaders in highly polarized societies might have an easier time borrowing practices from the authoritarian playbook.
Heterogeneous Perceptions
Do perceptions of hard propaganda also differ along respondent characteristics other than being pro- or anti-Trump? There are a number of key dimensions such as news consumption, level of education attained, respondents’ neighborhoods, and racial identity that might give rise to heterogeneity in perceptions. As specified in our pre-analysis plan, we conducted additional subgroup analyses—separately for the Trump opponent and supporter groups—for those dimensions. Note that these analyses are more likely to suffer from power issues because we did not randomize on these dimensions, and group sizes are smaller and more imbalanced; details of the analyses are provided in online appendix D.
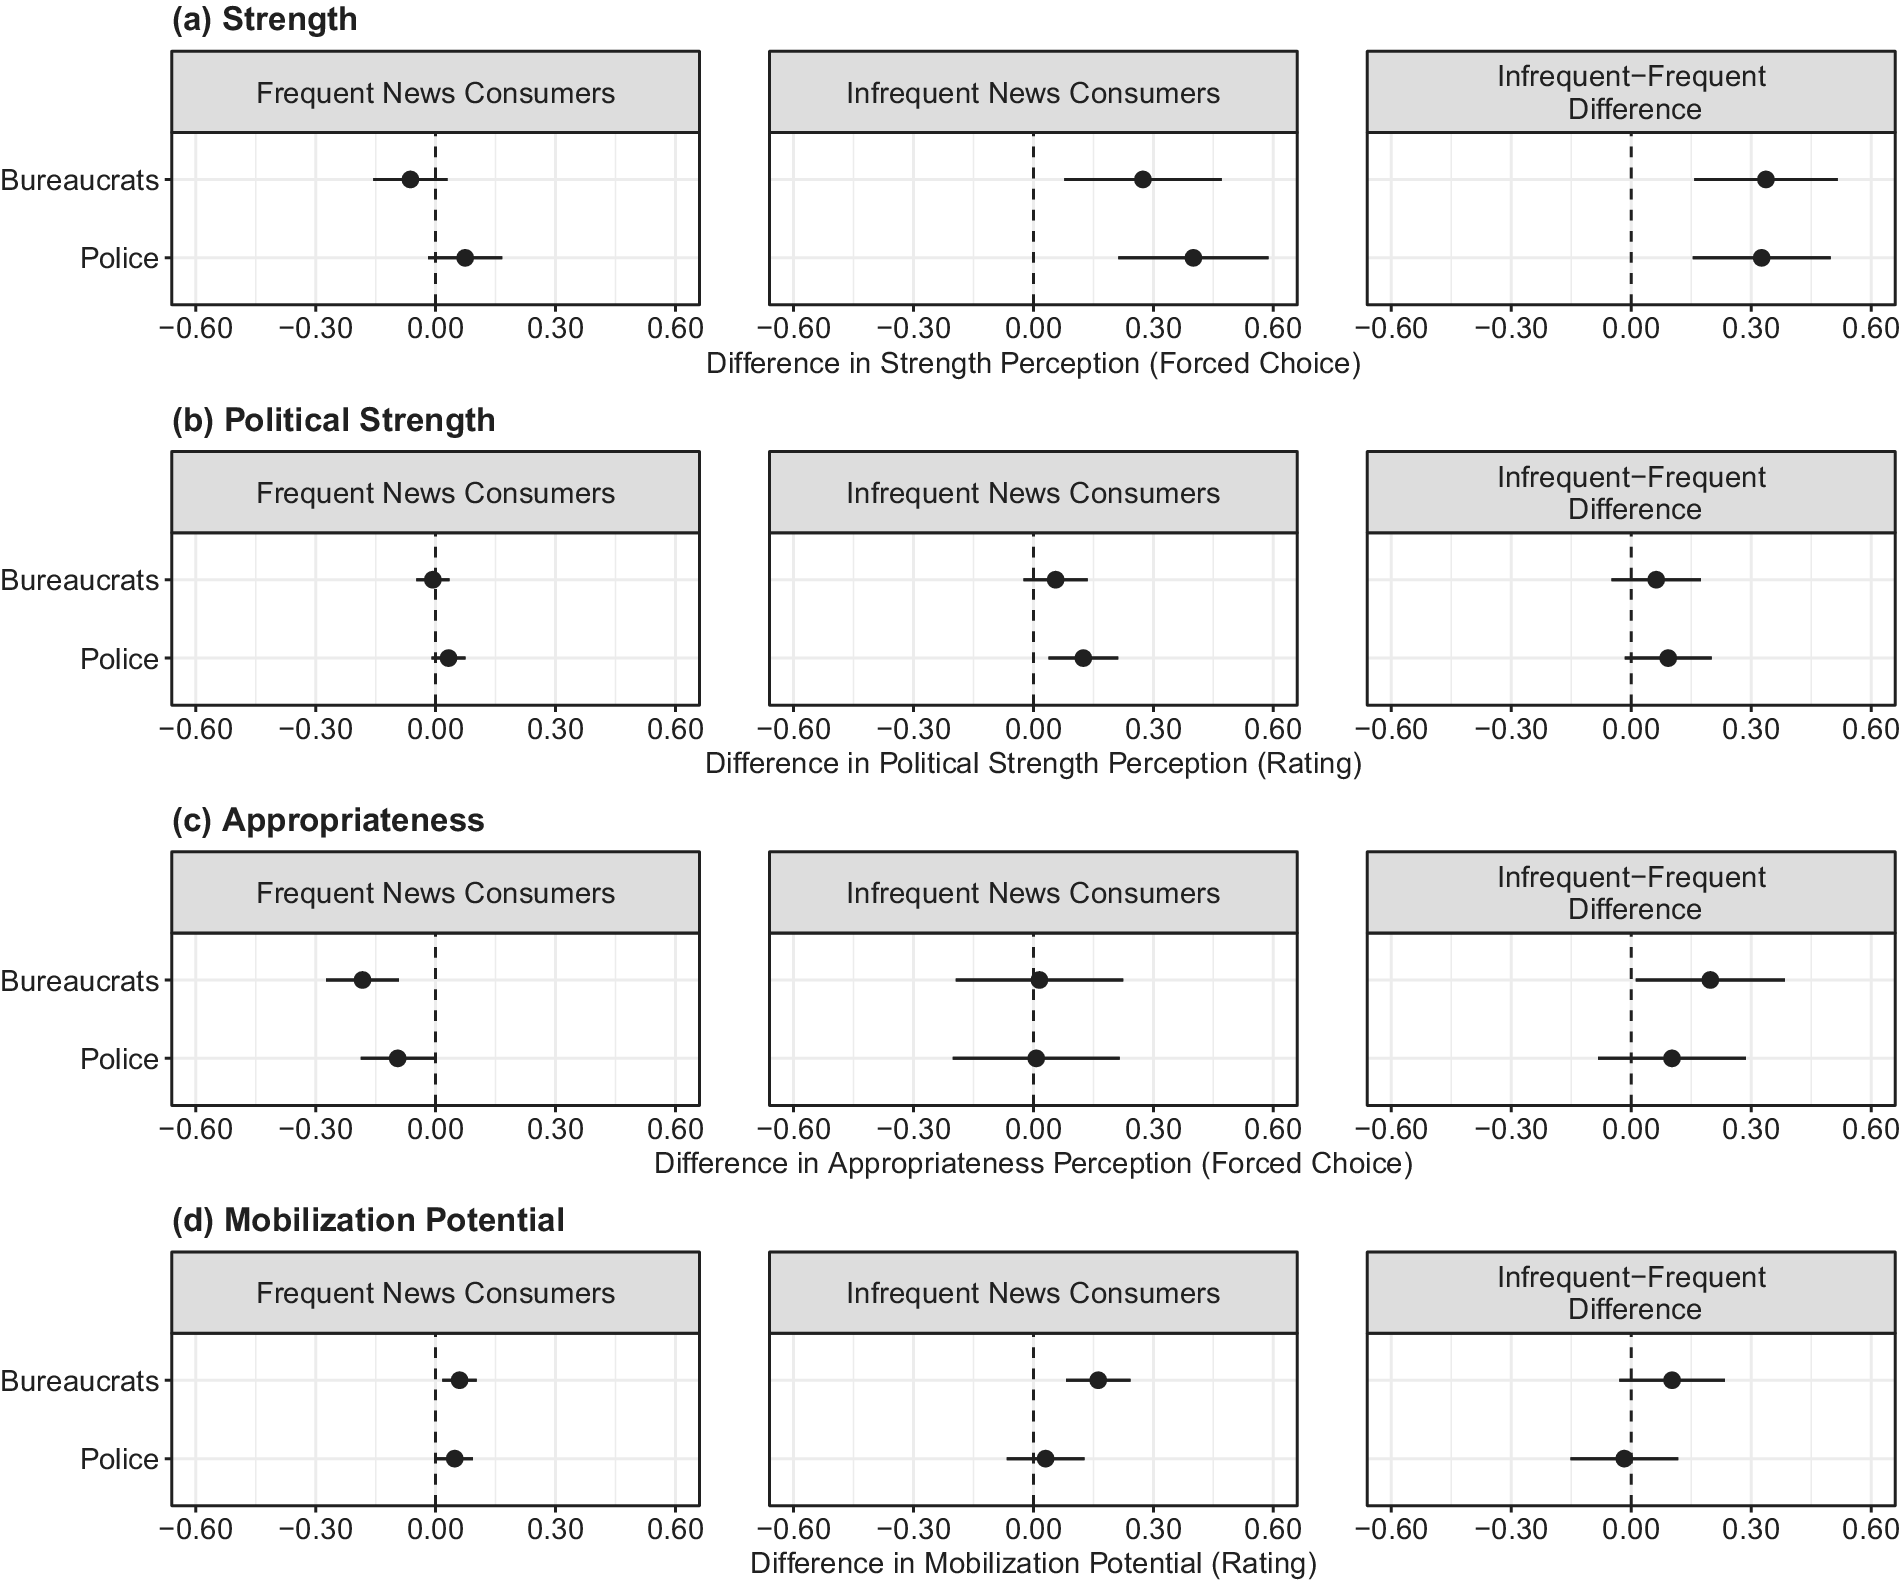
Overall, we found few differences in relative perceptions along the dimensions we tested, but some interesting patterns did emerge.Footnote 13 For Trump opponents, strength perception of hard propaganda as compared to standard political communication appears to significantly differ between those who frequently watch or read national news and those who do not. Whereas the latter group displays a strongly positive correlation for both types of propaganda, the estimates are indistinguishable from zero for frequent news consumers (see panels a and b in figure 5). It thus seems that those who paid attention to news likely had seen the images (particularly the bureaucrats image) before and therefore displayed less reactions. The negative reactions by partisan media on the use of this image and accompanying photo-op may further explain this finding. Interestingly, however, infrequent news consumers rated the relative mobilization potential of the bureaucrats propaganda image as much higher. Although we have no conclusive explanation for this result, it could suggest that the backlash potential of quite overt, even comical, strongman propaganda is present without the additional context provided by the media (see panel d in Figure 5).
Results Conditional on Media Consumption for Trump Opponents for Change in Perception of (a) Strength, (b) Political Strength, (c) Appropriateness, and (c) Mobilization Potential relative to the “Presidential” Reference Image
Notes: 95% confidence intervals shown. Standard errors are clustered at respondent. Rating question normalized between 0 and 1. The last column represents the differences between the infrequent and frequent group. The share of Trump opponents in the frequent media users is 83.4%.

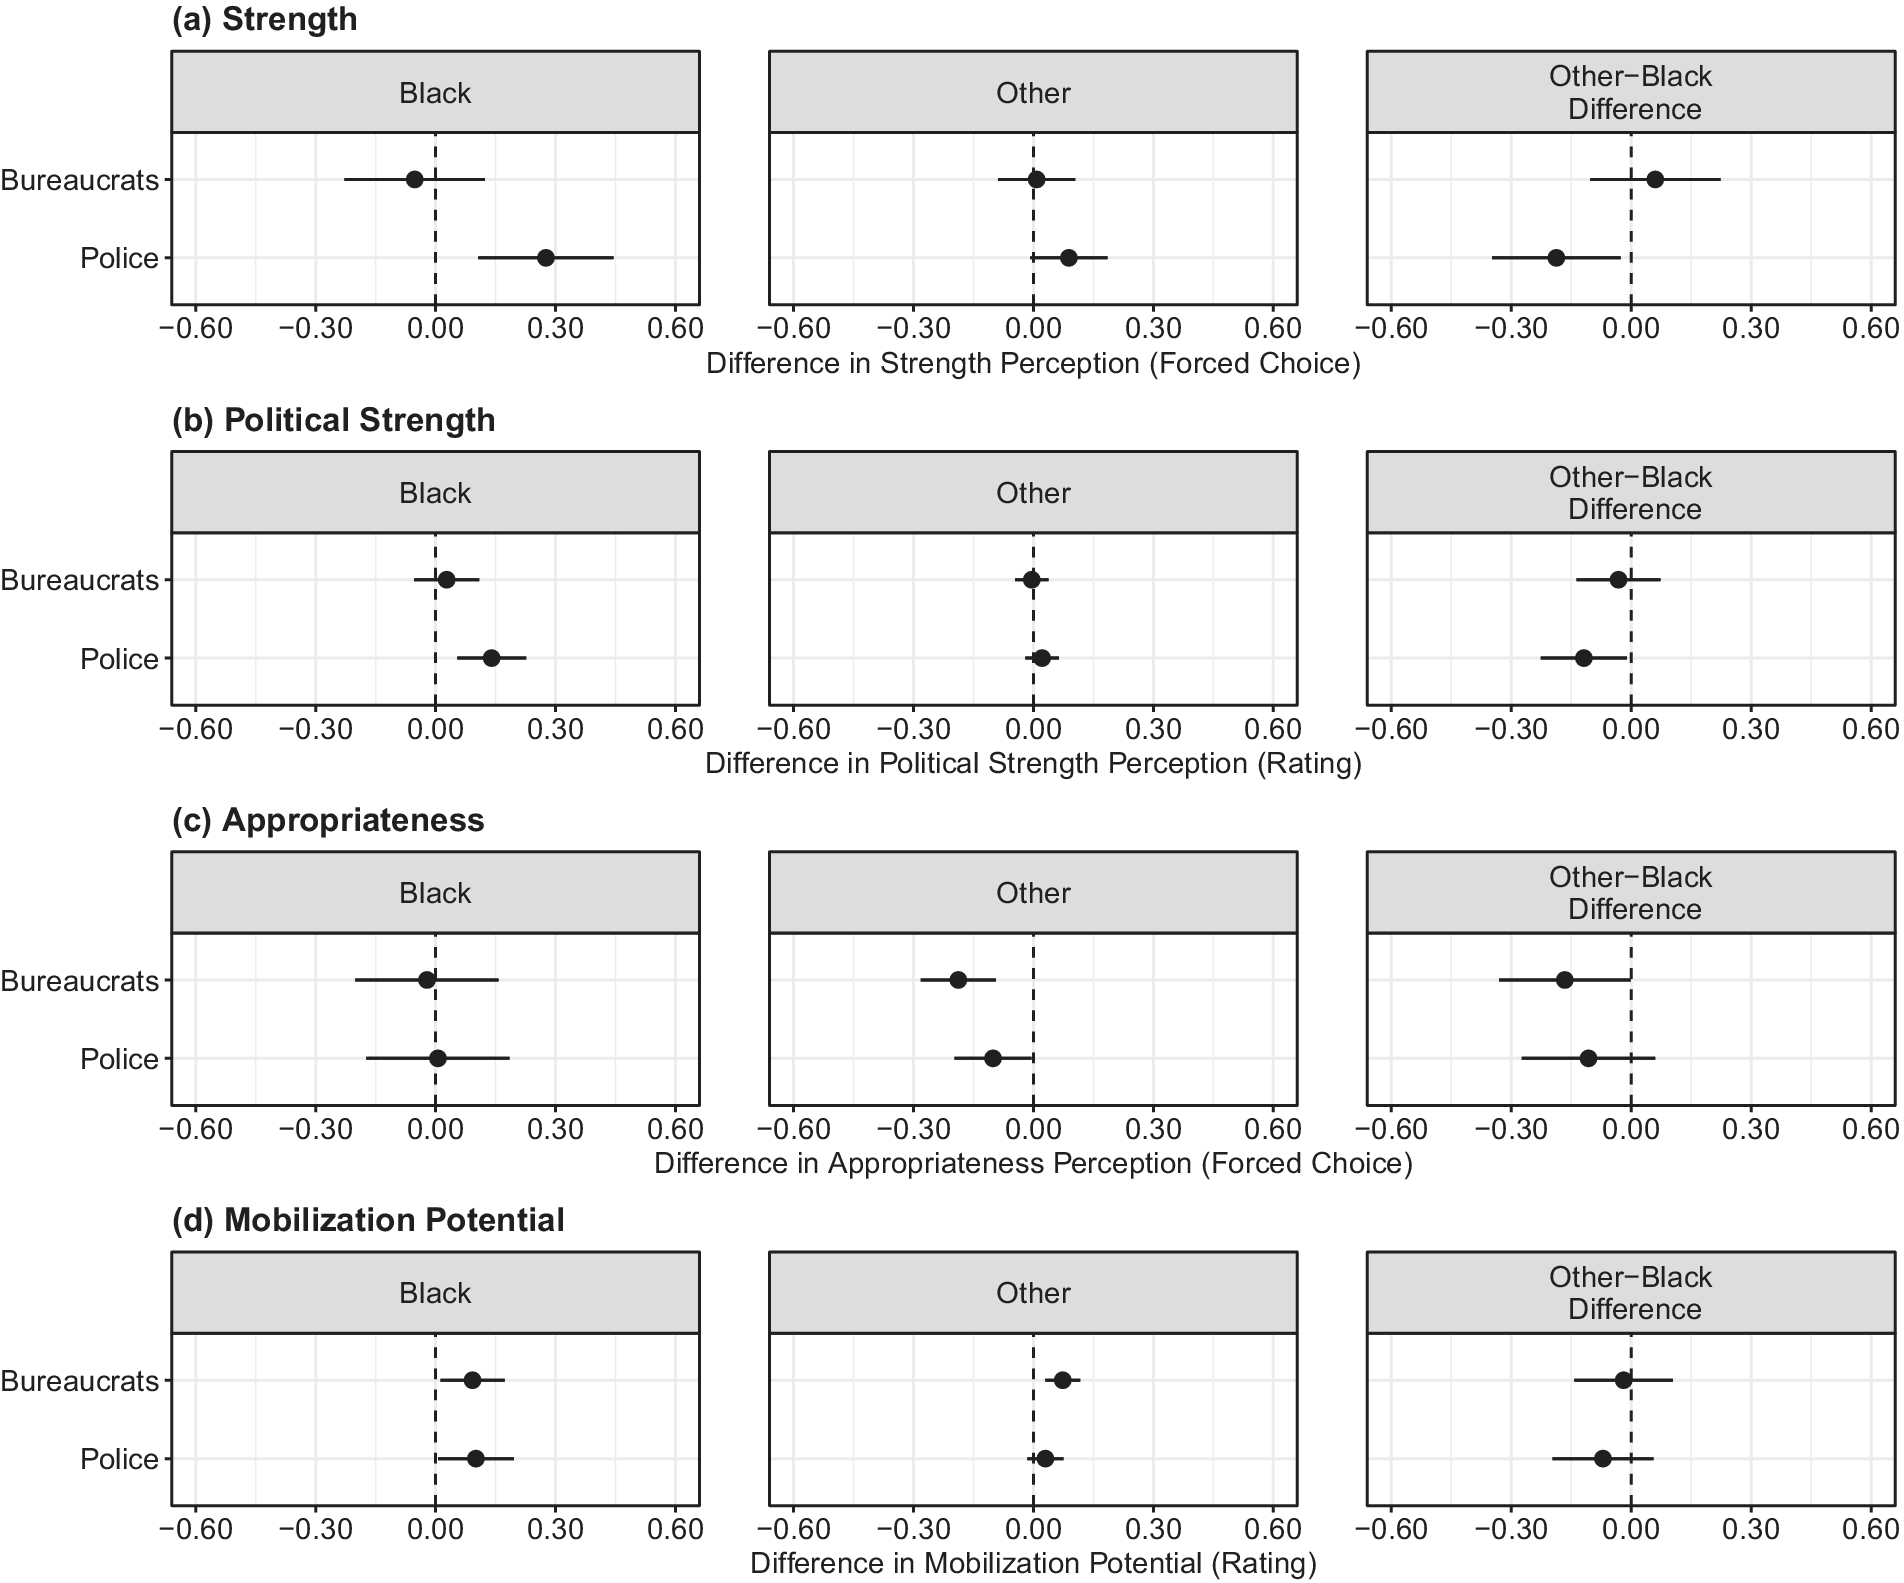
Finally, given the use of these images in the context of and as a direct response to the BLM protests, there is strong evidence to expect that Black Trump opponents should react more strongly to hard propaganda used by the administration (McGowen and Wylie Reference McGowen and Wylie2020).Footnote 14 Figure 6 indeed highlights some important differences. Black opponents, in particular, perceive police propaganda as signaling more coercive strength (or less weakness) than standard political communication. Interestingly, however, Black opponents rated the relative mobilization potential as similarly high for both types of propaganda, suggesting that anger likely outweighs threat perceptions in this context (cf. LeBas and Young Reference LeBas and Young2024). Adding to this, the perceived mobilization potential for police propaganda is twice as large compared to other Trump opponents—suggesting a stronger emotional response toward this type of visual communication strategy. Supporting this interpretation, Bakker, Schumacher, and Rooduijn (Reference Bakker, Schumacher and Rooduijn2021) provide experimental evidence that political rhetoric that conflicts with prior political attitudes fosters negative emotions. We note, however, that this difference is not statistically different at conventional levels (see the last column of figure 6).Footnote 15
Results Conditional on Ethnic Identity for Trump Opponents for Change in Perception of (a) Strength, (b) Political Strength, (c) Appropriateness, and (d) Mobilization Potential relative to the “Presidential” Reference Image
Notes: 95% confidence intervals shown. Standard errors are clustered at respondent. Rating question normalized between 0 and 1. The last column represents the differences between the other and Black group.

Robustness and Sensitivity Checks
How robust are our results to specific design choices? As specified in our pre-analysis plan, we performed several robustness and sensitivity checks. In particular, our findings remain consistent when considering the two hard propaganda strategies together, and our outcomes are robust to profile-ordering effects.Footnote 16 Furthermore, we find that leaving out both undecided voters and the fastest-responding respondents does not alter our results. All robustness checks are discussed in detail in online appendix E.
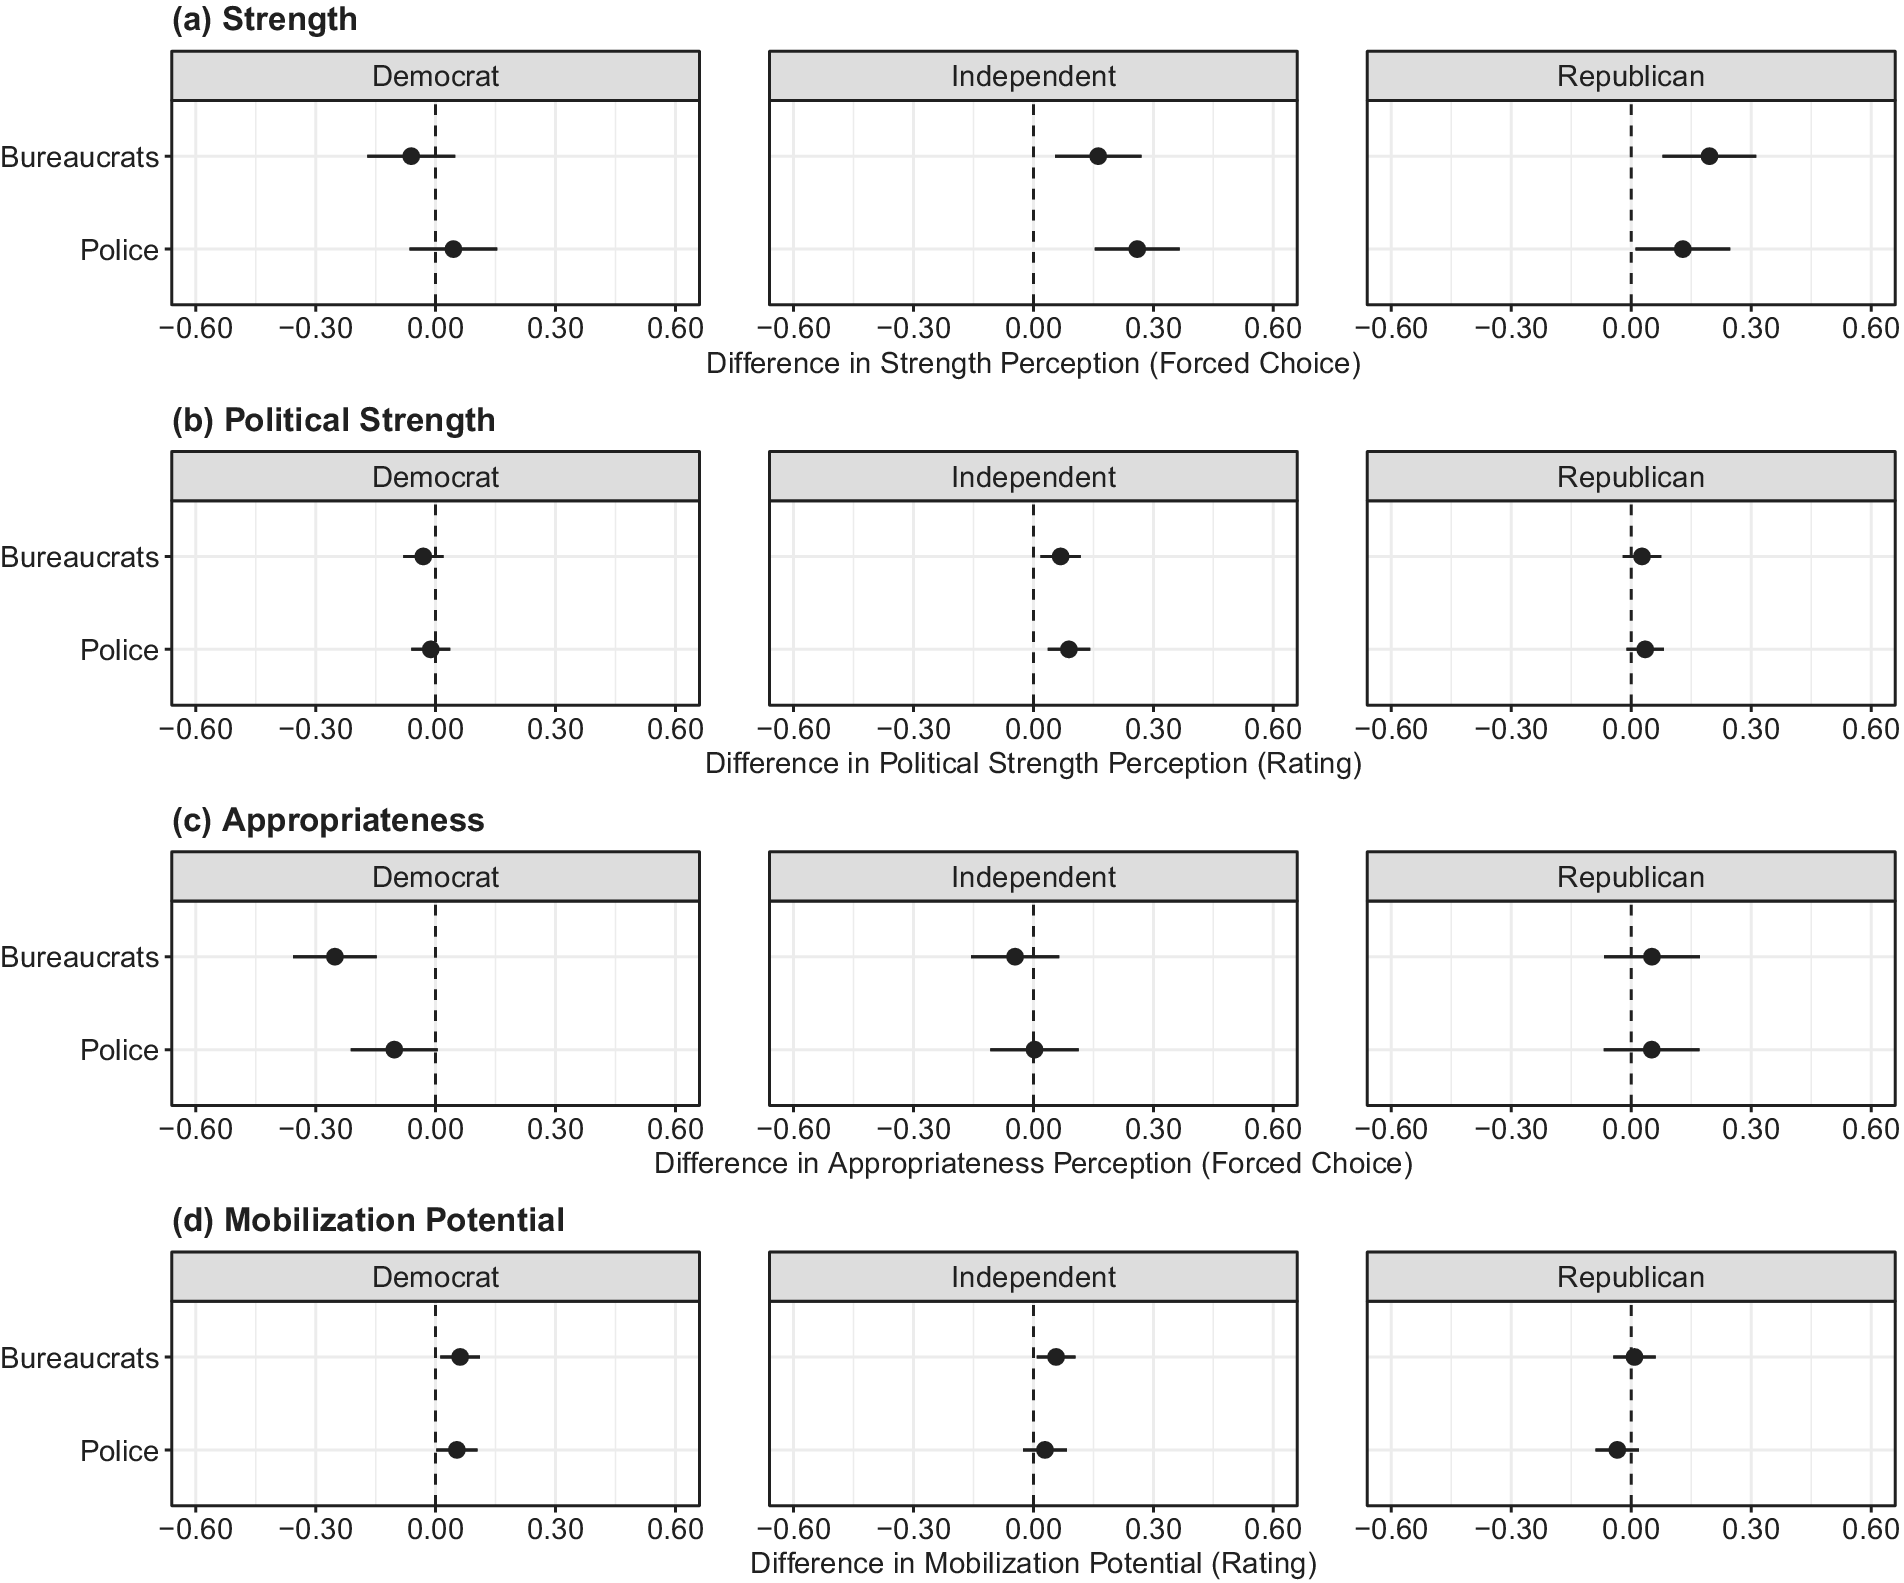
As an additional check, we reran our main analysis and used self-reported party affiliation instead of voting intention for Trump as a moderating variable to capture partisan polarization.Footnote 17 Figure 7 illustrates that the results strongly align with our main findings but show that for Democrats the estimate for the relative strength perception outcome becomes indistinguishable from zero for both types of hard propaganda. Corroborating the interpretation of our main results, these findings suggest that strong opposition partisanship identification greatly reduces the efficacy of political communication by the political opponent (Cobb and Kuklinski Reference Cobb and Kuklinski1997) and that citizens strongly opposed to the government are more likely to push back against antidemocratic messaging more generally.
Results for Change in Perception of (a) Strength, (b) Political Strength, (c) Appropriateness, and (c) Mobilization Potential relative to the “Presidential” Reference Image for Democrats, Independents, and Republicans
Notes: 95% confidence intervals shown. Standard errors are clustered at respondent. Rating question normalized between 0 and 1.

There are a number of ways in which future research could improve on our work. Studies could, for example, include additional images or distinct features to test more broadly the perception of different types of visual propaganda messaging (see, e.g., Flores-Macías and Zarkin Reference Flores-Macías and Zarkin2022), although we note that the two selected images are quite prototypical examples of hard propaganda (Huang Reference Huang2015; Lutscher and Donnay Reference Lutscher and Donnay2024). In addition, future work could test the impact of a different reference image showing Trump in a neutral presidential setting, surrounded by people, to rule out that our findings are influenced by differences in perceptions of images showing a single person versus a group of people. Our results further suggest that emotions appear to play a very relevant role in the perception of propaganda messages—a line of inquiry that recent studies on propaganda and political communication in autocracies are already pursuing (Lutscher, Draege, and Knutsen Reference Lutscher, Draege and Knutsen2024; Mattingly and Yao Reference Mattingly and Yao2022; Young Reference Young2019; Reference Young2023). Moreover, because our paired-image task, by design, does not expose respondents to images individually, one possible concern is that this could have encouraged respondents to evaluate the propaganda messages differently than had they seen them alone. We systematically explore this possibility in online appendix E.6 and find no evidence that such effects could have altered our results.
Finally, as highlighted throughout the article, we asked about how respondents perceived the real-world hard propaganda images relative to a standard political communication along their potential to signal strength and mobilize, as well as what kind of visual communication they find more or less inappropriate to use. Future research may want to use different designs that test how short- and long-term exposure to hard propaganda can influence (actual) behavior in democracies, test potential mechanisms to explore how perceptions of strength and appropriateness mediate protest willingness, and include questions to measure the appropriateness of hard propaganda in absolute terms.
Conclusion
The threat of an authoritarian turn in US politics is closely linked to the rise of Donald Trump (MacWilliams Reference MacWilliams2016). Although coercive messaging has a long tradition in the United States of predominantly targeting and criminalizing Blacks (Stanley Reference Stanley2018), the overt and deliberate use of hard propaganda by the Trump administration in response to the BLM protests signaled a significant shift in political communication strategies. In this study, we tested the perception of real-world hard propaganda images during the escalation of protests in early June 2020 following the death of George Floyd on May 25, 2020. We showed that respondents—even government opponents—perceived overt and crude propaganda messages in this setting as stronger (or at least not weaker) than standard political messaging. However, when such propaganda is used during contentious periods, government opponents not only find this kind of messaging less appropriate but it may also increase their motivation for antiregime mobilization. Government supporters, in contrast, do not perceive the use of such propaganda as necessarily more or less appropriate than standard political communication.
Our results highlight that the perception of threatening hard propaganda messaging in a democratic as compared to an autocratic setting does not appear to be fundamentally different. In both cases, coercive hard propaganda is perceived as signaling more strength than standard political messaging. This supports the notion that the signaling theory of propaganda is universal and that governments can demonstrate resolve through the use of hard propaganda (Huang Reference Huang2015). However, in contrast to the democratic setting in the United States, similar messaging in autocracies has been found to effectively deter protests because of the high costs associated with participating in antigovernment activities (Carter and Carter Reference Carter and Carter2021; Reference Carter and Carter2023; Huang Reference Huang2018; Huang and Cruz Reference Huang and Cruz2022; Lutscher and Donnay Reference Lutscher and Donnay2024). Our results also suggest that government opponents in a democratic setting perceive hard propaganda as signaling rather low levels of political strength. However, were US citizens subject to more repressive government responses and restrictions, the absolute perception of government strength and the (de-)mobilization potential of hard propaganda for government opponents might be significantly higher and more similar to those observed in autocracies.
In relation to the literature on democratic backsliding, our study demonstrates the important role of partisanship in shaping how citizens perceive and respond to hard propaganda in polarized democracies like the United States (e.g., Arceneaux and Truex Reference Arceneaux and Truex2023; Graham and Svolik Reference Graham and Svolik2020; Svolik Reference Svolik2019). Although we observe an increasing level of resistance among government opponents to hard propaganda, indicating that the constitutional right to challenge the government’s encroachment on citizen rights is still being upheld, government supporters do not view the use of hard propaganda as inherently more or less appropriate than standard presidential messaging. This stands in contrast to historical instances in the United States during which citizens, both government opponents and supporters, responded to undemocratic practices. For example, Franklin D. Roosevelt abandoned his proposal to “pack the Court” in 1937 because of public pressure from both sides (Weingast Reference Weingast1997). In other words, democratic stability is likely to deteriorate in polarized democracies where there is no consensus among citizens regarding the limits of authoritarian practices by the government and where democratic rules are gradually undermined. In the end, this could make the earlier mentioned scenario of even more repressive actions and restrictions in the United States a potential reality.
The unique setting of the BLM protests and the accompanying threat of an authoritarian turn in US politics make this an extremely relevant case in and of itself. The timing of the study during the critical phase of the protests in June 2020 and the use of actual hard propaganda images posted by the Trump administration are deliberate choices to increase both its realism and empirical validity. There certainly is a trade-off between the focus on this specific case, however relevant, and the generalizability of our findings—although we would argue that the United States in the summer of 2020 was not fundamentally different from other democratic but heavily polarized contexts (see, for example, Arbatli and Rosenberg Reference Arbatli and Rosenberg2021; Mietzner Reference Mietzner2021). Finally, as mentioned earlier, these findings do not stand alone but instead complement closely related work on hard propaganda in autocracies (cf. Huang Reference Huang2015, Reference Huang2018; Lutscher and Donnay Reference Lutscher and Donnay2024) with a new perspective on a democratic setting.
Supplementary material
To view supplementary material for this article, please visit https://doi.org/10.1017/S153759272400272X.
Conflict of Interest
The authors report there are no competing interests to declare.
Data Availability
There are no restrictions on sharing our (fully anonymized) survey data. Full replication data and code are available via the Perspectives Dataverse at https://doi.org/10.7910/DVN/1H9BNR.
Acknowledgments
We would like to thank Felix Gaisbauer, Max Heerrmann and Theresa Küntzler who provided extremely helpful comments on our research design. And we are indebted to Lucas Leemann and Anselm Hager for their feedback on earlier versions of this paper. We would also like to thank the editors and our three anonymous reviewers for their critical but constructive engagement with our work. The feedback we received during peer review was invaluable in clarifying and strengthening our contribution and has made this a stronger paper. We gratefully acknowledge financial support from the University of Zurich and the University Oslo; Philipp Lutscher acknowledges funding from the European Research Council (ERC) under the European Union’s Horizon 2020 research and innovation programme (grant agreement No.863486).


 Open access