


INTRODUCTION
Human activities resulting in the emission of different pollutants to the atmosphere affect the physiological processes that control tree growth. The determination of tree-ring and foliage properties is crucial in the investigation of local and global environmental changes. Tree-ring analysis and the determination of the chemical composition of wood and foliage are useful in ecosystem biomonitoring, in particular when assessing the impacts of soil, air, and water pollution (e.g., Kabata-Pendias and Pendias Reference Kabata-Pendias and Pendias1992; Rovinsky et al. Reference Rovinsky, Burtseva and Chicheva1993; Dmuchowski and Bytneroicz Reference Dmuchowski and Bytnerowicz1995; Adriano Reference Adriano2001; Pomierny and Ciepał Reference Pomierny and Ciepał2004; Prasad et al. Reference Prasad, Sajwan and Naidu2006; Jelaska Reference Jelaska, Blanusa, Durbesic and Jelaska2007; Savard Reference Savard2010; Malik et al. Reference Malik, Danek, Marchwińska-Wyrwał, Danek, Wistuba and Krąpiec2012; Przybysz et al. Reference Przybysz, Sæbø, Hanslin and Gawroński2014; Sensuła et al. Reference Sensuła, Wilczyński, Monin, Allan, Pazdur and Fagel2017). In this context, the monitoring of trace heavy metals is important, and based on the elemental and isotopic composition of pine needles as well as tree-ring analysis, we can identify the sources of air contamination (Łukaszewski et al. Reference Łukaszewski, Siwecki, Opydo and Zembrzuski1988; Kabata-Pendias and Pendias Reference Kabata-Pendias and Pendias1992; Rovinsky et al. Reference Rovinsky, Burtseva and Chicheva1993; Alfanie et al. Reference Alfani, Maisto, Iovieno, Rutigliano and Bartoli1996; Adriano Reference Adriano2001; Prasad et al. Reference Prasad, Sajwan and Naidu2006; Jelaska Reference Jelaska, Blanusa, Durbesic and Jelaska2007; Savard Reference Savard2010; Pazdur et al. Reference Pazdur, Fogtman, Michczyński and Pawlyta2013; Przybysz et al. Reference Przybysz, Sæbø, Hanslin and Gawroński2014; Sensuła Reference Sensuła2015, Reference Sensuła2016). Environmental biomonitoring can be used to measure the cumulative impact of different types of environmental pressures, including air contaminants emitted from different sources as well as soil and water contamination.
Scots pine (Pinus sylvestris) needles have widely been used as bioindicators for reforestation success in post-mining areas in central Europe, mainly because this species can survive on acidic and dry soils (Białobok Reference Białobok1976; Dmuchowski and Bytnerowicz Reference Dmuchowski and Bytnerowicz1995; Baumann et al. Reference Baumann, Rumpelt, Schneider, Marschner and Hüttl2006; Kuznetsova et al. Reference Kuznetsova, Mandre, Klõseiko and Pärn2010). Most heavy metals are derived from anthropogenic sources, such as different industrial activities (e.g., metal refining, waste incineration, burning of coal and wood, coal and petroleum combustion, mining, metallurgy and metal smelting, barning of waste, and cement production), private householders, and motor vehicles. The contamination of air, rain, and soil can be a source of foliar injury. Geochemical analyses of Scots pine (Pinus sylvestris L.) needles have been performed previously (Dmuchowski and Bytnerowicz Reference Dmuchowski and Bytnerowicz1995), because this species is able to survive and grow on reclaimed mine soil (Białobok Reference Białobok1976; Pietrzykowski et al. Reference Pietrzykowski, Socha and van Doornd2014).
Plants can take up nutrients via the roots or the stomata. The stomata facilitate active exchange between leaf and atmosphere, representing the active interface between plants and their atmospheric environment. The local carbon cycle is very important to understand biological and chemical process and different interaction in the environment. Human activities over the past two hundred years have significantly increased the amount of carbon in the atmosphere, by emitting it directly (e.g., by fossil fuel combustion) or by changing ecosystems’ ability to extract CO2 from the atmosphere (e.g., by deforestation). Not only carbon concentration, but also the carbon isotopic composition of the Earth’s atmosphere has been modified by human activities. Fossil fuels combustion have also diluted the 14CO2 in the air (Suess effect, Keeling Reference Keeling1979). Human nuclear activities (connected with nuclear tests, nuclear power plant) increase anthropogenic 14CO2 in the air. The analysis of contemporary samples of pine needles and tree rings growing in different sampling sites around three industrial factories in Silesia (Sensuła et al. Reference Sensuła, Michczyński, Piotrowska and Wilczyński2018), shown high concentration of radiocarbon (14C).
Elements taken up from the soil via roots can be accumulated in roots and leaves. While some elements taken up by plants are essential for growth and development, some are toxic (Kabata-Pendias and Pendias Reference Kabata-Pendias and Pendias1992). The most toxic metals for higher plants are Hg, Cu, Ni, Pb, Co, Cd, and possibly Ag, Be, and Sn. The assessment of toxic concentrations and effects of trace elements on plants is highly complex because it depends on several factors that cannot be measured on a linear scale (Kabata-Pendias and Pendias Reference Kabata-Pendias and Pendias1992). Elements taken up by plants from the atmosphere can provide clues about air pollution, whereas elements taken up via the roots can provide information about past contamination, as some elements can remain in the soil over several years. For example, Pb is mainly derived from anthropogenic sources (De Vleeschouwer et al. Reference De Vleeschouwer, Gérard, Goormaghtigh, Mattielli, Le Roux and Fagel2007, Reference De Vleeschouwer, Fagel, Cheburkin, Pazdur, Sikorski, Mattielli, Renson, Fialkiewicz, Piotrowska and Le Roux2009) and can remain in the soil for thousands of years. The concentration of the elements in soil and air is area-specific. For instance, Steinnes et al. (Reference Steinnes, Grodzińska, Szarek-Łukaszewska and Nygárd2005) measured the highest concentrations of lead in the surface layer of soils in southern Poland (≤ 142 mg/kg). The following threshold concentrations have been established for soils of coniferous forest sites in southern Poland: copper (150 mg/kg), zinc (500 mg/kg), and lead (1500 mg/kg) (Zwoliński Reference Zwoliński1995); these elements are largely linked to industrial emissions in the area.
In Silesia, southwestern Poland, high levels of pollution were recorded from 1960 to 1990, mainly caused by the industrial sector. Trees respond differently to environmental stress, e.g., by decreased growth, increased heterogeneity of tree-ring growth, reduced sensitivity to short-term environmental impulses, and changes in wood composition. After a significant reduction in pollution loads in the early 1990s, pines quickly recovered (Sensuła et al. Reference Sensuła, Wilczynski and Opala2015a, Reference Sensuła, Opala, Wilczynski and Pawelczyk2015b, Reference Sensuła, Wilczyński, Monin, Allan, Pazdur and Fagel2017). Different investigations have been conducted in Silesia, mainly near factories, to assess the impacts of anthropogenically caused contamination on pine tree stands (for example, Norman Reference Norman1999; Malik et al. Reference Malik, Danek, Marchwińska-Wyrwał, Danek, Wistuba and Krąpiec2012; Sensuła Reference Sensuła2016; Sensuła et al. Reference Sensuła, Wilczyński, Monin, Allan, Pazdur and Fagel2017). In such investigations, the determination of the chemical properties of tree rings and foliage is crucial to evaluate environmental changes. In particular, the monitoring of heavy metals stands out, as they not only impact plant growth and development, but also human health.
In this context, we used trace metal and Pb isotopes measured in pine needles as bioindicators of the accumulation of elements emitted into the atmosphere and deposited in foliage, focusing on Cr, Co, Ni, Cu, Zn, and Pb in young needles.
MATERIAL AND METHODS
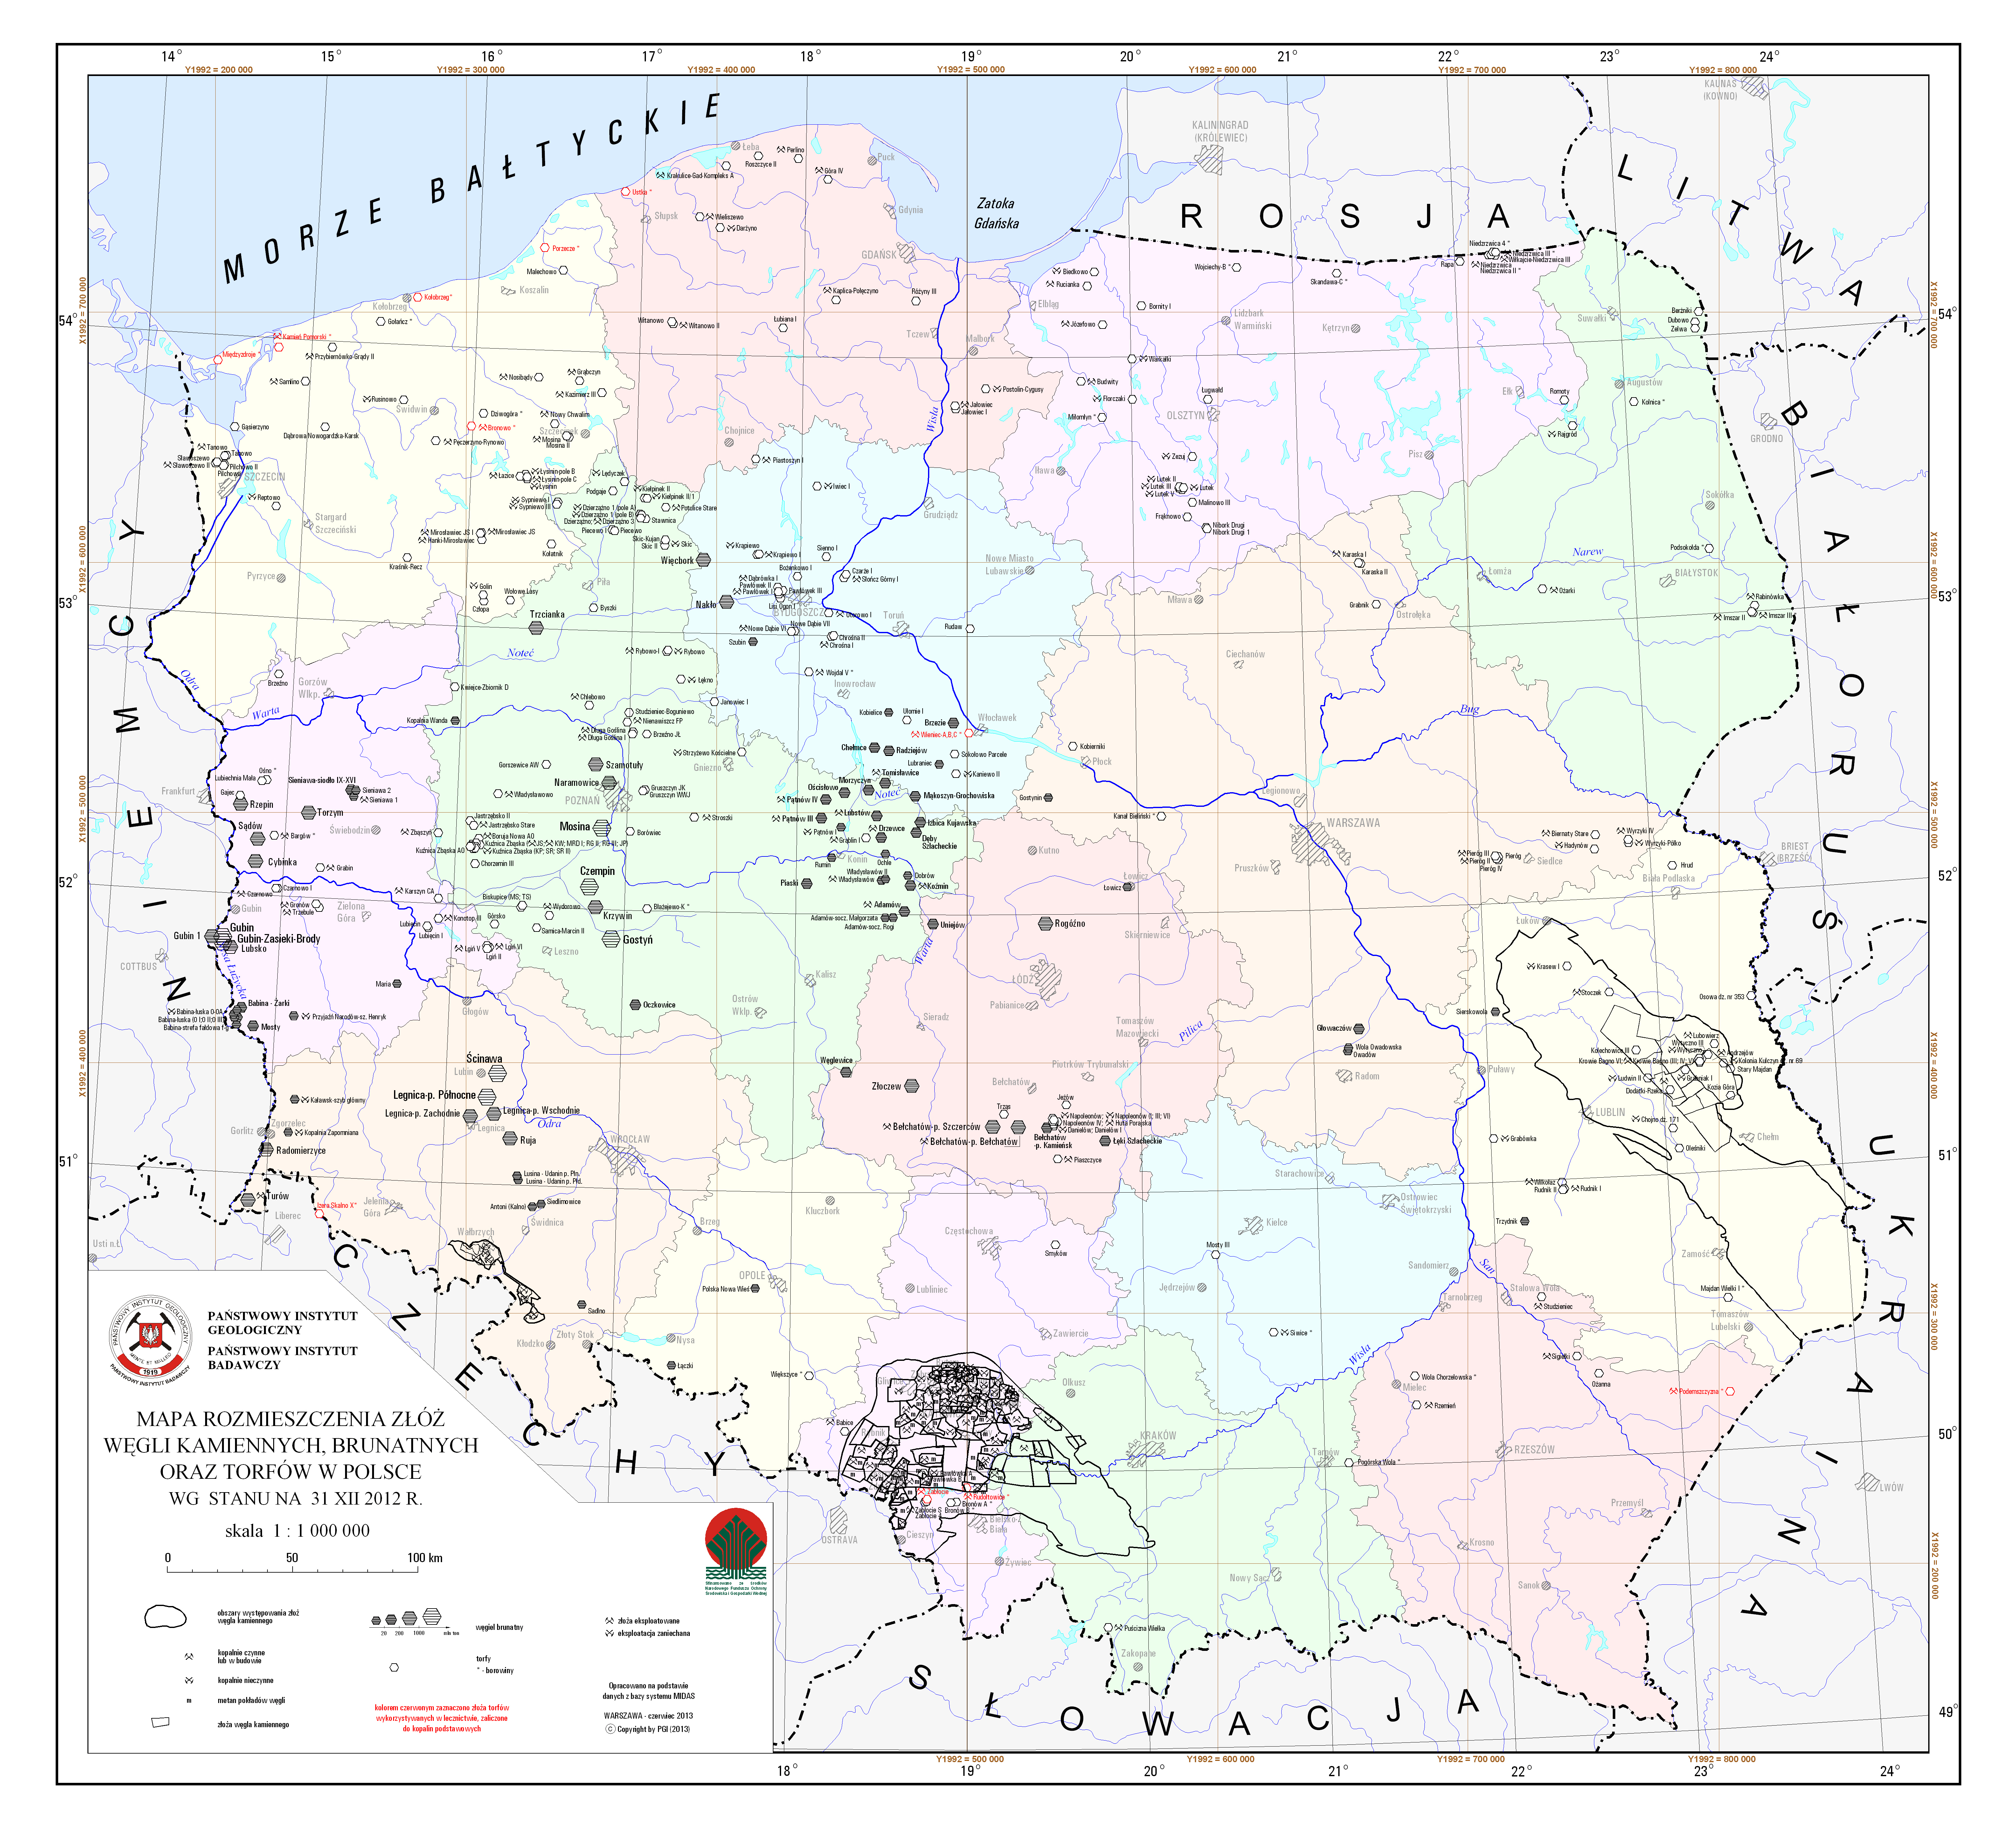
Pine needles (Pinus sylvestris L.) from the current year were collected from forests located at different distances from factories (Figure 1, Table 1) within nine communes or cities in the highly populated and industrialized southern part of Poland.
Location of nine sampling sites near different factories (BL-Petrochemia-Blachownia and KK-nitrogen factories in Kędzierzyn Koźle, LA-power plant in Łaziska, KO-coking plant and HK-steel factory in Dąbrowa Górnicza) in the provinces of Opolskie and Silesia. The coal basin is indicated on the map (geoportal.pgi.gov.pl:http://geoportal.pgi.gov.pl/css/surowce/images/2012/mapy/large/large_8.jpg).
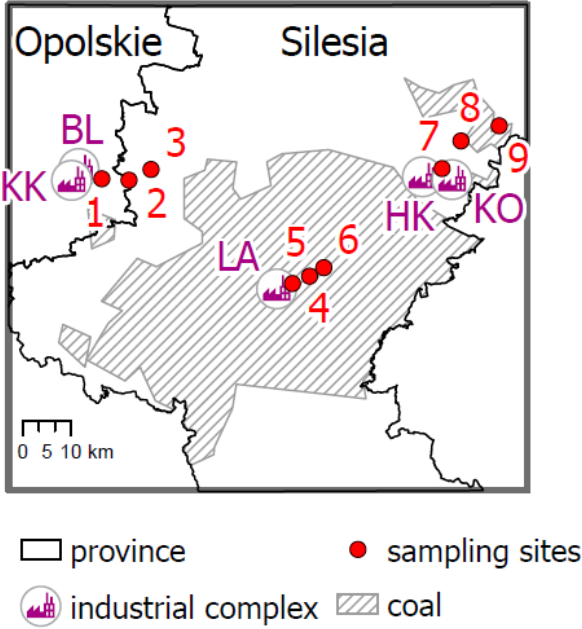
Sampling sites.

Three sampling sites were located in Opole Province near the Petrochemia-Blachownia chemical factory (BL) and a nitrogen factory (KK, ancient name: Zakłady Azotowe Kędzierzyn-Koźle), on the highway A4 within the communes of Sławięcice (50°20′15.7″N; 18°19′52″E, site 1), Rudziniec (50°20′3.6″N; 18°24′29.9″E, site 2), and Rudno (50°21′26.4″N; 18°28′14.5″E, site 3). The other six sampling sites were located in the province of Silesia. Of these, six were near the Łaziska Power Plant (LA) in the communes of Wyry (50°9′38.8″N; 18°56′4.4″E, site 4), Mikołów (50°10′35.1″N; 18°58′52.8″E, site 5), and Podlesie (50°8′55.4″N; 18°53′4.9″E, site 6), while three were near a coking plant (KO) and a steel factory (HK, Huta Katowice/ArcelorMittal Poland Oddział) in Dąbrowa Górnicza, in the communes of Dąbrowa Górnicza (50°21′48.5″N; 19°19′24″E, site 7), Łazy (50°24′58.4″N; 19°22′56.8″E, site 8) and Ogrodzieniec (50°26′27″N; 19°29′30.6″E, site 9). According to the environmental reports of Chief Inspector of Environmental Protection (http://www.gios.gov.pl/), these factories were listed as some of the most polluting factories up to the late 1990s. Nowadays, air contamination due to industrial emissions is not as significant as it was in 20th century, but emissions from transport and domestic coal burning are still a matter of concern.
The sampling sites were selected to be in the direction of the dominant winds. In January 2013, we sampled young pine needles formed in 2012 (sample numbers 1–9, collected from sites 1–9). The samples were collected on the same day to avoid weather influences. In addition, needles were also collected in 2013 for three of the sampling sites. The needles formed in 2013 were collected in September 2013 (sample numbers 10–12, collected from sites 4, 5, and 6, respectively).
Needles were collected from the tree crowns, placed in plastic bags, and separated manually in the laboratory. Prior to geochemical analysis, samples were lyophilized. For 14C analysis and fraction modern determination (14F), the needles were prepared using a standard acid-alkali-acid treatment in a three-step treatment: (1) 2% HCl at 80ºC for 2 hr, neutralization with deionized water, (2) 2N NaOH at 80ºC for 2 hr, neutralization with deionized water, (3) 2% HCl at 80ºC for 2 hr, neutralization with deionized water and dried, then washed with distilled water to neutral pH, thus NaOH, samples were converted to benzene for LSC (liquid scintillation counter) measurements. Measurement of (14C) concentrations in pine needles was performed with a β-radiation liquid spectrometer of the Quantulus 1220 type (Pazdur et al. Reference Pazdur, Fogtman, Michczyński and Pawlyta2013). The background F14C was equal to 0.019 pMC. The reference material ANU Sucrose (Rozanski Reference Rozanski1991) was used and the fraction modern was calculated according to Mook and van der Plicht (Reference Mook and van der Plicht1999).
For ICP-MS and MC-ICP-MS analyses, the samples were first dried at 90ºC for 24 hr, manually ground into a powder, and combusted at 550ºC for 4 hr to remove organic matter. Combusted samples were transferred to Teflon vials and digested via two steps: (1) a mixture of 4 mL of HF 36N and 1 mL of HNO3 14N was added, and the samples were kept at 120ºC for 48 hr; (2) HCl 6N was added, and the samples were kept at 140°C for 48 hr. Each step was followed by evaporation at 90ºC. Subsequently, the samples were dissolved in 1 mL of 5% HNO3 and divided into two parts. The first part, i.e., 200 μL of the solution, was transferred into a Teflon vial for elemental analysis and then evaporated to dryness at 90ºC. The second part, corresponding to 800 μL of the solution, was used for lead isotope analysis. This part was evaporated at 90ºC, and the dried residue was dissolved in 500 μL of HBr 0.8N prior to chromatographic separation. Lead separation was made by using anion-exchange chromatography by successive adding of HBr and HCl in the clean class-100 laboratory at the University of Liège (Belgium) (De Vleeschouwer et al. Reference De Vleeschouwer, Gérard, Goormaghtigh, Mattielli, Le Roux and Fagel2007). The eluted Pb solution was evaporated and stored prior to analysis.
Before the analysis, the ICP-MS instrument was calibrated and linearity was checked for the BHVO2 standard concentrations of 0, 0.01, 0.1, 5, 10, and 20 ppb. Repeated blank measurements were used to determine the limit of detection for each element. Replicates (i.e., run of the same samples twice) and duplicate (i.e., repetition of the analyses with different aliquots of the same samples) were performed. The standard deviation of each result was ≤ 5%.
Lead isotopes (Table 3) were measured using the Nu Instruments Multi-Collector Inductively Coupled Plasma Mass Spectrometer (MC-ICP-MS) at the Laboratoire G-Time (Université Libre de Bruxelles, Belgium). For MC-ICP-MS, the standard NBS981 was repeatedly measured in alternation with samples to control any daily instrument drifts.
RESULTS AND DISCUSSION
The spatial and temporal variations of the element levels (Cr, Co, Ni, Cu, Zn, Pb) are reported in Figures 2 and 3. The results of 14C analysis and fraction modern determination and trace element concentrations in the pine needles from different sites are presented in the Table 2. The needles were characterized based on the concentrations of Cr, ranging from 0.05 to 0.7 mg/kg, Co, from 0.005 to 0.075 mg/kg, Ni, from 0.12 to 0.66 mg/kg, Cu, from 0.49 to 1.0 mg/kg, Zn, from 3.9 to 14 mg/kg, and Pb, from 0.06 to 0.53 mg/kg. These values represent the minimum concentrations, as some contamination deposited on the needle surface may have been removed by precipitation or wind.
Accumulation of Cu, Cr, Pb, Ni, and Co in pine needles formed in 2012 (samples no. 1–9) and 2013 (samples no. 10–12) in areas near different factories, i.e., Petrochemia-Blachownia (BL) and nitrogen factories (KK), Łaziska Power Plant (LA), coking plant Przyjaźń (KO), and the steel factory Huta Katowice (HK).

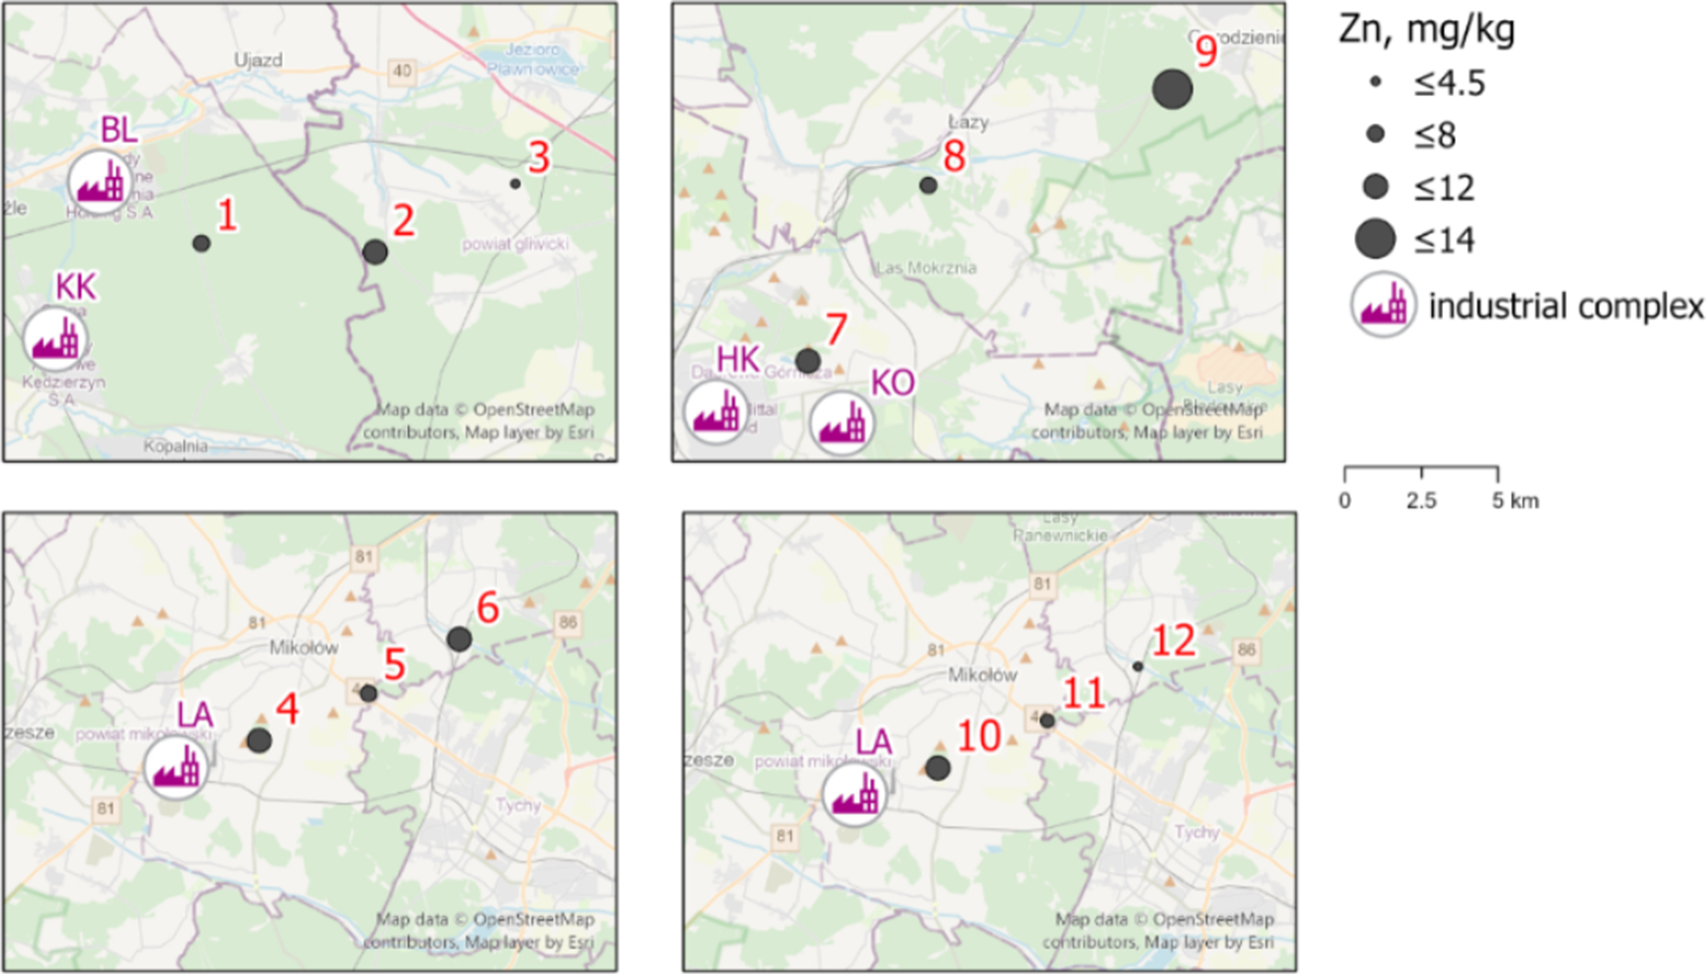
Accumulation of Zn in pine needles formed in 2012 (samples no. 1–9) and in 2013 (samples no. 10–12) in areas near different factories, i.e., Petrochemia-Blachownia (BL) and nitrogen factories (KK), Łaziska Power Plant (LA), coking plant Przyjaźń (KO), and the steel factory Huta Katowice (HK).
Radiocarbon concentration and trace elements accumulation in annual pine needles collected in 2013 in three cities of Opole and six cities in Silesia Voivodeship. Standard deviation for trace elements was always 5% or lower. Values below the detection limit are marked as “*”. The reference value of BHVO-2 was adopted from Chauvel et al. (2010). LD is the limit of detection, a. Replicate corresponds to a re-run of the same sample solution; b. Duplicate corresponds to the analyses of two different aliquots from the same sample. We determined minimum, maximum, average, median, and standard deviations for all samples.

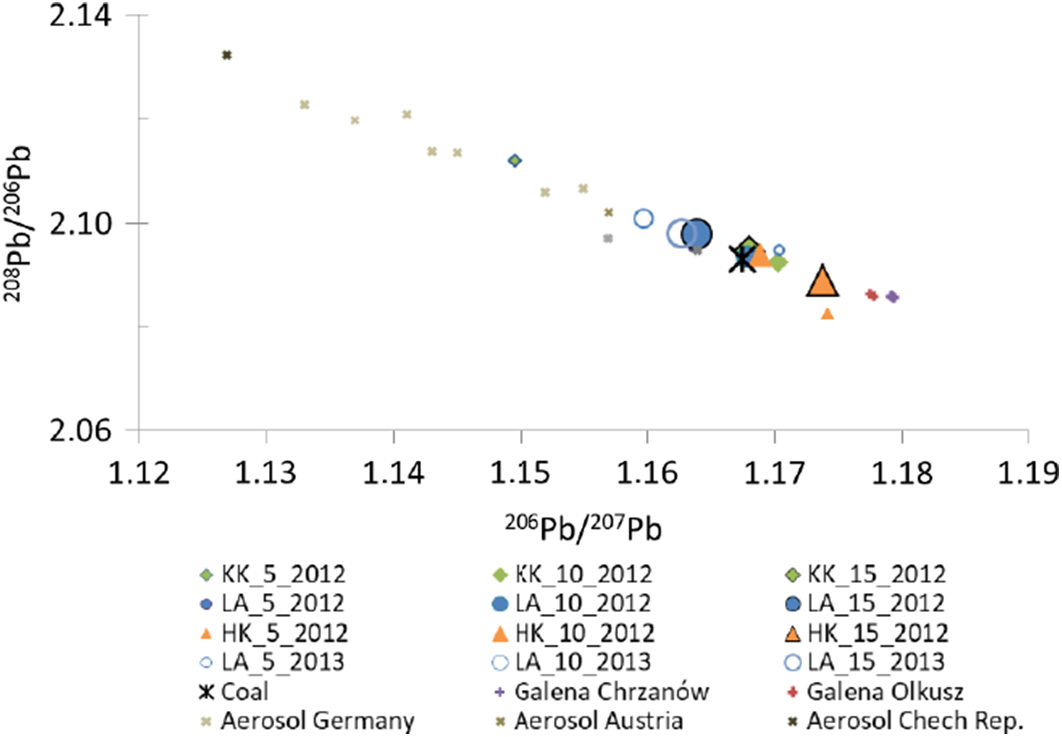
The spatial and temporal variations of the lead isotope ratios are shown in Figure 4 and Table 3. The range of Pb isotope ratios was relatively narrow. In the area near the chemical factories in Kędzierzyn-Koźle, 206Pb/207Pb isotope ratios ranged between 1.15 (KK_5) and 1.17 (KK_10), whereas 208Pb/206Pb varied between 2.09 (KK_10 and KK_15) and 2.11 (KK_5). Near the Power Plant in Łaziska, 206Pb/207Pb isotope ratios ranged between 1.163 (LA_5 and LA_15) and 1.168 (LA_10), whereas 208Pb/206Pb varied between 2.093 (LA_10) and 2.097 (LA_15). Near the steel factory “Huta Katowice” in Dąbrowa Górnicza, 206Pb/207Pb isotope ratios ranged from 1.168 (KK_10) to 1.174 (HK_15) and 208Pb/206Pb from 2.082 (HK_5) to 2.094 (HK_15).
Variation in 208Pb/206Pb isotope ratio versus 206Pb/207Pb in pine needles (current studies), coal from Katowice, Galena from Olkusz and Chrzanów (De Vleeschouwer et al. Reference De Vleeschouwer, Fagel, Cheburkin, Pazdur, Sikorski, Mattielli, Renson, Fialkiewicz, Piotrowska and Le Roux2009), and aerosols (after Bollhöfer and Rosman Reference Bollhöfer and Rosman2001).
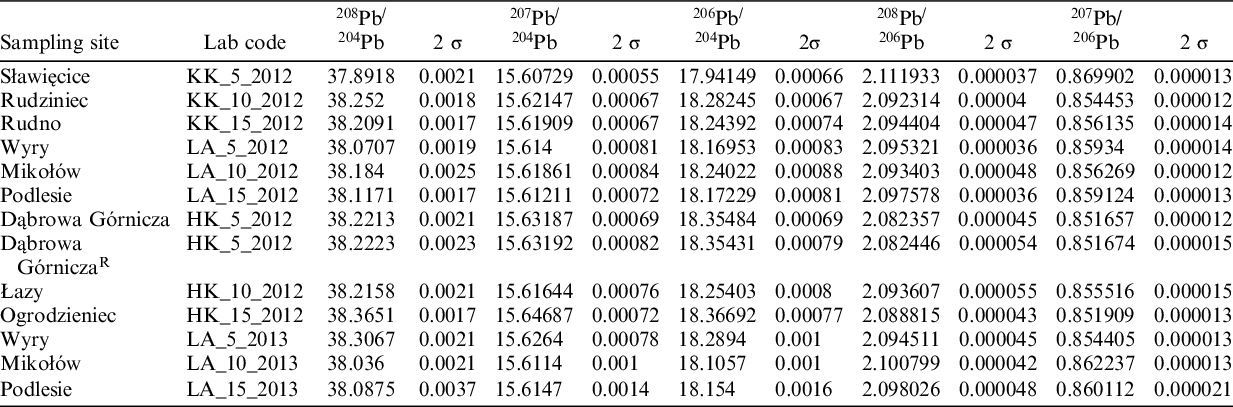
Ratio of the Pb isotopic composition in annual pine needles collected in 2013 in three cities of Opole and six cities in Silesia Voivodeship. “R” indicates replicate, i.e., a re-run of the same sample solution. 26 – refers to the accuracy calculated via two standard deviations. We determined minimum, maximum, average, median, and standard deviation values for all samples.
Radiocarbon
Plants convert CO2 from the air into cellulose and while living, plants are in equilibrium with their surroundings by exchanging carbon with the atmosphere. In the highly populated Silesia region, where a burning fossil fuels is the largest source of CO2 emission and which is located far from nuclear power plant, a Suess effect (Keeling Reference Keeling1979) a 14C depletion in pine needles relative to clean air, was expected, we have found that higher concentration of 14C in the needles relative to clean air. Review of the literature describes the pathway and associated fractionation of 14C and δ13C in CO2 during photosynthesis, respiration and dissolution by groundwater (Białobok et al. Reference Białobok, Boratyński and Bugała1993; Dawson et al. Reference Dawson, Mambelli, Plamboeck, Templer and Tu2002; Trumbore Reference Trumbore2006). The changes in carbon isotopes fractionation during these processes are smaller than differences in 14C composition of the 14C in current atmospheric background (Hammer and Levin Reference Hammer and Levin2017) in pine foliage in Silesia. We suppose that, in the region of Silesia localized far from nuclear power plant, that the observed enrichment in 14C in pine needles can be connected with point-source emitters, where products enriched in 14C, are utilized and combusted (for example products used in 14C-labeling in medical sector, or probably also household wood burning). To confirm or to reject this hypothesis, additional analyses will be done in future.
Trace Elements
The elements Ni, Cr, Zn, Pb, Co, Cu were mainly derived from anthropogenic sources, whereas Rb and Sr derived from the erosion of the continental crust (Bowen Reference Bowen1979). In the last decades, different industrial sectors and transport (leaded petrol combustion) have released large amounts of heavy metals into the atmosphere (Nriagu and Pacyna Reference Nriagu and Pacyna1988), while private households have also become a significant source of air contamination. Elements absorbed by leaves are partly translocated to roots and are also leached from plant foliage, especially by acid rain. Under specific conditions, and especially with atmospheric pollution, a high proportion of trace metals may enter plant tissues.
Heavy Metals
In the province of Opolskie province nearby nitrogen factories (KK) and Petrochemia-Blachownia (BL), the Cr concentration in the needles was stable and low, while Ni was only detected in KK_10. Copper and zinc were detected in the three studied sites, with highest concentrations in KK_10. The Pb concentration differed with different distances from the factories. Higher levels were found for pines in close proximity to factories; at a distance of 10 km, the concentrations were lower and further decreased with decreasing distance to the highway.
In the areas near the power station Łaziska (Silesia Voivodeship), higher concentrations of Cr and Ni were found in pine needles from sites located farther from the factory; the larger the distance, the higher the concentrations. The Cu levels were similar across the area. Regarding Zn, the highest concentration has been observed in the commune located nearest to the factory and the lowest at a distance of 7 km; the Cu concentration slightly increased with increasing distance from the factory. Heavy metal accumulation in the needles differed between January and September. In September, the highest total heavy metal concentration was observed in the sampling sites closest to the factory.
In the sites near the steel factory (HK) and the coking plant (KO) in Dąbrowa Górnicza (Silesia province), Ni levels were higher in the needles from stands further away from the factories. The opposite pattern was observed for Cr and Pb. Copper concentrations were similar for all investigated sites. The highest Zn concentration was observed in the commune nearest to the factory and the lowest at a distance of 11 km from the factory, with a further slight increase up to a distance of 19 km.
The concentrations of Zn, Cu, and Pb in pine needles measured in this study were lower than those obtained previously for pines growing near mining sites (Pietrzykowski et al. Reference Pietrzykowski, Socha and van Doornd2014). In a study from 2009, the average heavy metal concentrations in pine needles were as follows: Zn from 33 to 77 mg/kg, Cu from 3.0 to 28 mg/kg, and Pb from 0.8 to 3.2 mg/kg, measured in Poland near Smolnica, Szczakowa, and Piaseczno, respectively. In another study, the concentrations of heavy metals in the needles of different pine species varied, with Cu ranging from 7 to 10 mg/kg, Ni from 41 to 90 mg/kg, and Zn from 42 to 119 mg/kg (Parzych et al. Reference Parzych, Mochnacky, Sobisz, Kurhaluk and Polláková2017). Previous studies have shown that the heavy metal concentrations in foliar dust differ among different regions; for example, in Spain, Aboal et al. (Reference Aboal, Fernández and Carballeira2004) found the following mean values: Cr: 0.235 mg/kg, Cu 3.52 mg/kg, Ni 3.71 mg/kg, Zn 19.06 mg/kg, Pb 0.059 mg/kg. In a study in China, Pb ranged from 434.0 to 512.0 mg/kg (Yuan et al. Reference Yuan, Dongsheng, Weiwei and Kangyou2009), while in another Chinese study, Ni ranged from 50.4 to 388.6 mg/kg, Zn ranged from 162 to 2152 mg/kg, and Cu ranged from 43 to 218 mg/kg (Yin et al. Reference Yin, Wang, Deng, Shi and Chen2013). Although the toxicity of heavy metals for plants is widely known (Kabata-Pendias and Pendias Reference Kabata-Pendias and Pendias1992), the underlying mechanisms have not yet been fully elucidated (Pietrzykowski et al. Reference Pietrzykowski, Socha and van Doornd2014).
Figures 2 and 3 show the distribution of heavy metals in pine trees growing at distances of 3–19 km from factories; the median concentrations followed the order Cr < Pb < Cu < Zn, which is in agreement with previous findings from the same area (Sensuła et al. Reference Sensuła, Wilczyński, Monin, Allan, Pazdur and Fagel2017). However, the industrial factor is not the only source of air contamination; household emissions and emissions by traffic are also considerably high. Some heavy metals can be transported by wind over long distances. It should be noted that the needles collected in winter (in January) had been formed in the spring of the previous year, accumulating elements for nearly 1 year. The samples collected in September consisted of young needles from May in the same year.
Lead Isotopes
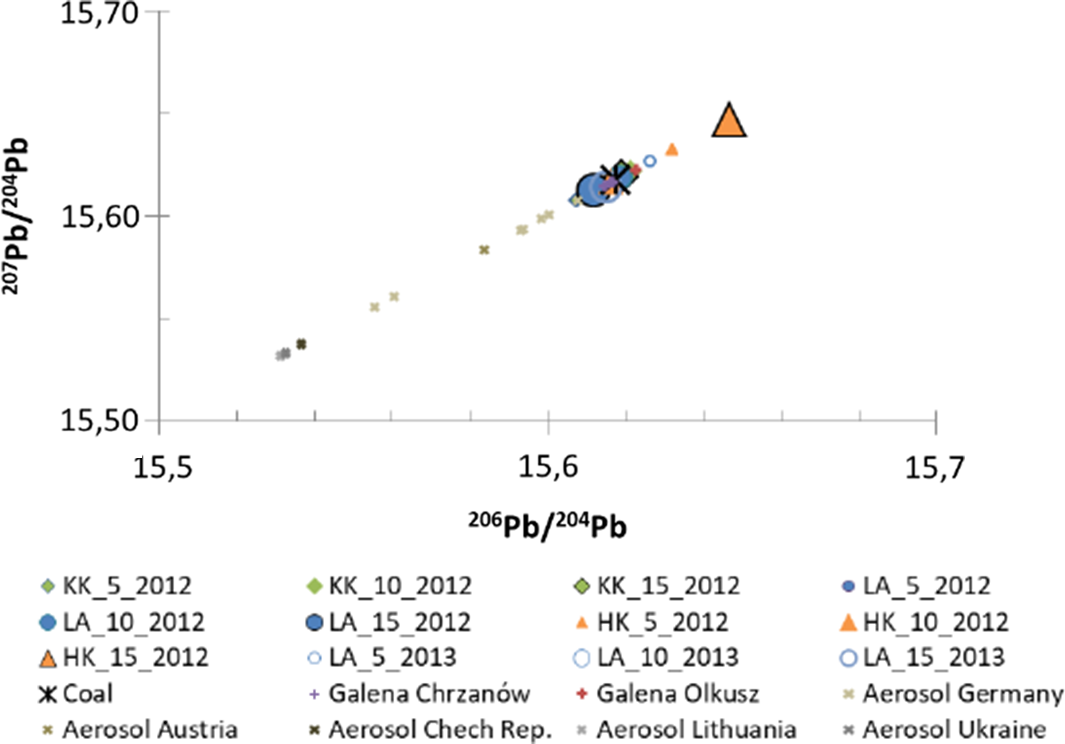
The study area is characterized by spatial variations in the Pb isotopic composition of the needles (Figure 3, Tables 2 and 3). The 208Pb/206Pb ratio ranged from 2.08 to 2.11 and the 206Pb/207Pb ratio between 1.15 and 1.17. The heterogeneity of Pb isotope ratio indicates that there are different sources affecting the Pb isotopic composition of pine needles (Figures 4–6). The samples are aligned along a linear trend that may be interpreted by a mixing line between different anthropogenic Pb sources (e.g., Bollhöfer and Rosman Reference Bollhöfer and Rosman2001; Doucet and Carignan Reference Doucet and Caringan2001; Cloquet et al. Reference Cloquet, Carignan and Libourel2006). The three main sources of Pb are related to the exploitation of galena ores, coal burning, and aerosols. In addition to industrial activities, a significant part of the pollution derived from coal combustion is probably due to low emissions by private households and coal burning for heating. The Pb isotopic composition of the atmosphere in Central Europe has been measured via aerosol samplers (Bollhöfer and Rosman Reference Bollhöfer and Rosman2001), and the results for Eastern Europe suggest a mix of alkyllead compounds from different sources, mainly related to industrial activities and coal burning (Bollhöfer and Rosman Reference Bollhöfer and Rosman2001). Lead from the industrial sector, associated with coal and steel plants, was enriched in 206Pb and 207Pb compared to 204Pb. Depletion in 206Pb and 207Pb compared to 204Pb (i.e., 206Pb/204Pb < 17.7), 207Pb/204Pb < 15.58, respectively) corresponds to the European gasoline lead origin. The end-member with a low 206Pb/207Pb isotope ratio is most probably influenced by traffic (Bollhöfer and Rosman Reference Bollhöfer and Rosman2001).
Variation in 207Pb/204Pb isotope ratio versus 206Pb/204Pb in pine needles (current studies), coal from Katowice, Galena from Olkusz and Chrzanów (De Vleeschouwer et al. Reference De Vleeschouwer, Fagel, Cheburkin, Pazdur, Sikorski, Mattielli, Renson, Fialkiewicz, Piotrowska and Le Roux2009) aerosols (after Bollhöfer and Rosman Reference Bollhöfer and Rosman2001).
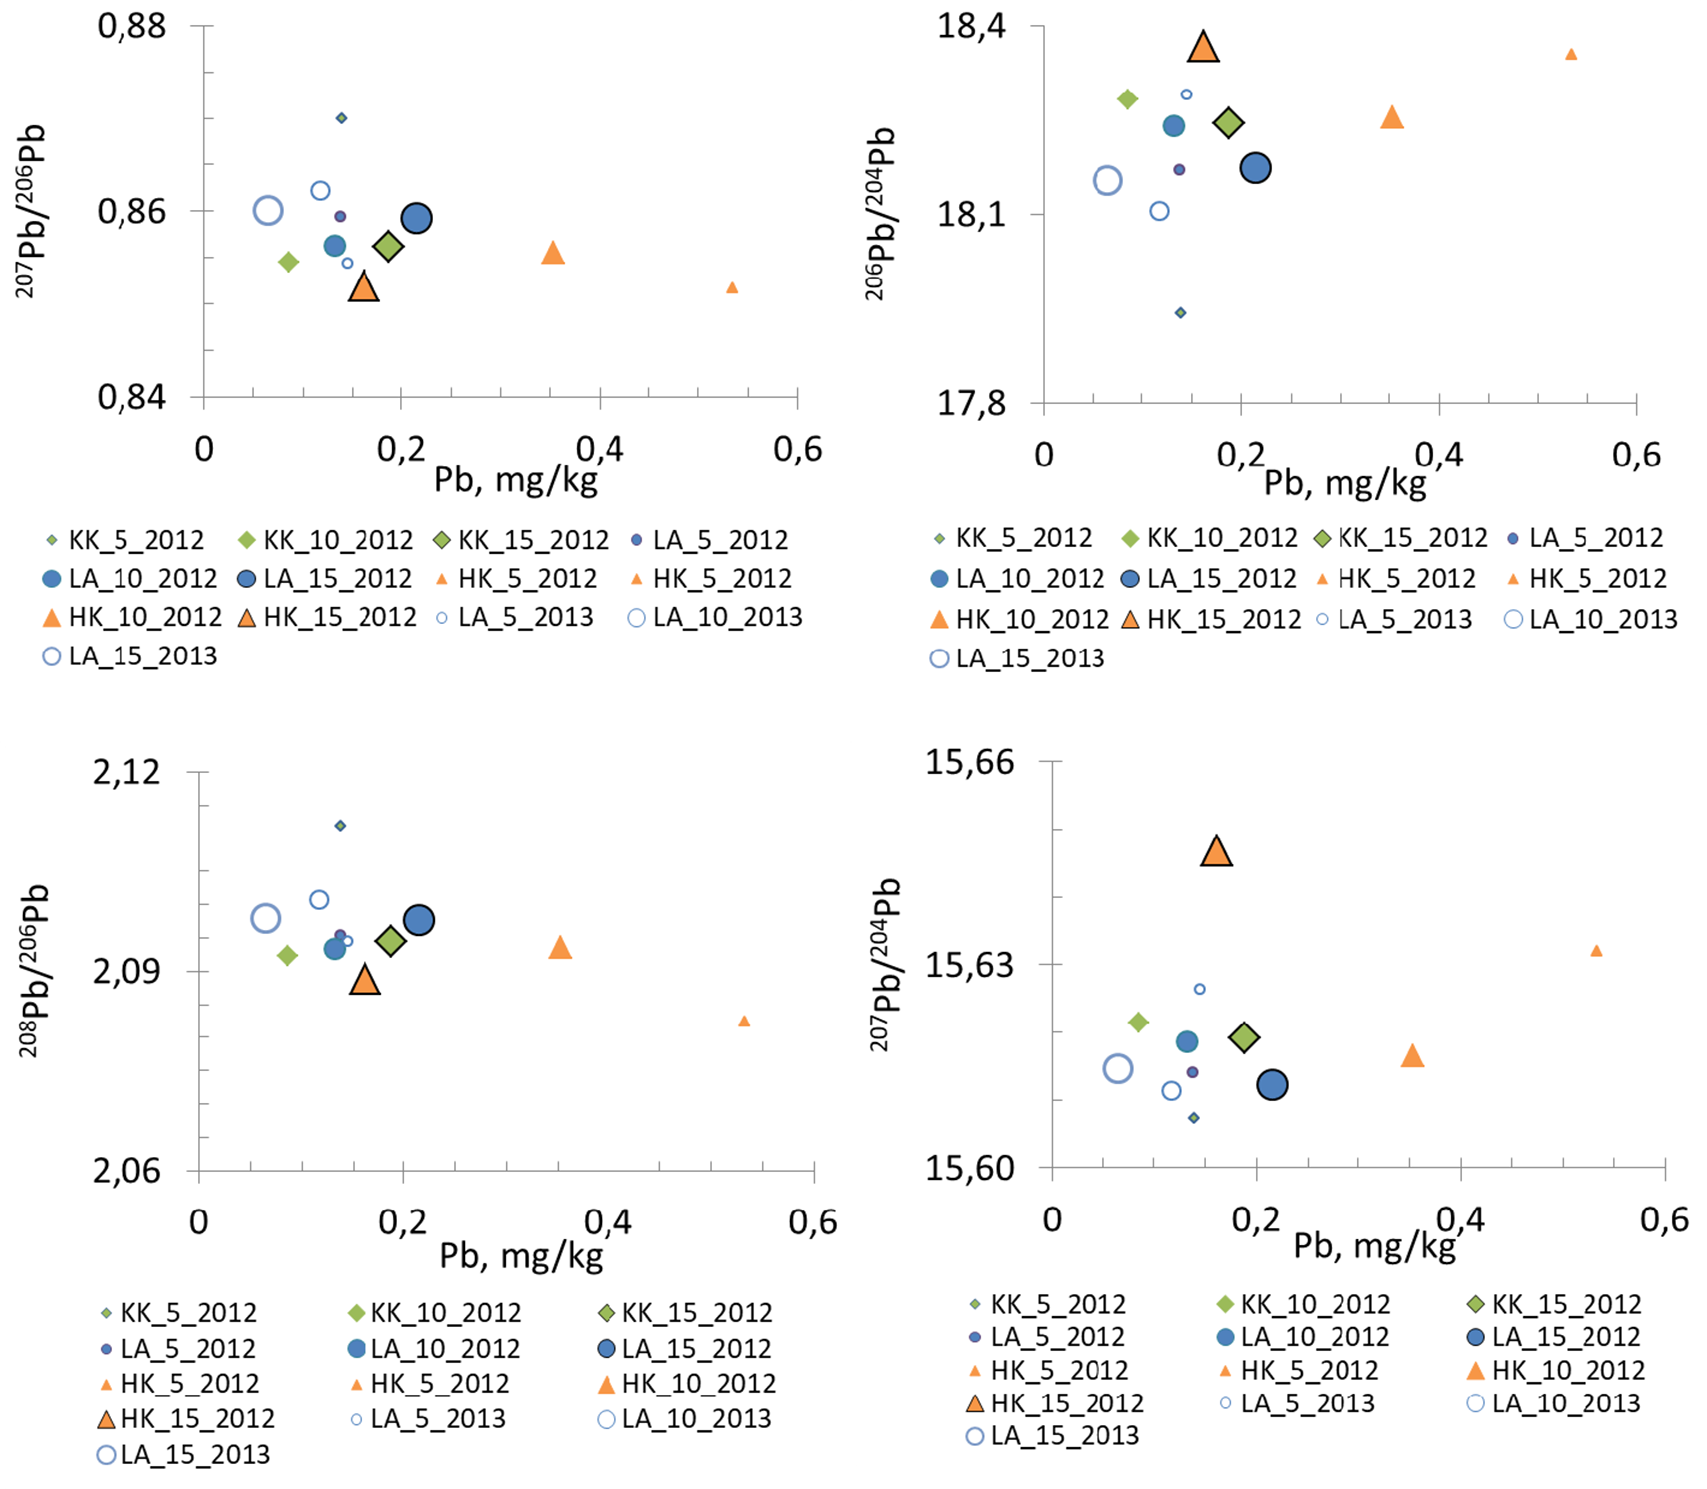
Distribution of Pb isotopic ratio in comparison with lead concentration.
Although lead gasoline was banned in the year 2000 in Poland, plants may still accumulate lead from other sources. Analysis of the lead isotopic ratio 208Pb/206Pb versus 206Pb/207Pb showed that local coal and galena are the two main sources of lead, although previous Pb pollution cannot be excluded. Lead can remain in the soil over several years and can be taken up by plants via the roots. However, Dalenberg and van Driel (Reference Dalenberg and van Driel1990) have calculated that 73 to 95% of the total 210Pb content of field crops are derived from aerial deposition on leaf surfaces.
CONCLUSIONS
We determined radiocarbon, trace element accumulation, and Pb isotope ratios in pine needles collected in a heavily industrialized area of Poland to evaluate the degree of air contamination. Most of the elements were derived from anthropogenic activities. The temporal and spatial variations were evident. All sampling sites are characterized by high levels of radiocarbon. Also high level of zinc and copper, and lead was detected in pine needles. The variation in the radiocarbon indicates a mix between different sources of 14C, also lead isotopic composition indicates a mix between different sources Pb, respectively. Industrial activity, private households, and transport are a source of atmospheric contamination in the provinces of Opolskie and Silesia.
ACKNOWLEDGMENTS
The authors express their sincere gratitude to everyone who contributed to this study, particularly Joel Ottan from the University of Liège and Nadine Mattielli from Laboratoire G-Time, Université Libre de Bruxelles, Belgium. This work was supported by National Science Center, Poland [grant number DEC-2011/03/D/ST10/05251], the Ministry of Science and Higher Education [grant number BKM-507/RIF/2013, BKM-509/RIF/2014 and BKM-513/RIF/2015], the rector’s grant in the area of research and development, Silesian University of Technology [grant number 14/990/RGJ19/0117, PI Barbara Sensuła], WBI 2017-2019; PI: B. Sensuła, N. Fagel.


 Open access