

Working longer is a key to securing a comfortable retirement (Munnell and Sass, Reference Munnell and Sass2008; Bronschtein et al., Reference Bronschtein, Scott, Shoven and Slavov2019). However, health shocks are known to push older workers out of the labor force before their intended retirement date (Coile and Levine, Reference Coile and Levine2007; Munnell et al., Reference Munnell, Sanzenbacher and Rutledge2018b). Until 2010, the trend of rising disability-free life expectancy in the United States suggested increasing scope for longer working lives (Munnell et al., Reference Munnell, Soto and Golub-Sass2008; Cutler, Reference Cutler2009; Cutler et al., Reference Cutler, Ghosh, Landrum and Wise2014; Crimmins et al., Reference Crimmins, Zhang and Saito2016; Chernew et al., Reference Chernew, Cutler, Ghosh, Landrum and Wise2017), but recent developments may have stalled this progress.
This paper examines the period 2006–2018 to explore how long individuals can expect to be able to keep working, and how these expectations vary across racial and socioeconomic status (SES) groups. The analysis mirrors that of Munnell et al. (Reference Munnell, Soto and Golub-Sass2008), combining mortality data from the National Vital Statistics System (NVSS) with data on the total and institutionalized population from the American Community Survey (ACS), and data on work-limiting impairments from the National Health Interview Survey (NHIS).
These datasets are used to estimate cumulative probabilities of mortality, institutionalization, and disability at each age after 50 for different demographic and education groups. The resulting profiles of working life by age are then used to calculate working life expectancy at 50 for each group. These expected additional years of working ability are estimated for each year between 2006 and 2018.
The concept of working life expectancy here parallels the concept of period life expectancy in the purely mortality-based context. It is a summary measure of remaining work ability at a given moment for a cross-section of the population, but does not reflect the expectation of future years of work ability for any specific person. In particular, with respect to institutionalization, the averages reflect the pattern of institutionalization by age at a given time but do not account for shifting patterns of institutionalization by age over time, nor for the fact that an individual who is institutionalized already is likely to remain so in the next year, while one who is not institutionalized is relatively unlikely to become so. This exercise is therefore descriptive, and not directly applicable to prediction for a specific individual or even cohort.Footnote 1
The resulting trends nevertheless suggest cause for concern. While overall life expectancy at age 50 displays moderate improvement for the general population and for every demographic group since 2006, the same is not true for working life expectancy. Working life expectancy at 50 has increased slightly for high-education groups – Black and white, men and women. However low-education groups have, with the exception of Black women, experienced stagnation in their working life expectancy. This pattern suggests that calls for older workers to delay retirement, which have proven successful over the past couple of decades, may be less fruitful going forward.
The rest of the paper proceeds as follows. Section 2 presents the current state of the literature. Section 3 discusses the data and methodology for the analysis. Section 4 estimates the components of working life expectancy – mortality, institutionalization, and work-limiting disability – and working life expectancy at age 50 for the full population segmented by gender. Section 5 shows the same estimates broken out by the various racial and SES groups. The final section concludes that working life expectancy has improved since 2006 primarily among the more highly educated, while lower-educated individuals have experienced stagnation in working life expectancy.
1. Background
The main question in this paper is how long people will be able to work and how this varies by education, race, and gender. Prior work on disability-free life expectancy – how long individuals can expect to live without a disability – does not answer this question. Most studies of health trends define poor health as an inability to perform activities or instrumental activities of daily living (ADLs and IADLs). But ADLs and IADLs are an extreme form of functional limitation; ailments that are both more prevalent and less severe are also likely to prevent people from working (Burkhauser et al., Reference Burkhauser, Daly, Houtenville and Nargis2002).
Coile and Duggan (Reference Coile and Duggan2019) conduct one of the few analyses of work-limiting disability. They find that, among men ages 45–54 without a college degree, 1.7 percent reported an ADL in 2015, compared to 16.0 percent reporting a work-limiting health condition; the comparable shares for those with a college degree were 0.9 and 7.5 percent. But since the authors limit their sample to prime-age men, the prevalence of work-limiting health conditions among near-retirees of both genders remains unexamined. Differences by race and education are similarly unexplored.
The period covered by the current analysis includes the troubling acceleration of ‘deaths of despair’ among middle-age workers (Case and Deaton, Reference Case and Deaton2015), growing inequality, the Great Recession, and the subsequent recovery. Following these upheavals, the analysis explores both whether past trends in working life expectancy have changed and whether these trends vary by SES and race. Since less-educated whites and non-whites tend to approach retirement with fewer resources, declines in work capacity could prevent delayed retirement among the very individuals who would most benefit from it (Hou and Sanzenbacher, Reference Hou and Sanzenbacher2020; Biggs et al., Reference Biggs, Chen and Munnell2021; Munnell et al., Reference Munnell, Wettstein and Hou2022).
Recent trends suggest cause for concern. Health status – measured by self-reported health, activities and instrumental activities of daily living, and obesity – has worsened over the past two decades (Martin et al., Reference Martin, Freedman, Schoeni and Andreski2010; Lezzoni et al., Reference Lezzoni, Kurtz and Rao2014). This decline has been particularly acute for workers without a college degree (Cutler et al., Reference Cutler, Ghosh, Landrum and Wise2014; Coile and Duggan, Reference Coile and Duggan2019). At the same time, the separate trend of rising educational attainment, which helped spur past improvements in disability-free life expectancy, has largely played out, as average educational attainment in the United States, which had been rising for decades, has flattened in recent cohorts (Munnell et al., Reference Munnell, Soto and Golub-Sass2008). And a long-term decline in nursing home use has mostly reduced institutionalization over age 80, when work is largely irrelevant (Kaiser Family Foundation, 2021).
Adding to worries about the work ability of low-education individuals, particularly Black individuals, are rising incarceration rates (U.S. Bureau of Justice Statistics, 2021). Despite incarceration rates falling for younger men over the period 2000–2016, they nevertheless continued to increase among middle-age men, reflecting the increase in incarceration of younger men in years past (Coile and Duggan, Reference Coile and Duggan2019).Footnote 2 Much like institutionalization in long-term care facilities, incarceration is a nearly insurmountable impediment to work.
Compounding trends in health, trends in mortality among the working-age population are also not encouraging. Although life expectancy has risen across the population over the past several decades (the COVID-19 pandemic notwithstanding), the gains have mostly occurred at older ages when individuals are well past retirement age (Chernew et al., Reference Chernew, Cutler, Ghosh, Landrum and Wise2017).Footnote 3 More troubling, recent studies have even found an increase in prime-age mortality rates among less-educated whites (Case and Deaton, Reference Case and Deaton2020).
The analysis brings together these disparate trends in mortality, institutionalization, and work-limiting disability. It explores the trends by gender, race, and SES, and combines the different measures of work capacity into a summary measure of working life expectancy.
2. Data
‘Working life expectancy’ – the additional years of work ability an individual can expect at a given age – depends on three components: (1) mortality risk; (2) the risk of institutionalization; and (3) the risk of work-limiting disabilities in the non-institutionalized population.Footnote 4 Each of these probabilities is estimated based on some combination of the NVSS, the ACS, and the NHIS, for the years 2006–2018. The NVSS gives the number of deaths in each demographic group defined by gender, race, and education. The ACS gives the total population in each such group as well as the institutionalized population. The NHIS is used to estimate the share of each demographic group in the community that suffers from a work-limiting disability. These components are estimated for each five-year age bracket after age 50 and for each SES group.Footnote 5
2.1 Defining the demographic groups
To estimate working life expectancy for different SES groups, it is first necessary to define the groups. Race and gender are relatively straightforward and the definitions follow those of the Census Bureau; the analysis focuses on non-Hispanic white and Black men and women.
However, defining relative education groups involves some discretion. Following Dowd and Hamoudi (Reference Dowd and Hamoudi2014), absolute levels of education are recognized as capturing increasingly more selection by unobserved characteristics. Thus, similar to Bound et al. (Reference Bound, Geronimus, Rodriguez and Waidmann2015), Sanzenbacher et al. (Reference Sanzenbacher, Webb, Cosgrove and Orlova2019) and Wettstein et al. (Reference Wettstein, Munnell, Hou and Gok2021), education in this analysis is defined in relative, rather than absolute, terms.
The assignment of individuals to their appropriate educational group is as follows. First, the ACS is used to determine the median level of education for each gender-race-cohort group.Footnote 6 Next, individuals in each of the datasets are assigned to be either above or below the median for their demographic group.Footnote 7 To allocate marginal absolute levels of education to above/below the median, individuals in the marginal groups are randomized in the appropriate proportions.Footnote 8
2.2 Mortality estimates
Age-specific mortality rates, q, for each demographic group defined by gender, race, and education are calculated year by year with the following formula:

where x is age, i represents each demographic group, j represents year, l x,i is the number of individuals alive in group i at age x using ACS data, and d x+1,i is the number of individuals in group i who die between ages x and x + 1 using the NVSS data. To correct for small cell size, the analysis adjusts the age-specific mortality rates using the Gompertz–Makeham formula (see Brown Reference Brown, Feldstein and Liebman2002 and Sanzenbacher and Ramos-Mercado Reference Sanzenbacher and Ramos-Mercado2016), estimated with non-linear least squares.
2.3 Institutionalization estimates
The share of each gender-race-education group living in institutions in each year is estimated from the ACS. Institutions include both long-term services and supports (LTSS) facilities (such as nursing homes) and carceral institutions such as prisons. Incarceration has played a large and growing role in low labor force participation over the past few decades, particularly among Black men (Coile and Duggan, Reference Coile and Duggan2019).
2.4 Work-limiting disability estimates
The estimate of the risk of work-limiting disability relies on three questions in the NHIS: (1) Does a physical, mental, or emotional problem keep you from working? (2) Are you limited in the kind/amount of work you can do because of your health? and (3) Are you limited in any way because of physical, mental, or emotional problems?Footnote 9 Following Crimmins et al. (Reference Crimmins, Saito and Ingegneri1997), individuals are considered disabled if they respond yes to any of these questions.Footnote 10
The final stage of the analysis estimates the probability of being able to work at a given age by multiplying the probabilities of being alive, non-institutionalized, and without a work-limiting disability. This is calculation is summarized in equation (2):

where W i,a is 1 if individual i is capable of work at age a and s i,a, c i,a, and h i,a represent the probability that individual i survives, in the community, and is healthy enough to work, respectively, at age a conditional on having been so in the previous period. Working life expectancy, at the current age, is the sum of this product over all future ages.
3. Estimates of key metrics for the full population
The methods outlined above produce three sets of probabilities – dying, entering an institution, and developing a work-limiting disability – for each demographic group, and for the full population. These estimates are calculated for every year between 2006 and 2018, producing time trends in the three risks.
3.1 Life expectancy trends
Appendix Tables A1 and A2 show the evolution of life expectancy at age 50 between 2006 and 2018, for men and women. At this age, life expectancy has steadily increased for both genders. From 2006 to 2018, period life expectancy increased by just over one year for men and by almost 1.2 years for women. Cohort life expectancies, which are generally higher since they reflect the predicted improvement of mortality in future years, also show steady increases. Even though period life expectancy overstates likely mortality, estimates of future improvement in mortality by demographic group are not available. Furthermore, the period approach is also consistent with the approach taken with respect to institutionalization and disability, which will also not account for changes across cohorts in incarceration rates and health. Hence, the rest of the analysis will proceed using period mortality estimates.
3.2 Institutionalization trends
Appendix Tables A3 and A4 show trends in the share of the population that is institutionalized in each five-year age bin from age 50 and up, for men and women respectively. The data display a number of patterns pertinent to working life expectancy.
First, institutionalization rates generally increase with age. This pattern is not surprising as institutionalization in mid- to late-life typically reflects residence in LTSS facilities, and LTSS needs rise sharply with age.Footnote 11 More unusual is the departure from this pattern for men, whose institutionalization rates decline in their 50s only to begin rising in their 60s. A substantial portion of men (but not women) in their 50s are incarcerated, with this share declining with age. Because so few individuals at these ages have LTSS needs, the age-related decline in incarceration swamps the small increases in LTSS facility use. However, by age 60, a growing need for LTSS results in the expected increasing slope of institutionalization with age going forward.
The other noteworthy patterns in the data concern time trends. Institutionalization at each age declines over time, particularly at older ages, reflecting a long-term reduction in nursing home use.Footnote 12 Again, men in their 50s and 60s stand out. While institutionalization is stable or declining for women at these ages (and sharply declining at older ages for both genders), the percentage of men in their 50s and 60s who are institutionalized has increased since 2006. This pattern likely reflects the increasing prevalence of long prison sentences in the last few decades, which are imposed primarily on younger men who then reach their 50s and 60s in correctional institutions.Footnote 13
3.3 Work-limiting disability trends
Appendix Tables A5 and A6 show the share of the non-institutionalized population with a work-limiting disability, for men and women respectively. Unsurprisingly, disability rates increase with age. More importantly, disability rates within a given age group do not seem to have systematically changed over time. In other words, holding age constant, work-limiting disability rates have held steady; thus the growth in total life expectancy implies more expected years of disability now than fifteen years ago, as additional years are added at older ages where disability rates are high. Working life expectancy will, indeed, be shown to reflect this fact.
3.4 Working life expectancy at age 50
Tables 1 and 2 show how many additional years a 50-year old man (woman) can expect to live, in total and in each of the states relevant to working life expectancy: not institutionalized and free of disability (i.e., capable of work), not institutionalized with a disability, and institutionalized. Furthermore, the tables also show how expected years in each of these states have changed since 2000 and since 2006, decomposing the change in total life expectancy into changes in the three relevant states of life.
Expectations at age 50 of years spent in various states for men

Sources: Authors' calculations using NHIS (2000–2018); ACS (2000–2018); and NVSS (2000–2018).
Expectations at age 50 of years spent in various states for women

Sources: Authors' calculations using NHIS (2000–2018); ACS (2000–2018); and NVSS (2000–2018). Values for the year 2000 are from Munnell et al. (Reference Munnell, Soto and Golub-Sass2008).
In 2018, a 50-year-old man could expect to live an additional 29.8 years, and in 21.8 of those years he would be expected to be capable of work. For a woman, the corresponding numbers are 33.6 and 23.9. The remaining years are expected to be life in the community with some work-limiting disability, with only about half a year in an institution.Footnote 14
How have these expectations changed since 2006? Men (women) have gained 1.2 (1.0) years of total life expectancy over the time period. These years can be decomposed into 0.5 (0.6) years of work-capable life, 0.7 (0.7) years of life in the community with a disability, and slight declines in years of life in an institution (primarily among women, who have seen a decline of 0.23 years of expected life in this state). Thus, every year of added life is approximately evenly divided between work-capable and work-incapable.Footnote 15
This pattern is very different from trends in the preceding period, from 2000 to 2006. In the earlier period, total life expectancy rose more in six years than it did in the 12 years between 2006 and 2018. The difference in the evolution of disability-free life expectancy is even more stark: between 2000 and 2006, expected years with a disability rose only by about one quarter of a year compared with 1.5 years of total life, unlike the latter period where over half of additional years of expected life were years with a disability.
The absolute numbers in Tables 1 and 2 may seem encouraging. While only about half of the additional year of life gained since 2006 is time that can be used for work, even this slow progress still means that the average person can work until their early 70s. However, the average does not tell the full story: certain groups have made more progress than others, and even within groups a substantial share of individuals may not be able to work as long as the average group member. The next section explores heterogeneity in working life expectancy to get at these disparities.
4. Heterogeneity in working life expectancy
Appendix Tables A7 and A8 show the percentage of the non-institutionalized population with a work-limiting disability for each demographic group at ages 50–64. Disability rates have increased for every gender, race, and education group over the sample period.Footnote 16 Disability rates will be joined with mortality estimates to form working life expectancy.
The analysis now turns to estimating total life expectancy for each demographic group. The top panels of Tables 3 and 4 show, for men and women at age 50, the number of years an individual of each race-education group can expect to live. All of the groups experienced gains in life expectancy between 2006 and 2018. These gains ranged from small (low-education White women and men gained only about half a year) to large (Black men with high education and Black women with low education had gains of over two years).Footnote 17
Total life expectancy and working life expectancy for males at age 50, by education and race
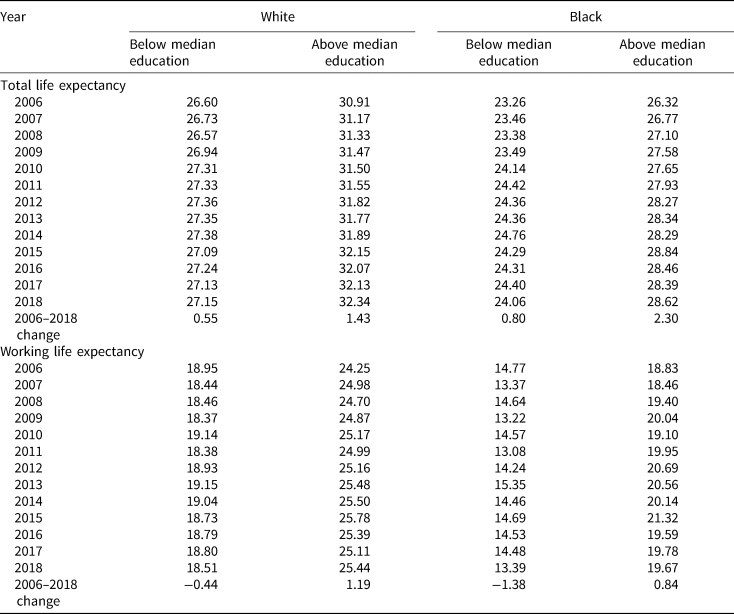
Sources: Authors' calculations using NHIS (2000–2018); ACS (2000–2018); and NVSS (2000–2018).
Total life expectancy and working life expectancy for females at age 50, by education and race
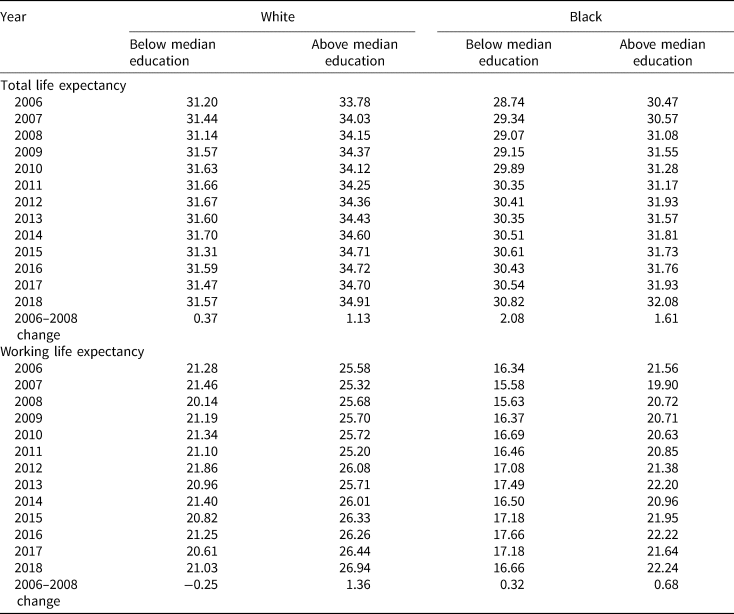
Sources: Authors' calculations using NHIS (2000–2018); ACS (2000–2018); and NVSS (2000–2018).
The modest gains by low-education whites are emblematic of the opioid epidemic, and ‘deaths of despair’ more generally, which have been particularly devastating among low-SES Whites. In contrast, high-education Whites experienced more robust gains in life expectancy over the analysis period. The lack of systematic patterns by SES among Black individuals echoes similarly disparate results in other recent work (Leive and Ruhm, Reference Leive and Ruhm2021; Wettstein et al., Reference Wettstein, Munnell, Hou and Gok2021).
In contrast to total life expectancy, where all groups saw at least nominal improvement over the past two decades, working life expectancy displays qualitative differences across groups.Footnote 18 The bottom panels of Tables 3 and 4 show the additional years of working life that individuals of each demographic group can expect at each year between 2006 and 2018. Examining the differences between 2006 and 2018 gives a sense of these disparities, with high-education White women gaining 1.4 years of expected work capacity, while Black men with low education had 1.4 fewer years of expected work capacity at the end of the period than at the beginning.
Just looking at the change between 2006 and 2018 is noisy, especially for Black groups due to small sample sizes. Hence, Figure 1 shows the average annual change in working life expectancy over the analysis period for each group. This average is calculated using an OLS regression with a linear term in year, with each year-demographic group considered as a single observation. The calculation does not account for the fact that each such working life expectancy estimate is itself an estimate. With this caveat, the simple average improvement is highly statistically significant for all the high-education groups, besides Black men for whom the change is marginally significant (p < 0.08). The positive slope for low-education Black women is also highly significant (p < 0.001).
Average annual change in working life expectancy between 2006 and 2018 by demographic group. Sources: Authors' calculations using NHIS (2000–2018); ACS (2000–2018); and NVSS (2000–2018).
Note: Solid bars are significantly different from 0 at the 10-percent level.

A stark divide is apparent: Both high-education Black and White individuals experienced an increase of about 0.1 years of working life expectancy per year on average. A similar improvement was seen for Black women with low education. However, the other low-education groups saw no annual improvement, on average, in working life expectancy.
The lack of growth in working life expectancy for most low-education groups means that, even as their total life expectancy has improved, their ability to work longer has not. In particular, low-education Black men begin and end the period with roughly the same low working life expectancy at age 50; the average member of this group will not be able to work past age 63. This lack of progress is, in fact, a step back in terms of retirement security, since the inability to work to a later age is now accompanied by a need to finance a longer retirement.
4.1 Simulating how long different individuals can work
To more fully explore how long different types of people can work, the analysis uses the estimated life, institutionalization, and work-limiting disability tables to track how ability to work declines with age using the most recent data, from 2018. Figures 2a and 2b show the estimated share of individuals in each group who will be unable to work to each age. The figure is generated by simulating the experience of 100,000 individuals of each demographic group who are capable of work at age 50. As these simulated individuals age, more and more of them die, enter institutions, or develop work-limiting disabilities.Footnote 19
(a) Fraction of men capable of work at age 50 who can still work at future ages, by race and SES. Sources: Authors' calculations using NHIS (2000–2018); ACS (2000–2018); and NVSS (2000–2018). (b) Fraction of women capable of work at age 50 who can still work at future ages, by race and SES. Sources: Authors' calculations using NHIS (2000–2018); ACS (2000–2018); and NVSS (2000–2018).
Note: Based on 100,000 simulations for each group.

The patterns of decline in work capability are starkly different across demographic groups, consistent with the estimates in Tables 3 and 4. For example, of those capable of work at age 50, fully 81 percent of high-education white men will still be capable of work at age 70, the latest age for claiming Social Security. In contrast, only 19 percent of low-education Black men will have that capability.
The analysis above begs the question: if individuals are expected to work longer, how many of them will be unequal to the task? For example, the raising of the Social Security Full Retirement Age from 65 to 67 implied no loss of monthly benefits – for those who could postpone claiming by two years. What share of people in each demographic group would be able to postpone retirement by two years from age 62, the Early Eligibility Age?
To answer this question, the analysis builds on the estimated probabilities of mortality, institutionalization, and work-limiting disability at each age after age 50 in 2018. Using the same simulation approach described to generate Figures 2a and 2b, the analysis takes an individual at age 62 and calculates the probability that they will still be capable of work by age 64. Figure 3a shows the result of this exercise. Unsurprisingly, in the general population, only 7 percent of men and 4 percent of women would be forced to drop out of the labor force by death, institutionalization, or disability by age 64. However, the picture is much less rosy when considering those with low education and Black individuals. Among those with low education, over 10 percent of each group would be unable to work even to age 64 (except for low-education White women for whom the share is 7 percent). Similarly, among Black individuals, the different gender and education groups have a greater than 10 percent chance of being unable to work until 64, except for high-education Black women (for whom the share is 6 percent).
(a) Percentage of individuals capable of work at age 62 who will not be capable by age 64, by demographic group. Source: Authors' calculations. (b) Percentage of individuals capable of work at age 62 who will not be capable by age 67, by demographic group. Source: Authors' calculations. (c) Percentage of individuals capable of work at age 62 who will not be capable by age 70, by demographic group. Source: Authors' calculations.
Note: Based on 100,000 simulations for each group.

The intersection of the two most disadvantaged groups is, unsurprisingly, the least likely to be capable of working to age 64. Sixteen percent of low-education Black women capable of work at age 62 will no longer be able to work by age 64. For low-education Black men, almost a quarter of those capable of work at 62 will no longer be capable two years later.Footnote 20 Thus substantial shares of the Black population, particularly men, cannot be expected to work much later than age 62.
Looking beyond age 64, outcomes continue to look grim for Black and low-education groups – particularly low-education Black individuals. Figure 3b shows that around a quarter of low-education White men who can work at 62 will not be capable of working to the Full Retirement Age (FRA) of 67. A similar share of high-education Black men will be in the same predicament. Strikingly, more than half of low-education Black men capable of work at age 62 will prove incapable of working to the FRA. When it comes to working until the maximal claiming age of 70, Figure 3c shows that only high-education Whites will not experience rates of inability to work in excess of 20 percent. Among all other groups of both genders, of those who can work at age 62, more than a quarter will not be able to work until age 70. For low-education Black men, this share exceeds three quarters.
5. Conclusion
Both life expectancy and expected years of disability-free life had been trending up in the United States for decades until 2010. The resulting need to fund a longer retirement was met by calls to work longer, and the expanding capacity to work longer justified those calls. However, in the last fifteen years, slowing declines in mortality have coincided with negative health trends, raising the possibility of even slower growth in working life expectancy, relative to survival, over the same period. A crucial question, then, is whether working longer is even possible for many people?
To answer that question, policymakers need to know whether individuals are physically capable of working: are they alive, in the community, and not encumbered by work-limiting disabilities? The analysis presented here shows that improvement in life expectancy has moderated since 2006, while improvement in working life expectancy has slowed even more, such that every year of life expectancy gained is associated with only about half a year of work capacity.
Notably, the analysis does not include the COVID-19 pandemic. While the pandemic has been devastating for U.S. life expectancy (Andrasfey and Goldman, Reference Andrasfey and Goldman2021), at least on the disability front evidence is more mixed. Owen et al. (Reference Owen, Quinby, Rutledge and Wettsteinforthcoming) and Goda et al. (Reference Goda, Jackson, Nicholas and Stith2022) both find evidence of reduction in Social Security Disability Insurance (SSDI) during the pandemic with possible reasons ranging from the negative (extended Social Security office closures) to the positive (more flexible work-from-home policy being a helpful accommodation for some people with disabilities). In total, because of these conflicting patterns it is unclear how the pandemic might influence working life expectancy trends going forward.
When looking across demographic groups, the picture is more concerning. The population-level gain, however modest, is driven almost entirely by high-education groups (although low-education Black women have seen similar growth, albeit starting from a lower level and remaining lower than low-education White women). As a result, a large share of those with less than median education will not be able to work even two years beyond the early eligibility age for Social Security, even if they managed to work to 62. This problem is particularly acute among low-education Black men, who had very low working life expectancies in 2006 and experienced no improvement in the past fifteen years. A majority of this group will be incapable of working to the FRA.
It is worth considering the role that SSDI plays in permitting those with severe health limitations to cease working. SSDI provides insurance against loss of earning capacity, which is particularly important for low-earners who are more likely to suffer disabling conditions and for whom SSDI provides higher replacement rates. This insurance helps those who should work longer but cannot because of health impairment. Nevertheless, the call to work longer is broad, and policymakers have long called for DI rolls to be reduced, in part by a return to work of current SSDI beneficiaries.Footnote 21
In thinking of solutions for inadequate retirement savings, working longer may be a fine response for those with more education, but Black and low-education individuals, who are the least likely to have sufficient savings, are also the least well-positioned to work longer.Footnote 22 They would also be the groups most vulnerable to further increases in Social Security's eligibility age thresholds. New solutions for these groups need to account for their high probability of not being physically capable of extending their working lives.
Acknowledgements
The research reported herein was pursuant to a grant from the U.S. Social Security Administration (SSA) funded as part of the Retirement and Disability Research Consortium. The findings and conclusions expressed are solely those of the authors and do not represent the views of SSA, any agency of the federal government, or Boston College. Neither the United States Government nor any agency thereof, nor any of their employees, makes any warranty, express or implied, or assumes any legal liability or responsibility for the accuracy, completeness, or usefulness of the contents of this report. Reference herein to any specific commercial product, process or service by trade name, trademark, manufacturer, or otherwise does not necessarily constitute or imply endorsement, recommendation or favoring by the United States Government or any agency thereof.
Appendix
Appendix Tables A1–A13.
Period and cohort life expectancy at age 50 for males, 2006–2018

Period and cohort life expectancy at age 50 for females, 2006–2018

Percentage of male population institutionalized
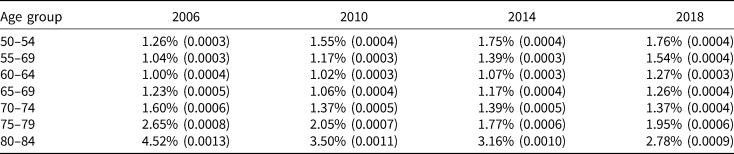
Percentage of female population institutionalized

Percentage of non-institutionalized male population with limitation of activity

Percentage of non-institutionalized female population with limitation of activity

Percentage of the non-institutionalized male population ages 50–64 with limitation of activity, by race and education group

Percentage of the non-institutionalized female population ages 50–64 with limitation of activity, by race and education group

Average age of respondents age 50–64 in various NHIS rounds, by gender

Expectations at age 50 of years spent in various states of health for males

Expectations at age 50 of years spent in various states of health for females

Total life expectancy and working life expectancy for males at age 50, by education and race

Total life expectancy and working life expectancy for females at age 50, by education and race


 Open access

