

INTRODUCTION
Haemorrhagic fever with renal syndrome (HFRS), with characteristics of fever, haemorrhage, kidney damage and hypotension, is an important infectious disease caused by different species of hantaviruses. In hantavirus-endemic areas, HFRS outbreaks have occurred in farmers and others who have close contact with excreta of infected rodents [Reference Vapalahti1, Reference Glass2]. In China, HFRS is caused mainly by two types of hantaviruses, Hantaan virus (HTNV) and Seoul virus (SEOV), each of which has co-evolved with a distinct rodent host. HTNV is associated with Apodemus agrarius, whereas SEOV, which causes a less severe form of HFRS, is associated with Rattus norvegicus [Reference Fang3]. HFRS has been recognized as a notable public health problem in China [Reference Zhang4]. It is considered that the number of HFRS cases in China accounts for 90% of the total cases worldwide [Reference Ulrich5, Reference Simmons and Riley6]. At present, HFRS is endemic in most provinces, autonomous regions, and metropolitan areas in mainland China [Reference Yan7]. Although some prevention and control measures such as scientific rodent control, vaccination and environment management have been performed, HFRS remains a serious public health problem with about 20 000–50 000 human cases annually in mainland China [Reference Fang8].
The Chinese Center for Disease Control and Prevention (CDC) established the National Notifiable Disease Surveillance System in 2004. HFRS is one of the diseases that is under surveillance and reported in this system, which makes the surveillance data for HFRS more accurate and comprehensive. To the best of our knowledge, there has been no specific study on epidemiological features of HFRS in China since 2004. A better understanding of the spatial distribution patterns and social demographic distribution characteristics and future changing trend of HFRS would help to identify areas and populations at high risk and might better prevent and control HFRS. Spatial analyses are commonly used to characterize spatial patterns of disease [Reference Frank9, Reference Odoi10]. Since the early 1970s, time-series methods, in particular seasonal autoregressive integrated moving average (SARIMA) models, which have the ability to cope with stochastic dependence of consecutive data, have become well established for infectious diseases [Reference Bowie and Prothero11–Reference Luz16].
In this study, we aimed to establish the current situation of endemic HFRS in China, and characterize its spatio-temporal distribution and demographic distribution characteristics. Furthermore, we used SARIMA models to monitor and predict HFRS incidence in mainland China.
MATERIALS AND METHODS
Data collection and management
The data on reported HFRS cases and monthly and annual HFRS incidence of in China from 2004 to 2009 were obtained from the National Notifiable Disease Surveillance System, including information about sex, age and occupation for each case. HFRS cases were first diagnosed using clinical symptoms, blood samples were collected in the hospitals, serological identification was performed at the laboratory of each Provincial CDC to confirm the clinical diagnosis, and the data were collected by case number according to the sampling results. There might have been admission rate bias in the disease report, but this was reduced as much as possible.
Geographical information system (GIS) mapping for incidence of HFRS
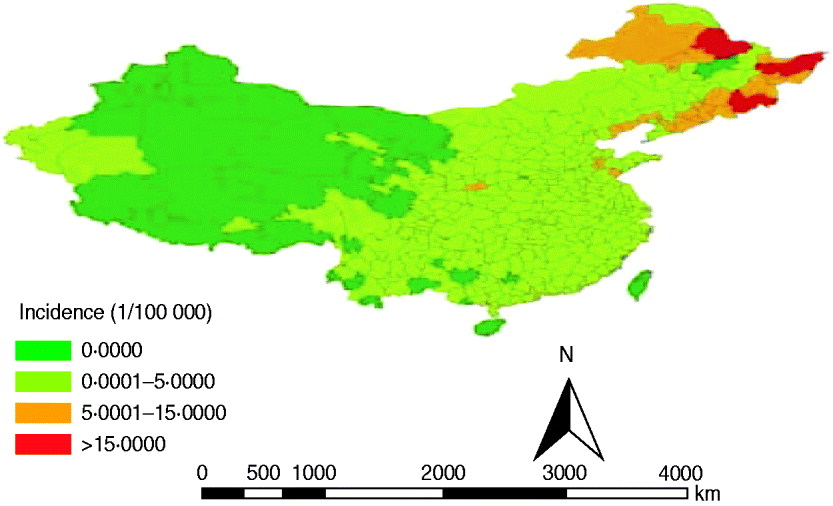
To conduct a GIS-based analysis of the spatial distribution of HFRS, a prefecture-level polygon map at 1:1000 000 scale was obtained, on which the prefecture-level point layer that contained information regarding latitudes and longitudes of central points of each prefecture was created. To alleviate variations in incidence in small populations and areas, the annualized average incidence of HFRS/100 000 persons at each prefecture-level city over the 6-year period was calculated. The annualized average incidence of HFRS for each city was mapped by using a GIS technique in ArcGIS 9.3 software (ESRI Inc., USA). Based on annualized average incidence, all cities were grouped into four categories: non-endemic areas; low endemic areas with an annual average incidence between 0 and 5/100 000 persons; medium endemic areas with an incidence between 5 and 15/100 000; and high endemic areas with an incidence >15/100 000. The four types of categories were colour-coded on the maps.
Temporal distribution analyses
The monthly HFRS incidence in China from 2004 to 2009 was calculated and plotted to observe seasonal fluctuation.
Demographic distribution analyses
According to surveillance data, we analysed the demographic distribution characteristics including age, sex and occupation distribution of HFRS cases from 2004 to 2009 in mainland China.
Time-series analysis
We conducted a univariate SARIMA model for monthly HFRS incidence in China from 2004 to 2009. The Box–Jenkins modelling strategy was useful for constructing SARIMA models for vector-borne diseases, because it is a powerful tool for interpreting and applying surveillance data in disease control, prevention, and forecast; it has the capacity to analyse a long series of data in a stationary mode [Reference Allard13]. Thus, we used the Box–Jenkins strategy to construct models. The modelling of SARIMA involved three stages: identification, estimation, and diagnosis. In the identification stage, we determined the need for differencing the monthly HFRS incidence by checking stationarity (i.e. trends in the mean and variance) and the order of both the seasonal and non-seasonal autoregressive and moving average indicators, by using an autocorrelation function and a partial autocorrelation function [Reference Hipel17].
At the estimation stage, we developed SARIMA models using seasonally differenced monthly HFRS incidence. The following parameters were selected when fitting the SARIMA model: p, order of autoregression; d, degree of difference; q, order of moving average; P, seasonal autoregression; D, seasonal integration, Q, seasonal moving average. Hence, the model used in this study was SARIMA(p,d,q)(P,D,Q)s (where s is the length of the seasonal period). Our main criterion for judging a model against other models was based on the lowest value in Akaike's Information Criterion (AIC) [Reference Akaike18]. At the diagnosis stage, the goodness-of-fit of the models was determined for appropriate modelling, using both time-series (e.g. autocorrelation and partial autocorrelation function of residuals) and classic tools (e.g. checking the independence of the residuals).
Finally, we applied the model to forecast the monthly HFRS incidence between January and December 2010. A plot for actual and predicted values was used to show the model agreement. In addition, the predictive validity of the model was evaluated by using the root-mean-square-error (RMSE) criterion
![{\rm RMSE} \equals \left[ {\sum\limits_{t \equals \setnum{1}}^{n} {\lpar x_{t} \minus \mathord{\buildrel{\lower3pt\hbox{$\scriptscriptstyle\frown$}}\over x} _{t} \rpar ^{\setnum{2}} \sol n} } \right]^{\frac{1}{2}} \comma](https://static.cambridge.org/binary/version/id/urn:cambridge.org:id:binary:20160921000909189-0591:S0950268811001063:S0950268811001063_eqnU1.gif?pub-status=live)
where x t is the observed values and ![]() is the predicted values for month t; n is the number of observations) [Reference Makridakes19]. The smaller the RMSE is, the better the model for forecasting. All analyses were performed using SAS version 9.1 (SAS Institute Inc., USA) with a significance level of P<0·05.
is the predicted values for month t; n is the number of observations) [Reference Makridakes19]. The smaller the RMSE is, the better the model for forecasting. All analyses were performed using SAS version 9.1 (SAS Institute Inc., USA) with a significance level of P<0·05.
RESULTS
Spatio-temporal analyses
A total of 91 479 HFRS cases were reported in mainland China during 2004–2009. Annualized average incidence at the prefecture level ranged from 0 to 28·6054/100 000 persons. Of a total of 349 cities, 50 were non-endemic, 274 were low-endemic, 21 were medium-endemic, and four were high-endemic (Fig. 1). The annual incidence sharply decreased from 2004 to 2009. Within each year, the incidence varied markedly; most cases occurred in winter and spring, and usually peaked in May and November, although the disease was reported in each month (Fig. 2a).
Annualized average incidence of haemorrhagic fever with renal syndrome (HFRS) at the prefecture level in mainland China, 2004–2009. The prefecture-level cities are colour-coded according to HFRS incidence. The highest HFRS incidence was mainly distributed in the southeastern cities in mainland China.
(a) Temporal distribution of haemorrhagic fever with renal syndrome (HFRS) in China, 2004–2009. Most cases occurred in winter and spring, and usually peaked in May and November. (b) The transformed series taking 1-order trend difference and 1-order seasonal difference. The transformed series showed far less dispersion than original series.
Demographic distribution analyses
About 75% of HFRS patients were male. HFRS cases were mainly concentrated in adults aged 30–50 years, which accounted for >61% of cases (Fig. 3 a). Regarding occupation, >70% of HFRS patients were farmers, followed by workers (mainly forestry workers, road builders, miners) which accounted for about 10% (Fig. 3 b).
Demographic distribution of haemorrhagic fever with renal syndrome (HFRS) cases in mainland China, 2004–2009. (a) Age and sex distribution of HFRS cases. (b) Occupation distribution of reported HFRS patients, 2004–2009. About 75% of HFRS patients were male. HFRS cases were mainly concentrated in adults aged 30–50 years, which accounted for >61%. In terms of occupation, >70% of HFRS patients were farmers, followed by workers (about 10%).
SARIMA models
We found it necessary to stabilize the variance of HFRS incidence by taking 1-order trend difference and 1-order seasonal difference. The transformed series showed far less dispersion than original series (Fig. 2 b). We calculated a series of models with different order of p,q and P,Q. Of all the models tested, the SARIMA(0,1,1)(0,1,1)12 model was found to best fit the data (AIC value −297·195) (Table 1). The goodness-of-fit analysis showed that there was no significant autocorrelation between residuals at different lags in the SARIMA(0,1,1)(0,1,1)12 model (Fig. 4), and the model fitted the data reasonably well (Fig. 5 a). The results of the validation analysis showed that the parsimonious model SARIMA(0,1,1)(0,1,1)12 was appropriate for forecasting epidemics of HFRS, because the RMSE was small (0·0133). In addition, Figure 5 b shows that the predicted values match the actual values well.
(a) Autocorrelation and (b) partial autocorrelation functions of the residuals of the SARIMA(0,1,1)(0,1,1)12 model. Dotted line indicates 95% confidence intervals.
Fitted, predicted and actual incidence of haemorrhagic fever with renal syndrome (HFRS) in mainland China, 2004–2010. (a) Notified incidence vs. model fitted incidence of HFRS in mainland China, 2004–2009. Black solid line: actual HFRS incidence; grey solid line: SARIMA(0,1,1)(0,1,1)12 model fitted curve (2004–2009); dashed lines: 95% confidence intervals of fitted values. (b) Validation model for the period 1 January to 31 December 2010, with the HFRS incidence (1/100 000). Solid symbols (•): observed values of HFRS incidence in mainland China, 2010; open symbols (○): SARIMA(0,1,1)(0,1,1)12 model predicted values of HFRS incidence in 2010.
Coefficients of the SARIMA on the monthly incidence of HFRS in mainland China, 2004–2009

AIC=−297·195.
DISCUSSION
In this study, we analysed the transmission dynamics of HFRS in mainland China during 2004–2009. To the best of our knowledge, this is the first population study of HFRS at such spatial resolution. Since 2004, the high-endemic HFRS areas have been mainly restricted to three provinces: Heilongjiang, Jilin and Liaoning, which is consistent with previous studies [Reference Wang20, Reference Wang21]. The main change compared with the spatial distribution of HFRS before 2004 is that the number of cases in Shandong and Shannxi provinces was significantly reduced. The dynamic change in spatial distribution confirmed the focal nature of HFRS [Reference Fang3]. Efficient allocation of health resources for HFRS control using appropriate combination of interventions requires accurate information on its geographical distribution. The results of this study can make the allocation of health resources more rational and the control of HFRS more targeted. The decrease in HFRS incidence is mainly due to effective control measures, such as deratization, good vaccination coverage, effective surveillance, and environmental improvements [Reference Yan22, Reference Guo and Gao23]. On the contrary, a new natural focus mainly located in Inner Mongolia Autonomous Region has been emerging [Reference Wang20], which may be correlated with rodent density, species and infection rate.
The demographic distribution pattern is particularly evident in men but not obvious in women. Part of this pattern may be attributed to the larger number of exposure opportunities of adults and men to rodents. In addition, population movement, such as travellers and labourers moving from low- to high-transmission areas could partly explain the predominance of young adult and male cases. The predominance of cases in farmers is mainly due to the nature of their work in the fields, which increases their risk of exposure to rodents. Farmers have been reported to be more exposed to HTNV in China than previously [Reference Xu24].
Epidemiological surveillance of communicable diseases is one of the most traditional health-related activities. Time-series analysis of incidence of various infections is extremely useful in developing hypotheses to explain and anticipate the dynamics of the observed phenomena and subsequently in the establishment of a quality control system and reallocation of resources [Reference Kuhn25]. The SARIMA model has its advantages in time-series analyses. The secular trend, seasonal variation, and autocorrelation could all be easily controlled by difference, autoregression, moving average, and seasonal functions without performing complicated transformations or using extra surrogate variables [Reference Shumway and Stoffer26]. According to the above results, our model was reliable with high validity, which indicates that it could be an appropriate statistical model to quantify the future changing trends in HFRS. Previous studies have used other models to fit and predict HFRS prevalence trends, such as the grey swing model [Reference Guo27], and back propagation artificial neural network model [Reference Wu28]. Each model had its own advantages and disadvantages, so it was very important to choose the most suitable model according to the available data.
This study provides valuable information on the geographical distribution, time trends and demographic patterns of HFRS in mainland China. Our findings indicate that highly refined spatial and temporal epidemiological data of HFRS are needed to increase our understanding of the dynamics of this disease in China, and to generate new hypotheses and provide a platform for testing innovative control policies. In the meantime, further epidemiological and ecological studies are required to understand the exact mechanisms influencing variables, including biological, ecological and social factors, in HFRS.
ACKNOWLEDGEMENTS
This study was supported by the Social Welfare Research Special Programme of the Ministry of Science and Technology, China (2003DIA6N009) and Special Infectious Diseases Programme of the Ministry of Science & Technology, China (grant no. 2008ZX10004-010). We thank Miss Fei Zhang for her valuable assistance in revising and editing the manuscript.
DECLARATION OF INTEREST
None.


