

Political scientists use a wide range of statistical models
 $y_{i}\sim f(\unicode[STIX]{x1D703}_{i})$
, where
$y_{i}\sim f(\unicode[STIX]{x1D703}_{i})$
, where
 $i\in \{1,\ldots ,N\}$
and
$i\in \{1,\ldots ,N\}$
and
 $f$
represents a probability distribution. The parameter
$f$
represents a probability distribution. The parameter
 $\unicode[STIX]{x1D703}_{i}$
is connected to a design matrix
$\unicode[STIX]{x1D703}_{i}$
is connected to a design matrix
 $X$
of
$X$
of
 $k$
explanatory variables and a column of ones by a link function
$k$
explanatory variables and a column of ones by a link function
 $g$
, so that
$g$
, so that
 $g(\unicode[STIX]{x1D703}_{i})=X_{i}\unicode[STIX]{x1D6FD}$
. In the binary logit, for example,
$g(\unicode[STIX]{x1D703}_{i})=X_{i}\unicode[STIX]{x1D6FD}$
. In the binary logit, for example,
 $f$
represents the Bernoulli probability mass function and
$f$
represents the Bernoulli probability mass function and
 $g$
represents the logit function, so that
$g$
represents the logit function, so that
 $y_{i}\sim \text{Bernoulli}(\unicode[STIX]{x1D70B}_{i})$
and
$y_{i}\sim \text{Bernoulli}(\unicode[STIX]{x1D70B}_{i})$
and
 $\unicode[STIX]{x1D70B}_{i}=\text{logit}^{-1}(X_{i}\unicode[STIX]{x1D6FD})$
.
$\unicode[STIX]{x1D70B}_{i}=\text{logit}^{-1}(X_{i}\unicode[STIX]{x1D6FD})$
.
The researcher usually estimates
 $\unicode[STIX]{x1D6FD}$
with maximum likelihood (ML), and, depending on the choice of
$\unicode[STIX]{x1D6FD}$
with maximum likelihood (ML), and, depending on the choice of
 $g$
and
$g$
and
 $f$
, the estimate
$f$
, the estimate
 $\hat{\unicode[STIX]{x1D6FD}}$
might have desirable small-sample properties. However, ML does not produce unbiased estimates in general. For this reason, methodologists frequently use Monte Carlo simulations to assess the small-sample properties of estimators and provide users with rules of thumb about appropriate sample sizes. For example, the ML estimates of
$\hat{\unicode[STIX]{x1D6FD}}$
might have desirable small-sample properties. However, ML does not produce unbiased estimates in general. For this reason, methodologists frequently use Monte Carlo simulations to assess the small-sample properties of estimators and provide users with rules of thumb about appropriate sample sizes. For example, the ML estimates of
 $\unicode[STIX]{x1D6FD}$
for the binary logit are biased away from zero, leading Long (Reference Long1997, p. 54) to suggest that “it is risky to use ML with samples smaller than 100, while samples larger than 500 seem adequate.”
$\unicode[STIX]{x1D6FD}$
for the binary logit are biased away from zero, leading Long (Reference Long1997, p. 54) to suggest that “it is risky to use ML with samples smaller than 100, while samples larger than 500 seem adequate.”
Although methodologists tend to focus on estimating model coefficients, substantive researchers tend to focus on some other quantity of interest. A quantity of interest is simply a transformation
 $\unicode[STIX]{x1D70F}$
of the model coefficients. Examples include marginal effects, first and second differences, predicted probabilities and expected values, and risk ratios (King, Tomz, and Wittenberg Reference King, Tomz and Wittenberg2000).
$\unicode[STIX]{x1D70F}$
of the model coefficients. Examples include marginal effects, first and second differences, predicted probabilities and expected values, and risk ratios (King, Tomz, and Wittenberg Reference King, Tomz and Wittenberg2000).
Fortunately, the invariance principle allows the researcher to calculate estimates of the quantities of interest from the coefficient estimates in a principled manner. The invariance principle states that if
 $\hat{\unicode[STIX]{x1D6FD}}$
is the ML estimate of
$\hat{\unicode[STIX]{x1D6FD}}$
is the ML estimate of
 $\unicode[STIX]{x1D6FD}$
, then for any function
$\unicode[STIX]{x1D6FD}$
, then for any function
 $\unicode[STIX]{x1D70F}$
, the ML estimate of
$\unicode[STIX]{x1D70F}$
, the ML estimate of
 $\unicode[STIX]{x1D70F}(\unicode[STIX]{x1D6FD})$
is
$\unicode[STIX]{x1D70F}(\unicode[STIX]{x1D6FD})$
is
 $\unicode[STIX]{x1D70F}(\hat{\unicode[STIX]{x1D6FD}})$
(King Reference King1998, pp. 75–76, and Casella and Berger Reference Casella and Berger2002, pp. 320–321). That is, researchers can simply transform the ML estimates of the model coefficients to obtain an ML estimate of the quantity of interest. Of course, if
$\unicode[STIX]{x1D70F}(\hat{\unicode[STIX]{x1D6FD}})$
(King Reference King1998, pp. 75–76, and Casella and Berger Reference Casella and Berger2002, pp. 320–321). That is, researchers can simply transform the ML estimates of the model coefficients to obtain an ML estimate of the quantity of interest. Of course, if
 $\hat{\unicode[STIX]{x1D6FD}}$
is a consistent estimator of
$\hat{\unicode[STIX]{x1D6FD}}$
is a consistent estimator of
 $\unicode[STIX]{x1D6FD}$
, then
$\unicode[STIX]{x1D6FD}$
, then
 $\unicode[STIX]{x1D70F}(\hat{\unicode[STIX]{x1D6FD}})$
must be a consistent estimator of
$\unicode[STIX]{x1D70F}(\hat{\unicode[STIX]{x1D6FD}})$
must be a consistent estimator of
 $\unicode[STIX]{x1D70F}(\unicode[STIX]{x1D6FD})$
. But the invariance principle raises an important question: Does
$\unicode[STIX]{x1D70F}(\unicode[STIX]{x1D6FD})$
. But the invariance principle raises an important question: Does
 $\unicode[STIX]{x1D70F}(\hat{\unicode[STIX]{x1D6FD}})$
inherit the small-sample properties of
$\unicode[STIX]{x1D70F}(\hat{\unicode[STIX]{x1D6FD}})$
inherit the small-sample properties of
 $\hat{\unicode[STIX]{x1D6FD}}$
, such as unbiasedness or approximate unbiasedness? The answer is no; the estimates of the quantities of interest do not inherit the small-sample properties of the coefficient estimates. For example, a sample size of
$\hat{\unicode[STIX]{x1D6FD}}$
, such as unbiasedness or approximate unbiasedness? The answer is no; the estimates of the quantities of interest do not inherit the small-sample properties of the coefficient estimates. For example, a sample size of
 $N=250$
that produces nearly unbiased coefficient estimates for a probit model can lead to bias in the marginal effect estimates of 25% or more.
$N=250$
that produces nearly unbiased coefficient estimates for a probit model can lead to bias in the marginal effect estimates of 25% or more.
As another example, methodologists often point out the optimal small-sample properties of least squares estimators under the normal-linear model. Indeed, under the normal-linear model, least squared estimators are the best unbiased estimator. However, many substantive researchers use a simple log-transformation, so that
 $\log (y)\sim N(X\unicode[STIX]{x1D6FD},\unicode[STIX]{x1D70E}^{2})$
. And while the coefficients retain their optimal properties, several substantively interesting functions of the coefficients, such as the expected value of
$\log (y)\sim N(X\unicode[STIX]{x1D6FD},\unicode[STIX]{x1D70E}^{2})$
. And while the coefficients retain their optimal properties, several substantively interesting functions of the coefficients, such as the expected value of
 $y$
, the expected change in
$y$
, the expected change in
 $y$
for a given change in
$y$
for a given change in
 $X$
, and the marginal effect of an explanatory variable on the expected value of
$X$
, and the marginal effect of an explanatory variable on the expected value of
 $y$
, do not inherit these properties.
$y$
, do not inherit these properties.
This subtle, yet crucial, point reveals a disconnect between the work done by substantive scholars and that done by methodologists. Methodological work tends to focus on obtaining excellent estimates of the model coefficients, while substantive research tends to focus on estimating quantities of interest.
Much methodological research implicitly suggests that an approximately unbiased coefficient estimate is necessary and/or sufficient for an approximately unbiased estimate of the quantity of interest. Classically, Nagler (Reference Nagler1994) uses Monte Carlo simulations to assess the small-sample properties of the scobit model coefficients, but he focuses on marginal effects and predicted probabilities in his illustrative application. Recently, Nieman (Reference Nieman2015) uses simulations to assess the small-sample properties of the coefficients in his strategic probit with partial observability, but he focuses his illustrative application on the predicted probability of civil war. In order to provide more compelling tools for substantive scholars, methodologists must extend their evaluations beyond coefficient estimates to the quantities that substantive researchers typically care about.
However, the quantities of interest and likely parameter values vary dramatically across substantive applications, making it difficult or impossible for methodologists to formulate general claims about the behavior of the estimators of potential quantities of interest. Therefore, substantive researchers must not shy away from studying the behavior of their chosen estimators in a particular application, especially given their deep knowledge of the underlying political processes, the appropriate quantities of interest, and the substantive importance of any biases. Particularly with small-sample sizes, large standard errors, and/or highly nonlinear transformations, substantive scholars should consider application-specific simulations to assess the potential for bias. Closing the gap between methodological and substantive research requires mindful methodological work from both methodologists and substantive scholars.
The Concepts
As a motivating example, consider the log-linear model
 $$\begin{eqnarray}\displaystyle \log (\text{income}_{i})=\unicode[STIX]{x1D6FD}_{\text{cons}}+\unicode[STIX]{x1D6FD}_{\text{edu}}\text{education}_{i}+\unicode[STIX]{x1D716}_{i}, & & \displaystyle \nonumber\end{eqnarray}$$
where
 $\unicode[STIX]{x1D716}_{i}\sim N(0,\unicode[STIX]{x1D70E}^{2})$
, education is measured in years, and income is measured in thousands of dollars. Assuming that the researcher uses the correct model, then least squares, which is also the ML estimator, provides the best unbiased estimator of the coefficients
$\unicode[STIX]{x1D716}_{i}\sim N(0,\unicode[STIX]{x1D70E}^{2})$
, education is measured in years, and income is measured in thousands of dollars. Assuming that the researcher uses the correct model, then least squares, which is also the ML estimator, provides the best unbiased estimator of the coefficients
 $\unicode[STIX]{x1D6FD}_{\text{cons}}$
and
$\unicode[STIX]{x1D6FD}_{\text{cons}}$
and
 $\unicode[STIX]{x1D6FD}_{\text{edu}}$
. However, the researcher is not likely interested in
$\unicode[STIX]{x1D6FD}_{\text{edu}}$
. However, the researcher is not likely interested in
 $\log (\text{income})$
, but in income itself. In particular, she might want to estimate the median income among those with 20 years of education
$\log (\text{income})$
, but in income itself. In particular, she might want to estimate the median income among those with 20 years of education
 $\text{med}(\text{income}\mid \text{education}=20)=e^{\unicode[STIX]{x1D6FD}_{\text{cons}}+20\unicode[STIX]{x1D6FD}_{\text{edu}}}$
. Because
$\text{med}(\text{income}\mid \text{education}=20)=e^{\unicode[STIX]{x1D6FD}_{\text{cons}}+20\unicode[STIX]{x1D6FD}_{\text{edu}}}$
. Because
 $\text{med}[\log (y)]=\log [\text{med}(y)]$
for a random variable
$\text{med}[\log (y)]=\log [\text{med}(y)]$
for a random variable
 $y$
, one might guess that unbiased estimates of
$y$
, one might guess that unbiased estimates of
 $\unicode[STIX]{x1D6FD}_{\text{cons}}$
and
$\unicode[STIX]{x1D6FD}_{\text{cons}}$
and
 $\unicode[STIX]{x1D6FD}_{\text{edu}}$
lead to unbiased estimates of
$\unicode[STIX]{x1D6FD}_{\text{edu}}$
lead to unbiased estimates of
 $\text{med}(\text{income}\mid \text{education}=20)$
, but that is not the case. If we suppose that
$\text{med}(\text{income}\mid \text{education}=20)$
, but that is not the case. If we suppose that
 $N=10$
,
$N=10$
,
 $\unicode[STIX]{x1D6FD}_{\text{cons}}=2.5$
,
$\unicode[STIX]{x1D6FD}_{\text{cons}}=2.5$
,
 $\unicode[STIX]{x1D6FD}_{\text{edu}}=0.1$
,
$\unicode[STIX]{x1D6FD}_{\text{edu}}=0.1$
,
 $\unicode[STIX]{x1D70E}^{2}=1$
, and education takes on integers roughly uniformly from 10 to 20, then
$\unicode[STIX]{x1D70E}^{2}=1$
, and education takes on integers roughly uniformly from 10 to 20, then
 $\unicode[STIX]{x1D70F}(\unicode[STIX]{x1D6FD}_{\text{cons}},\unicode[STIX]{x1D6FD}_{\text{edu}})=e^{\unicode[STIX]{x1D6FD}_{\text{cons}}+20\unicode[STIX]{x1D6FD}_{\text{edu}}}\approx \text{\$}90k$
. A simple Monte Carlo simulation, though, shows that although
$\unicode[STIX]{x1D70F}(\unicode[STIX]{x1D6FD}_{\text{cons}},\unicode[STIX]{x1D6FD}_{\text{edu}})=e^{\unicode[STIX]{x1D6FD}_{\text{cons}}+20\unicode[STIX]{x1D6FD}_{\text{edu}}}\approx \text{\$}90k$
. A simple Monte Carlo simulation, though, shows that although
 $\hat{\unicode[STIX]{x1D6FD}}_{\text{cons}}$
and
$\hat{\unicode[STIX]{x1D6FD}}_{\text{cons}}$
and
 $\hat{\unicode[STIX]{x1D6FD}}_{\text{edu}}$
are unbiased, the estimate of
$\hat{\unicode[STIX]{x1D6FD}}_{\text{edu}}$
are unbiased, the estimate of
 $\text{med}(\text{income}\mid \text{education}=20)$
is strongly biased upward, so that
$\text{med}(\text{income}\mid \text{education}=20)$
is strongly biased upward, so that
 $\text{E}[\unicode[STIX]{x1D70F}(\hat{\unicode[STIX]{x1D6FD}}_{\text{cons}},\hat{\unicode[STIX]{x1D6FD}}_{\text{edu}})]=\text{E}(e^{\hat{\unicode[STIX]{x1D6FD}}_{\text{cons}}+20\hat{\unicode[STIX]{x1D6FD}}_{\text{edu}}})\approx \text{\$}106k$
.
$\text{E}[\unicode[STIX]{x1D70F}(\hat{\unicode[STIX]{x1D6FD}}_{\text{cons}},\hat{\unicode[STIX]{x1D6FD}}_{\text{edu}})]=\text{E}(e^{\hat{\unicode[STIX]{x1D6FD}}_{\text{cons}}+20\hat{\unicode[STIX]{x1D6FD}}_{\text{edu}}})\approx \text{\$}106k$
.
A similar, but conceptually distinct issue arises when researchers want to calculate the mean from a log-linear model
 $\log (y)=X\unicode[STIX]{x1D6FD}+\unicode[STIX]{x1D716}$
. Many textbooks highlight that
$\log (y)=X\unicode[STIX]{x1D6FD}+\unicode[STIX]{x1D716}$
. Many textbooks highlight that
 $\text{E}[\log (y|X)]\neq \log [\text{E}(y|X)]$
, so that
$\text{E}[\log (y|X)]\neq \log [\text{E}(y|X)]$
, so that
 $\text{E}(y|X_{i})\neq e^{X_{i}\unicode[STIX]{x1D6FD}}$
(e.g., Wooldridge Reference Wooldridge2013, pp. 212-215). This inequality follows from a transformation of the random component of the model (i.e.,
$\text{E}(y|X_{i})\neq e^{X_{i}\unicode[STIX]{x1D6FD}}$
(e.g., Wooldridge Reference Wooldridge2013, pp. 212-215). This inequality follows from a transformation of the random component of the model (i.e.,
 $\unicode[STIX]{x1D716}_{i}$
). Even if the model coefficients
$\unicode[STIX]{x1D716}_{i}$
). Even if the model coefficients
 $\unicode[STIX]{x1D6FD}$
are known, then this inequality holds. But researchers can easily avoid this issue by using the correct transformation
$\unicode[STIX]{x1D6FD}$
are known, then this inequality holds. But researchers can easily avoid this issue by using the correct transformation
 $\text{E}(y|X_{i})=e^{X_{i}\unicode[STIX]{x1D6FD}+\frac{\unicode[STIX]{x1D70E}^{2}}{2}}$
. However, the bias that interests me flows from a transformation of the model coefficients—even if the researcher uses the correct transformation, then
$\text{E}(y|X_{i})=e^{X_{i}\unicode[STIX]{x1D6FD}+\frac{\unicode[STIX]{x1D70E}^{2}}{2}}$
. However, the bias that interests me flows from a transformation of the model coefficients—even if the researcher uses the correct transformation, then
 $\hat{\unicode[STIX]{x1D70F}}$
is biased.
$\hat{\unicode[STIX]{x1D70F}}$
is biased.
But how does a simple transformation of unbiased coefficient estimates induce a large bias in the estimate of the quantity of interest? We usually think about bias as occurring in the model coefficients
 $\unicode[STIX]{x1D6FD}$
, so that
$\unicode[STIX]{x1D6FD}$
, so that
 $$\begin{eqnarray}\displaystyle \text{coefficient bias}=\text{E}(\hat{\unicode[STIX]{x1D6FD}})-\unicode[STIX]{x1D6FD}. & & \displaystyle \nonumber\end{eqnarray}$$
But substantive researchers care mostly about bias in the quantities of interest. For convenience, I refer to the bias in the quantities of interest as
 $\unicode[STIX]{x1D70F}$
-bias, so that
$\unicode[STIX]{x1D70F}$
-bias, so that
 $$\begin{eqnarray}\displaystyle \unicode[STIX]{x1D70F}\text{-}\text{bias}=\text{E}[\unicode[STIX]{x1D70F}(\hat{\unicode[STIX]{x1D6FD}})]-\unicode[STIX]{x1D70F}(\unicode[STIX]{x1D6FD}). & & \displaystyle \nonumber\end{eqnarray}$$
 $\unicode[STIX]{x1D70F}$
-bias is more complex and subtle than biases in the coefficients. It can be rewritten and decomposed into two components: transformation-induced
$\unicode[STIX]{x1D70F}$
-bias is more complex and subtle than biases in the coefficients. It can be rewritten and decomposed into two components: transformation-induced
 $\unicode[STIX]{x1D70F}$
-bias and coefficient-induced
$\unicode[STIX]{x1D70F}$
-bias and coefficient-induced
 $\unicode[STIX]{x1D70F}$
-bias, so that
$\unicode[STIX]{x1D70F}$
-bias, so that
 $$\begin{eqnarray}\displaystyle \text{total}\;\unicode[STIX]{x1D70F}\text{-}\text{bias}=\underbrace{\text{E}[\unicode[STIX]{x1D70F}(\hat{\unicode[STIX]{x1D6FD}})]-\unicode[STIX]{x1D70F}[\text{E}(\hat{\unicode[STIX]{x1D6FD}})]}_{\text{transformation}\text{-}\text{induced}}+\overbrace{\unicode[STIX]{x1D70F}[\text{E}(\hat{\unicode[STIX]{x1D6FD}})]-\unicode[STIX]{x1D70F}(\unicode[STIX]{x1D6FD})}^{\text{coefficient}\text{-}\text{induced}}. & & \displaystyle \nonumber\end{eqnarray}$$
Any bias in the coefficients passes through to the quantities of interest in the sense that, if the coefficient estimates are biased, then the transformation of the true coefficient is not equal to the transformation of the average coefficient estimate, so that
 $$\begin{eqnarray}\text{coefficient}\text{-}\text{induced}\;\unicode[STIX]{x1D70F}\text{-}\text{bias}=\unicode[STIX]{x1D70F}[\text{E}(\hat{\unicode[STIX]{x1D6FD}})]-\unicode[STIX]{x1D70F}(\unicode[STIX]{x1D6FD}).\end{eqnarray}$$
But the transformation itself introduces bias as well, so that
 $$\begin{eqnarray}\text{transformation}\text{-}\text{induced}\;\unicode[STIX]{x1D70F}\text{-}\text{bias}=\text{E}[\unicode[STIX]{x1D70F}(\hat{\unicode[STIX]{x1D6FD}})]-\unicode[STIX]{x1D70F}[\text{E}(\hat{\unicode[STIX]{x1D6FD}})].\end{eqnarray}$$
Transformation-induced bias occurs because, in general,
 $h[\text{E}(y)]\neq \text{E}[h(y)]$
for an arbitrary random variable
$h[\text{E}(y)]\neq \text{E}[h(y)]$
for an arbitrary random variable
 $y$
and function
$y$
and function
 $h$
.
$h$
.
Little methodology research explicitly recognizes this transformation-induced
 $\unicode[STIX]{x1D70F}$
-bias and less fully appreciates its practical importance. Both methodologists and substantive researchers must become more conscientious of transformation-induced
$\unicode[STIX]{x1D70F}$
-bias and less fully appreciates its practical importance. Both methodologists and substantive researchers must become more conscientious of transformation-induced
 $\unicode[STIX]{x1D70F}$
-bias, which can be much larger than coefficient bias and disappear more slowly as the sample size increases.
$\unicode[STIX]{x1D70F}$
-bias, which can be much larger than coefficient bias and disappear more slowly as the sample size increases.
A Characterization
But how can we characterize the direction of this bias? For strictly convex and strictly concave transformations, Jensen’s inequality enables a straightforward characterization of the direction of the transformation-induced
 $\unicode[STIX]{x1D70F}$
-bias. This characterization also provides the key intuition for more complicated transformations.
$\unicode[STIX]{x1D70F}$
-bias. This characterization also provides the key intuition for more complicated transformations.
Theorem 1. Suppose a nondegenerate estimator
 $\hat{\unicode[STIX]{x1D6FD}}$
. Then any strictly convex (concave)
$\hat{\unicode[STIX]{x1D6FD}}$
. Then any strictly convex (concave)
 $\unicode[STIX]{x1D70F}$
creates upward (downward) transformation-induced
$\unicode[STIX]{x1D70F}$
creates upward (downward) transformation-induced
 $\unicode[STIX]{x1D70F}$
-bias.
$\unicode[STIX]{x1D70F}$
-bias.
Proof. The proof follows directly from Jensen’s inequality. Suppose that the nondegenerate sampling distribution of
 $\hat{\unicode[STIX]{x1D6FD}}$
is given by
$\hat{\unicode[STIX]{x1D6FD}}$
is given by
 $S_{\unicode[STIX]{x1D6FD}}(b)$
so that
$S_{\unicode[STIX]{x1D6FD}}(b)$
so that
 $\hat{\unicode[STIX]{x1D6FD}}\sim S_{\unicode[STIX]{x1D6FD}}(b)$
. Then
$\hat{\unicode[STIX]{x1D6FD}}\sim S_{\unicode[STIX]{x1D6FD}}(b)$
. Then
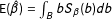 $\text{E}(\hat{\unicode[STIX]{x1D6FD}})=\int _{B}bS_{\unicode[STIX]{x1D6FD}}(b)db$
and
$\text{E}(\hat{\unicode[STIX]{x1D6FD}})=\int _{B}bS_{\unicode[STIX]{x1D6FD}}(b)db$
and
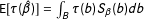 $\text{E}[\unicode[STIX]{x1D70F}(\hat{\unicode[STIX]{x1D6FD}})]=\int _{B}\unicode[STIX]{x1D70F}(b)S_{\unicode[STIX]{x1D6FD}}(b)db$
. Suppose first that
$\text{E}[\unicode[STIX]{x1D70F}(\hat{\unicode[STIX]{x1D6FD}})]=\int _{B}\unicode[STIX]{x1D70F}(b)S_{\unicode[STIX]{x1D6FD}}(b)db$
. Suppose first that
 $\unicode[STIX]{x1D70F}$
is convex. By Jensen’s inequality,
$\unicode[STIX]{x1D70F}$
is convex. By Jensen’s inequality,
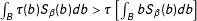 $\int _{B}\unicode[STIX]{x1D70F}(b)S_{\unicode[STIX]{x1D6FD}}(b)db>\unicode[STIX]{x1D70F}\left[\int _{B}bS_{\unicode[STIX]{x1D6FD}}(b)db\right]$
, which implies that
$\int _{B}\unicode[STIX]{x1D70F}(b)S_{\unicode[STIX]{x1D6FD}}(b)db>\unicode[STIX]{x1D70F}\left[\int _{B}bS_{\unicode[STIX]{x1D6FD}}(b)db\right]$
, which implies that
 $\text{E}[\unicode[STIX]{x1D70F}(\hat{\unicode[STIX]{x1D6FD}})]>\unicode[STIX]{x1D70F}[\text{E}(\hat{\unicode[STIX]{x1D6FD}})]$
. Because
$\text{E}[\unicode[STIX]{x1D70F}(\hat{\unicode[STIX]{x1D6FD}})]>\unicode[STIX]{x1D70F}[\text{E}(\hat{\unicode[STIX]{x1D6FD}})]$
. Because
 $\text{E}[\unicode[STIX]{x1D70F}(\hat{\unicode[STIX]{x1D6FD}})]-\unicode[STIX]{x1D70F}[\text{E}(\hat{\unicode[STIX]{x1D6FD}})]>0$
, the transformation-induced
$\text{E}[\unicode[STIX]{x1D70F}(\hat{\unicode[STIX]{x1D6FD}})]-\unicode[STIX]{x1D70F}[\text{E}(\hat{\unicode[STIX]{x1D6FD}})]>0$
, the transformation-induced
 $\unicode[STIX]{x1D70F}$
-bias is upward. By similar argument, one can show that for any strictly concave
$\unicode[STIX]{x1D70F}$
-bias is upward. By similar argument, one can show that for any strictly concave
 $\unicode[STIX]{x1D70F}$
,
$\unicode[STIX]{x1D70F}$
,
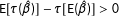 $\text{E}[\unicode[STIX]{x1D70F}(\hat{\unicode[STIX]{x1D6FD}})]-\unicode[STIX]{x1D70F}[\text{E}(\hat{\unicode[STIX]{x1D6FD}})]>0$
and that the transformation-induced
$\text{E}[\unicode[STIX]{x1D70F}(\hat{\unicode[STIX]{x1D6FD}})]-\unicode[STIX]{x1D70F}[\text{E}(\hat{\unicode[STIX]{x1D6FD}})]>0$
and that the transformation-induced
 $\unicode[STIX]{x1D70F}$
-bias is downward.
$\unicode[STIX]{x1D70F}$
-bias is downward.
 $\blacksquare$
In general, researchers do not restrict themselves to a strictly convex or strictly concave
 $\unicode[STIX]{x1D70F}$
. This situation is much more difficult to characterize generally because
$\unicode[STIX]{x1D70F}$
. This situation is much more difficult to characterize generally because
 $\unicode[STIX]{x1D70F}(b)$
might contain a mixture of convex and concave regions. For example, typical transformations of logistic regression coefficients, such as predicted probabilities, first and second differences, marginal effects, and risk ratios, all have both convex regions and concave regions. Making matters even more difficult, at any particular point
$\unicode[STIX]{x1D70F}(b)$
might contain a mixture of convex and concave regions. For example, typical transformations of logistic regression coefficients, such as predicted probabilities, first and second differences, marginal effects, and risk ratios, all have both convex regions and concave regions. Making matters even more difficult, at any particular point
 $b$
, the multivariate function
$b$
, the multivariate function
 $\unicode[STIX]{x1D70F}$
might be convex in one direction and concave in another. In general, though, the direction of the bias depends on the location of the sampling distribution. But the intuition from Theorem 1 is clear. If most of the sampling distribution is located in a mostly concave region, then the bias will be downward. If most of the sampling distribution is located in a mostly convex region, then the bias will be upward.Footnote
1
$\unicode[STIX]{x1D70F}$
might be convex in one direction and concave in another. In general, though, the direction of the bias depends on the location of the sampling distribution. But the intuition from Theorem 1 is clear. If most of the sampling distribution is located in a mostly concave region, then the bias will be downward. If most of the sampling distribution is located in a mostly convex region, then the bias will be upward.Footnote
1
An Approximation
While Theorem 1 cultivates an intuition about direction of the bias, how can we assess the magnitude of the transformation-induced
 $\unicode[STIX]{x1D70F}$
-bias? To approximate the magnitude, I use a second-order Taylor expansion. First, notice that
$\unicode[STIX]{x1D70F}$
-bias? To approximate the magnitude, I use a second-order Taylor expansion. First, notice that
 $\text{E}[\unicode[STIX]{x1D70F}(\hat{\unicode[STIX]{x1D6FD}})]=\text{E}[\unicode[STIX]{x1D70F}(\text{E}[\hat{\unicode[STIX]{x1D6FD}}]+(\hat{\unicode[STIX]{x1D6FD}}-\text{E}[\hat{\unicode[STIX]{x1D6FD}}]))]$
. Now approximate the term inside the right-hand expectation with a second-order Taylor expansion, so that
$\text{E}[\unicode[STIX]{x1D70F}(\hat{\unicode[STIX]{x1D6FD}})]=\text{E}[\unicode[STIX]{x1D70F}(\text{E}[\hat{\unicode[STIX]{x1D6FD}}]+(\hat{\unicode[STIX]{x1D6FD}}-\text{E}[\hat{\unicode[STIX]{x1D6FD}}]))]$
. Now approximate the term inside the right-hand expectation with a second-order Taylor expansion, so that
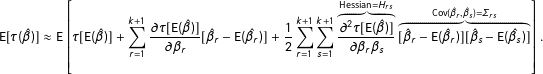 $$\begin{eqnarray}\displaystyle \text{E}[\unicode[STIX]{x1D70F}(\hat{\unicode[STIX]{x1D6FD}})]\approx \text{E}\left[\unicode[STIX]{x1D70F}[\text{E}(\hat{\unicode[STIX]{x1D6FD}})]+\mathop{\sum }_{r=1}^{k+1}{\displaystyle \frac{\unicode[STIX]{x2202}\unicode[STIX]{x1D70F}[\text{E}(\hat{\unicode[STIX]{x1D6FD}})]}{\unicode[STIX]{x2202}\unicode[STIX]{x1D6FD}_{r}}}[\hat{\unicode[STIX]{x1D6FD}}_{r}-\text{E}(\hat{\unicode[STIX]{x1D6FD}}_{r})]+{\displaystyle \frac{1}{2}}\mathop{\sum }_{r=1}^{k+1}\mathop{\sum }_{s=1}^{k+1}\overbrace{{\displaystyle \frac{\unicode[STIX]{x2202}^{2}\unicode[STIX]{x1D70F}[\text{E}(\hat{\unicode[STIX]{x1D6FD}})]}{\unicode[STIX]{x2202}\unicode[STIX]{x1D6FD}_{r}\unicode[STIX]{x1D6FD}_{s}}}}^{\text{Hessian}=H_{rs}}\overbrace{[\hat{\unicode[STIX]{x1D6FD}}_{r}-\text{E}(\hat{\unicode[STIX]{x1D6FD}}_{r})][\hat{\unicode[STIX]{x1D6FD}}_{s}-\text{E}(\hat{\unicode[STIX]{x1D6FD}}_{s})]}^{\text{Cov}(\hat{\unicode[STIX]{x1D6FD}}_{r},\hat{\unicode[STIX]{x1D6FD}}_{s})=\unicode[STIX]{x1D6F4}_{rs}}\right]. & & \displaystyle \nonumber\end{eqnarray}$$
Taking the expectation of the right-hand side eliminates the middle term and allows expressing the final term as a function of the variance of the sampling distribution, so that
 $$\begin{eqnarray}\text{E}[\unicode[STIX]{x1D70F}(\hat{\unicode[STIX]{x1D6FD}})]\approx \unicode[STIX]{x1D70F}[\text{E}(\hat{\unicode[STIX]{x1D6FD}})]+{\displaystyle \frac{1}{2}}\mathop{\sum }_{r=1}^{k+1}\mathop{\sum }_{s=1}^{k+1}H_{rs}\unicode[STIX]{x1D6F4}_{rs},\end{eqnarray}$$
where
 $H$
represents the Hessian matrix of second derivatives of
$H$
represents the Hessian matrix of second derivatives of
 $\unicode[STIX]{x1D70F}$
at the point
$\unicode[STIX]{x1D70F}$
at the point
 $\text{E}(\hat{\unicode[STIX]{x1D6FD}})$
and, conveniently,
$\text{E}(\hat{\unicode[STIX]{x1D6FD}})$
and, conveniently,
 $\unicode[STIX]{x1D6F4}$
represents the covariance matrix of the sampling distribution. Rearranging gives an approximation to the magnitude of the transformation-induced
$\unicode[STIX]{x1D6F4}$
represents the covariance matrix of the sampling distribution. Rearranging gives an approximation to the magnitude of the transformation-induced
 $\unicode[STIX]{x1D70F}$
-bias, so that
$\unicode[STIX]{x1D70F}$
-bias, so that
 $$\begin{eqnarray}\text{transformation}\text{-}\text{induced}\;\unicode[STIX]{x1D70F}\text{-}\text{bias}=\text{E}[\unicode[STIX]{x1D70F}(\hat{\unicode[STIX]{x1D6FD}})]-\unicode[STIX]{x1D70F}[\text{E}(\hat{\unicode[STIX]{x1D6FD}})]\approx {\displaystyle \frac{1}{2}}\mathop{\sum }_{r=1}^{k+1}\mathop{\sum }_{s=1}^{k+1}H_{rs}\unicode[STIX]{x1D6F4}_{rs}.\end{eqnarray}$$
If
 $H$
is constant then the approximation is exact. If
$H$
is constant then the approximation is exact. If
 $\hat{\unicode[STIX]{x1D6FD}}$
is unbiased, then
$\hat{\unicode[STIX]{x1D6FD}}$
is unbiased, then
 $\unicode[STIX]{x1D70F}[\text{E}(\hat{\unicode[STIX]{x1D6FD}})]$
can be replaced with
$\unicode[STIX]{x1D70F}[\text{E}(\hat{\unicode[STIX]{x1D6FD}})]$
can be replaced with
 $\unicode[STIX]{x1D70F}(\unicode[STIX]{x1D6FD})$
, so that Equation (1) represents both transformation-induced and the total
$\unicode[STIX]{x1D70F}(\unicode[STIX]{x1D6FD})$
, so that Equation (1) represents both transformation-induced and the total
 $\unicode[STIX]{x1D70F}$
-bias.
$\unicode[STIX]{x1D70F}$
-bias.
Equation (1) does not depend on a strictly convex or concave transformation. As long as
 $\unicode[STIX]{x1D70F}$
is not highly nonlinear (e.g.,
$\unicode[STIX]{x1D70F}$
is not highly nonlinear (e.g.,
 $|\frac{\unicode[STIX]{x2202}^{3}\unicode[STIX]{x1D70F}}{\unicode[STIX]{x2202}\unicode[STIX]{x1D6FD}_{r}\unicode[STIX]{x2202}\unicode[STIX]{x1D6FD}_{s}\unicode[STIX]{x2202}\unicode[STIX]{x1D6FD}_{t}}|\approx 0$
), then Equation (1) provides a reasonable estimate of the direction and magnitude of the bias.
$|\frac{\unicode[STIX]{x2202}^{3}\unicode[STIX]{x1D70F}}{\unicode[STIX]{x2202}\unicode[STIX]{x1D6FD}_{r}\unicode[STIX]{x2202}\unicode[STIX]{x1D6FD}_{s}\unicode[STIX]{x2202}\unicode[STIX]{x1D6FD}_{t}}|\approx 0$
), then Equation (1) provides a reasonable estimate of the direction and magnitude of the bias.
Equation (1) quantifies two intuitions. First, the amount of bias depends on the standard error or sample size. As the sample size grows large,
 $\unicode[STIX]{x1D6F4}_{rs}$
shrinks to zero, which drives the bias to zero as well. This matches the previous observation that
$\unicode[STIX]{x1D6F4}_{rs}$
shrinks to zero, which drives the bias to zero as well. This matches the previous observation that
 $\unicode[STIX]{x1D70F}(\hat{\unicode[STIX]{x1D6FD}})$
is a consistent estimator of
$\unicode[STIX]{x1D70F}(\hat{\unicode[STIX]{x1D6FD}})$
is a consistent estimator of
 $\unicode[STIX]{x1D70F}(\unicode[STIX]{x1D6FD})$
. Secondly, the amount of bias depends on the curvature in
$\unicode[STIX]{x1D70F}(\unicode[STIX]{x1D6FD})$
. Secondly, the amount of bias depends on the curvature in
 $\unicode[STIX]{x1D70F}$
. If
$\unicode[STIX]{x1D70F}$
. If
 $\unicode[STIX]{x1D70F}$
is nearly linear so that
$\unicode[STIX]{x1D70F}$
is nearly linear so that
 $H\approx 0$
, then the transformation introduces minimal bias. On the other hand, more curvature, so that
$H\approx 0$
, then the transformation introduces minimal bias. On the other hand, more curvature, so that
 $H>>0$
, leads to a large bias.
$H>>0$
, leads to a large bias.
Two Monte Carlo Simulations
But does this bias matter in practice? The following two Monte Carlo studies illustrate the importance of accounting for transformation-induced bias when evaluating estimators.Footnote 2 Approximately unbiased coefficients are not enough—one must assess the bias in the quantities of interest as well.
A hypothetical model
Many substantive researchers realize that logistic regression estimates are biased away from zero in small samples and use “rules of thumb” to judge whether asymptotic properties, such as asymptotic unbiasedness, approximately apply to a finite sample. When nonevents outnumber events, one such rule of thumb requires ten events per explanatory variable (Peduzzi et al. Reference Peduzzi, Concato, Kemper, Holford and Feinstein1996). I show that this rule works quite well choosing a sample size that yields approximately unbiased coefficients, but severely underestimates the sample size needed for approximately unbiased estimates of the marginal effects.
For simplicity, I focus on the model
 $\Pr (y)=\text{logit}^{-1}(\unicode[STIX]{x1D6FD}_{\text{cons}}+\unicode[STIX]{x1D6FD}_{1}x_{1}+\unicode[STIX]{x1D6FD}_{2}x_{2}+\unicode[STIX]{x1D6FD}_{3}x_{3}+\unicode[STIX]{x1D6FD}_{4}x_{4}+\unicode[STIX]{x1D6FD}_{5}x_{5}+\unicode[STIX]{x1D6FD}_{6}x_{6})$
, where
$\Pr (y)=\text{logit}^{-1}(\unicode[STIX]{x1D6FD}_{\text{cons}}+\unicode[STIX]{x1D6FD}_{1}x_{1}+\unicode[STIX]{x1D6FD}_{2}x_{2}+\unicode[STIX]{x1D6FD}_{3}x_{3}+\unicode[STIX]{x1D6FD}_{4}x_{4}+\unicode[STIX]{x1D6FD}_{5}x_{5}+\unicode[STIX]{x1D6FD}_{6}x_{6})$
, where
 $y$
indicates whether or not each observation experiences an event and the
$y$
indicates whether or not each observation experiences an event and the
 $x_{j}$
represent fixed explanatory variables that I create by simulating from independent, standard normal distributions. For this simulation, I set
$x_{j}$
represent fixed explanatory variables that I create by simulating from independent, standard normal distributions. For this simulation, I set
 $\unicode[STIX]{x1D6FD}_{\text{cons}}=-1$
and
$\unicode[STIX]{x1D6FD}_{\text{cons}}=-1$
and
 $\unicode[STIX]{x1D6FD}_{j}=0.15$
for
$\unicode[STIX]{x1D6FD}_{j}=0.15$
for
 $j\in \{1,\ldots ,6\}$
. I assume that “approximately unbiased” means a bias of less than three percent, where
$j\in \{1,\ldots ,6\}$
. I assume that “approximately unbiased” means a bias of less than three percent, where
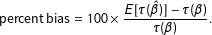 $$\begin{eqnarray}\text{percent bias}=100\times \frac{E[\unicode[STIX]{x1D70F}(\hat{\unicode[STIX]{x1D6FD}})]-\unicode[STIX]{x1D70F}(\unicode[STIX]{x1D6FD})}{\unicode[STIX]{x1D70F}(\unicode[STIX]{x1D6FD})}.\end{eqnarray}$$
I vary number of observations
 $N$
from 100 to 3,000, and, for each sample size, I simulate 100,000 data sets, use each data set to estimate the coefficients, and use the estimated coefficients to calculate the marginal effects. I use these 100,000 estimates to calculate the percent bias given by Equation (2).
$N$
from 100 to 3,000, and, for each sample size, I simulate 100,000 data sets, use each data set to estimate the coefficients, and use the estimated coefficients to calculate the marginal effects. I use these 100,000 estimates to calculate the percent bias given by Equation (2).
Figure 1 shows the bias in the coefficients as the sample size increases. The left panel shows the bias in
 $\hat{\unicode[STIX]{x1D6FD}}_{\text{cons}}$
and the right panel shows the bias in
$\hat{\unicode[STIX]{x1D6FD}}_{\text{cons}}$
and the right panel shows the bias in
 $\hat{\unicode[STIX]{x1D6FD}}_{1}$
. For
$\hat{\unicode[STIX]{x1D6FD}}_{1}$
. For
 $N=100$
,
$N=100$
,
 $\hat{\unicode[STIX]{x1D6FD}}_{\text{cons}}$
and
$\hat{\unicode[STIX]{x1D6FD}}_{\text{cons}}$
and
 $\hat{\unicode[STIX]{x1D6FD}}_{1}$
are biased away from zero by about ten percent. However, this bias drops to about three percent for
$\hat{\unicode[STIX]{x1D6FD}}_{1}$
are biased away from zero by about ten percent. However, this bias drops to about three percent for
 $N=250$
and nearly disappears for
$N=250$
and nearly disappears for
 $N=3,000$
. The rule of thumb works well; the bias is negligible for about
$N=3,000$
. The rule of thumb works well; the bias is negligible for about
 $N=219$
.
$N=219$
.
This figure shows the percent bias for the intercept and coefficient for
 $x_{1}$
. The rule of thumb requiring ten events per explanatory variable suggests a minimum sample size of about 219. For samples larger than about 250, the bias falls below three percent and it nearly disappears as the sample size approach 3,000.
$x_{1}$
. The rule of thumb requiring ten events per explanatory variable suggests a minimum sample size of about 219. For samples larger than about 250, the bias falls below three percent and it nearly disappears as the sample size approach 3,000.
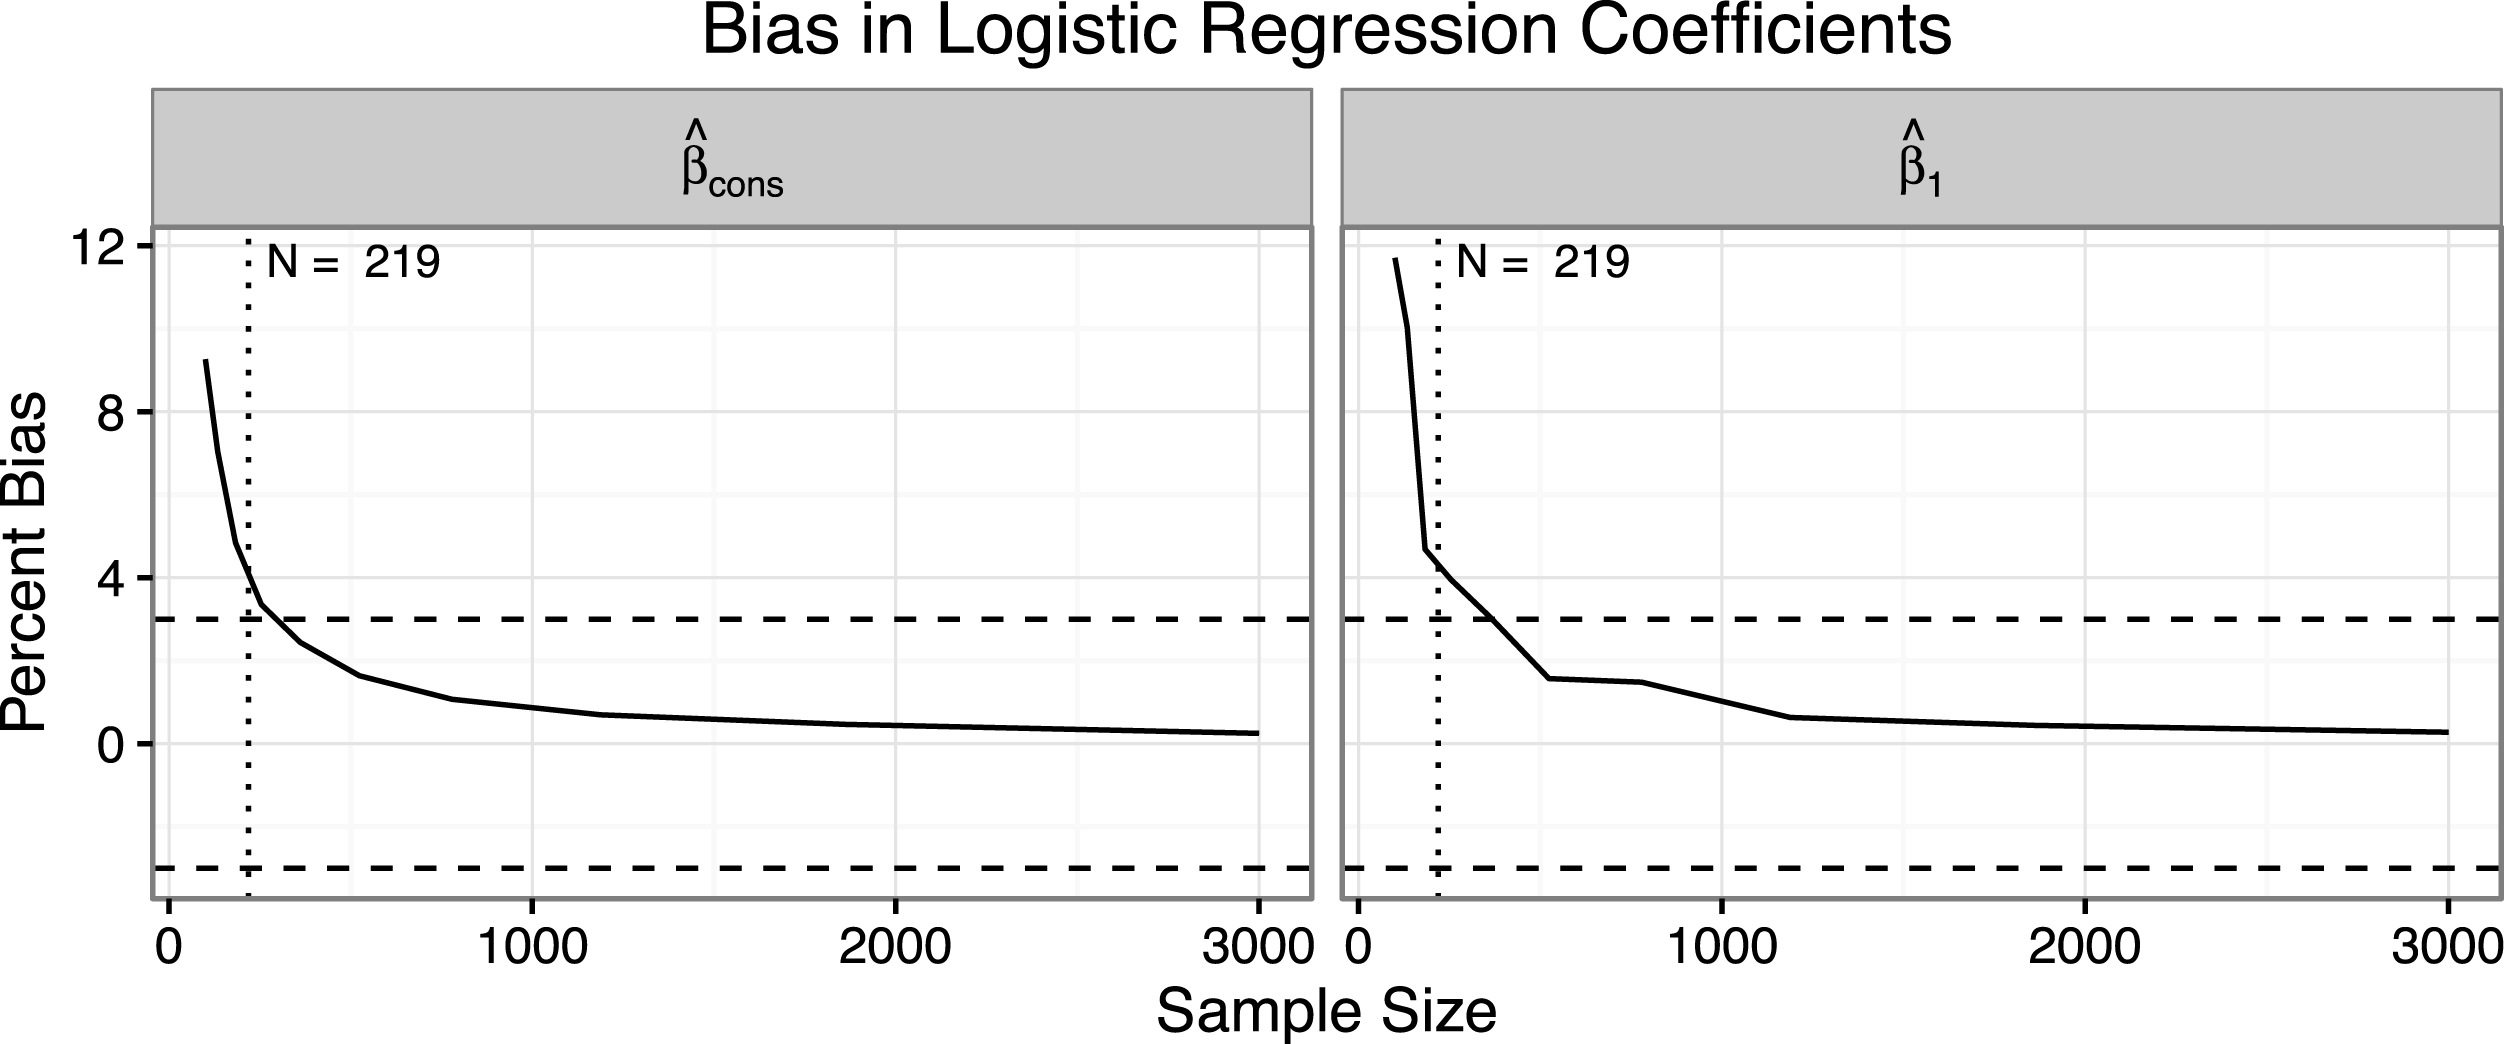
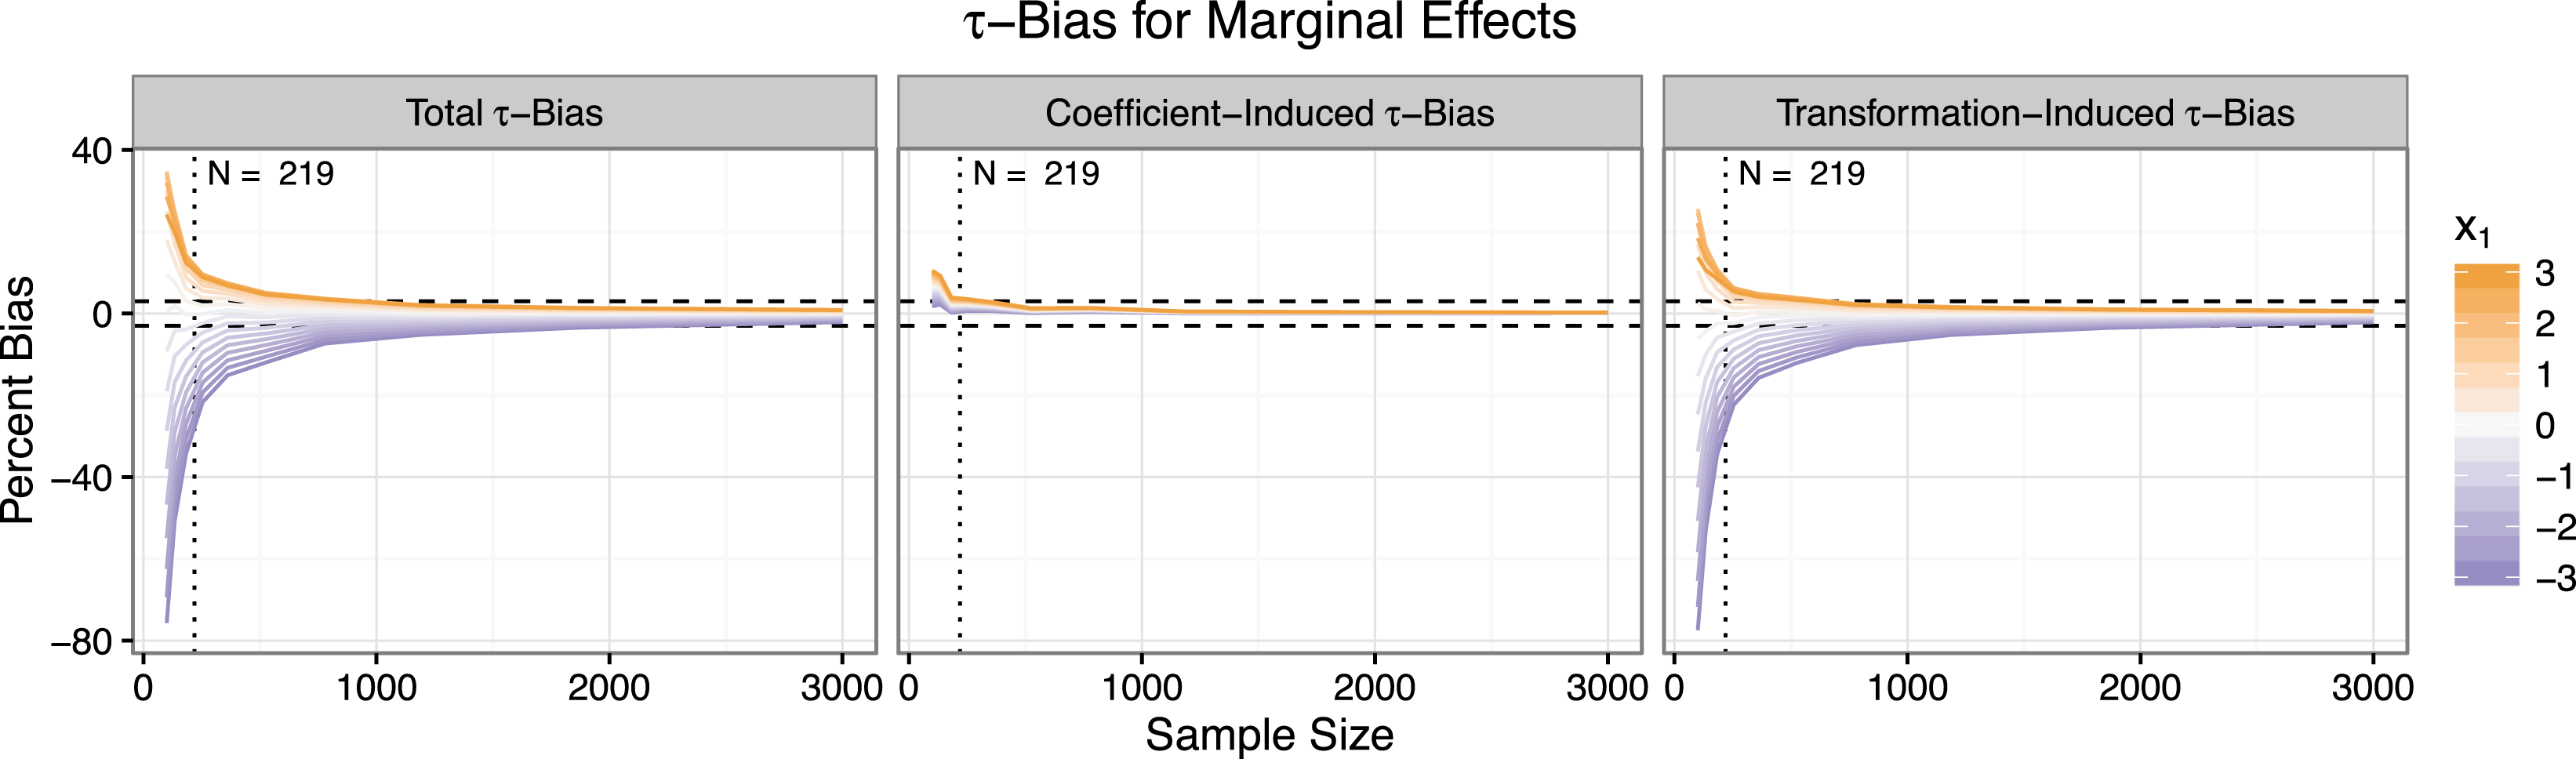
Figure 2 shows the bias in the estimates of the marginal effects as the sample size increases. The left panel shows the total bias, the middle panel shows the coefficient-induced bias, and the right panel shows the transformation-induced bias. Since the marginal effect of
 $x_{1}$
varies with
$x_{1}$
varies with
 $x_{1}$
itself, I plot the estimates for a range of values of
$x_{1}$
itself, I plot the estimates for a range of values of
 $x_{1}$
.
$x_{1}$
.
Two features stand out. First, small-sample bias is much larger for the marginal effects than for the coefficients. For
 $N=100$
, the estimate of the marginal effect is biased by about
$N=100$
, the estimate of the marginal effect is biased by about
 $-$
75% for
$-$
75% for
 $x_{1}=-3$
,
$x_{1}=-3$
,
 $-$
50% for
$-$
50% for
 $x_{1}=-2$
, and
$x_{1}=-2$
, and
 $-$
25% for
$-$
25% for
 $x_{1}=-1$
. Second, the small-sample bias in the estimates of the marginal effects descends to zero more slowly than the coefficient estimates. While the coefficient estimates are approximately unbiased for about
$x_{1}=-1$
. Second, the small-sample bias in the estimates of the marginal effects descends to zero more slowly than the coefficient estimates. While the coefficient estimates are approximately unbiased for about
 $N=250$
, the estimates of the marginal effects retain substantial bias. Indeed, the bias in the estimates of the marginal effects drops below the 3% threshold at about
$N=250$
, the estimates of the marginal effects retain substantial bias. Indeed, the bias in the estimates of the marginal effects drops below the 3% threshold at about
 $N=3,000$
—more than ten times the rule of thumb that works well for the coefficients.
$N=3,000$
—more than ten times the rule of thumb that works well for the coefficients.
This figure shows the total, coefficient-induced, and transformation-induced
 $\unicode[STIX]{x1D70F}$
-bias for the marginal effects. The rule of thumb requiring ten events per explanatory variable suggests a minimum sample size of about 219. However, the bias falls well outside the three percent threshold for this suggested sample size. The estimates fall within the three percent threshold only for sample sizes nearing 3,000—more than ten times the rule of thumb that works well for the coefficients. Also notice that while the coefficient-induced bias receives the most attention from methodologists, the transformation-induced bias is much larger.
$\unicode[STIX]{x1D70F}$
-bias for the marginal effects. The rule of thumb requiring ten events per explanatory variable suggests a minimum sample size of about 219. However, the bias falls well outside the three percent threshold for this suggested sample size. The estimates fall within the three percent threshold only for sample sizes nearing 3,000—more than ten times the rule of thumb that works well for the coefficients. Also notice that while the coefficient-induced bias receives the most attention from methodologists, the transformation-induced bias is much larger.
An actual model
To further highlight the practical implications of transformation-induced
 $\unicode[STIX]{x1D70F}$
-bias, I use the explanatory variables and coefficients reported for Model 1 in Table 2 of Lacina (Reference Lacina2006, p. 286) to conduct a second simulation. Lacina uses a normal-linear regression model with a log-transformed outcome variable to assess several hypotheses about the causes of the number of battle deaths in civil conflicts. Using her reported coefficients as the true model parameters and her explanatory variables the predictors (105 complete observations; 9 explanatory variables), I repeatedly (1) simulate a new outcome variable, (2) re-estimate the regression model, and (3) calculate the quantities of interest. For each set of estimates
$\unicode[STIX]{x1D70F}$
-bias, I use the explanatory variables and coefficients reported for Model 1 in Table 2 of Lacina (Reference Lacina2006, p. 286) to conduct a second simulation. Lacina uses a normal-linear regression model with a log-transformed outcome variable to assess several hypotheses about the causes of the number of battle deaths in civil conflicts. Using her reported coefficients as the true model parameters and her explanatory variables the predictors (105 complete observations; 9 explanatory variables), I repeatedly (1) simulate a new outcome variable, (2) re-estimate the regression model, and (3) calculate the quantities of interest. For each set of estimates
 $\hat{\unicode[STIX]{x1D6FD}}$
and
$\hat{\unicode[STIX]{x1D6FD}}$
and
 $\hat{\unicode[STIX]{x1D70E}}^{2}$
, I calculate two quantities of interest:
$\hat{\unicode[STIX]{x1D70E}}^{2}$
, I calculate two quantities of interest:
(1) The expected number of battle deaths
 $E(\text{deaths}_{i}\mid X_{i})=e^{X_{i}\hat{\unicode[STIX]{x1D6FD}}+\frac{\hat{\unicode[STIX]{x1D70E}}^{2}}{2}}$
for each observed case
$X_{i}$
.
$E(\text{deaths}_{i}\mid X_{i})=e^{X_{i}\hat{\unicode[STIX]{x1D6FD}}+\frac{\hat{\unicode[STIX]{x1D70E}}^{2}}{2}}$
for each observed case
$X_{i}$
.(2) The first difference (i.e., the change in the expected number of battle deaths)
$\unicode[STIX]{x1D6E5}(\text{deaths}_{i}\mid X_{i}^{D},X_{i}^{{\sim}D})=E(\text{deaths}_{i}\mid X_{i}^{D})-E(\text{deaths}_{i}\mid X_{i}^{{\sim}D})=e^{X_{i}^{D}\hat{\unicode[STIX]{x1D6FD}}+\frac{\hat{\unicode[STIX]{x1D70E}}^{2}}{2}}-e^{X_{i}^{{\sim}D}\hat{\unicode[STIX]{x1D6FD}}+\frac{\hat{\unicode[STIX]{x1D70E}}^{2}}{2}}$
if each observed case
$X_{i}$
were changed from a nondemocracy
$X_{i}^{{\sim}D}$
to a democracy
$X_{i}^{D}$
.


Because the estimates of
 $\unicode[STIX]{x1D6FD}$
and
$\unicode[STIX]{x1D6FD}$
and
 $\unicode[STIX]{x1D70E}^{2}$
are unbiased, there is no coefficient-induced
$\unicode[STIX]{x1D70E}^{2}$
are unbiased, there is no coefficient-induced
 $\unicode[STIX]{x1D70F}$
-bias. Indeed, the least squares estimate of
$\unicode[STIX]{x1D70F}$
-bias. Indeed, the least squares estimate of
 $\unicode[STIX]{x1D6FD}$
is the best unbiased estimator under the assumed normal-linear model. However, this ideal small-sample property does not apply to the quantities of interest. Figure 3 summarizes these simulations and demonstrates that transformation-induced
$\unicode[STIX]{x1D6FD}$
is the best unbiased estimator under the assumed normal-linear model. However, this ideal small-sample property does not apply to the quantities of interest. Figure 3 summarizes these simulations and demonstrates that transformation-induced
 $\unicode[STIX]{x1D70F}$
-bias can create considerable bias in the quantities of interest even when coefficient estimates have optimal properties.
$\unicode[STIX]{x1D70F}$
-bias can create considerable bias in the quantities of interest even when coefficient estimates have optimal properties.
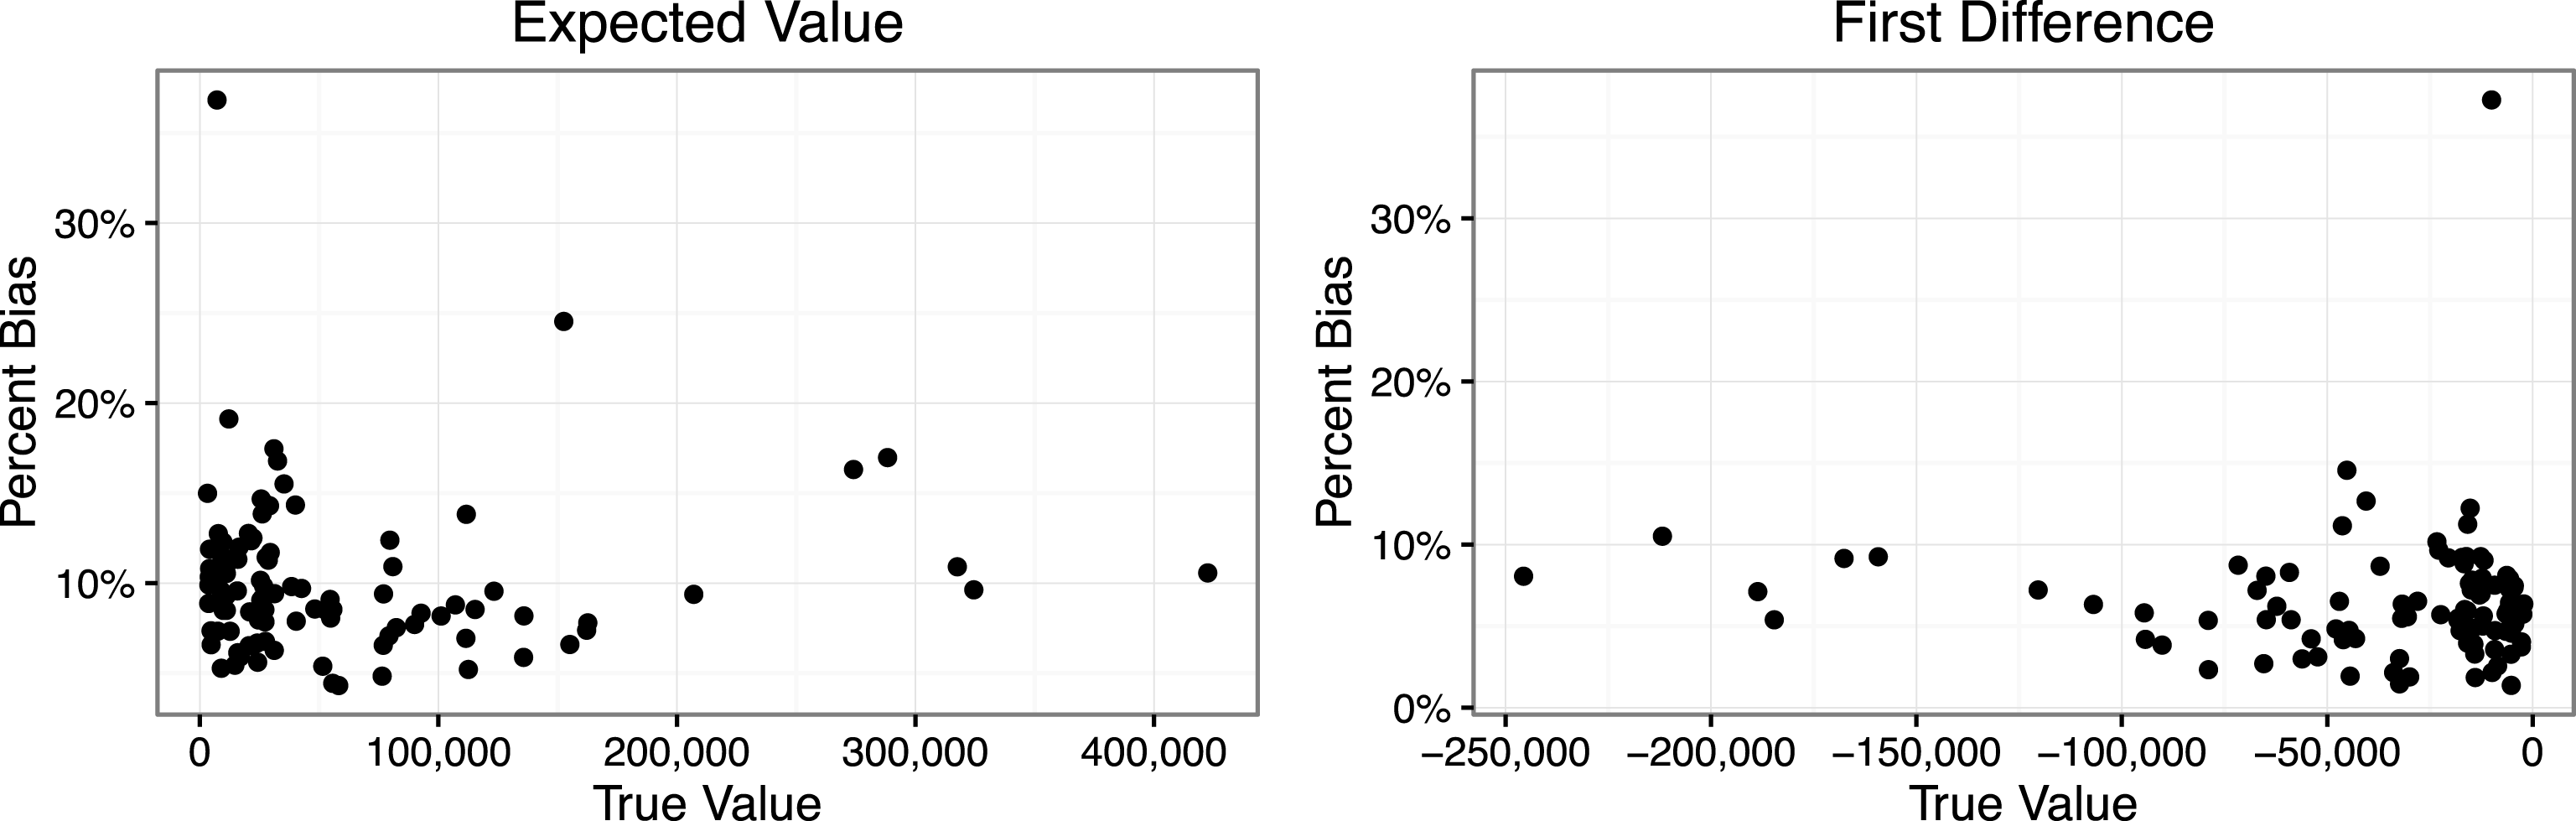
The left panel of Figure 3 shows the true value and percent bias for the expected number of battle deaths
 $E(\text{deaths})=e^{X\hat{\unicode[STIX]{x1D6FD}}+\frac{\hat{\unicode[STIX]{x1D70E}}^{2}}{2}}$
. Because the estimates
$E(\text{deaths})=e^{X\hat{\unicode[STIX]{x1D6FD}}+\frac{\hat{\unicode[STIX]{x1D70E}}^{2}}{2}}$
. Because the estimates
 $\hat{\unicode[STIX]{x1D6FD}}$
and
$\hat{\unicode[STIX]{x1D6FD}}$
and
 $\hat{\unicode[STIX]{x1D70E}}^{2}$
are unbiased, there is no coefficient-induced
$\hat{\unicode[STIX]{x1D70E}}^{2}$
are unbiased, there is no coefficient-induced
 $\unicode[STIX]{x1D70F}$
-bias in the expected value. However, there is a substantial upward bias in the expected value due to transformation-induced
$\unicode[STIX]{x1D70F}$
-bias in the expected value. However, there is a substantial upward bias in the expected value due to transformation-induced
 $\unicode[STIX]{x1D70F}$
-bias. The upward bias in the expected value ranges from 4% (307 deaths) to 37% (51,120 deaths). The average upward bias is 10%—these are not trivial biases.
$\unicode[STIX]{x1D70F}$
-bias. The upward bias in the expected value ranges from 4% (307 deaths) to 37% (51,120 deaths). The average upward bias is 10%—these are not trivial biases.
The right panel of Figure 3 shows that these upward biases do not cancel for the first difference. Indeed, transformation-induced
 $\unicode[STIX]{x1D70F}$
-bias leads to an overly optimistic estimate of the effect of democracy. Lacina correctly notes that “democracy is associated with fewer battle deaths” (p. 287), but transformation-induced
$\unicode[STIX]{x1D70F}$
-bias leads to an overly optimistic estimate of the effect of democracy. Lacina correctly notes that “democracy is associated with fewer battle deaths” (p. 287), but transformation-induced
 $\unicode[STIX]{x1D70F}$
-bias might lead researchers to over-estimate this pacifying effect by up to 10% (and about 35% in one extreme case) and 6% on average.
$\unicode[STIX]{x1D70F}$
-bias might lead researchers to over-estimate this pacifying effect by up to 10% (and about 35% in one extreme case) and 6% on average.
This figure shows the transformation-induced
 $\unicode[STIX]{x1D70F}$
-bias for two quantities of interest. Each point represents a single observation from Lacina’s (Reference Lacina2006) data set. For each observation, I calculate the transformation-induced
$\unicode[STIX]{x1D70F}$
-bias for two quantities of interest. Each point represents a single observation from Lacina’s (Reference Lacina2006) data set. For each observation, I calculate the transformation-induced
 $\unicode[STIX]{x1D70F}$
-bias in the expected value—the expected number of battle deaths—and in the first difference—the change in the expected number of deaths if each case was changed from a nondemocracy to a democracy.
$\unicode[STIX]{x1D70F}$
-bias in the expected value—the expected number of battle deaths—and in the first difference—the change in the expected number of deaths if each case was changed from a nondemocracy to a democracy.
The Implications
Quantities of interest do not inherit the small-sample properties of the coefficient estimates. This fact has important implications for how we evaluate the small-sample properties of estimators.
First,
 $\unicode[STIX]{x1D70F}$
-bias has important implications for the sample sizes that methodologists recommend to substantive researchers. Methodologists usually parameterize models so that the coefficients lie in an unbounded space. This allows the coefficient estimates to rapidly approach their asymptotic distribution, which ensures the estimates have acceptable small-sample properties. Substantive researchers, though, usually transform these coefficient estimates into a quantity of interest, which, because it often lies in a bounded space, might approach its asymptotic distribution more slowly. As a result, substantive researchers might need much larger sample sizes than methodologists usually recommend. Methodologists must remain conscientious of the quantities of interest to substantive researchers and assess the performance of their estimators in terms of these quantities. Unfortunately, it remains impossible or difficult to assess the bias in general or for a wide range of sample sizes, quantities of interest, or parameter values.
$\unicode[STIX]{x1D70F}$
-bias has important implications for the sample sizes that methodologists recommend to substantive researchers. Methodologists usually parameterize models so that the coefficients lie in an unbounded space. This allows the coefficient estimates to rapidly approach their asymptotic distribution, which ensures the estimates have acceptable small-sample properties. Substantive researchers, though, usually transform these coefficient estimates into a quantity of interest, which, because it often lies in a bounded space, might approach its asymptotic distribution more slowly. As a result, substantive researchers might need much larger sample sizes than methodologists usually recommend. Methodologists must remain conscientious of the quantities of interest to substantive researchers and assess the performance of their estimators in terms of these quantities. Unfortunately, it remains impossible or difficult to assess the bias in general or for a wide range of sample sizes, quantities of interest, or parameter values.
But substantive researchers must also remain aware of the potential to introduce bias into estimates by transforming coefficient estimates. Fortunately, substantive researchers can use Monte Carlo simulations to quickly assess the potential for bias in a specific substantive context in which researchers know the sample size, quantity of interest, and likely parameter values.
Secondly,
 $\unicode[STIX]{x1D70F}$
-bias has important implications for the bias-variance tradeoff in choosing an estimator. Methodologists usually recognize a tradeoff between bias and variance in estimating parameters. Actions intended to remove bias might increase variance and vice versa. However, the approximation to the transformation-induced
$\unicode[STIX]{x1D70F}$
-bias has important implications for the bias-variance tradeoff in choosing an estimator. Methodologists usually recognize a tradeoff between bias and variance in estimating parameters. Actions intended to remove bias might increase variance and vice versa. However, the approximation to the transformation-induced
 $\unicode[STIX]{x1D70F}$
-bias given in Equation (1) points out an important result. Greater variance in the coefficient estimates might lead to increased bias in the quantities of interest. This implies that if an estimator is essentially unbiased, then greater efficiency translates to reduced bias in the quantities of interest. Similarly, small reductions in bias at the expense of a large increase in variance might lead to greater bias in the quantities of interest. For example, refinements of the usual logit model intended to reduce bias in the coefficients, such as heteroskedastic probit or scobit, might actually increase bias in the quantities of interest. Methodologists must be aware of this tradeoff when recommending more complex estimators to substantive researchers and comparing alternative estimators.
$\unicode[STIX]{x1D70F}$
-bias given in Equation (1) points out an important result. Greater variance in the coefficient estimates might lead to increased bias in the quantities of interest. This implies that if an estimator is essentially unbiased, then greater efficiency translates to reduced bias in the quantities of interest. Similarly, small reductions in bias at the expense of a large increase in variance might lead to greater bias in the quantities of interest. For example, refinements of the usual logit model intended to reduce bias in the coefficients, such as heteroskedastic probit or scobit, might actually increase bias in the quantities of interest. Methodologists must be aware of this tradeoff when recommending more complex estimators to substantive researchers and comparing alternative estimators.
Methodologists cannot ignore transformation-induced bias. Substantive researchers must not assume that sample size recommendations remain valid for any quantity of interest. Nearly unbiased estimates of coefficients are not enough. We must remain thoughtful about our quantities of interest and calibrate our tools for these quantities.


