


Researchers have come to increasingly rely on surveys—especially online surveys—for both observational and experimental research. While the relative affordability and accessibility of online surveys have been a boon to social scientists, concerns persist about their validity as inattentive respondents can increase measurement error and reduce the power of statistical tests (Oppenheimer et al., Reference Oppenheimer, Meyvis and Davidenko2009; Groves and Lyberg, Reference Groves and Lyberg2010; Read, Wolters and Berinsky, Reference Blair, Wolters and Berinsky2022). While researchers recommend attention checks to identify inattentive respondents, the true efficacy of these checks is unknown. We can identify the number of respondents caught, but we can only guess at how many slip through the cracks. We know even less about whether hidden inattentive respondents impact survey quality.
In this paper, we report on the presence of inattentive behavior following rigorous pruning methods and the effect of that behavior on research quality. We answer three interrelated questions: how many inattentive respondents survive rigorous attention checks on a high-quality academic survey? Do these inattentive respondents affect inferences drawn from polls? Can we encourage these inattentive respondents to be more attentive? To answer these questions, we use two sets of issue items fielded on the 2020, 2021, and 2022 Cooperative Election Study (CES) surveys that include questions about policy positions that use nearly identical wording but with completely opposite positions. This structure reveals that—depending on the year—4 to 6% of respondents give logically contradictory sets of answers despite passing initial screens for attentiveness.
We first present evidence that these respondents are more likely to meet traditional criteria to be deemed inattentive, including straightlining and speeding. However, we also show that there is a notable distinction between respondents who persistently give contradictory responses and those who only do so for one set of items but not the other. It is those who give contradictory responses on both grids who show the strongest evidence of inattentiveness. We next focus on minority groups in the 2022 CES that are identified by a single binary yes-or-no question. We present evidence that those who select “yes” are significantly more likely to be contradictors.
We find that subgroup analyses based on a single survey question may be at risk for contamination by inattentive respondents. The remainder of the paper presents findings from an experiment aimed at mitigating this behavior. Flagging inconsistent answers for survey respondents failed to encourage them to pay more attention during the remainder of the survey.
Pollsters and researchers alike have reckoned with ongoing concerns about the quality of online samples. We both validate and contextualize those concerns. We find strong evidence of some inattentive respondents surviving industry-standard attention checks, but the relatively low incidence rate means that estimates with sufficiently large samples are largely unaffected by these respondents. These respondents can, however, have a significant effect on subgroup analyses with small sample sizes. Researchers, especially those working with low-cost providers and/or using small sample sizes, would be wise to keep these concerns in mind, for inattentive respondents may produce biased inferences with even high-quality survey data.
1. Inattentiveness and respondent quality
Concerns over poor respondent quality are not unique to the modern survey context (Krosnick, Reference Krosnick1991; Krosnick et al., Reference Krosnick, Narayan and Smith1996; Roberts et al., Reference Roberts, Gilbert, Allum and Eisner2019), but interest in the problem has grown as self-administered online surveys have come to dominate the academic and non-academic polling landscape (Wolf et al., Reference Wolf, Joye, Smith and Yang-Chih2016). Since the advent of widespread, affordable online polling, public opinion researchers have urged caution, highlighting concerns such as non-response, acquiescence, and satisficing, issues that are harder to control when a survey is self-administered (Malhotra and Krosnick, Reference Malhotra and Krosnick2007; Baker et al., Reference Baker, Blumberg, Brick, Couper, Melanie Courtright, Dillman, Frankel, Garland, Groves, Kennedy, Krosnick, Lavrakas, Lee, Link, Piekarski, Rao, Thomas and Zahs2010; MacInnis et al., Reference MacInnis, Krosnick, Annabell and Cho2018; Pasek and Krosnick, Reference Pasek and Krosnick2020).
While it is common for researchers to use various methods to identify and separate inattentive respondents, Berinsky et al. (Reference Berinsky, Margolis and Sances2014) note that attentiveness is best thought of as a continuum, with some respondents paying no attention at all while others pay more attention but are still not fully attentive. In this paper, we focus on identifying respondents who fall closer to the latter end of such a continuum—those who remain in the sample even after the survey firm (or researcher) takes steps to filter out the least attentive respondents. This approach uses the perspective of satisficing, one prominent manifestation of inattentiveness in which respondents make satisfactory rather than optimal choices when answering survey questions (Simon, Reference Simon1956; Berinsky et al., Reference Berinsky, Margolis and Sances2014; Blazek and Siegel, Reference Blazek and Siegel2023). Krosnick (Reference Krosnick1991) describes a litany of examples of satisficing behavior, including acquiescence to a proposal, choosing the same option when asked a series of questions with identical response options, and response order effects—both resembling the behavior we study here.Footnote 1 Without the presence of an interviewer, the respondent has more latitude in their answers. Researchers and pollsters employ various tools to identify and prune inattentive respondents. The most frequent include instructional manipulation checks, or IMCs (Oppenheimer et al., Reference Oppenheimer, Meyvis and Davidenko2009), fake questions (Meade and Craig, Reference Meade and Craig2012), and time-based cutoffs (Zandt, Reference Zandt2002; Malhotra, Reference Malhotra2008). But these measures may increase survey length and/or require arbitrary thresholds (Kong et al., Reference Kong, Wise and Bhola2007; Read, Wolters and Berinsky, Reference Blair, Wolters and Berinsky2022).
Given the wide range of checks and tools used to screen in surveys, estimates of inattentiveness vary widely ranging from as low as 3-9% (Maniaci and Rogge, Reference Maniaci and Rogge2014) to above 30% (Orr et al., Reference Orr and Ternovski2022; Read, Wolters and Berinsky, Reference Blair, Wolters and Berinsky2022). High failure rates could lead to unrepresentative samples as inattentive respondents appear to be systemically different (Hillygus et al., Reference Hillygus, Jackson and Young2014). Juan and Revilla (Reference Juan and Revilla2021) replicate a case study on climate change and find nearly 58% of respondents failed the IMC, and that those respondents differed from the main sample on five attitudinal dimensions along with education and the size of their municipality. Berinsky et al. (Reference Berinsky, Margolis and Sances2014) find evidence that young, Black, male, and lower-educated respondents are all more likely to fail attention checks, a finding affirmed by Alvarez et al. (Reference Alvarez, Atkeson, Levin and Yimeng2019) (though see Berinsky et al., Reference Berinsky, Margolis, Sances and Warshaw2021). In a broader examination of “bogus” respondents—people who are ineligible for the survey, satisficing, and/or completely inattentive—subgroups like young adults and Hispanics were more likely to be classified as bogus (Mercer and Lau, Reference Mercer and Lau2023). For this reason, researchers caution that the overuse of IMCs may worsen nonresponse bias by removing respondents who belong to groups that are already difficult to recruit (Little, Reference Little1992; Alvarez et al., Reference Alvarez, Atkeson, Levin and Yimeng2019). Alternatively, if researchers are able to nudge respondents toward attentiveness, then the dilemma stemming from the high rate of failure can be addressed without sacrificing sample representativeness. This possibility motivates our experiment later in the paper.
We estimate inattentiveness after the survey firm had applied its own methods to remove the most inattentive respondents. We do this by identifying contradictory responses to two sets of questions. A handful of studies have explored the notion of consistency as an indicator of inattentiveness or satisficing, but with less direct applications to political science (Borgers et al., Reference Borgers, Hox and Sikkel2004; Kaminska et al., Reference Olena, McCutcheon and Billiet2010; Grauenhorst et al., Reference Grauenhorst, Blohm and Koch2016). For example, Wood et al. (Reference Wood, Harms, Lowman and Justin2017) studies the association between response time and consistency when respondents are aware that they are answering identical questions.
Kennedy et al. (Reference Kennedy, Hatley, Lau, Mercer, Keeter, Ferno and Asare-Marfo2020) offers the closest parallel to our work, studying the prevalence of “bogus” respondents who always chose approve/support in a survey regardless of the question. They find that up to 4% of their panel always indicated support regardless of the question asked, and that 84% of all bogus respondents passed traditional attention checks. They estimate the effects of bogus respondents on toplines, which we replicate and extend in Section 4.1. One limitation of this approach is that agreeing to all their questions yields a highly unusual but not logically inconsistent response pattern. Our method uses two questions that yield sets of logically impossible issue positions. This ensures that respondents are highly unlikely to suspect anything unusual yet offers an objective measure of inattentiveness.
Here, we infer attention from response quality and cannot “definitively” (i.e., through direct observation of the respondent) prove these are inattentive respondents. But Berinsky et al. (Reference Berinsky, Frydman, Margolis, Sances and Valerio2024) list over 10 commonly used measures of inattentiveness, all of which are constrained by the same limitation as ours: their inability to truly “confirm” this behavior as inattentive. And notably, contradictory behavior is not one of the methods they list, suggesting that this type of measure has yet to be sufficiently tested.
By using two sets of contradictory questions, we uncover a number of respondents who contradict once but not a second time. There are two dueling perspectives on this behavior. First, Maniaci and Rogge (Reference Maniaci and Rogge2014) argue that attention may be transitory: respondents oscillate between attentiveness and inattentiveness. On the other hand, Berinsky et al. (Reference Berinsky, Margolis, Sances and Warshaw2021) frame inattentiveness as a latent construct, with attention checks capturing inattention with error. We cannot resolve the “unwieldy” (Berinsky et al., Reference Berinsky, Frydman, Margolis, Sances and Valerio2024) state of the inattentive literature here; our evidence supports both the transitory and latent hypotheses. But we can offer a measure that we believe is less likely to confound other respondent behaviors with attention while offering concrete evidence that attention is continuous. Because YouGov implements their own set of screens, our approach identifies respondents who are at least attentive enough to survive basic screening. The fact that we find a number of inattentive respondents suggest that attention is not binary. We validate our measure against many indirect methods of attentiveness, including straightlining, validated votes, and speeding, finding that the respondents we flag behave consistent with prior findings in the literature when examining these measures. In the following section, we discuss our method in more detail.
2. Studying inattentiveness in the cooperative election study
Our analyses mostly use data from the CES, which is an annual academic survey fielded by the online survey firm YouGov.Footnote 2 The CES is one of the most utilized surveys in the discipline of political science and is partly funded by the National Science Foundation. A search of peer-reviewed journals in the ProQuest database finds 637 articles published between 2010 and 2020 which reference or use CES data. Given the ubiquity of CES data in political science, studying the presence of inattentive respondents in the survey is an important contribution in its own right. However, it is also a worthwhile endeavor because the firm that fields the study (YouGov) is considered one of the highest quality online survey firms (Ansolabehere and Schaffner, Reference Ansolabehere and Schaffner2014, Reference Ansolabehere and Schaffner2018). Thus, our analysis provides scholars and practitioners an accounting of the significance of hidden inattentive respondents even in a gold standard online survey unlike many existing studies which focus on Amazon’s Mechanical Turk or other lower quality sample sources (Orr et al., Reference Orr and Ternovski2022; Berinsky et al., Reference Berinsky, Margolis, Sances and Warshaw2021).
The election year CES surveys include interviews with at least 60,000 respondents, while the odd-year studies generally have a sample size of between 15,000 and 25,000. Each of the CES surveys we analyze in this paper are publicly available on the CES website (https://tischcollege.tufts.edu/ces).Footnote 3 Basic details for each survey can be found in Table 1.
Details on CES surveys

The CES includes a common content questionnaire that is answered by all respondents before those respondents are then sent to complete a randomly assigned team module. The common content includes various questions about the respondents’ lives, their political preferences, and dozens of questions about political issues. The issue items are most frequently asked in a grid format, where respondents are asked whether they support or oppose anywhere between 4 and 9 policy proposals in a particular domain (such as immigration, abortion, health care, etc.).
Before moving on to our analysis, it is useful to contextualize our findings by describing the quality checks already performed by YouGov before the data is made publicly available. YouGov identifies and drops speeders—respondents who move through the survey much faster than most other respondents. They also identify and drop respondents who skip too many questions or who engage in too much straightlining. Finally, YouGov manually investigates responses to open-ended questions and drops respondents who have given nonsensical answers.Footnote 4 Thus, our analysis and results are conducted after these quality checks have been administered. If we consider attentiveness on a continuum, then YouGov’s filters are likely capturing individuals at the low end of this scale. Our focus on inconsistent responses can best be thought of as identifying moderately attentive respondents from those who are very attentive.
3. Contradictions in the 2020 and 2022 CES
To identify inattentive respondents surviving the YouGov screens, we use issue items asked in two separate grids—one for abortion policy and one for crime/policing policy. These grids contain two items for which it would be logically impossible to support both policies. Both grids begin with the same prompt: “Do you support or oppose each of the following proposals?”
The abortion grid includes six policy proposals. The two proposals for which it would be clearly contradictory to support both are:
• Always allow a woman to obtain an abortion as a matter of choice.
• Make abortions illegal in all circumstances.
The crime and policing grid includes a total of eight proposals, with the two contradictory items being:
• Increase the number of police on the street by 10 percent even if it means fewer funds for other public services.
• Decrease the number of police on the street by 10 percent and increase funding for other public services.
In 2020 and 2021, each grid appeared on a single page with a fixed question order. For the abortion grid, making abortion legal in all circumstances appeared first and making abortion illegal appeared sixth. For the policing grid, increasing funding appeared third and decreasing funding appeared fourth. In 2022, the grid was split across two pages, with the question order randomized. At worst, the contradictory questions would appear on two adjacent pages.Footnote 5
We define a contradictory response as agreeing to both prompts. Restricting our attention to agree, agree response patterns will yield an underestimate of inattentiveness. It is likely that some inattentive respondents gave other answer patterns, so it is difficult to know to what extent our approach undercounts inattention. In one extreme scenario, inattentive respondents randomly answer questions. Since we use two questions with two answer choices, our estimate will only capture 25% of the true number of inattentive respondents (across two sets of question pairs like we do here, we would pick up 43.75% of true inattentive respondents).Footnote 6 We suspect, however, that inattentive respondents are not randomly choosing responses question-to-question. We show later in Figure 3 that contradictory respondents are more likely to straight-line. And because all the question pairs appear in the same grid, true random responding would require an inattentive respondent to flip responses within the same page of the survey. If instead of randomly responding an inattentive respondent will always straightline (i.e., a 50% chance of two agrees and a 50% chance of two disagrees), we would capture 50% of inattentive respondents with our approach for one question and 75% with two questions. The true probability distribution is somewhere in-between these two extremes, suggesting we identify between 44%-75% of inattentive respondents.
Pollsters seeking to use contradictory questions as an attention screen should be aware that they are likely to under count true inattentiveness. At the same time, we believe contradictory questions likely uncover a different type of inattentiveness, since all respondents we flag already passed YouGov’s own screens. Under Berinsky et al. (Reference Berinsky, Margolis and Sances2014)’s continuous framework, YouGov’s attention checks prune those at the most extreme of the attention spectrum. Contradictory questions capture respondents close to, but not at, that extreme. It is for that reason we recommend utilizing them in conjunction with other screens like IMCs and using multiple sets of contradictions. The inclusion of just two contradictory pairs could identify nearly 50% of remaining inattentive respondents that survive standard checks. Moreover, for all other respondents, these questions yield legitimate data on public opinion, which mitigates the additional response burden from including them.
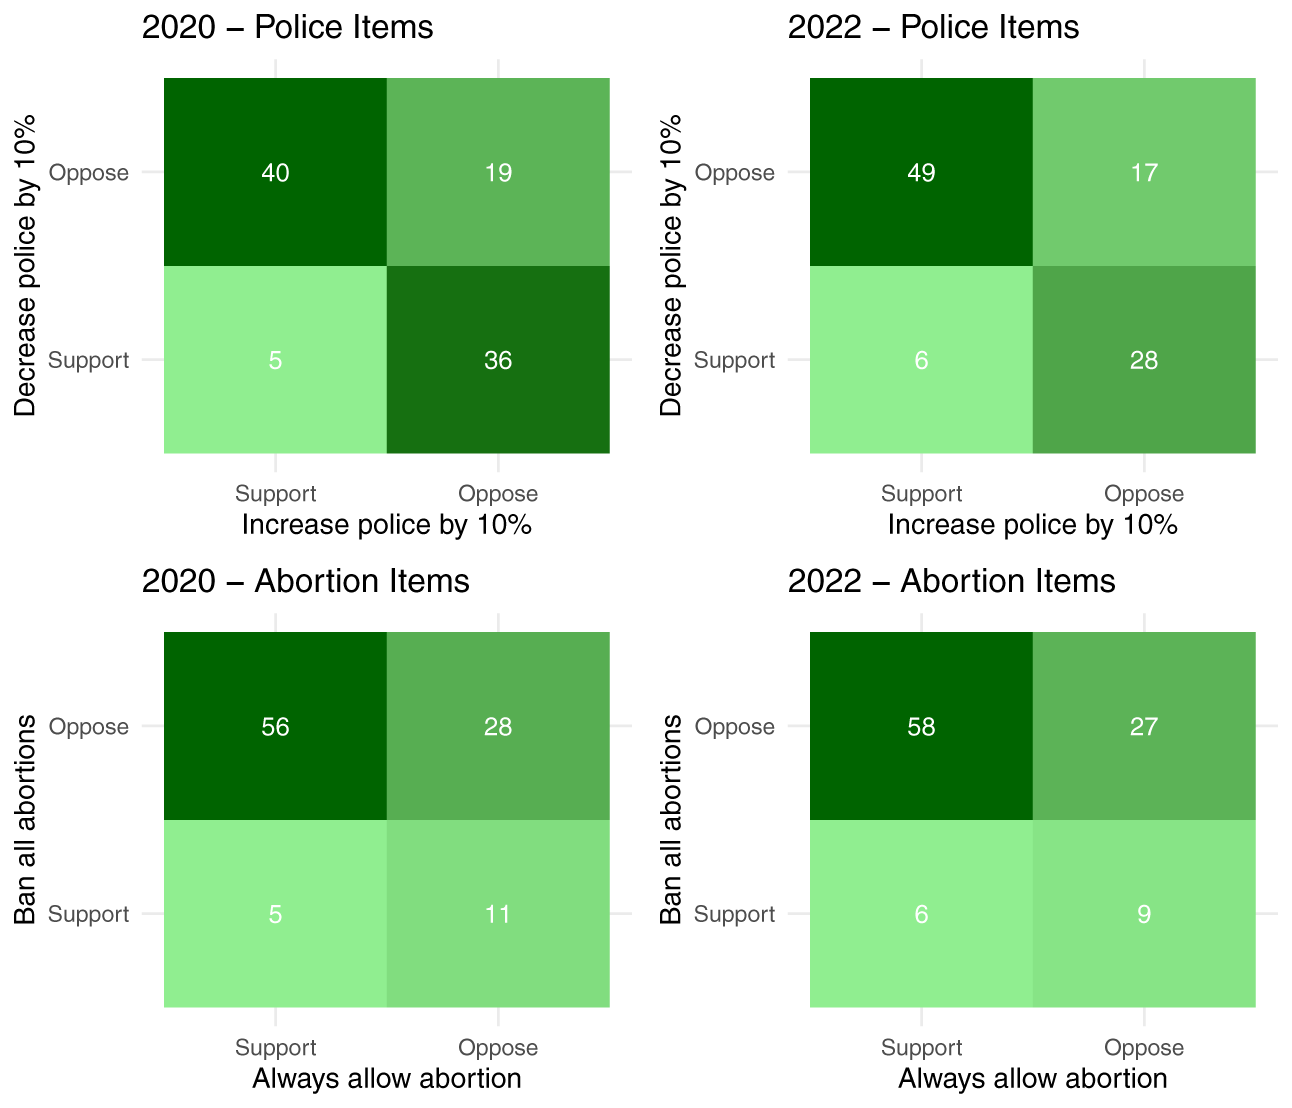
Figure 1 shows the joint distribution of responses on the contradictory items in the 2020 and 2022 CES surveys. The percentages in the figure are unweighted. The top row shows results for the two policing items and the bottom row shows the results for the two abortion items. For each plot, the bottom left cell is the one that identifies contradictory respondents. For each set of items, the percentage of contradictory responses was 5 percent in 2020 and 6 percent in 2022.
Joint distribution of responses on survey items, 2020 and 2022.

Since each survey includes two items on which respondents could provide a contradictory response, we can use these items to identify how many respondents do not give a contradictory response on either item, those who give a contradictory response on one item but not the other, and those who give contradictory responses on both items. Notably, only about 2 percent of the sample in each year gave contradictory responses to both sets of items; it was much more common for a respondent to give a contradictory set of responses to one set of items but not the other (see Table 2). This suggests that some respondents may be inattentive on some items but not others, while a smaller share of respondents may be paying little attention throughout the survey. This motivates our experiments later in the paper, where we ask whether we can proactively prevent these contradictors.
Frequency of contradictory responding, 2020 and 2022

The number of respondents contradicting at least once is higher than Kennedy et al.’s (2020) estimate of respondents who answered the same way for the entire survey. But the percentage of respondents contradicting twice is consistent with their finding of 1-3% of respondents on higher quality online panels answering positively for the entire survey. The fact that respondents were less likely to be inconsistent on both sets of items also reflects the fact that persistent inconsistency is a behavior that would we would expect to find on the lower end of the attentiveness continuum, among respondents who would mostly have already been identified and removed by YouGov’s screens.
Indeed, the differences between respondents who give one contradictory response compared to those who give contradictory responses on both grids can be seen through other measures as well. Table 3 provides a number of different survey metrics for the CES respondents based on whether they gave contradictory responses once, twice, or neither time. Aside from failing IMCs or other strategies designed specifically to trim inattentive respondents, two common post-hoc tools used by researchers to catch inattentive respondents are speeding through questions (Malhotra, Reference Malhotra2008; Oppenheimer et al., Reference Oppenheimer, Meyvis and Davidenko2009; Read, Wolters and Berinsky, Reference Blair, Wolters and Berinsky2022, to name a few) and straight-lining—giving the same answer repeatedly (Couper et al., Reference Couper, Tourangeau, Conrad and Zhang2013; Zhang and Conrad, Reference Zhang and Conrad2014). Recall that YouGov implements measures such as removing the most extreme straight-liners and speeders. But this does not preclude either of these phenomenon from occurring in the remaining sample at a marginally less egregious rate than the pruned respondents.
Survey metrics by number of contradictions
 $^{a}$ p $ \lt $.01 difference of proportions/means test relative to 0 contradictions group. $^{b}$ p $ \lt $.01 difference of proportions/means test relative to 1 contradiction group.
The first line of entries shows the median number of minutes that each group took to complete the pre-election wave of the survey. Respondents who contradicted themselves both times moved considerably faster through the survey than the other two groups did. This is the first indication that one-time contradictors are quite distinct from those who contradict on both issues. Respondents who only gave one contradiction took 7 to 8 minutes longer on the pre-election wave than those who contradicted twice. Respondents who did not contradict on either grid only took about 2 to 3 minutes more time than the one-time contradictors.
The next line of entries shows the percentage of the time that each group gave the exact same response for each item in the Roll Call Vote (RCV) grid, which comes later in the CES survey. The RCV grid asks respondents for their own position on several important issues that came before congress during the previous few years. In 2020, there were seven items, most of which were Democratic initiatives but one of which asked about confirming Brett Kavanaugh to the Supreme Court. In 2022, there were 8 items, all of which were Democratic sponsored initiatives. Each item offered two response items: agree or disagree. We define straight-lining as responding with all “agrees” or all “disagrees.” In both years, respondents who contradicted themselves 1 time or less were much less likely to straight-line on the grid than those who contradicted themselves both times.
These three groups look unique on various other metrics as well. Respondents who provide more contradictory responses are less likely to take the follow-up post-election survey. Retention rates were above 85% for respondents who had zero contradictions but only around 60% for those who contradicted themselves twice. The type of device that respondents took the survey also varies across this group—those who did not give contradictory responses were less likely to take the survey on a mobile device compared to those who did give at least one contradictory response.
A notable pattern in these results is the fact that on most of these metrics respondents who contradict themselves once look quite different from those who contradict themselves twice. They are consistent with the notion that our approach is likely identifying moderately (rather than highly) attentive respondents (Berinsky et al., Reference Berinsky, Margolis and Sances2014). Whether attention is truly waxing or waning or whether the difference is measurement error is a distinction our data does not allow us to make.
The last two lines of Table 3 provide information about the types of individuals who engage in contradictory responding. First, these respondents are much less likely to be matched as a validated voter in the most recent election, suggesting that these respondents are less politically active. Because respondents who give contradictory answers are likely less interested in politics, it is unsurprising that they also belong to groups who are underrepresented in the sample. This can be seen from the final line of the table which shows the average weight given to respondents in each of the groups. The differences are particularly stark in 2020. In that year, respondents who did not give contradictory responses received an average weight of 0.98, but those in the group that twice contradicted themselves received an average weight that was 1.38. In other words, the weighting used by the CES led to an over representation of inattentive respondents.
In Table 4, we highlight self-reported respondent characteristics among each group. Notably, if these respondents are indeed inattentive, then it is a distinct possibility that they erroneously self-report various demographic traits. Indeed, we explore this possibility in Section 4.1 and find evidence that they do. Aside from the first row, which is the mean age, all other variables are expressed as the percent of respondents who select/choose the listed category. Like the preceding table, the differences in groups are especially stark in 2020 but generally true for both years. Contradictory respondents are younger, less likely to have a college degree, less likely to be white, less interested in politics, and less likely to know who controls Congress (defined as correctly identifying the party in control of the House and the Senate). All of these findings fit with prior literature on who contradicts (Berinsky et al., Reference Berinsky, Margolis and Sances2014; Hillygus et al., Reference Hillygus, Jackson and Young2014; Mercer and Lau, Reference Mercer and Lau2023), confirming a lesson implied by previous work: the type of respondents who are more difficult for pollsters to reach in the first place are also less likely to be attentive respondents even if they are successfully recruited to participate.
Demographics of inattentive respondents

Note: all variables besides age expressed in percentage terms.
The contradictory nature of the responses and their placement within the survey—back to back—precludes many other explanations like priming, partisan cheer leading, satisficing, and others. We now briefly consider alternative explanations for this behavior, the first of which being a predisposition toward noncompliance. If that were the case, then our measure of attentiveness would perform better than other direct interventions. A respondent actively seeking to non-comply would be far less likely to comply with an IMC or other intervention that is actively seeking compliance. Our measure is innocuous and thus only the most extreme non-compliers would even notice the possible opportunity to not comply. Indeed, as a preview of our experimental findings, we ask contradictors whether they intended to put their contradictory answers. If these respondents were intentionally not complying, then we should expect a clear majority answering yes. Instead, responses are split almost evenly between yes and no, offering mixed evidence at best that these respondents are intentionally not complying.
Other rival explanations include ambivalence and confusion. We do not expect ambivalence to be a major threat. The responses that constitute inattention in this scenario are ones in which the respondent prefers changing the status quo. If a respondent is truly ambivalent on two highly salient issues (especially in 2020 and 2022) like abortion and policing, then they have the opportunity to endorse the status quo in one or both of the questions within each set. Indeed, 17-19% of respondents endorse the status quo on policing by opposing proposals to increase and decrease spending on the police. We do not flag such respondents as inattentive.
Second, it is possible that respondents were confused by the presence of such similar questions, but we deem that unlikely. The questions are short and straightforward with clear wording indicating the direction of the change and the possible effect. Moreover, if a respondent is truly confused, then it is puzzling that they would choose to change the status quo in both circumstances. More likely, a respondent would be confused because they glossed over the first or the second question, and thus were unable to answer properly. That respondent is still inattentive, and thus this does not pose a threat to inferring that these patterns indicate inattentiveness.
4. The potential impact of inattentiveness on polls
This section analyzes the potential impact of contradictory respondents on subgroup analyses. The possible bias introduced by measurement error is well-documented and can be a key contributor to total survey error (Groves and Lyberg, Reference Groves and Lyberg2010; Read, Wolters and Berinsky, Reference Blair, Wolters and Berinsky2022). This can have significant impacts on public opinion results, including attitudinal questions (Alvarez et al., Reference Alvarez, Atkeson, Levin and Yimeng2019), turnout measures (Alvarez and Li, Reference Alvarez and Yimeng2022), and issue-based questions (Ahler et al., Reference Ahler, Roush and Sood2021). Inattentiveness can also affect treatment effects and regression results (Oppenheimer et al., Reference Oppenheimer, Meyvis and Davidenko2009; Maniaci and Rogge, Reference Maniaci and Rogge2014).
Recall that about 2% of CES respondents contradict themselves on both questions while an additional 7-8% contradict themselves once. Because the sizes of both of these groups are relatively small, it is unlikely that they will have an outsized impact on topline results. Indeed, in simulations where we dropped contradictory respondents and re-weighted the 2020 and 2022 CES surveys without them, we found a trivial effect on topline vote estimates.Footnote 7 However, as Ansolabehere et al. (Reference Ansolabehere, Luks and Schaffner2015) note, even if only a small share of survey respondents misidentifies themselves, that share can quickly become a significant portion of any very small subgroup.
To illustrate the potential issue, we examine binary demographic questions on the 2022 CES where a “yes” response placed the respondent into a particular demographic group. We compute the difference in the fraction of respondents in that group who exhibited contradictory behavior—defined as at least one contradiction on the policing or abortion questions—to the fraction of respondents who did not identify with that group. Note that we define contradictory behavior as one or more contradictions to provide an upper bound on the possible effect. Those results are shown in Table 5.
Difference in contradiction rate among binary demographic questions

Across all four binary questions, we see a positive and significantly higher fraction of respondents identifying as members of each group displaying contradictory behavior. The Hispanic estimate has been identified in previous research (Kennedy et al., Reference Kennedy, Hatley, Lau, Mercer, Keeter, Ferno and Asare-Marfo2020) and has been attributed to random response patterns: a respondent answering randomly to a question about a minority group will choose “yes” and “no” at a roughly equal rate.
We are not asserting that members of these groups are more likely to contradict themselves because of their identity nor do we assume that all of the contradictory respondents are mistakenly claiming this identity. Rather, we contend that a portion of this group may be mistaken when they select into this minority group. This raises questions about the validity of research and reporting that rely on large-N (overall) samples to capture enough respondents to estimate small subgroups with sufficient power. If these false positive respondents are systematically different from true members of the subgroup, then their inclusion may significantly alter our inferences about the group. To investigate the sensitivity of these results to the presence of inattentive respondents, we analyze the recalled Trump-Biden vote among Hispanic and transgender respondents.
We begin with Hispanics. Kennedy et al. (Reference Kennedy, Hatley, Lau, Mercer, Keeter, Ferno and Asare-Marfo2020) find a five point decrease in the approval of President Trump among Hispanics when removing bogus respondents. Note that they combine multiple definitions of bogus respondents, one of which is always responding “always approve.” Our estimate is thus an underestimate relative to theirs given we focus on just one indicator of inattentiveness; also note that we focus on recalled vote, not approval. The results of this replication are found in Table 6.
2020 presidential vote among respondents identifying as Hispanic

Note: Adult population weights applied to derive the estimates in this table.
Removing all contradictory respondents increases the fraction of Hispanics voting for Trump by 1.8%. Our estimates are not directly comparable to Kennedy et al. (Reference Kennedy, Hatley, Lau, Mercer, Keeter, Ferno and Asare-Marfo2020) given we differ on both the outcome being measured and the types of bogus respondents we identify. Still, our findings suggest the Hispanic Trump-Biden estimate is robust to this type of inattentive respondent.
We next analyze transgender respondents, as they demonstrate the largest difference in contradictory rate relative to those who are not transgender. Of the 60,000 adult respondents, 839 identified as transgender; however, 240 of those (29%) gave at least one contradiction on the earlier grids. This contradiction rate is three times higher than for the full sample. As we see in Table 5, transgender respondents are by far the smallest of the groups we focus on leading us to expect inattentive respondents to have the largest impact here.
Among those identifying as transgender and reporting they voted, 18% of never-contradictory respondents reported voting for Trump. But 34% of respondents with one contradiction claim they voted for Trump and 45% of twice-contradictory respondents report a Trump vote. While the gap between Biden and Trump support in Table 7 is 59 points among all respondents identifying as transgender, it grows to 69 points when respondents who contradicted themselves earlier in the survey are removed. This example illustrates that very small subgroup analyses may be affected by even a relatively low percentage of inattentive respondents in the full sample.
2020 presidential vote among respondents identifying as transgender

Note: Adult population weights applied to derive the estimates in this table.
In Appendix 2.2, we present results from two additional replications. The first replicates a recent survey experiment (conducted on 1,300 respondents) and finds modest changes in the treatment effect when contradictors are removed, increasing the significance of the result. The second replicates recent findings on minority voting coalitions, showing inattentive respondents do not affect the findings. Together with our subgroup analysis, these results suggest that the inclusion of inattentive respondents mostly pose a threat to the accuracy of small subgroup and small sample results.
5. Can respondents be nudged toward attentiveness?
Our preceding analysis found some instances where inattentiveness could affect inferences. This begs the question: can respondents be nudged toward attentiveness? Some respondents may start a survey questionnaire by paying close attention, but then later lose this attentiveness for reasons having to do with the survey structure itself or due to other distractions in their environment (Ansolabehere and Schaffner, Reference Ansolabehere and Schaffner2015). If this is true, then researchers may benefit from crafting interventions that would nudge respondents who have become inattentive during the survey experience back toward paying attention to the instrument.
We test this possibility with an experiment embedded on the 2021 CES. We included the same two issue grids that we described above amid the survey questionnaire, with the crime/policing grid coming first in the survey flow and the abortion grid coming a few pages later. Of the 25,700 respondents who took the 2021 CES, 1,024 gave contradictory responses in the policing grid, saying that they supported both increasing and decreasing the number of police. These respondents were randomly assigned either to a treatment or control condition. In the treatment condition (N = 546), a follow-up question appeared, which asked the following:
You just answered that you support both of these proposals:
Increase spending on police by $10 billion a year
Decrease spending on police by $10 billion a year
Did you intend to support both of these proposals?
The intention behind this prompt was to make respondents who were not being attentive recognize that their progress was being monitored and therefore feel encouraged to be more attentive during the remainder of the survey. The control group (N = 669) did not see this prompt and simply proceeded through the survey as they normally would.
This experiment builds on work by Clifford and Jerit (Reference Clifford and Jerit2015) which uses warnings at the beginning of the survey and finds that three out of the four warnings they tested increase performance on the IMCs embedded in the survey. Others have experimented with the location of attention checks and found modest but inconsistent experimental effects (Kane and Barabas, Reference Kane and Barabas2019). Our experiment is unique in that we can directly trace the effect of this prompting on attentive rates among respondents already displaying inattentive behaviors.
Among the group that received the treatment prompt, 53% responded “yes” indicating that they meant to say that they supported both proposals while 47% said “no.” This supports the inattentive finding, as nearly half of these respondents retracted responses they gave just seconds prior. However, the treatment effects that we are interested in are whether respondents who received the prompt slowed down on the subsequent pages of the survey and were less likely to give contradictory responses when they answered the abortion grid a few pages later.
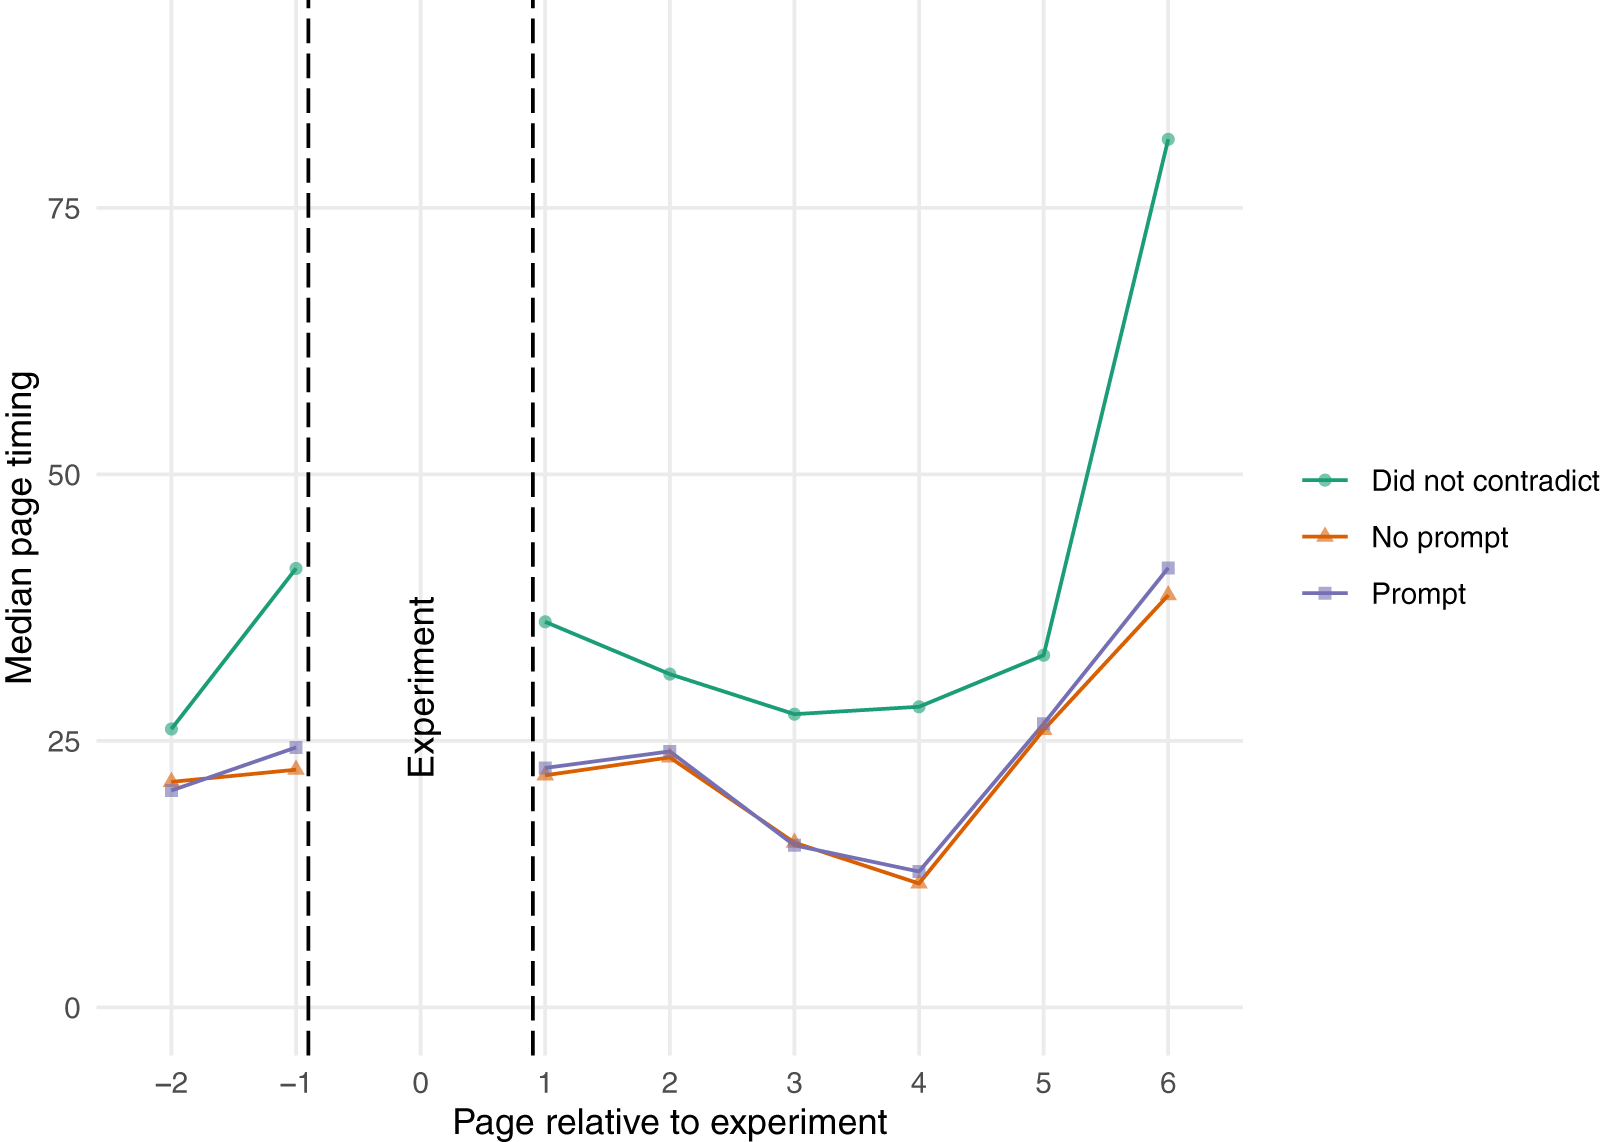
Figure 2 plots the median page timings (in seconds) for pages with grid questions before and after the page on which the experiment was conducted (the police/crime grid).Footnote 8 Although not shown, we verify with both a Mood’s median test and a traditional t-test that contradictors are significantly faster than non-contradictors on all questions. The green line with circles is the group who did not give a contradictory response on the police questions; they are shown as a reference since they were not eligible for treatment. The orange line with triangles is the control group—people who gave a contradictory response to the policing items but did not receive the prompt asking if they meant to do so. Finally, the purple line with squares represents the median page timings for those who received the prompt treatment.
Median page timings before and after experiment, 2021.

The figure shows that respondents who gave contradictory responses were moving through pages more quickly than those who did not give contradictory answers before they reached the page with the experiment. As we would expect, there is no significant difference between these groups before the treatment assignment. The lack of significance difference persists even after the treatment is assigned.Footnote 9
We expected respondents who received the prompt to take longer on subsequent pages, a sign of their increased attentiveness, but this did not happen. The page timings for the control and treatment groups remain nearly identical following the experiment and on none of the pages do we find a statistically significant difference between the medians for these two groups. Additionally, we summed the page timings for the pages after the experiment and conducted a Kolmogorov-Smirnov test of equivalent distributions between the control and treatment groups to see whether there was any evidence of heterogeneous treatment effects. The p-value for this test was large (p = 0.3583), indicating that we cannot reject the null hypothesis of equivalent distributions, an indication that there is no evidence of heterogeneous treatment effects.
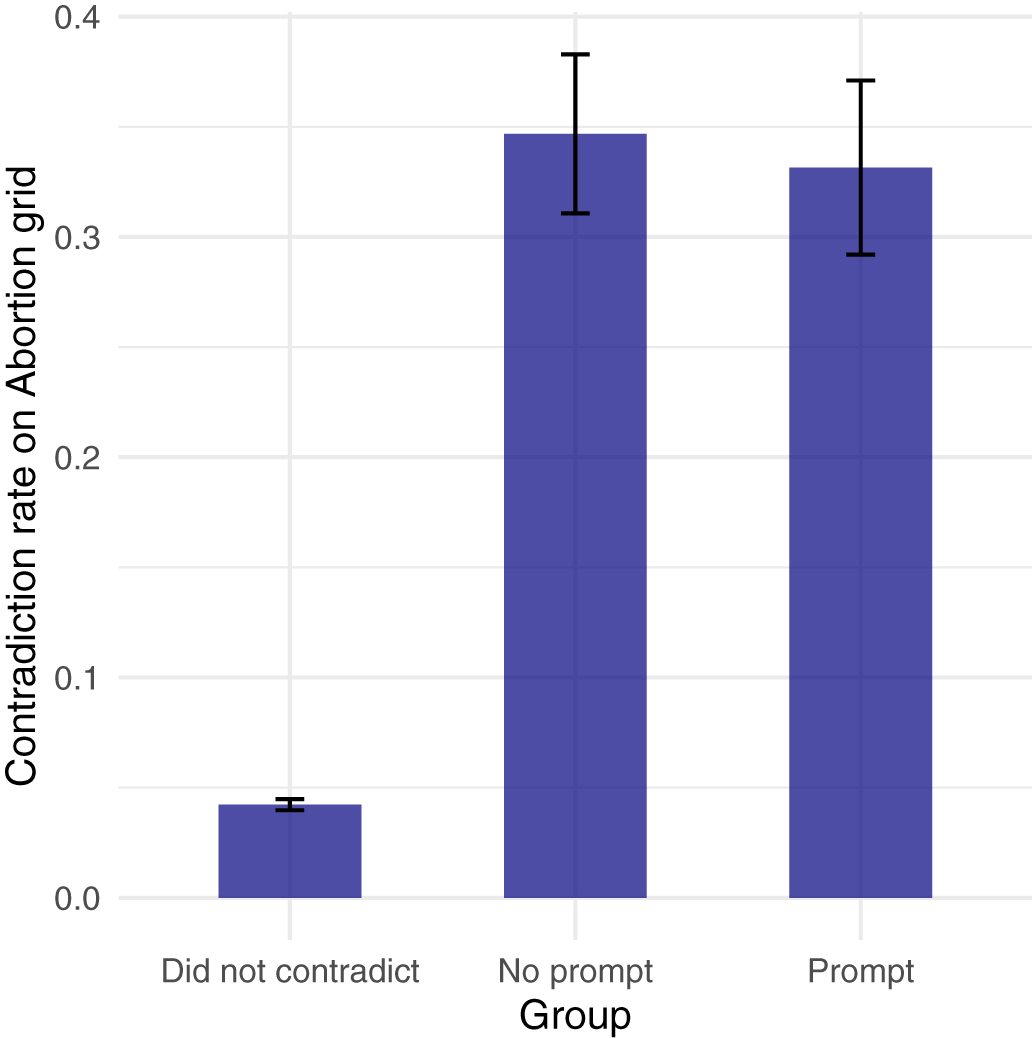
We also examine whether the prompt reduced the likelihood that respondents would contradict themselves again when they got to the abortion grid a few pages later in the survey. We present these results in Figure 3. Here, we again see null effects for the prompt treatment. Respondents in the control group who did not get the prompt gave contradictory responses again on the abortion items 35% of the time. By comparison, 33% of those who received the prompt gave contradictory responses on the abortion items—a negligible difference which does not approach conventional levels of statistical significance.
Treatment effects on contradiction rate on abortion items, 2021.

Overall, our experiment indicates that warning respondents that they have given contradictory responses does not appear to have any meaningful effect on the quality of responses they give subsequently during the survey. Our result contrasts with studies that have found that interventions can induce more attentiveness (Clifford and Jerit, Reference Clifford and Jerit2015). This null finding, while against our priors, is consistent with the continuous attention hypothesis. It is important to recall that only respondents who survived YouGov’s internal quality control measures were included in our experiment. Thus, our null finding may indicate that it is more difficult to induce attentiveness behavior among respondents who are already attentive enough to pass more basic filters. Future work that classifies respondents along the attention continuum and test if those closer to pure inattention are more or less likely to be affected by our experiment.
5.1. No evidence that question format affects attentiveness
We also investigated whether question format can induce (in)attentiveness. Recall that both question sets we study were asked in a grid format with support/oppose response options. Work examining acquiescence bias induced by questions with similar short, positive or negative binary options found no evidence to suggest questions that regurgitate or rephrase the question produce better responses (Lelkes and Weiss, Reference Lelkes and Weiss2015). In a separate experiment administered on a 2022 Lucid/Cint survey, we tested whether grids make respondents less attentive. We found no significant evidence that grids induce more inattentiveness than single-item questions; if anything, grids performed better. Further details and results of this experiment can be found in Appendix 2.3.
6. Conclusion
In this paper, we have documented the prevalence and characteristics of inattentive respondents in a high-quality self-administered online survey by identifying those who give logically contradictory answers to policy questions. Importantly, this is not an exhaustive account of the persistence of inattentive behaviors following attention checks, but rather an analysis of one type of inattentiveness that lends itself to retrospective observation. Other, even more subtle forms of inattentiveness are likely also at play.
Our findings illustrate that the vast majority of respondents appear to give logical answers, some are flagged as attentive for much, but not all, of the survey, and then a very small group is flagged as mostly inattentive throughout the survey. Those engaging in persistent contradicting made up just 2% of a high-quality online sample, one that had already applied a series of filters to identify and drop inattentive respondents. Another 7–8% gave contradictory responses on one but not both occasions, suggesting sporadic disengagement with the survey. The former group completes the survey much more quickly than others, engages in more straightlining, and is less likely to participate in a follow-up survey. Notably, however, this group also tends to be comprised of harder to recruit and less politically interested respondents. In other words, the very respondents who are most difficult to recruit to ensure a representative sample are also those who are least likely to provide quality responses. On one hand, the least attentive respondents tend to take on the demographic traits of the most difficult to recruit groups, dropping them can have negative consequences for the representativeness of the sample. On the other, they may systemically differ from their attentive peers, thereby biasing treatment effects, toplines, or other results. While large-N estimations appear unaffected by the inclusion of these respondents, omitting contradictory respondents can lead to meaningful changes in treatment effects and toplines for very small samples.
More attention should be given to further understanding the inattentive respondents who contradict only once. This pattern reflects the notion that attentiveness is best conceptualized on a continuum (Berinsky et al., Reference Berinsky, Margolis, Sances and Warshaw2021). One notable limitation of our approach is that both contradictory question sets occur in close proximity to each other within the survey. We are thus unable to comment on the nature of attentiveness across the full survey experience, and cannot distinguish between theories about latent attention and transitory attention. Our experiments testing question type and direct intervention with the respondent failed to change behavior, indicating that the behavior may be difficult to alter during the survey experience, at least for respondents who are sufficiently attentive to have survived YouGov’s own quality filters.
Ultimately, how survey researchers treat inattentive respondents should depend on the types of analyses that they are carrying out with survey data. The low-level measurement error caused by these respondents is unlikely to matter for the preponderance of cases where surveys are used in research. But in particular circumstances—small-N cases—researchers may want to guard against the possibility of inattentive respondents.
Supplementary material
The supplementary material for this article can be found at https://doi.org/10.1017/psrm.2025.10065. To obtain replication material for this article, https://doi.org/10.7910/DVN/CNL2XA.
Acknowledgement
We thank Marissa Shih for her thoughtful suggestions and feedback on this paper.
Funding Statement
Funding was provided by the National Science Foundation, Awards # 1948863 and 2148907.
Competing Interests
None.






 Open access

