


Introduction
Short-term glacier velocity variations have been observed on alpine glaciers (e.g. Reference Iken and BindschadlerIken and Bindschadler, 1986; Reference Naruse, Fukami and AniyaNaruse and others, 1992; Reference Mair, Nienow, Willis and SharpMair and others, 2001; Reference GudmundssonGudmundsson, 2002) and on the major ice sheets (e.g. Reference Zwally, Abdalati, Herring, Larson, Saba and SteffenZwally and others, 2002; Reference DasDas and others, 2008; Reference Stearns, Smith and HamiltonStearns and others, 2008; Reference Bartholomew, Nienow, Mair, Hubbard, King and SoleBartholomew and others, 2010). These events typically occur in response to sudden water inputs to the subglacial drainage system, which increase the subglacial water pressure, P w, and thereby reduce the effective pressure, P e, at the glacier bed (P e = P i − P w, where P i is the ice overburden pressure). Basal sliding generally increases with lower effective pressure, so the glacier speeds up in response to the water input (Reference LliboutryLliboutry, 1958; Reference IkenIken, 1981; Reference Iken and BindschadlerIken and Bindschadler, 1986; Reference Hooke, Calla, Holmlund, Nilsson and StroevenHooke and others, 1989).
The impact that a water input has on the effective pressure depends on the efficiency of the subglacial drainage system (Reference Raymond, Benedict, Harrison, Echelmeyer and SturmRaymond and others, 1995; Reference Fountain and WalderFountain and Walder, 1998). As water inputs to the subglacial drainage system increase, the system evolves from an inefficient, linked-cavity system to an efficient, channelized system (Reference Fountain and WalderFountain and Walder, 1998). Subglacial cavities occur in the lee of bedrock steps, and their location, size and spacing are primarily determined by the bedrock roughness (Reference LliboutryLliboutry, 1968; Reference Kamb and EngelhardtKamb and Engelhardt, 1987). Subglacial channels, in contrast, open due to an imbalance between wall melt caused by heat dissipation in the flowing water and inward creep of the surrounding ice; this imbalance favors channel growth when water inputs are high, and channel closure when water inputs are low (Reference RöthlisbergerRöthlisberger, 1972). The channelized system transports water at a high effective pressure, but the linked-cavity system requires a much lower effective pressure to transport the same water flux (Reference SchoofSchoof, 2010). This relationship between the drainage system efficiency and effective pressure, however, is only true if the system is in steady state (Reference RöthlisbergerRöthlisberger, 1972). If the system is not in steady state, low effective pressures can occur even if the subglacial drainage system is channelized and efficient (Reference SchoofSchoof, 2010). Consequently, short-term velocity variations typically occur during sudden water inputs to the subglacial drainage system, such as during rain events, diurnal melt cycles and lake outburst events (e.g. Reference IkenIken, 1981; Reference Mair, Nienow, Willis and SharpMair and others, 2001; Reference Sugiyama, Bauder, Riesen and FunkSugiyama and others, 2010).
The contribution of short-term velocity variations to annually averaged glacier motion remains poorly constrained. Annually averaged glacier motion alters a glacier’s mass balance and thereby its contribution to sea-level rise, so understanding the impact of these velocity variations on annual glacier motion is critically important for future sea-level rise predictions (Reference Vaughan and StockerVaughan and others, 2013). Long-term observations and modeling studies (Reference Zwally, Abdalati, Herring, Larson, Saba and SteffenZwally and others, 2002; Reference Parizek and AlleyParizek and Alley, 2004) have suggested that short-term velocity variations increase annual glacier motion by increasing summertime velocities. If this is the case, then annual glacier velocities may increase in a warming climate due to greater meltwater inputs and more frequent rainstorms (Reference Parizek and AlleyParizek and Alley, 2004). However, other studies (Reference Van de WalVan de Wal and others, 2008; Reference Sundal, Shepherd, Nienow, Hanna, Palmer and HuybrechtsSundal and others, 2011; Reference TedstoneTedstone and others, 2013) have suggested that short-term velocity variations do not increase annual glacier motion, because higher summertime velocities are offset by lower wintertime velocities due to a more efficient subglacial drainage system. If this is the case, then annual glacier motion may decrease or remain constant in a warming climate with greater water inputs (Reference Burgess, Larsen and ForsterBurgess and others, 2013; Reference ShannonShannon and others, 2013).
Most studies that have investigated short-term velocity variations have focused on continental mountain glaciers or the major ice sheets. However, these glaciers may not be representative of maritime glaciers in Alaska, Patagonia or New Zealand, which are some of the fastest-changing glaciers in the world (Reference Radić and HockRadić and Hock, 2011). Maritime glaciers experience much higher ablation and precipitation rates than continental glaciers, so their subglacial drainage systems are likely more efficient throughout the year. These glaciers may therefore have a different response to water inputs. A better understanding of the dynamics of maritime glaciers may provide additional insight into the relationship between water inputs and glacier velocity in a warmer, wetter climate, when subglacial drainage systems will likely be more efficient.
In this study, we investigate the relationship between water inputs and glacier velocity on the lower Franz Josef Glacier, New Zealand (43°29′S, 170°10′E; Fig. 1), where heavy rain (7 m w.e. a−1) and glacier melt (20 m w.e. a−1) occur year-round (Reference Anderson, Lawson, Owens and GoodsellAnderson and others, 2006). A large stream exits the terminus of Franz Josef Glacier throughout the year, indicating that the subglacial drainage system is highly efficient. Yet seasonal velocity variations still occur on this glacier and indicate a seasonal evolution of the subglacial drainage system (Reference Anderson, Willis, Goodsell, Banwell, Owens and LawsonAnderson and others, 2014). Rain-induced velocity variations have also been observed on this glacier (Reference Anderson, Willis, Goodsell, Banwell, Owens and LawsonAnderson and others, 2014) and other nearby New Zealand glaciers (Reference Purdie, Brook and FullerPurdie and others, 2008), but these studies used daily- to weekly-averaged velocities and therefore did not consider the dynamic response of the glacier during the observed speed-up events. We use high spatial and temporal resolution velocity measurements to assess the dynamics of this glacier on a daily to diurnal timescale in austral summers 2010/11 and 2012/13. We explain the observed temporal and spatial variations in glacier flow in terms of the water input variability and subglacial drainage system configuration.
Franz Josef Glacier. (a) Star in inset map indicates the location of Franz Josef Glacier in New Zealand. The Waiho River originates from the glacier terminus. (b) We installed 20 ablation stakes (white circles) and six GNSS stations (black circles; G01–G06) on the lower glacier from 3 to 20 March 2011. Three of the ablation stakes were located near G01 and are not included in this figure. From 21 January to 15 April 2013, we installed one GNSS station (black circle; G07). Black arrows show the average glacier velocity at each GNSS station. Dashed curve indicates the location of the surface and bedrock topographies shown in Figure 2. The black box indicates the region shown in Figures 5 and 7. Coordinates are given in the New Zealand Transverse Mercator (NZTM) system.

Franz Josef Glacier
Franz Josef Glacier is located on the western flank of the Southern Alps, New Zealand. The glacier extends 11 km from an altitude of 2900 m a.s.l. to 300 m a.s.l. and consists of a large snowfield and a steep glacier tongue. The ice thickness is poorly constrained, but bed measurements and mass-conservation interpolations indicate that the ice thickness increases from ∼50–150 m near the glacier terminus to 200–250 m in the snowfield (Fig. 2; Reference Anderson, Willis, Goodsell, Banwell, Owens and LawsonAnderson and others, 2014). Over the last two decades, the glacier has experienced several retreat/advance cycles (Reference Anderson, Lawson, Owens and GoodsellAnderson and others, 2006, Reference Anderson, Willis, Goodsell, Banwell, Owens and Lawson2014; Reference Purdie, Anderson, Chinn, Owens, Mackintosh and LawsonPurdie and others, 2014). From 2000 to 2012, the glacier decelerated and thinned during years of retreat and accelerated and thickened during years of advance (Reference Anderson, Willis, Goodsell, Banwell, Owens and LawsonAnderson and others, 2014). It has been thinning and retreating since 2010/11.
Surface topography in 2011 (gray) and inferred bed topography (black; Reference Anderson, Willis, Goodsell, Banwell, Owens and LawsonAnderson and others, 2014) along the dashed curve in Figure 1.

Methods
Glacier motion
Glacier velocity
To measure glacier velocity, we installed six global navigation satellite system (GNSS) stations (G01–G06; one Trimble 5700 and five Trimble NetRS) across the lower glacier from 3 to 20 March 2011, and one station (G07; Trimble NetRS) from 21 January to 15 April 2013 (Fig. 1). Stations G01–G04 formed a rectangular grid between the terminus and the first icefall, with an average spacing of 150 m. We installed stations G05 and G06 along the center line above the first major icefall with a spacing of 200 m. In January 2013, we installed station G07 ∼100 m up-glacier from the position of G06 in 2011. Stations G01–G06 recorded GNSS data every 15 s and station G07 recorded data every 30 s. During both field seasons, the stations failed occasionally, due to inadequate solar recharge. Station failure frequently coincided with rain events because of the cloudy conditions during these events (e.g. Figs 3 and 8). As a result, our velocity records are discontinuous.
We processed the GNSS data with TRACK (version 1.27; Reference ChenChen, 1998), the kinematic module of the GAMIT/GLOBK software package. For our base station, we used a New Zealand permanent network (GeoNet) station from nearby Mount Price (station code MTPR). This station was <20 km from our stations on the glacier and recorded GNSS data every 30 s. We calculated base station coordinates using NASA’s online automatic precise position service (APPS), which uses the GIPSY/OASIS software package (version 5; Reference Zumberge, Heflin, Jefferson, Watkins and WebbZumberge and others, 1997). We removed spikes in the estimated coordinates that deviated by more than two standard deviations from a 1 hour running mean and smoothed the remaining data with a 10 min running average.
To calculate ice-flow velocities, we used a 12 hour moving window to determine the best linear-least-squares fit for 12 hours of position estimates; the slope of this fit is the velocity. We found that this approach worked better than a recursive filter to calculate a smooth velocity record from the discontinuous position estimates. (A recursive filter will introduce larger gaps in the position estimates due to edge effects, but with a linear-least-squares fit we can still calculate a velocity if the gaps are small.) Both approaches provided calculated velocities that agreed to within their uncertainty estimates.
We estimated position uncertainty from a GNSS station installed on bedrock ∼1.5 km down-valley from the glacier terminus during our field season in March 2011. We originally intended to use this station as our base station for GNSS processing, but intermittent failures and poor satellite coverage made it unsuitable. We processed the data at the rock site following the same technique used for the kinematic sites on the glacier and used short-term deviations from its long-term calculated coordinates as an indication of position uncertainty. Average position uncertainties in March 2011 were 9, 8 and 17 mm in the east, north and vertical directions, respectively. The rock site was not operational during our 2013 field season, so we used the average position uncertainty estimates from 2011 for all 2013 position estimates. We determined velocity uncertainty from the least-squares fit to the 12 hours of position estimates, following Reference York, Evensen, Martínez and DelgadoYork and others (2004). The velocity uncertainty, which depends on the number of position estimates used in the least-squares fit, increases when there are fewer position estimates in the 12 hour moving time window. Horizontal velocity uncertainties were in the range 2–12 mm d−1, with an average value of 4 mm d−1.
Strain rates
To interpret the observed spatial variations in glacier flow, we estimated horizontal strain rates from our measurements in austral summer 2010/11 using two different methods, which highlight (1) the spatial pattern in strain rates and (2) their temporal evolution. Our first method uses the deformation of strain triangles formed by five stations (G01–G05) to determine the spatial pattern in strain rates before and during periods of rapid glacier motion. We find the principal strain rates and directions for each strain triangle, following Reference Mair, Nienow, Willis and SharpMair and others (2001).
Our second method considers the temporal evolution of longitudinal strain rates between our most-downstream, operational station (G02) and our most-upstream, operational station (G05 or G06). The average longitudinal strain rate,  , between two stations with velocities u
1 and u
2, which are separated by a distance D is
, between two stations with velocities u
1 and u
2, which are separated by a distance D is

The uncertainty in the calculated strain rate,  , is then

where Δu 1 and Δu 2 are the velocity uncertainties at the two stations (Reference Van der VeenVan der Veen, 2013, p. 13). Horizontal strain-rate uncertainties were 0.4–1 .7 ± 10−5 d−1, which is an order of magnitude smaller than the estimated strain rates. We do not calculate vertical strain rates or bed separation (unlike, e.g., Reference AndersonAnderson, 2004; Reference Howat, Tulaczyk, Waddington and BjörnssonHowat and others, 2008), due to the low signal-to-noise ratio of our vertical position estimates and incomplete knowledge of ice thickness. However, our rough estimates indicate that the vertical motion due to vertical strain and bed separation is likely less than our vertical uncertainty estimates of ∼3–4 cm.
Water inputs
The braided Waiho River originates at the terminus of Franz Josef Glacier (Fig. 1). The river discharge therefore reflects both the magnitude and timing of water leaving the subglacial drainage system. However, we were unable to measure river discharge, due to the difficulties of working near a fast-flowing, braided river system; we instead estimated river discharge on an hourly time step, using a linear-reservoir discharge model (Reference Baker, Escher-Vetter, Moser, Oerter and ReinwarthBaker and others, 1982). Following Reference AndersonAnderson and others (2010), we split the Franz Josef catchment into three reservoirs (slow, medium and fast) with different storage constants, k slow, k med and k fast. We used the same storage constants as those tuned to Storglaciären, Sweden (Reference Hock and NoetzliHock and Noetzli, 1997), and to nearby Brewster Glacier, New Zealand (Reference AndersonAnderson and others, 2010). In late summer, Brewster Glacier has a similar hydraulic system (Reference Willis, Lawson, Owens, Jacobel and AutridgeWillis and others, 2009) to that at Franz Josef Glacier (Reference Anderson, Willis, Goodsell, Banwell, Owens and LawsonAnderson and others, 2014), so we anticipate that these two glaciers should have similar summertime storage constants. The slow reservoir (k slow = 350) encompassed all water inputs >2000 ma.s.l., the medium reservoir (k med = 30) included water inputs between 1800 and 2000 m a.s.l. and the fast reservoir (k fast = 16) included water inputs <1800 m a.s.l. and all inputs off the glacier.
To quantify water inputs from glacier melt and seasonal snowmelt, we calculated melt on an hourly time step using a distributed energy-balance model (Reference AndersonAnderson and others, 2010, Reference Anderson, Willis, Goodsell, Banwell, Owens and Lawson2014). The model used weather data (precipitation, air temperature, relative humidity and wind speed) recorded by the National Institute of Water and Atmospheric Research (NIWA) at Franz Josef Village (Fig. 1). We tuned the model to Franz Josef Glacier by adjusting the roughness parameters for snow and ice to 0.008 and 0.030 m, respectively, so that the difference between modeled and measured ablation rates was minimized at the ablation stakes that we installed in March 2011 (Fig. 1). During our 2011 field season, we drilled 20 PVC 2 m long pipes into the ice. We measured ablation at these stakes every 1–3 days, by recording the height of the stake relative to the top of an ice-axe placed up-glacier of the ablation stake. The average absolute error between the 155 measured and modeled ablation rates was 2 cm d−1.
To determine water inputs from rain, we extrapolated the hourly rain totals from Franz Josef Village across the catchment area using an average annual precipitation surface developed by Reference StuartStuart (2011), who interpolated all weather station data available for this region. The precipitation surface provided a more accurate representation of precipitation rates at varying altitudes than a simple precipitation lapse rate. Precipitation rates at Franz Josef Glacier are thought to increase from the coast to an elevation of ∼600 m a.s.l. and then decrease again at higher elevations (Reference Anderson, Lawson, Owens and GoodsellAnderson and others, 2006; Reference StuartStuart, 2011).
We compared the modeled river discharge with river stage recorded by the West Coast Regional Council from 1 April 2010 to 1 January 2011, at the State Highway 6 Bridge, which is ∼5 km from the glacier terminus. River stage was not recorded after this time period, so we do not have river stage measurements for our field seasons. During the 8 month period when measured river stage and modeled river discharge overlapped, the two records were highly correlated, with R 2 = 0.79. However, because there is no rating curve to relate river stage to discharge, the stage record provides no further data to constrain the storage constants in our linear-reservoir discharge model. Consequently, we only use the modeled discharge values qualitatively to compare the magnitude of different water inputs and to relate the timing of velocity and discharge peaks.
Results
Glacier motion in 2011
Average glacier velocities from 3 to 20 March 2011 ranged from 0.40 ± 0.01 m d−1 at station G01 to 0.64 ± 0.01 m d−1 at station G06 (Fig. 1). At the beginning of the study period, ice-flow velocities were 30–60% above average, following a large rain event that occurred 2 days before the stations were installed (Fig. 3). Glacier velocity also increased at all operational stations during rain events on 14–15 March (rainfall of 42 mm over 12 hours) and 16–17 March (17 mm over 10 hours), but at only one operational station during the rain event on 18–19 March (19 mm over 17 hours). Glacier velocity did not increase noticeably during rain events with an average rain rate of 1.3 mm h−1 or less on 4 March (5 mm over 13 hours), 5 March (5 mm over 9 hours) and 11 March (13 mm over 10 hours). Glacier velocity also varied on a diurnal timescale, but not all of these diurnal velocity variations coincided with the diurnal melt cycle.
Glacier velocity at stations G01–G06 in March 2011. (a) Modeled river discharge, (b) rain rate, (c) daily-averaged (black) and hourly (gray) air temperatures and (d) glacier velocity at stations G01–G06. Velocity uncertainty estimates are smaller than the marker size.

To estimate the velocity increase during rain events and diurnal melt cycles, we compared the peak velocity associated with the event with the velocity directly before the event. For example, when rain started at 19:00 on 14 March, glacier velocity at the only operational station, G02, was 0.33 ± 0.01 m d−1. Glacier velocity increased ∼1 hour later and reached a peak velocity of 0.63 ± 0.01 m d−1 ∼2 hours after the rain ended, at 07:00 on 15 March. The total velocity increase was 0.30 ± 0.02 m d−1 (91 ± 6%) during this event, which was our largest measured increase in glacier velocity during both austral summers, 2010/11 and 2012/13. Although the other stations were not operational at this time, velocities recorded before and after this event indicate that glacier velocity increased by at least 15–55% at all stations.
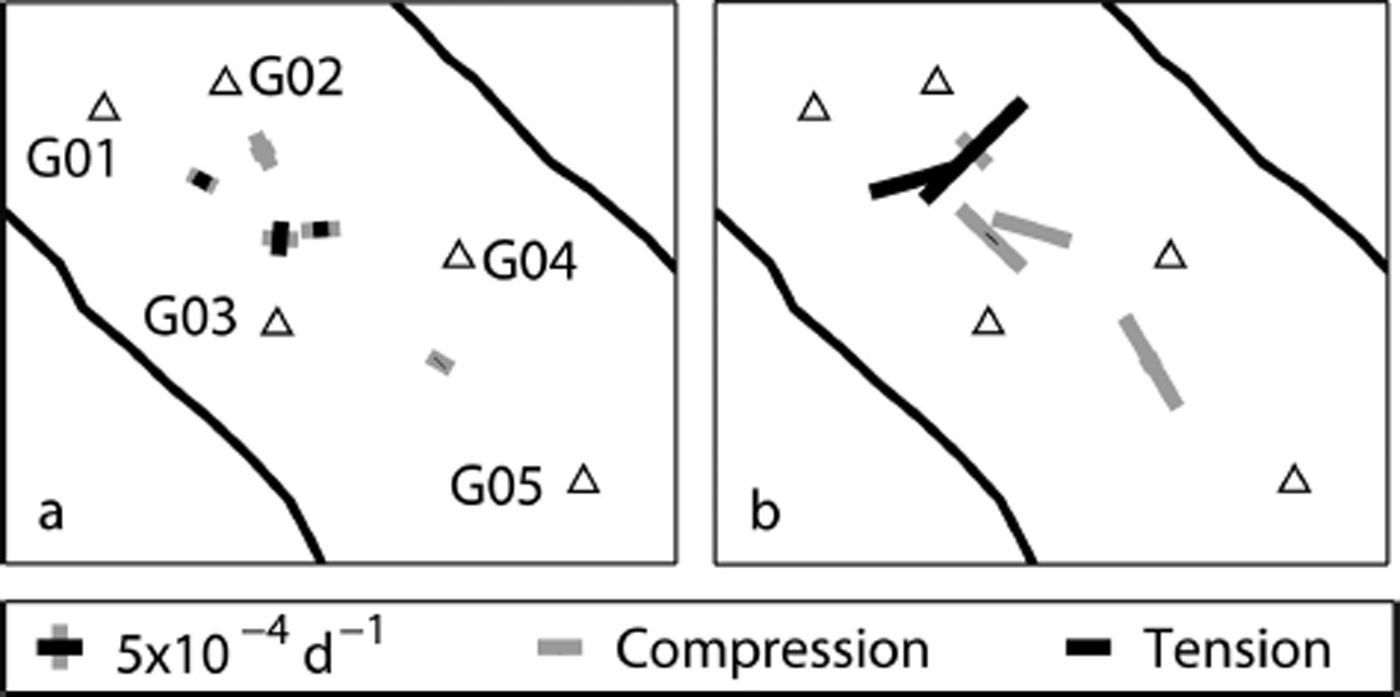
Figures 4 and 5 show glacier velocities and strain rates during the rain event on 16–17 March, which was preceded by a diurnal velocity variation on 16 March. When rain started at 15:00 on 16 March, glacier velocity increased at all stations. Glacier velocity peaked at stations G01, G02, G03 and G05 from 12:00 to 13:00 on 17 March but did not peak until 22:00 at station G04 (Fig. 4c). Peak velocities ranged from 37% to 51% above the velocities directly before the event. The longitudinal strain rate between stations G02 and G05 indicates that glacier flow became less compressive between the two stations during the rain event, eventually transitioning to near-zero longitudinal strain rates around the time of peak velocities (Fig. 4d). Figure 5 shows that the near-zero longitudinal strain rates resulted from longitudinal extension near stations G01–G04, but that longitudinal compression increased above these stations. Furthermore, transverse extension occurred near stations G01–G04, indicating glacier flow towards the margins (Fig. 5). After the rain ended, the downstream transverse extension and upstream longitudinal compression subsided. From 12:00 to 14:00 on 18 March, glacier velocity increased at stations G02, G03 and G05. Glacier velocity increased 4 hours later at station G01 during the 18–19 March rain event.
Glacier velocity during the rain event on 16–17 March 2011. (a) Modeled river discharge, (b) rain rate, (c) glacier velocity at stations G01–G06 and (d) longitudinal strain rate between stations G02 and G05. A positive strain rate indicates extension and a negative strain rate indicates compression. Strain-rate and velocity uncertainties are smaller than the marker size.

Principal strain axes and rates from the strain triangles formed by stations G01–G05 (triangles) during the rain event on 16–17 March 2011. Strain rates (a) before the rain event (21:00 on 16 March) and (b) during the rain event (10:00 on 17 March). Black and gray axes indicate tension and compression, respectively.

Figure 6 shows diurnal velocity variations during the rainfree period 6–11 March 2011. We find a diurnal cycle in glacier velocity at stations G02 and G04 (Fig. 6b) and at stations G05 and G06 (Fig. 6d). Peak velocities occurred from 12:00 to 16:00 at stations G05 and G06 but did not occur until 20:00–01:00 at stations G02 and G04. Glacier velocities varied by 0.03–0 .09 m d−1 (5–20%) at these stations during the diurnal melt cycle. We find no diurnal, repeating trends in glacier velocity at stations G01 and G03 (Fig. 6c). Longitudinal compression between stations G02 and G05 increased in the afternoon and decreased at night (Fig. 6e). The diurnal variations are superimposed on a long-term decrease in glacier velocity and longitudinal compression, which is likely a result of the rain event that occurred on 2–3 March 2011, before the stations were installed. Figure 7 shows the spatial pattern in strain rates during the night (04:00) and afternoon (16:00) on 7 March. When glacier velocity increased during the afternoon at stations G05 and G06, we find upstream longitudinal compression and downstream transverse extension. When glacier velocity increased during the night at stations G02 and G04, we find much smaller strain rates, which primarily indicate longitudinal and transverse compression across the lower glacier. We find the same diurnal strain-rate pattern on 7 March, which was the only other rain-free day when all stations were operational.
Diurnal velocity variations from 6 to 11 March 2011. (a) Modeled river discharge, (b) glacier velocity at stations G02 (black) and G04 (gray), (c) glacier velocity at stations G01 (black) and G03 (gray), (d) glacier velocity at stations G05 (black) and G06 (gray) and (e) longitudinal strain rate between stations G02 and G06. A positive strain rate indicates extension, and a negative strain rate indicates compression. Strain-rate and velocity uncertainties are smaller than the marker size.

Principal strain axes and rates from the strain triangles formed by stations G01–G05 (triangles) during (a) the night (04:00) and (b) the afternoon (16:00) on 7 March 2011. Black and gray axes indicate tension and compression, respectively.
Glacier motion in 2013
Figure 8 shows glacier velocity at station G07 from 21 January to 15 April 2013. Glacier velocities ranged from 0.37 ± 0.01 to 0.77 ± 0.01 m d−1, with an average velocity of 0.53 ± 0.01 m d−1. The average glacier velocity at station G07 was 0.11 ± 0.02 m d−1 less than the average velocity at roughly the same location (G06) in March 2011. During rainfall events with an average rain rate of 1.5 mm h−1 or more on 3–4 February (108 mm over 24 hours), 17–18 March (33 mm over 21 hours), 24–25 March (78 mm over 42 hours) and 30 March–1 April (49 mm over 32 hours), glacier velocity increased by 24–52%. Glacier velocity did not increase noticeably during rain events with an average rain rate of 0.8 mm h−1 or less on 11 February (4 mm over 5 hours), 2 March (2 mm over 5 hours) and 29 March (9 mm over 11 hours). This rain-rate threshold for short-term velocity variations was similar to the threshold we found in March 2011.
Glacier velocity at station G07 from 21 January to 15 April 2013. (a) Modeled river discharge, (b) rain rate, (c) daily-averaged (black) and hourly (gray) air temperatures and (d) glacier velocity at station G07. Velocity uncertainty estimates are smaller than the marker size.

Figure 9 shows glacier motion during the rain event on 17–18 March. Glacier velocity started to increase at 06:00 on 17 March, which was around the time that glacier velocity typically started to increase in response to diurnal meltwater inputs (see next paragraph). The rain started 3 hours later at Franz Josef Village. The maximum velocity, which was 0.20 ± 0.02 m d−1 (45 ± 5%) above the velocity directly before the rain event, occurred 1 hour after the peak modeled river discharge. The velocity remained elevated for the next 7 days.
Glacier velocity at station G07 during the rain event on 17–18 March 2013. (a) Modeled river discharge, (b) rain rate and (c) glacier velocity. Note that the glacier velocity remained elevated for ∼7 days following the rain event. Velocity uncertainty estimates are smaller than the marker size.

Glacier velocity also increased in response to diurnal melt cycles on 35 of the 47 rain-free days from 21 January to 15 April 2013 (Fig. 8). Peak velocities ranged from 4 to 33% above night-time velocities and typically occurred from 12:00 to 14:00. Figure 10 shows stacked daily velocities and discharge for two periods with diurnal velocity variations and two periods without diurnal velocity variations (cf. Reference Sugiyama and GudmundssonSugiyama and Gudmundsson, 2004). During both periods with diurnal velocity variations (Fig. 10a and c), peak modeled discharge occurred around 18:00. The peak modeled discharge and glacier velocity were greater from 24 January to 2 February (black curves) than from 14 to 19 February (red curves), because the peak air temperature was ∼4°C warmer during this time. From 24 January to 2 February, ice-flow velocities reached a minimum at 22:00 and a maximum at 12:00; peak velocities were 0.06 ± 0.01 m d−1 (12 ± 4%) greater than the minimum velocities. From 14 to 19 February, ice-flow velocities were at a minimum at 23:00 and at a maximum at 14:00; peak velocities were 0.05 ± 0.01 m d−1 (11 ± 4%) greater than minimum velocities. Modeled river discharge was smaller during periods without diurnal velocity variations (Fig. 10b) than during periods with diurnal velocity variations (Fig.10a).
Daily stacked glacier velocity and modeled river discharge at station G07 during (a, c) two periods with diurnal velocity variations and (b, d) two periods without diurnal velocity variations. (a) Modeled discharge during the two periods with diurnal velocity variations, (b) modeled discharge during the two periods without diurnal velocity variations, (c) glacier velocity during the two periods with diurnal velocity variations and (d) glacier velocity during the two periods without diurnal velocity variations. Black and red curves in (a) and (c) indicate data from 24 January to 2 February and 14 to 19 February, respectively. Black and red curves in (b) and (d) indicate data from 5–7 March and 19–21 March, respectively. Dashed red and black curves indicate the hourly-averaged velocity and discharge over the given time periods.

Discussion
Rain events
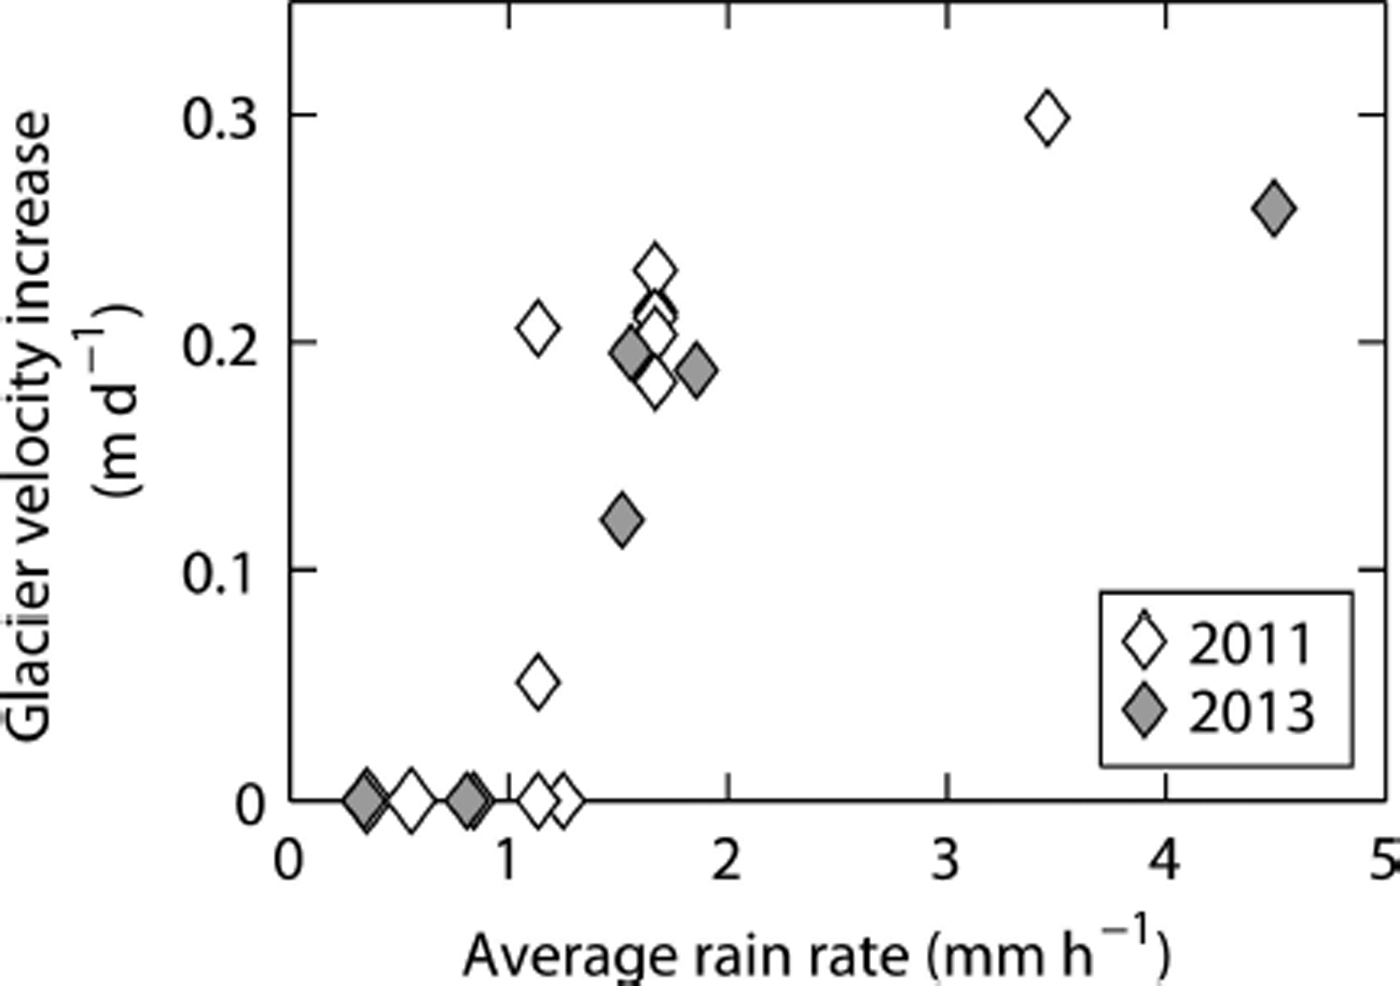
Glacier velocity increased at Franz Josef Glacier during rain events with an average rain rate of 1.3 mm h−1 or more during austral summers 2010/11 and 2012/13 (Fig. 11). This single rain-rate threshold may be simplistic since it does not take into account spatial or temporal variations in the subglacial drainage system efficiency (Reference SchoofSchoof, 2010). However, we find a similar rain-rate threshold for both summers, which may indicate that the subglacial drainage system was similarly efficient during both summers. Furthermore, the relationship between glacier velocity and average rain rate supports the idea that the subglacial water pressure may be more sensitive to the rate of water input than its total magnitude (Reference Bartholomaus, Anderson and AndersonBartholomaus and others, 2008; Reference SchoofSchoof, 2010).
Glacier velocity increase as a function of the average rain rate during the observed rain events in 2011 (white) and 2013 (gray). We quantify the average rain rate as the total rain divided by the time over which the rain event occurred. Glacier velocity did not increase during rain events that fall on the x-axis (glacier velocity increase of 0 m d−1).
After the rain started, glacier velocity increased within several hours (Figs 4 and 9). The rapid response indicates that rainwater quickly reached the glacier bed, where it increased the subglacial water pressure and caused enhanced basal sliding (Reference IkenIken, 1981; Reference Raymond, Benedict, Harrison, Echelmeyer and SturmRaymond and others, 1995). Basal sliding must have been widespread across the lower glacier because glacier velocity increased at all stations during rain events in March 2011 (Fig. 4). To explain the widespread increase in glacier velocity, the rainwater input must have exceeded the capacity of the subglacial drainage system across a large area (Reference Balise and RaymondBalise and Raymond, 1985; Reference Mair, Nienow, Willis and SharpMair and others, 2001). This may have occurred as high subglacial water pressures in the channelized system drove water away from the channels and into the linked-cavity system; this behavior has been observed previously in the ‘variable pressure axis’ on Haut Glacier d’Arolla, Switzerland (Reference Hubbard, Sharp, Willis, Nielson and SmartHubbard and others, 1995).
Glacier velocity remained elevated for ∼7 days following large rain events (Figs 3 and 8). At many other glaciers (e.g. Reference IkenIken, 1981; Reference Mair, Nienow, Willis and SharpMair and others, 2001), elevated glacier motion lasts for only 2–3 days after the rain event. The prolonged response at Franz Josef Glacier may have occurred for several different reasons. First, it may indicate that rainwater persisted in the subglacial drainage system for ∼7 days, increasing the subglacial water pressure and thereby the glacier velocity (Reference Mair, Nienow, Willis and SharpMair and others, 2001). Alternatively, the sustained high velocities may have occurred as an upstream region of high subglacial water pressures and accelerated ice motion propagated downstream (Reference IkenIken, 1981; Reference Kamb and EngelhardtKamb and Engelhardt, 1987). Our energy-balance model (Reference AndersonAnderson and others, 2010) indicates that precipitation during the observed speed-up events should have fallen as rain at all elevations across the glacier, except perhaps at elevations >2900 m a.s.l., where it may have fallen as snow. If we therefore assume that the rainwater input increased the subglacial water pressure across the entire 11 km long glacier, then the trailing edge of this region of accelerated ice motion would have traveled downstream at a speed of ∼60 m h−1 for the glacier velocity to remain elevated at our stations near the terminus for 7 days. This propagation speed is similar to values observed at other glaciers (Reference Iken and BindschadlerIken and Bindschadler, 1986; Reference Jansson and HookeJansson and Hooke, 1989; Reference GudmundssonGudmundsson, 2002).
A high-pressure zone propagating downstream suggests that our stations at higher elevations (G05–G06) will have returned to normal ice flow ∼10 hours before our stations at lower elevations (G01–G04). Unfortunately, our discontinuous velocity measurements from austral summer 2010/11 are too sparse for us to determine if this was the case. However, we do find that diurnal velocity variations occurred ∼8–11 hours later at stations G02 and G04 than at stations G05 and G06 (see next subsection). This delay is similar to the delay that we expect during rain events, and therefore supports the hypothesis that glacier velocities may have remained elevated due to a region of high subglacial water pressures and accelerated ice motion propagating downstream. Furthermore, the decreasing longitudinal compression between stations G02 and G06 following the rain event on 2–3 March 2011 (Fig. 6e), may indicate that accelerated ice motion was still propagating downstream up to 7 days after the rain event.
Although glacier velocity increased at all stations during rain events, the velocity variations were not spatially uniform, as indicated by the strain-rate pattern (Figs 4d and 5). Before the rain event on 16–17 March 2011, glacier flow was largely compressive, as expected near the terminus of a land-terminating glacier. During the rain event, however, glacier flow became more compressive upstream of stations G03 and G04, but extensional in the transverse and longitudinal directions below these stations. This transverse extension indicates ice flow towards the margins, which has been observed during speed-up events on other alpine glaciers (Reference GudmundssonGudmundsson, 2002; Reference Vieli, Jania, Blatter and FunkVieli and others, 2004; Reference Sugiyama, Bauder, Riesen and FunkSugiyama and others, 2010).
Transverse extension can occur through several different mechanisms during glacier speed-up events. First, it can occur due to increased longitudinal compression, which occurs as a region of accelerated ice motion propagates downstream (Reference Sugiyama, Bauder, Riesen and FunkSugiyama and others, 2010). The longitudinal, transverse and vertical strain rates are related through mass continuity  , so increased longitudinal compression,
  , must be balanced by extension in the transverse,
  , or vertical,
  , directions. Although the valley side-walls may prevent transverse extension near the edges of the glacier, the center of the glacier may still extend transversely, through the narrowing of surface crevasses that are oriented with a component parallel to ice flow. Our observations of upstream longitudinal compression and downstream transverse extension (Fig. 5) are consistent with this explanation.
Transverse extension can also occur when the subglacial water pressure exceeds the ice overburden pressure across a limited part of the glacier, causing the glacier to separate from its bed. When the vertical motion associated with the bed separation is transmitted to the surface, it includes transverse, longitudinal and vertical components (Reference Sugiyama, Bauder, Riesen and FunkSugiyama and others, 2010). Our vertical position uncertainty estimates are too large to negate or confirm this hypothesis. However, during diurnal melt cycles in March 2011 (Fig. 7), transverse extension occurred below the first icefall during the afternoon, but the glacier velocity did not increase in this region at this time (Fig. 6). Consequently, an elevated subglacial water pressure likely cannot explain the observed transverse extension during diurnal melt events. We suggest that the observed transverse extension during rain events and diurnal melt cycles likely occurs due to the same mechanism. If this is the case, then the transverse extension would have to have occurred due to accelerated ice motion propagating downstream (cf. Reference Sugiyama, Bauder, Riesen and FunkSugiyama and others, 2010; Reference Anderson, Willis, Goodsell, Banwell, Owens and LawsonAnderson and others, 2014). This result is consistent with our observations of elevated glacier motion for 7 days following large rain events.
Diurnal melt cycles
Diurnal velocity variations occurred on the lower Franz Josef Glacier during both austral summers, 2010/11 and 2012/13. Larger diurnal velocity variations generally occurred during warmer periods with larger modeled river discharge (Fig. 10). This relationship between daily melt intensity and the magnitude of diurnal velocity variations has been observed on other glaciers around the world (e.g. Reference NienowNienow and others, 2005; Reference Shepherd, Hubbard, Nienow, King, McMillan and JoughinShepherd and others, 2009).
In contrast to our observations during rain events, diurnal velocity variations did not occur at the same time at all stations across the lower glacier (Fig. 6). At stations G05, G06 and G07 (above the first icefall) glacier velocity increased throughout the day and reached a maximum in the afternoon (12:00–14:00), when water inputs to the subglacial drainage system were greatest. These stations behaved as expected in response to a local forcing in the subglacial water pressure (Reference NienowNienow and others, 2005). At stations G02 and G04 (below the first icefall), however, glacier velocity reached a maximum 8–11 hours later, at 20:00–01:00. We suggest that these diurnal velocity variations may have been delayed because they were driven by upstream changes in the subglacial water pressure rather than by local changes. Consequently, the region of high subglacial water pressures and accelerated ice motion took time to propagate downstream (Reference GudmundssonGudmundsson, 2002; Reference Vieli, Jania, Blatter and FunkVieli and others, 2004). The region moved downstream with a velocity of 50–100 m h−1, which is similar to values observed on other alpine glaciers (Reference Iken and BindschadlerIken and Bindschadler, 1986; Reference Jansson and HookeJansson and Hooke, 1989; Reference GudmundssonGudmundsson, 2002) and our inferred value during rain events.
The strain-rate pattern further illustrates that the diurnal velocity variations at stations G02 and G04 likely originated from an upstream forcing. Although the strain-rate pattern was similar to the strain-rate pattern during rain events (Figs 4–7), both the magnitude and spatial extent of longitudinal compression were much greater during diurnal melt events than during the rain event on 16–17 March 2011. During the afternoon diurnal speed-up events, longitudinal compression increased above and below the first icefall. This likely indicates that basal sliding increased at higher elevations above the first icefall, but did not increase at lower elevations. This spatially variable response may indicate that the subglacial drainage system decreases in efficiency upstream (Reference Mair, Nienow, Willis and SharpMair and others, 2001).
A spatially variable subglacial drainage system efficiency may also help explain the lack of diurnal velocity variations at stations G01 and G03. We infer that a large subglacial channel likely flowed along the west side of the valley underneath these stations during our 2010/11 field season, because a large waterfall flowed under the glacier margin ∼300 m downstream of station G01 on the west side. In mid-January 2012, the region near station G01 collapsed, exposing a large stream. If a subglacial channel flowed underneath stations G01 and G03, then the diurnal water pressure variations in the channel may have been too small to cause diurnal velocity variations (Reference Mair, Nienow, Willis and SharpMair and others, 2001).
Subglacial drainage system
Although the large river exiting the terminus of Franz Josef Glacier indicates a highly efficient subglacial drainage system, our results indicate that the subglacial drainage system likely decreases in efficiency upstream. Our results are supported by subglacial hydrology modeling on Franz Josef Glacier (Reference Anderson, Willis, Goodsell, Banwell, Owens and LawsonAnderson and others, 2014). In particular, Reference Anderson, Willis, Goodsell, Banwell, Owens and LawsonAnderson and others (2014) find an inefficient subglacial drainage system in upstream basal overdeepenings, where high channel closure rates, due to the greater ice thickness, prevent an efficient subglacial drainage system from developing. Ice thicknesses are poorly known and can change rapidly on the lower glacier (Reference Anderson, Willis, Goodsell, Banwell, Owens and LawsonAnderson and others, 2014), but Reference Anderson, Willis, Goodsell, Banwell, Owens and LawsonAnderson and others (2014) infer an ice thickness of ∼160 m at stations G01–G04 and a thickness of 210 m at stations G05–G07 (Fig. 2). The 50 m greater ice thickness at stations G05–G07 would imply a closure rate that is 2.3 times greater than the closure rate at stations G01–G04, if we assume a flow law exponent of 3 and atmospheric water pressure in the subglacial channels (Reference Arnold, Richards, Willis and SharpArnold and others, 1998). Greater tunnel closure rates may therefore prevent the subglacial drainage system from becoming more efficient at higher elevations (Reference Anderson, Willis, Goodsell, Banwell, Owens and LawsonAnderson and others, 2014).
Smaller water inputs at higher elevations may further prevent an efficient subglacial drainage system from developing. Our energy-balance model predicts ablation rates of 5–10 cm d−1 at our stations on the lower glacier during March 2011, but these ablation rates decrease to <2 cm d−1 at elevations of 1900–2900 m a.s.l. in the glacier névé. The glacier névé remains snow-covered throughout the year above ∼2000 m a.s.l., so diurnal meltwater inputs above this elevation may drain slowly or refreeze in the snowpack before reaching the subglacial drainage system (Reference Neale and FitzharrisNeale and Fitzharris, 1997). We may therefore expect that diurnal velocity variations are unlikely in the glacier névé due to the limited diurnal meltwater cycle. Rainwater inputs, in contrast, may be quickly routed through surface crevasses, so these water inputs may have a much greater impact on the subglacial water pressure. Reference Anderson, Willis, Goodsell, Banwell, Owens and LawsonAnderson and others (2014) predicted subglacial water pressures that at times exceeded 90% ice overburden pressure in the glacier névé during large rainstorms in austral summer 2003/04. An inefficient subglacial drainage system in the glacier névé is consistent with our hypothesis that speed-up events occur at high elevations on the glacier and propagate downstream as a region of accelerated ice motion.
Water input variability
Despite a highly efficient subglacial drainage system on the lower Franz Josef Glacier, water inputs from rain and diurnal melt still exceeded the system’s capacity and caused short-term velocity variations in summers 2010/11 and 2012/13. To explain the occurrence of these short-term velocity variations, we suggest that the subglacial water pressure (and thereby glacier velocity) is far more sensitive to the water input variability than the total water entering the subglacial drainage system. This hypothesis is supported by previous modeling studies (Reference SchoofSchoof, 2010), which show that the subglacial drainage system evolves to accommodate gradual changes in the melt supply but that sudden variations in water inputs must still be accommodated by an increase in the subglacial water pressure. Reference SchoofSchoof (2010) concluded that water input variability, rather than the steady water input supply, drives short-term velocity variations.
At Franz Josef Glacier, we find that, although the total water entering the glacier is much greater than at most other glaciers, the variability in water inputs is similar. Figure 12 compares the velocity increase during rain events and diurnal melt cycles with the water input variability. We quantify water input variability as the ratio of the peak modeled discharge to the minimum discharge before the event; a water input variability of 1 indicates that there was no change in discharge. Although our metric for water input variability does not fully capture the complexities in the relationship between water input variability and glacier velocity, because it does not take into account the rate of change of water inputs to the system (Reference Bartholomaus, Anderson and AndersonBartholomaus and others, 2008; Reference SchoofSchoof, 2010), its simplicity allows us to compare our results with other studies. We find that glacier velocity variations occurred when the water input variability exceeded 1.1.
Glacier velocity increase as a function of water input variability. We quantify water input variability as the ratio of the peak modeled river discharge to the minimum discharge before the event. Circles and diamonds indicate velocity increases in response to diurnal melt cycles and rain events, respectively. White and gray shading indicate our results from 2011 and 2013. We also show results from Reference IkenIken (1981) for Findelengletscher, Switzerland (black asterisk), Reference Naruse, Fukami and AniyaNaruse and others (1992) for Glaciar Soler, Patagonia, Chile (black star), Reference Mair, Nienow, Willis and SharpMair and others (2001) for Haut Glacier d’Arolla, Switzerland (black cross), and Reference AndersonAnderson (2004) for Bench Glacier, Alaska, USA (black plus sign). The shaded curve shows the best-fit curve, which is logarithmic.

At other glaciers, short-term velocity variations occurred during water inputs with similar variability to the values that we find at Franz Josef Glacier. For example, the average modeled river discharge at Franz Josef Glacier in March 2011 was about twice that measured by Reference Naruse, Fukami and AniyaNaruse and others (1992) at Glaciar Soler, Patagonia. However, glacier velocity increased at both glaciers during water inputs with a variability >1.1 (Fig. 12). Furthermore, the absolute change in glacier velocity is similar at the two glaciers for a given water input variability. Short-term velocity variations also occurred during water inputs with similar variability at Findelengletscher, Switzerland (Reference IkenIken, 1981), Haut Glacier d’Arolla, Switzerland (Reference Mair, Nienow, Willis and SharpMair and others, 2001), and Bench Glacier, Alaska, USA (Reference AndersonAnderson, 2004), as shown in Figure 12.
Our best-fit model for the sensitivity of glacier velocity to water input variability is a logarithmic relationship (shaded in Fig. 12), where small variations in the water input variability greater than 1.1 cause large variations in glacier velocity and much higher water input variabilities cause almost no additional increase in glacier velocity. In other words, there is almost no additional increase in the magnitude of short-term velocity variations once a particular water input variability is reached. We do not attempt to quantify this relationship further, as our best-fit logarithmic models are very sensitive to the available data. However, this upper bound on short-term velocity variations is to be expected (Reference IkenIken, 1981; Reference SchoofSchoof, 2005) and indicates that an increase in water input variability does not necessarily cause larger short-term velocity variations.
From our observations, we infer that short-term velocity variations can occur even if the subglacial drainage system is efficient, as long as the water input variability is sufficiently high (Reference SchoofSchoof, 2010). If this water input variability is maintained in a warming climate, we expect short-term velocity variations to continue to occur. However, to maintain a constant level of water input variability in a warming climate, rain events and diurnal melt cycles will have to become larger to account for the larger average water inputs to the subglacial drainage system. This explanation may offer additional insight into results obtained in previous studies. Several recent studies (Reference Sundal, Shepherd, Nienow, Hanna, Palmer and HuybrechtsSundal and others, 2011; Reference Burgess, Larsen and ForsterBurgess and others, 2013; Reference TedstoneTedstone and others, 2013) have suggested that annual glacier velocities decrease in response to increasing meltwater inputs, because the subglacial drainage system becomes more efficient. We suggest that an additional (and perhaps complementary) explanation might be that increasing the background level of meltwater inputs causes a decrease in the water input variability and consequently a decrease in annual glacier motion. This explanation remains speculative, however, as we lack annual velocity measurements at Franz Josef Glacier to support it. We suggest that future modeling studies should address the role of water input variability in short-term velocity variations.
Conclusions
Many studies have found a relationship between glacier velocity and water inputs (e.g. Reference Iken and BindschadlerIken and Bindschadler, 1986; Reference Mair, Nienow, Willis and SharpMair and others, 2001; Reference Bartholomaus, Anderson and AndersonBartholomaus and others, 2008). On the lower Franz Josef Glacier we find enhanced glacier motion during rain events and diurnal melt cycles. Following large rain events, glacier velocity remained elevated at all stations for ∼7 days. We infer that the prolonged velocity response occurred as an upstream region of high subglacial water pressures and accelerated ice motion propagated downstream. As this region propagated downstream, it caused longitudinal compression and transverse extension across the lower glacier. We also find evidence for a zone of high subglacial water pressures moving downstream during diurnal melt cycles. Glacier velocity increased in the afternoon (12:00–16:00) at stations G05–G07 at 600 m a.s.l., but did not increase until 8–11 hours later (20:00–01:00) at stations G02 and G04 at 400 m a.s.l. Due to the timing, we suggest that the diurnal velocity variations at stations G02 and G04 did not occur due to a local forcing in the subglacial water pressure, but rather occurred as a region of high subglacial water pressures propagated downstream (Reference IkenIken, 1981; Reference Kamb and EngelhardtKamb and Engelhardt, 1987). We infer a similar propagation speed (50–100 m h−1) for the high-pressure zone during both rain events and diurnal melt cycles.
Our results indicate that the subglacial drainage system at Franz Josef Glacier likely decreases in efficiency upstream, where larger tunnel closure rates and lower water inputs prevent an efficient subglacial drainage system from developing (Reference Anderson, Willis, Goodsell, Banwell, Owens and LawsonAnderson and others, 2014). Without measured subglacial water pressures and/or dye tracing (e.g. Reference IkenIken, 1981; Reference Willis, Lawson, Owens, Jacobel and AutridgeWillis and others, 2009), however, our interpretations remain speculative. Furthermore, our results may not be comparable with a future study that includes subglacial water pressure measurements, because the lower Franz Josef Glacier has thinned by >80 m and retreated by ∼800 m between when we installed our stations in 2010/11 and March 2014 (Purdue and others, 2014).
Short-term velocity variations likely occur on lower Franz Josef Glacier because of the high water input variability, which is similar to the observed water input variability at other glaciers during speed-up events (cf. Reference SchoofSchoof, 2010). We suggest that short-term velocity variations will likely continue to occur in a warming climate, as long as the water input variability is maintained. At Franz Josef Glacier, we do not have annual velocity measurements so we cannot assess the role of these events in future glacier mass balance. However, we anticipate that these short-term velocity variations may not be that important for annual glacier motion on Franz Josef Glacier, because large changes in glacier geometry can occur over short time periods and are likely to be far more important for annual glacier motion (Reference Anderson, Willis, Goodsell, Banwell, Owens and LawsonAnderson and others, 2014).
Acknowledgements
We thank the Franz Josef Glacier guides, Karen McKinnon and Martina Barandun, for help in the field and Sridhar Anandakrishnan for loaning us the GNSS equipment used in this study. The New Zealand GeoNet program and its sponsors EQC, GNS Science and LINZ provided GNSS data. We also acknowledge Sam Dean and Stephen Stuart for providing the precipitation surface used in this study. We thank Bernd Kulessa, Ian Willis and Shin Sugiyama for helpful comments on an earlier version of the manuscript. Scientific Editor Martyn Tranter and reviewer Martin Funk provided helpful comments that improved the quality of the paper. This project was supported by the US Fulbright Program, the NZ MSI Program ‘ANZICE’ and the Victoria University Foundation Grant ‘Antarctic Research Centre Climate and Ice-Sheet Modelling’.



