


Introduction
Range size is considered a main correlate of species vulnerability because restricted ranges make species more vulnerable to local perturbations (Purvis et al. Reference Purvis, Gittleman, Cowlishaw and Mace2000, Lee and Jetz 2009, Di Marco and Santini Reference Di Marco and Santini2015). However, the study of ranges is usually flawed by methodological difficulties in migrant species, which, as in birds, spend different periods of the year in separate locations (Sherry and Holmes Reference Sherry, Holmes, Martin and Finch1995, Klaassen et al. Reference Klaassen, Hake, Strandberg, Koks, Trierweiler, Exo and Alerstam2014, Runge et al. Reference Runge, Tulloch, Hammill, Possingham and Fuller2015). As many migratory birds are in decline (Sanderson et al. 2006, Vickery et al. Reference Vickery, Ewing, Smith, Pain, Bairlein, Škorpilová and Gregory2014), exploring the distribution and size of seasonal ranges is key to designing conservation measures at appropriate spatial-temporal scales (Marra et al. Reference Marra, Cohen, Loss, Rutter and Tonra2015).
Birds express a variety of migratory movements, with populations spreading or converging in non-breeding grounds (Gilroy et al. Reference Gilroy, Gill, Butchart, Jones and Franco2016). In the case of partially migratory species (comprising both migratory and resident individuals; Chapman et al. Reference Chapman, Brönmark, Nilsson and Hansson2011), studies on range compression (reduction of non-breeding range size relative to breeding range and vice versa) are lacking. This is concerning because partial migration occurs in many species (e.g. 40% of European birds; Gilroy et al. Reference Gilroy, Gill, Butchart, Jones and Franco2016) and range compression can affect the size and vulnerability of migratory populations (Newton Reference Newton1995, Rappole et al. Reference Rappole, Helm and Ramos2003, Mills Reference Mills2006, Norris and Marra Reference Norris and Marra2007, Runge et al. Reference Runge, Tulloch, Hammill, Possingham and Fuller2015). This lack of information can be explained by the difficulties in separating migratory and local individuals in sympatric non-breeding grounds (de la Hera et al. Reference de la Hera, Pérez-Tris and Tellería2012). This complicates the mapping of non-breeding ranges if compared with long-distance migrants in which range compression can be assessed using current distribution maps available in conventional atlases (Newton Reference Newton1995, Mills Reference Mills2006, Gilroy et al. Reference Gilroy, Gill, Butchart, Jones and Franco2016).
Here, we explore the seasonal range compression of some partial migratory passerines (Passeriformes) moving to winter in the Iberian Peninsula and the Maghreb, a region reputed as a primary wintering ground for many European birds (Busse Reference Busse2001). Widely-dispersed, abundant passerines are often neglected in projects focused on locating and protecting important bird areas for conservation despite the fact that they represent the bulk of the avifauna in most regions and play a significant functional role in some ecosystems (Whelan et al. Reference Whelan, Wenny and Marquis2008). Thus, it is interesting to explore whether seasonal changes in the range size of migratory populations reveal the existence of small areas of particular conservation concern. It has been shown that the western Mediterranean Basin is not a homogeneous wintering ground since the best areas are mainly restricted to mild lowlands and coastal areas (Tellería et al. Reference Tellería, Asensio and Díaz1999, Reference Tellería, Fernández-López and Fandos2014a, Carrascal et al. Reference Carrascal, Villén-Pérez and Seoane2012). However, we do not know if these geographical features reduce the wintering range of migratory populations compared to their breeding grounds in central Europe.
We use ringing records linking individuals between breeding and non-breeding localities to explore if winter ranges are smaller than summer ranges. Clusters of ringing records have proven useful in detecting the location of ranges of migratory birds (e.g. Clark et al. Reference Clark, Thorup and Stroud2009, Calenge et al. Reference Calenge, Guillemain, Gauthier-Clerc and Simon2010), but do not depict the spatial patterning of areas suitable for populations involved in these movements. However, a set of mathematical algorithms has been developed in the last decade to predict the potential distribution of species by combining occurrence data (latitude and longitude) with environmental variables (Peterson Reference Peterson2001, Elith and Leathwick Reference Elith and Leathwick2009). We combine these methods with the use of data from ringed birds to estimate potential range sizes and to explore the environmental drivers of bird distribution (Rodríguez et al. Reference Rodríguez, Brotons, Bustamante and Seoane2007, Wisz et al. Reference Wisz, Walther and Rahbek2007, Rivera et al. Reference Rivera, Ortega-Huerta, Sarkar and Rappole2011). The potential ranges resulting from these analyses are used to test whether wintering ranges of migratory populations in the Iberian Peninsula and the Maghreb are smaller than their breeding ranges in central Europe.
Methods
Study area
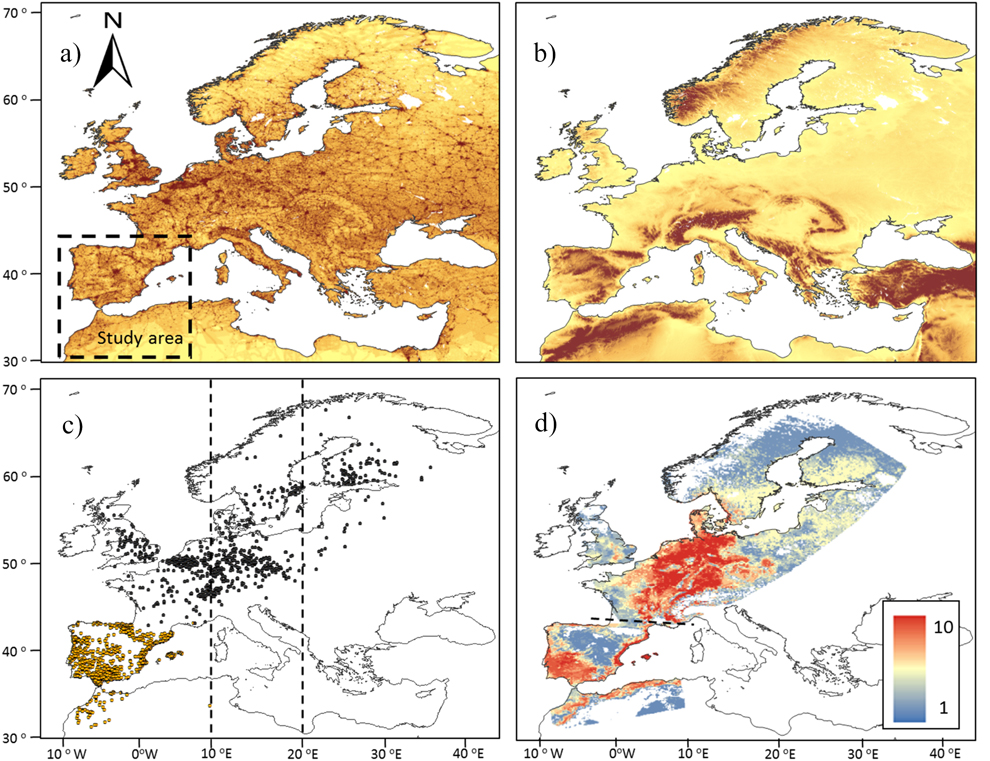
The wintering area covers 1,700,000 km2 located between 28° and 44°N at the south-western border of the Palearctic (Figure 1). It receives many migratory birds, most of them from the western side of the migratory divide crossing Europe between 10° and 20°E (Busse Reference Busse2001, Møller et al. 2011). The most outstanding environmental gradients of this wintering ground are the sharp changes in elevation and the concomitant variation in climatic conditions and vegetation (Figure 1). The area is dominated by cereal fields, vineyards, olive groves and Mediterranean woodlands and scrublands located between the moist broadleaved woodlands and meadows of northern Iberia and the southern expanses of the Sahara.
a) Distribution of the Human Foot Print (HFP) index in Europe. Increasing dark tones show increasingly high values of HFP. The study area is located within the striped square. b) Elevation map of the western Palearctic. Increasing dark tones show increasing elevations, with the darkest tone showing the areas over 1,000 m asl. c) Distribution in breeding and wintering areas of the 1,113 pairs of birds controlled in breeding grounds (black dots) and wintering grounds in the study area (light dots). Vertical lines show the longitudinal range within which are distributed the migratory divides of most migratory birds in Europe, according to Møller et al. (2011). d) Potential distribution of migratory populations as reported by the number of species (0-10) present in breeding and wintering grounds.
Ring recoveries
The data used in this paper refer to all birds recovered/ringed in winter (December to February) in the Iberian Peninsula and the Maghreb that were ringed/recovered in central and northern Europe during the breeding period (April to August; Figure 1). The data, ranging from 1925 to 2011, were provided by the European Union for Bird Ringing (EURING) and the Spanish Office of Migratory Species (Spanish Ministry of Agriculture, Food and Environment). Additional data on the number of ringed birds were recorded from the official page of EURING (http://www.euring.org; Appendix S1 in the online supplementary material). From a previous set of 13 species, we excluded Anthus pratensis, Saxicola torquata and Carduelis carduelis because they had less than 50 ring recoveries, a sample size that we considered too small for a comprehensive view of their seasonal ranges. The final data set included 1,113 pairs of ringed-recovered individuals for 10 species (Figure 1; Table 1). These data provided geo-referenced clusters of ringing records per species, which show the location of the marked individuals in breeding and wintering grounds (Figure S2-1). Finally, we explored the strength of migratory connectivity of populations (most individuals from one breeding population move to the same wintering locations; Webster et al. Reference Webster, Marra, Haig, Bensch and Holmes2002) by testing if individuals that breed close to each other also winter close to each other. High connectivity will suggest that changes in particular wintering sectors of the Iberian Peninsula and the Maghreb will affect the populations of discrete breeding quarters whilst low connectivity will suggest a widespread effect of changes in breeding grounds (Finch et al. Reference Finch, Butler, Franco and Cresswell2017). To test this we conducted a Mantel test (Ambrosini et al. Reference Ambrosini, Møller and Saino2009) with the R package ‘vegan’ in which the statistical significance of correlation coefficients was determined by 9,999 random permutations (Oksanen et al. Reference Okansen, Blanchet and Kindt2015).
Number of pairs of ring records used to model the distribution of migratory populations in breeding and wintering grounds. R statistics and P values resulting from Mantel tests. Estimated breeding and wintering ranges of the studied passerines and range compression in wintering grounds in percentage ([wintering area/breeding area]*100).
Environmental predictors
The geographical location of ringing records was used to run Maxent by selecting a set of explanatory variables related to the large-scale distribution of birds in breeding and wintering areas. The aim was to obtain useful models and to use the response curves provided by Maxent to explore the relationships between the species occurrence probabilities and the involved variables. We used variance inflation (VIF) analysis to avoid highly correlated variables (Marquardt Reference Marquardt1970). From a set of 11 variables (seasonal maximum, minimum and mean temperature, temperature seasonality, seasonal precipitation, precipitation seasonality, sun radiation, NDVI, bare ground, herbaceous cover and tree cover) we selected five environmental predictors per season (VIF scores under 5, range: 1.15–4.56). Mean temperatures in breeding (April to August) and wintering (December to February) ranges were selected because small birds avoid cold areas to limit excessive thermoregulatory costs (Calder and King Reference Calder, King, Farner and King1974). We also included mean precipitation in breeding and wintering grounds. Precipitation improves primary productivity in wintering grounds after the Mediterranean summer (Nahal Reference Nahal, Di Castri, Goodall and Specht1981), thus increasing the carrying capacity for wintering birds (Carrascal and Palomino Reference Carrascal, Palomino, del Moral, Molina, Bermejo and Palomino2012, Tellería et al. Reference Tellería, Fandos, López, Onrubia and Refoyo2014b). However, in temperate areas higher precipitation has been related with poor breeding success. Thus, it can be suggested that the moistest sectors will be suboptimal areas for breeding (e.g. Öberg et al. Reference Öberg, Arlt, Pärt, Laugen, Eggers and Low2015). We also included the annual Normalized Difference Vegetation Index (NDVI) as a surrogate of primary productivity from MODIS satellite-based sensor (30” resolution, or ∼1 km; Carroll et al. Reference Carroll, DiMiceli, Sohlberg and Townshend2004, Pettorelli et al. Reference Pettorelli, Ryan, Mueller, Bunnefeld, Jedrzejewska, Lima and Kausrud2011) and, according to the strong effect of vegetation cover on passerine distribution (Wiens Reference Wiens1989), we included woody cover from Vegetation Continuous Fields MOD44B (Di Miceli et al. Reference Di Miceli, Carroll, Sohlberg, Huang, Hansen and Townshend2011). Finally, we considered the effect of two different variables related to the seasonal pulses of productivity tracked by migratory birds in breeding and wintering grounds (Wisz et al. Reference Wisz, Walther and Rahbek2007, Engler et al. Reference Engler, Rödder, Stiels and Förschler2014). We used precipitation seasonality (standard deviation of monthly means x 100) as a surrogate for the rain-mediated productive pulses in Mediterranean wintering grounds, and temperature seasonality as a surrogate of the productive output in central and northern European summer grounds. Climate data were recorded from Worldclim 1.4 (Hijmans et al. Reference Hijmans, Cameron, Parra, Jones and Jarvis2005) and prepared as ASCII raster maps with a resolution of 5x5 km with the raster package in R (Hijmans and Van Etten Reference Hijmans and Van Etten2013, R Development Core Team 2015).
Species distribution models
We used Maxent, a machine-learning technique based on the principle of maximum entropy (Phillips et al. Reference Phillips, Anderson and Schapire2006), to predict the habitat suitability of marked populations from presence data (ring records) within breeding and wintering ranges. This program has been designed to minimise the relative entropy between two probability densities (one estimated from the presence data and one from automatically generated presences) defined in covariate space (Elith et al. Reference Elith, Phillips, Hastie, Dudík, Chee and Yates2011). In this way, it is possible to model the probability of the occurrence of species over a given study area. To select the area with which to calibrate the models in breeding and wintering grounds, we used the minimum convex polygon (convex hull) produced by the full set of ringing records. This is the smallest polygon in which no internal angle exceeds 180° and contains the records of all species. In both seasons and for all species, we ran Maxent (log output; regularisation multiplier b = 1; autofeatures; convergence threshold = 0.00001) in 10 replicates with 70% of the presences as training data and the rest as test data for internal verification. Duplicate records in the same localities (e.g. ringing stations) were removed in each replicate and spatial autocorrelation was minimised by randomly removing occurrences within 5 km of each other. In addition, and since the distribution of ring recoveries can be affected by human presence (e.g. more records will be gathered in the most populated areas; Busse Reference Busse2001), we used the layer of human footprint (HFP), an index of population density, land transformation and road density (Sanderson et al. Reference Sanderson, Jaiteh, Levy, Redford, Wannebo and Woolmer2002), as a bias grid (10,000 background points with a likelihood of presence proportional to HFP; Dudík et al. Reference Dudík, Phillips and Schapire2005). We used mean human footprint per country because it is positively related to the density of all ringing recoveries reported per country (r = 0.53, P = 0.036, n = 16), a plain index of the effort applied to control ringed birds (Appendix S1). To explore the importance of each predictor (see below), we carried out jackknife analyses of the regularised gain with training data. The models were evaluated using 10-fold cross-validations measuring the accuracy by means of the area under the receiver operating characteristics curve (AUC; Fielding and Bell Reference Fielding and Bell1997) to assess the congruence between observed and detected records in the test data reserved for verification in Maxent (Phillips et al. Reference Phillips, Anderson and Schapire2006). Finally, we obtained a map by averaging the suitability models of individual species. With this map, we try to establish a comprehensive view of the main areas used by partial migratory passerines during the breeding and wintering periods. We used the ‘dismo’ package (Hijmans and Van Etten Reference Hijmans and Van Etten2013) in R (R Development Core Team 2015) to perform all analyses.
Potential range maps
Geographic ranges can be derived from species distribution models by applying a cut-off threshold value to distinguish suitable from unsuitable areas. The resulting maps from the previous niche modelling process were converted into binary ‘presence–absence’ maps using the threshold selection method based on maximising the sum of sensitivity and specificity (Manel et al. Reference Manel, Williams and Ormerod2001). This threshold is recommended for conservation purposes as omission errors are avoided and sensitivity favoured (Jiménez-Valverde and Lobo Reference Jiménez-Valverde and Lobo2007, Liu et al. Reference Liu, White and Newell2013). We considered areas with a habitat suitability above the threshold as ‘presence’ and those below as ‘absence’. The geographic area occupied by species in each season were calculated by converting the ‘presence’ raster to a polygon shape file and calculated polygon areas using the WGS 84 / UTM zone 30N (32630) projection. Finally, we measured winter range compression dividing potential winter range by breeding range (Table 1). We used the raster and ‘dismo’ packages (Hijmans and Van Etten Reference Hijmans and Van Etten2013) in R (R Development Core Team, 2015) to calculate the potential range map of the species in both seasons.
Results
Mantel test correlations between the geographical location of breeding and wintering sites in most species (all but Robin Erithacus rubecula and Redwing Turdus iliacus; Table 1) support the maintenance of spatial structuring in populations between breeding and wintering ranges. The AUC values resulting from niche modelling suggest a good performance of models according to current standards (AUC >0,7; Elith Reference Elith, Ferson and Burgman2002) and the response curves provide some additional information on the way birds are distributed within breeding and wintering ranges (Table 2). For instance, the habitat suitability of species in breeding grounds was positively related to temperature and strongly affected by temperature seasonality (Table 2). In wintering grounds, most species were related to temperature and woodland cover (Table 2).
Estimates of relative contributions of the environmental variables in models predicting habitat suitability of species in breeding and wintering grounds. AUC scores show the fitting of models (max values = 1) and the two following values represent the percent contribution/permutation importance of each variable in the model. Percent contribution indicates the change in regularized gain by adding the corresponding variable. Permutation importance represents, for each environmental variable in turn, the resulting drop in training AUC when the values of that variable on training presence and background data are randomly permuted, normalized to show percentages. Values are averages over 10 replicate runs. Symbols in parentheses show the trend of the response curves for the quantitative variables: +, increase; -, decrease; Ω, hump-shaped = no trend).
Potential range maps suggest that most of the migratory populations wintering in the western Mediterranean Basin extend their breeding grounds in central Europe west to Poland and in southern Scandinavia (Figure S2-2). These maps show that the wintering grounds occupied by migratory populations were smaller (mean 37%) than breeding grounds in all species (t-test for paired samples t = 5.92, P < 0.001, n =10; Table 1). More explicitly, potential winter ranges covered a mean area of 275,600 km2 (min-max 134,900–411,190 km2, Table 1) accounting for 16% (7.9–24.2%) of the Iberian Peninsula and the Maghreb (Figure 1).
Discussion
Distribution of potential breeding and wintering ranges
The potential breeding ranges of individual species depicted a patchy distribution, with migratory populations reporting the highest occurrence probabilities in different inland or coastal areas of central Europe west of the migratory divide (Figure S2-2). This suggests a diverse geographical origin of populations moving to winter in the western Mediterranean. When the mean potential distribution of these species is represented (Figure 1), the emerging map reveals that the most probable source area of migratory birds is located in a region that extends from the Alps to the North and Baltic seas, and from the French Massif Central to the Slovakian Tatra Mountains, constrained to the east by the migratory divide of European bird populations (Figure 1). This seems to be the core range of the bulk of migratory passerines moving to winter in the Iberian Peninsula and the Maghreb.
The response curves provided by Maxent indicated that in breeding and wintering areas, the potential distributions of migratory populations tend to avoid the colder areas and are sited in most seasonal areas under a given threshold of summer (dryness) and winter (cold) conditions (Table 2). The importance of temperature in shaping migratory bird distribution is widely recognised, and is the result of the high thermoregulation costs of living in areas under bird thermo-neutral ranges (Swanson and Garland Reference Swanson and Garland2008, Carrascal et al. Reference Carrascal, Villén-Pérez and Seoane2012, Khaliq et al. Reference Khaliq, Hof, Prinzinger, Böhning-Gaese and Pfenninger2014). This could explain the avoidance by birds of elevated areas in breeding and wintering ranges (Figure 1). The potential wintering range of migratory passerines depicted a homogeneous pattern, with most birds constrained to similar lowlands and coastal sectors of the Iberian Peninsula and the Maghreb (Figure S2-2, Figure 1), where wood cover was positively (thrushes) or negatively (the rest of species) correlated, supporting the effect of specific habitat preferences on bird distribution (see Tellería et al. Reference Tellería, Asensio and Díaz1999, del Moral et al. Reference del Moral, Molina, Bermejo and Palomino2012). These patterns are similar to the wintering maps reported by ring modelling of Meadow Pipit Anthus pratensis, Chiffchaffs Phylloscopus collybita, Blackcaps Sylvia atricapilla and Robin Erithacus rubecula, validated by field sampling of abundances (Tellería et al. Reference Tellería, Santos, Refoyo and Muñoz2012, Reference Tellería, Fernández-López and Fandos2014a, Reference Tellería, Fernández-López and Fandos2016).
Range compression in wintering grounds
Compression of winter ranges reported by common distribution maps of species seems to occur in half of the Western Palaearctic migratory birds (Gilroy et al. Reference Gilroy, Gill, Butchart, Jones and Franco2016). This reveals the importance of a phenomenon that varies between species (and populations) according to the idiosyncratic features of the species and regions involved in this process. Because of this potential variability, range contraction is a context-dependent process whose effect on the conservation of migratory populations must be addressed in particular migratory populations within their geographical ranges (Gilroy et al. Reference Gilroy, Gill, Butchart, Jones and Franco2016).
This study, which has focused on migratory passerines wintering in the Iberian Peninsula and the Maghreb, supports a sharp reduction of potentially suitable areas in winter ranges affecting all the study species, with compression scores ranging from 19% to 58% (mean 37%) of breeding ranges (Table 1). This effect of range compression affecting all species is higher than that reported in Palearctic land birds moving to winter south of the Sahara, where 69% of species (n = 62) experienced a reduction of ranges in non-breeding grounds (Newton Reference Newton1995). In fact, our results are more similar to those reported in North American land birds moving to winter in Mesoamerica, where most birds (94%, n = 89) showed a reduction of non-breeding range (Mills Reference Mills2006). In this case, range contraction was explained by the sharp reduction of emerged lands available to birds in the Mesoamerican corridor (Mills Reference Mills2006). We suspect a similar effect in the south-western border of the Palaearctic, where migratory populations are restricted to a minor part of emerged lands (mean range covers 16% of the Iberian Peninsula and the Maghreb) because suitable areas are constrained by coastlines, cold highlands and the dry expanses of the Sahara (Tellería et al. Reference Tellería, Fernández-López and Fandos2014a,Reference Tellería, Fandos, López, Onrubia and Refoyob).
Conservation prospects
The results in this study suggest that, because of small range size, the wintering grounds in the Iberian Peninsula and the Maghreb may act as ‘bottlenecks’ of passerine populations involved in these migratory movements (Weber et al. Reference Weber, Houston and Ens1999, Gilroy et al. Reference Gilroy, Gill, Butchart, Jones and Franco2016). This will likely occur in species tied to scarcer habitats, or limited by food availability. However, evidence available in the study area does not clearly show such limitations in the case of common passerines. Most migratory passerines arrive at this area in October, when autumn rains begin a period of primary productivity, invertebrate activity and fruit abundance (Nahal Reference Nahal, Di Castri, Goodall and Specht1981, Guo et al. Reference Guo, Hu, Li, Li, Sun and Yu2012). Common passerines rely on seeds, invertebrates and fruit available in extensive human-modified landscapes (e.g. cereal fields, olive groves, etc.) and Mediterranean scrublands and woodlands (Rey Reference Rey2011, Del Moral et al. Reference del Moral, Molina, Bermejo and Palomino2012, Tellería et al. Reference Tellería, Fandos, López, Onrubia and Refoyo2014b) where field studies do not support food restriction (Díaz y Tellería Reference Díaz and Tellería1994, Hampe Reference Hampe2008, Tellería et al. Reference Tellería, Blázquez, De La Hera and Pérez-Tris2013). We acknowledge that this balance will be disrupted in winters of food scarcity, a situation that many birds cope with by food-tracking (Rey Reference Rey2011, Tellería et al. Reference Tellería, Carrascal and Santos2014c). However, movement among suitable areas will not be enough if changes affect simultaneously the carrying capacity of the whole range. The south-western border of the Palearctic is expected to suffer the strong effects of climate change, with increasing temperature and decreasing rainfall (Giorgi and Lionello Reference Giorgi and Lionello2008, Schilling et al. Reference Schilling, Freier, Hertig and Scheffran2012). In this context, the depletion or altitudinal shifts of lowland habitats suitable for wintering birds have been predicted (Ruiz-Labourdette et al. Reference Ruiz-Labourdette, Nogués-Bravo, Ollero, Schmitz and Pineda2012, Ponti et al. Reference Ponti, Gutierrez, Ruti and Dell’Aquila2014, Tellería et al. Reference Tellería, Fernández-López and Fandos2016).
The response of birds to these changes in wintering areas is difficult to predict (La Sorte et al. Reference La Sorte, Lee, Wilman and Jetz2009) but the potential carry-over effects of these environmental changes (Norris et al. Reference Norris, Marra, Kyser, Sherry and Ratcliffe2004) will probably affect populations in larger breeding areas of Europe. In this context, the study of migratory connectivity is essential to understanding the effects of these changes on breeding populations (Creswell Reference Cresswell2014). Migratory connectivity may vary along a continuum, from strong to weak (Finch et al. Reference Finch, Butler, Franco and Cresswell2017), and our results support this variability. Most passerines wintering in the Iberian Peninsula and the Maghreb show significant but different correlation coefficient scores in Mantel tests, and two species report lack of migratory connectivity (Table 1). This lack of connectivity in Redwing and Robin could result from within-range movements typical of some birds (Tellería et al. Reference Tellería, Carrascal and Santos2014c, Stutchbury et al. Reference Stutchbury, Siddiqui, Applegate, Hvenegaard, Mammenga, Mickle, Pearman, Ray, Savage, Shaheen and Fraser2016) or the relatively small scale of approach in this study (Creswell Reference Cresswell2014; e.g. Ambrosini et al. Reference Ambrosini, Cuervo, Feu, Fiedler, Musitelli, Rubolini, Sicurella, Spina, Saino and Møller2016 report migratory connectivity of Robins at continental scales). But, as a whole, the results in this paper suggest that connectivity is expected to underpin the response of breeding populations in central Europe to local changes in non-breeding grounds of the Western Mediterranean. We agree that this may affect just a part of populations on breeding grounds if some individuals spread out to alternative wintering grounds or are able to shift their ranges in response to changes (Finch et al. Reference Finch, Butler, Franco and Cresswell2017).
Supplementary Material
To view supplementary material for this article, please visit https://doi.org/10.1017/S0959270917000120
Acknowledgements
This study was funded by the project CGL2011-22953/BOS of the Spanish Ministry of Economy and Competitiveness. G. Fandos was supported by a FPI predoctoral grant from the Ministry of Economy and Competitiveness. We are grateful to the ringers, and we thank Chris du Feu of the European Union for Bird Ringing (EURING) and Ricardo Gómez of the Spanish Ministry of Agriculture, Food and Environment who kindly provided all facilities to work with the ring recoveries. Mattia Brambilla and two anonymous referees improved very much an early version of this manuscript.


