


Introduction
A large and ever-growing literature finds that the outcome of elections affects voters’ levels of satisfaction with democracy (SWD). Supporters of parties that end up in government – the ‘winners’ of an election (Bernauer and Vatter Reference Bernauer and Vatter2012; Blais, Morin-Chassé, and Singh Reference Blais, Morin-Chassé and Singh2017; Curini, Jou, and Memoli Reference Curini, Jou and Memoli2012; Singh, Karakoç, and Blais Reference Singh, Karakoç and Blais2012) – are more satisfied with democracy than those who voted for parties that end up in opposition – the ‘losers’ (Anderson et al. Reference Anderson, Blais, Bowler, Donovan and Listhaug2005; Anderson and Guillory Reference Anderson and Guillory1997; Blais and Gélineau Reference Blais and Gélineau2007; Campbell Reference Campbell2015; Dahlberg and Linde Reference Dahlberg and Linde2017; Henderson Reference Henderson2008; Singh Reference Singh2014; Singh and Thornton Reference Singh and Thornton2016). From a normative perspective, this finding matters: satisfaction with democracy is an important indicator in political science. It reflects respondents’ support for the political system, positioned between broad support for democratic principles and specific attitudes towards political actors (Linde and Ekman Reference Linde and Ekman2003; Van der Meer and Kern Reference Van der Meer and Kern2019). To what extent those who did not vote for a government party support democracy is of key importance to democratic legitimacy and stability (Anderson et al. Reference Anderson, Blais, Bowler, Donovan and Listhaug2005).
According to Daoust et al. (Reference Daoust, Plescia and Blais2023:162), the winner-loser gap in satisfaction with democracy is ‘one of the most robust findings in political science’. It has been replicated across various elections and different political systems (Anderson et al. Reference Anderson, Blais, Bowler, Donovan and Listhaug2005; Anderson and LoTempio Reference Anderson and LoTempio2002; Blais and Gélineau Reference Blais and Gélineau2007; Daoust, Plescia, and Blais Reference Daoust, Plescia and Blais2023; Singh, Lago, and Blais Reference Singh, Lago and Blais2011), including at the EU level (Plescia, Daoust, and Blais Reference Plescia, Daoust and Blais2021). Other studies have analysed systematic variation in the strength of the winner-loser gap, finding that the gap is smaller in consensus democracies (Anderson and Guillory Reference Anderson and Guillory1997; Bernauer and Vatter Reference Bernauer and Vatter2012; Blais, Morin-Chassé, and Singh Reference Blais, Morin-Chassé and Singh2017; Farrer and Zingher Reference Farrer and Zingher2019; Listhaug, Aardal, and Ellis Reference Listhaug, Aardal, Opheim Ellis and K.2009).
A key difference between consensus systems and majoritarian systems is that the latter have coalition governments, while majoritarian systems tend to have single-party government (Lijphart Reference Lijphart2012): in parliamentary regimes, about seven out of ten governments are coalition governments (Gallagher, Laver, and Mair Reference Gallagher, Laver and Mair2011). This challenges the neat logic of the winner-loser gap. In a coalition government, it is not just one’s own party that ‘wins’ government office but also other parties. How one feels about these other parties or what one expects from them likely shapes one’s attitudes about the government (Singh and Thornton Reference Singh and Thornton2016). This issue becomes particularly important as party systems become increasingly fractionalised and anti-establishment parties rise. Unexpected coalitions that cross the traditional divide between left and right, between the establishment and challengers, may be necessary to find a majority.
Our central question is how attitudes towards the eventually formed coalition shape satisfaction with democracy. Focusing on coalition preferences allows us to explain heterogeneity in changes in satisfaction with democracy that is not captured by the simple ‘winner’ or ‘loser’ status of the party that a voter supported. Increasing levels of fragmentation in multi-party systems have made the coalition formation process less predictable. The combinations of governing parties in some countries suggest that the policies subsequently pursued may not align well with the preferences of a substantial number of people who voted for the parties that take part in the coalition. This means that voting for a winning party does not need to be equal with being satisfied with the eventually formed coalition government (nor does voting for a losing party imply dissatisfaction). Therefore, we expect that preferences for the eventually formed coalition influence changes in satisfaction with democracy.
To test this argument, this paper analyses four elections in Germany (2017 and 2021) and Austria (2017 and 2019). For all four cases, fine-grained panel data exist that allows us to analyse how voters changed their satisfaction with democracy directly after the election and after the new government coalition was formed. The fine-grained nature of the data allows for tracing how the election result and the government formation process had different effects on changes in satisfaction with democracy. This is particularly important in the context of this paper, as the relevance of coalition preferences can only be observed after the coalition has formed and not directly after the election, when the eventual coalition is still unclear. We observe a mix of coalitions: a coalition between a centre-right and radical-right party which had previously governed together (Austria 2017), novel coalitions that included a centre-right party and a green party (Germany 2021, Austria 2019), and the return of a centrist coalition after the attempt to form an alternative coalition failed (Germany 2017).
The winner-loser gap in satisfaction with democracy and the impact of coalition preferences
As noted above, different levels of satisfaction with democracy between winners and losers of elections are well-documented in the literature. However, while the empirical evidence in favour of the winner-loser gap is quite clear, the debate about why it occurs is not settled. There are two different explanations of this in the literature. The policy congruence approach argues that voters want their policy preferences to become policy (Anderson et al. Reference Anderson, Blais, Bowler, Donovan and Listhaug2005; Curini, Jou, and Memoli Reference Curini, Jou and Memoli2012; Ezrow Reference Ezrow2007; Gärtner, Gavras, and Schoen Reference Gärtner, Gavras and Schoen2020; Mayne and Hakhverdian Reference Mayne and Hakhverdian2017; Stecker and Tausendpfund Reference Stecker and Tausendpfund2016). That is, they derive utility from their favoured party being part of the government, as this will make it more likely that public policy will reflect their views. Voters become more satisfied with democracy because their policy preferences are better represented by the newly formed government. As Anderson et al. (Reference Anderson, Blais, Bowler, Donovan and Listhaug2005: 3) put it: ‘[w]inning an election means getting a greater share of preferred policies’. In countries with majoritarian electoral systems, this link is usually straightforward: A voter supports a party which either wins a majority in parliament and forms the government and subsequently pursues changes to public policy, or another party, which they did not vote for, does so. In the first case, the voter is a ‘winner’, in the second, a ‘loser’.
In contrast, the political-psychological approach suggests that being on the winning side of an election is sufficient to increases voters’ level of satisfaction with democracy, regardless of the actual policy congruence with the subsequent government (Singh, Karakoç, and Blais Reference Singh, Karakoç and Blais2012; Singh, Lago, and Blais Reference Singh, Lago and Blais2011): the reasons that voters support a specific party often depends upon psychological attachment instead of the ideological proximity of their policy agenda (Singh, Lago, and Blais Reference Singh, Lago and Blais2011). Winning can produce a range of positive emotions, while losing can bring about emotions like anger (Singh, Lago, and Blais Reference Singh, Lago and Blais2011). This is as true in politics as it is in sports (Singh, Karakoç, and Blais Reference Singh, Karakoç and Blais2012). Voters in general do not pay a lot of attention to the intricacies of public policy, and winning or losing may be a shortcut as to whether the system works (Singh, Karakoç, and Blais Reference Singh, Karakoç and Blais2012). At the district level, Brunell and Buchler (Reference Brunell and Buchler2009) show that the party one supports for winning that seat is more important for positive evaluations than the actual ideological distance to the winning candidate. All in all, the emotion of victory and the satisfaction of being part of a majority may spur one’s support for democracy (Singh, Karakoç, and Blais Reference Singh, Karakoç and Blais2012).Footnote 1
Moving beyond the single-party government complicates matters for voters. Rather than winning and losing being binary, the government coalition which forms after an election and its specific composition matters for voters’ changes in satisfaction with democracy (Singh and Thornton Reference Singh and Thornton2016). While a voter who supports a party which does not enter government still is a ‘loser’,Footnote 2 there is much more variation in terms of what it means to be a ‘winner’. A winner can experience their party entering government with a coalition partner which the voter is generally positively disposed towards, or the party they supported can form a coalition with a party which the voter dislikes.
To illustrate this, consider a stereotypical voter for the centre-right German Christian-Democratic Union (Christlich Demokratische Union, CDU). Such a voter knows that their favoured party will require a coalition partner to obtain a majority in the Bundestag and will favour entering a coalition with the market-liberal Free Democratic Party (Frei Demokratische Partei, FDP). These parties are not just ideologically close to each other but it is likely that a CDU supporter is positively disposed towards the FDP as they share a similar bürgerliche (bourgeois) worldview. However, such coalitions may lack a majority, and so instead a coalition between the CDU and the German Greens (Bündnis ‘90/Die Grünen) may form. Our hypothetical CDU voter may now be a ‘winner’, in that the party they supported is part of the government, but their expected utility will be much lower than if a coalition with the FDP had formed: the economic and environmental policies such a coalition produces are likely to be further away from the voters’ policy ideal point. Moreover, CDU voters may dislike the Green Party because of its cultural elitism, its focus on the concerns of higher educated, middle-class, urban voters, and its progressive moralism. Now consider a voter of the centre-left Social Democratic Party (Sozialdemokratische Partei Deutschlands, SPD). They may derive more satisfaction from a CDU-Green coalition, which is more likely to produce the kind of centre-left policies that this voter favours than from a coalition that is formed exclusively by parties of the right. All in all, in multi-party systems voting for a party that ends up in government and being satisfied with that government are not necessarily the same.
Overall, then, the utility of ‘winners’ is a function not just of their party entering government but of whom they enter government with. While the utility a voter obtains from a prospective coalition is of course less easy to observe than whom they voted for, pre-election surveys allow us to capture this quite precisely, going beyond the stereotypical coalition preferences used in the example above, simply by asking voters to consider how positively inclined they are towards various potential governments. The fragmentation of many countries’ party systems in recent years, as indicated by the decline of vote shares for previously dominant parties and the rise of new challenger parties (see, e.g., de Vries and Hobolt Reference de Vries and Hobolt2020), has led to more complex government formation process and to the formation of ‘new’ coalitions (Debus, Döring, and Ecker Reference Debus, Döring, Ecker, B., B. and H.2021). Several countries have witnessed coalitions that were traditionally ruled out by the involved parties or which were highly controversial as they include parties from the populist radical-right (Bergman, Bäck, and Hellström Reference Bergman, Bäck, Hellström, B., B. and H.2021). Further, the heterogeneity of the coalitions which sometimes form in highly fragmented party systems can reduce voters’ satisfaction with democracy (Singh and Thornton Reference Singh and Thornton2016).
Previous work on the winner-loser gap in regimes with coalition governments has found that one’s favoured party entering government increases satisfaction with democracy (Blais, Morin-Chassé, and Singh Reference Blais, Morin-Chassé and Singh2017; Singh, Karakoç, and Blais Reference Singh, Karakoç and Blais2012), indicating that the eventually formed coalitions matter. Winning takes many different forms: becoming the largest party, entering government, increasing one’s vote share, or passing the threshold to enter government (Howell and Justwan Reference Howell and Justwan2013; Stiers, Daoust, and Blais Reference Stiers, Daoust and Blais2018): That said, entering government is the greatest prize when it comes to satisfaction with democracy, with Singh et al. (Reference Singh, Karakoç and Blais2012: 202) finding that ‘inclusion of one’s selected party in government is the most important factor for satisfaction with democracy’. Overall, however, the classification of voters as either ‘winners’ or ‘losers’ of an election is overly simple. Not all voters who supported parties which become part of the subsequent coalition are equally ‘winners’, and even among the voters of opposition parties, there will be some ‘losers’ who will derive substantial utility from the coalition which forms, despite not voting for any party in it. We thus expect that the pre-electoral preference for the eventually formed coalition will influence voters’ levels of satisfaction with democracy:
-
1. Coalition preference hypothesis: The stronger a voter’s preference for the eventually formed government coalition, the greater the increase in that voter’s levels of satisfaction with democracy after an election (and vice versa).
When discussing the impact of coalition preferences, it is important to focus on the temporal dimension of changes in satisfaction with democracy. While the winner-loser gap suggests that voters react to election outcomes, the government formation process can be drawn out and, depending on the system, it may take several weeks and often even months until a new coalition has formed (Ecker and Meyer Reference Ecker and Meyer2020). Especially in contexts in which coalition formation is uncertain, the direct election outcome might be less relevant for voters’ changes in satisfaction with democracy compared to the actual formation of the respective coalition. Although it is true that voters sometimes can anticipate certain coalition outcomes, this is often not the case, and voters may not even have fully updated their beliefs about the outcome of the election prior to the government formation process concluding (Otjes and Willumsen Reference Otjes and Willumsen2023). As such, one should expect coalition preferences to be more relevant for voters’ changes in satisfaction with democracy after the new coalition was formed and not necessarily directly after the election. Therefore, we need to differentiate between changes in satisfaction with democracy directly after the election – i.e., when the coalition outcome was still uncertain – and after the eventual coalition was formed. As voters can be only certain that their coalition preference was fulfilled after the coalition was formed, the effect of coalition preferences should be stronger after the coalition was formed:
-
2. Timing Hypothesis: The effect of coalition preferences on changes in satisfaction with democracy will be stronger after the coalition was formed compared to changes in satisfaction with democracy directly after the election.
Case selection: Germany and Austria
We study two Austrian and two German federal elections. Both countries are characterised by multi-party systems, and both have a long tradition of coalition governments. Given the increasing fragmentation of the respective party systems (Debus, Döring, and Ecker Reference Debus, Döring, Ecker, B., B. and H.2021; Müller Reference Müller, B., B. and H.2021) and the resulting challenges in building majority coalitions, the relevance of coalition preferences for the winner-loser gap in satisfaction with democracy is clear. In Austria, the Christian-democratic Austrian People’s Party (Österreichische Volkspartei, ÖVP) formed a coalition with the populist radical-right Freedom Party (Freiheitliche Partei Österreichs, FPÖ) in 2017; a similar coalition had governed the country between 2000 and 2003. Following the 2019 election, the ÖVP formed a coalition with The Austrian Greens (Die Grünen – Die Grüne Alternative), the first time the Austrian Greens were in the national government. The ÖVP-Green majority was not expected, rather a majority of these two together with the market-liberal New Austria (Neues Österreich, NEOS) was seen as a possibility.
After the German federal elections of 2021, a ‘Traffic Light Coalition’ of SPD (red), FDP (yellow), and German Greens (green) was formed. This was the first time that these three parties formed a government coalition at the federal level. After the General Election of 2017, Germany experienced a long government formation process. The sitting grand coalition of the centre-right Union (Christlich Demokratische Union/Christlich-Soziale Union, CDU/CSU) and SPD had not done well in the elections, losing more than 100 seats (out of nearly 500). Therefore, the first attempt was to create an alternative coalition: a ‘Jamaica’ coalition – consisting of Union (black), FDP (yellow), and German Greens (green). This failed. Only then did the Union and SPD agree to form another Grand Coalition, a coalition that was initially ruled out by all parties and which was only formed to avoid new elections. Two of the three previous coalition governments before that had been CDU/CSU-SPD coalitions.
There are, of course, several other countries and coalition formation processes that could be of interest for the analysis. However, as Kostelka and Blais (Reference Kostelka and Blais2018: 371) observe, studies using panel data ‘are rare, usually cover only a single election, and often study different, typically more specific, types of political support’. The case selection is, therefore, also driven by the availability of suitable panel data.
Research design
Research on the winner-loser gap has taken different methodological approaches. The simplest approach is to rely on cross-sectional data and to compare the satisfaction with democracy between winners and losers of the election while controlling for potential confounders. This approach suffers from the fact that pre-election levels of satisfaction with democracy are unknown. Thus, such designs cannot rule out that satisfaction with democracy tends to be generally higher among voters of parties that win the election. For example, low levels of satisfaction with democracy are predictive of supporting a populist party (see, e.g., Koch, Meléndez, and Rovira Kaltwasser Reference Koch, Meléndez and Rovira Kaltwasser2023). At the same time, populist parties often do not end up in government. Therefore, time-series data is required for analysing the change in satisfaction with democracy. Trend data allow for comparing the average level of satisfaction with democracy between winners and losers of an election, but it does not allow using individual-level predictors for explaining which voters changed their satisfaction with democracy. Panel data allows for the most precise analysis of changes in satisfaction with democracy (Gärtner, Gavras, and Schoen Reference Gärtner, Gavras and Schoen2020; Singh, Karakoç, and Blais Reference Singh, Karakoç and Blais2012), but such studies are rare.
Furthermore, the existing studies are often simple two-wave panels consisting of a single pre-and post-election wave. Both waves are usually fielded directly before and after the election. For example, Kostelka and Blais (Reference Kostelka and Blais2018: 372) analyse 24 elections using panel data that was collected ‘generally one week before and one week after the given election’. For the argument made in this paper, such data is not particularly suitable as the government formation process is often unclear one week after an election in multi-party systems. Unless a party or a pre-electoral coalition can secure an absolute majority, the election outcome might only make the formation of a certain coalition particularly probable. However, as noted above, in many cases election results often allow for the formation of several potential coalitions, and it is not always clear which of these will eventually be formed, and so assuming that all voters can correctly predict which coalition will form is problematic (Otjes and Willumsen Reference Otjes and Willumsen2023). Therefore, to assess the impact of the coalition formation process, panel data that covers not only the immediate post-election period but also the post-coalition formation period are required. Gärtner et al. (Reference Gärtner, Gavras and Schoen2020) make a similar argument about the importance of panel data, and applied it to the German federal election of 2017. In methodological terms, this paper extends this approach by using long-term panel data from the German federal elections in 2017 and 2021 as well as similar data from the Austrian federal elections in 2017 and 2019.
Panel data
For analysing the German federal elections of 2017 and 2021, data from the German Longitudinal Election Study (GLES) Panel (Debus, Faas, and Roßteutscher Reference Debus, Faas and Roßteutscher2022) are used. We draw on the waves conducted immediately prior to the election (#7 for the 2017 election, #18 and #19 for the 2021 election), following the election, but before the government had formed (#8/#20), and immediately following the formation of the new government (#9/#21).
The Austrian federal elections of 2017 and 2019 are analysed using data from the AUTNES panel (Aichholzer et al. Reference Aichholzer, Partheymüller, Wagner, Kritzinger, Plescia, Eberl and Meyer2020). As with Germany, we draw on the waves immediately prior to the election (#4/#11), immediately afterwards (#5/#12), and immediately following the formation of the new government (#6/#13).
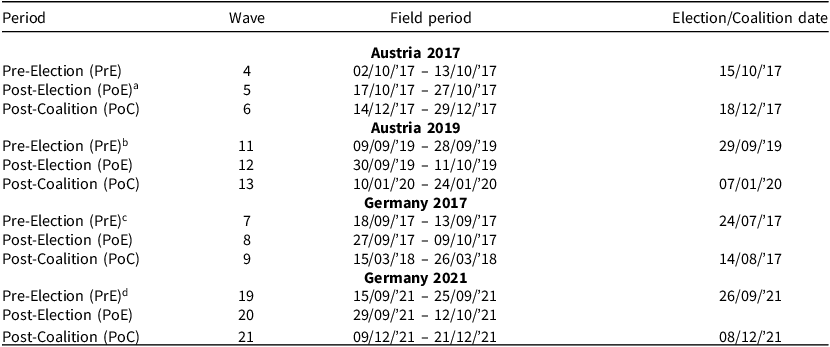
In line with the arguments presented above, we differentiate between three time periods: (1) pre-election, (2) post-election, and (3) post-coalition formation. The post-election period denotes panel waves that were fielded immediately after the election and, thus before the coalition formation process had fully started. Depending on the specific case, it was often still unclear which government coalition would be formed. The post-coalition panel waves were always fielded directly after the new government coalition was officially appointed. The three periods will be abbreviated as ‘PrE’ (pre-election), ‘PoE’ (post-election), and ‘PoC’ (post-coalition). Feelings towards the eventually formed coalition are measured in the pre-election period to ensure that they are not affected by the election outcome. Table 1 summarises the four elections and respective panel waves.
Description of panel waves

Notes: a = Satisfaction with democracy was not measured in this wave, and, thus, only change between PrE and PoC can be analysed. PoE wave in this table reported for completeness.
b = Coalition preference only measured for a coalition of ÖVP, NEOS, and Greens and not for the eventually formed coalition of ÖVP and Greens.
c = Satisfaction with democracy was not measured in this wave and, thus, taken from panel wave 5 (08/’17).
d = Satisfaction with democracy was not measured in this wave and, thus, taken from panel wave 18 (08/’21).
Model specification and estimation strategy
All four elections are analysed using identical model specifications to ensure comparability. The dependent variable is always the change in satisfaction with democracy between two panel waves (compare, e.g., Singh et al. Reference Singh, Karakoç and Blais2012). As three points in time are relevant, we have two dependent variables: (1) the change between pre-election SWD and post-election SWD (PoE-PrE) and (2) the change between pre-election SWD and post-coalition SWD (PoC-PrE).Footnote 3 This approach also allows us to differentiate between any change in satisfaction with democracy purely driven by psychological satisfaction in a favoured party doing well in an election and changes driven by a favoured party entering government, as the former changes will be manifested already in the post-election survey wave. The Austrian election of 2017 is an exception as satisfaction with democracy was not measured in the post-election wave. Therefore, only the pre-election to post-coalition formation change in satisfaction with democracy can be measured. In all cases, the dependent variable has positive values when a respondent’s satisfaction with democracy increased between the two time periods and negative values when it decreased. Moreover, it should be noted that satisfaction with democracy was measured in the GLES panel on a five-point scale (from ‘very dissatisfied’ to ‘very satisfied’ with a middle-category of ‘partly’), while the AUTNES panel uses a four-point scale without the middle-category.
The independent variables are winner-loser-status and coalition preferences. Winner-loser status is measured based on self-reported vote intention in the most recent pre-election panel wave.Footnote 4 Following the standard approach in the literature, winners are respondents that voted for a party that becomes part of the government coalitions. Losers are respondents who supported a party that ends up in opposition. Respondents who refused to answer the vote choice question are excluded, as are non-voters and undecided voters.
Coalition preferences are measured on an 11-point scale. In both panels, respondents were asked how ‘desirable’ they would find certain possible coalitions. We use the desirability of the eventually formed government coalition as a measure of coalition preferences. Higher values indicate a higher desirability for the eventual government coalition. Coalition preferences are measured in the pre-election survey and, thus, not affected by the election outcome. For the Austrian election of 2019, the panel only asked about the desirability of a coalition between the ÖVP, NEOS, and Greens and not only about a coalition between the ÖVP and Greens.Footnote 5 We thus use the coalition preference for a coalition of ÖVP, NEOS, and Greens as a proxy measure as it comes closest to the actual coalition. However, as respondents who indicated that they would vote for NEOS have a strong preference for this coalition, we exclude NEOS voters from the analysis.Footnote 6 Figure C-1 and Figure C-2 in the online Appendix show the distribution of the coalition preference variable, broken down by winner-loser status.
As we use panel data, demographic variables are constant for all respondents; hence, we only include the explanatory variables in the models. We keep only respondents without missing values in any of the relevant variables to create fully balanced panels. Descriptive statistics for all variables can be found in Appendix A. All models are estimated using OLS regression. As both AUTNES and GLES re-invited respondents from the first election in each country for the surveys covering the second election, the assumption of the independence of observations is violated. Hence, we use respondent-clustered standard errors.
Table A-6 in the Appendix provides information on the frequency of changes in satisfaction with democracy in the four country-years. As can be seen, changes in satisfaction with democracy are very common, with more than half of respondents changing their reported level of satisfaction with democracy.
Given that the coalitions formed in Austria (both 2017 and 2019) and Germany (2021) were formed for the first time, one might suspect that voters did not have well-formed opinions on these (hypothetical at the time of asking) coalitions. However, as can be seen in Table A-7 and Table A-8 in the Appendix, there is no evidence that respondents answered ‘don’t know’ or refused to answer how they felt about these coalitions at a substantially different rate than for more well-established coalitions.
We also conduct nine robustness tests: Firstly, in Appendix D we examine winner-loser status on the basis of reported voted (from the PoE wave) instead of vote intention (from the PrE wave). Secondly, Appendix E examines a three-step independent variable instead of a multi-step one (recoding all decreases to -1 and all increases to 1), to ensure our findings are not driven by the relatively few large changes. Thirdly, in Appendix F we report the results of models controlling for political interest. Fourthly, we control for respondents’ levels of partisanship (Appendix G). Fifthly, in Appendix H we examine the role played by policy congruence between a respondent and the eventually formed coalition. Sixthly, we explore a potential interaction effect between coalition feeling and the winner-loser status of a respondent (Appendix I). Seventhly, in Appendix J we explore whether a respondents’ expectations regarding the likelihood of a government forming influences the results. Eighthly, we explore the potential effect of the failed coalition negotiations in Germany 2017, and the re-formation of a government which had suffered substantial electoral losses in the election (Appendix K). Finally, we conduct analyses exploring the effect of the winner-loser status of respondents on their satisfaction with democracy (Appendix L).
Results
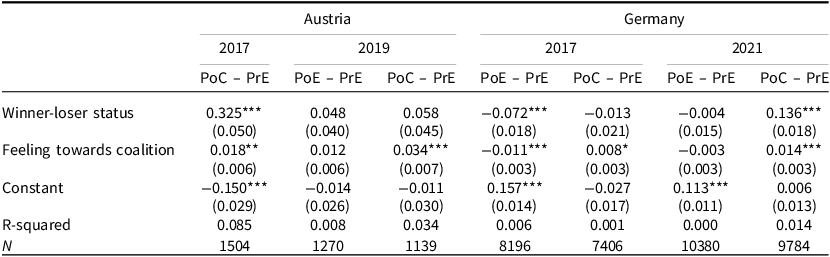
The results of the main models are shown in Table 2. The coalition preference hypothesis argues that the more a voter prefers the coalition that forms after the election, the greater the increase in that voter’s satisfaction with democracy. As can be seen, we find clear support for this in all four cases. In the case of the 2017 elections in Austria, where we only can compare the Post-Coalition formation and Pre-Election wave, the effect is positive and significant at the 1% level.
Regression analyses

*P < 0.05, **P < 0.01, ***P < 0.001 (standard errors in brackets).
In the case of the 2019 elections in Austria, we can compare Post-Election and Pre-Election waves as well as the Post-Coalition formation and Pre-Election wave. This allows us to test the Timing hypothesis, which held that we would observe an effect of coalition preference only after it was formed: coalition preference does not have a significant effect on satisfaction with democracy in the model that compares pre- and post-election waves. In contrast, it is positive and statistically significant at the 0.1% level when comparing the post-coalition and pre-election waves. This provides clear support for the timing hypothesis.
We see a similar pattern in the case of the German 2017 election. If we compare the Post-Election and Pre-Election waves, the coefficient for coalition preference is in the negative direction (and even significant at the 0.1% level). If we compare the Post-Coalition and Pre-Election wave, the effect is positive and significant at the 5% level. Why would people who preferred the formation of a Grand Coalition of Union and SPD coalition decrease their satisfaction with democracy immediately after the 2017 election, but not following the coalition formation? The explanation for this is simple: at the time the post-election survey was conducted, those respondents who favoured a Union-SPD coalition did not expect to get what they wanted, as the SPD had publicly announced that it would not continue in the Grand Coalition, and the parties of the so-called ‘Jamaica’ coalition (Union, FDP and Bündnis ‘90/Die Grünen) were negotiating to form the next government. However, these talks failed, and, in the end, the Grand Coalition was formed, hence the positive effect for PoC-PrE analysis. We explore this in more detail in Appendix K. In the case of the German 2021 election, we find a null effect for coalition preference in the model that compares the Post-election and Pre-Election waves, but a positive and statistically significant (albeit only at the 0.1% level) coefficient in the model that compares the Post-Coalition formation and Pre-Election wave. Overall, we thus find clear support for the Coalition preference hypothesis: Changes in satisfaction with democracy are significantly influenced by voters’ pre-election assessment of the government which forms after the election. In line with the Timing hypothesis, these effects are only visible when looking at the post-formation wave.
We thus find clear support for our core argument in all four country-year cases: Voters’ satisfaction with democracy is significantly influenced by their views of the coalition that eventually forms, and the formation itself matters for voters’ satisfaction with democracy, crystallising losses and wins.
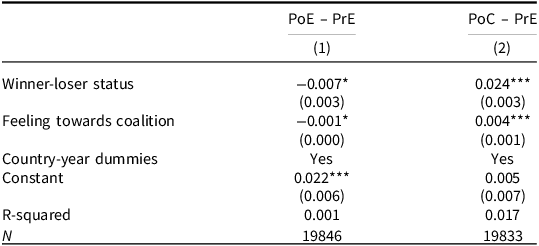
To address the potential concern that our findings are an artefact of the elections we analyse, we run a combined analysis, where we pool the four cases and re-run our models including country-year dummies, to capture any factors specific to each of the elections. As the possible response range for the SWD questions in the German surveys was -4 to +4, and -3 to +3 in the Austrian surveys, we rescale the responses to range from -1 to +1 in both countries to ensure comparability in the pooled analysis.
The results of this are shown in Table 3. As can be seen, while the effect of coalition feeling when looking at changes in satisfaction with democracy from the pre-election to the post-election period (model 1 in Table 3) is negative (with a very small effect size), when we analyse changes from the pre-election to the post-coalition period (model 2 in Table 3), we find statistically significant support for hypothesis 1 (coalition preference).
Models using combined dataset

*P < 0.05, **P < 0.01, ***P < 0.001 (Respondent-clustered standard errors in brackets).
To illustrate the effect size of coalition feeling in the pooled analysis, we calculate the predicted levels of change in satisfaction with democracy, holding the other variables in the model at their means, and visualise this in Figure 1. As can be seen in the left panel of Figure 1, there is little substantive effect of coalition feeling on changes in satisfaction with democracy between the pre-election period and post-election period, and any such effect is negative. However, when looking at changes in satisfaction with democracy between the pre-election period and the post-coalition period, we see a substantial effect of coalition feeling; the difference in satisfaction with democracy between completely disliking the coalition (0) to liking it very much (10) is around .04 points on a scale from minus one to plus one, around one-fifth of a standard deviation. This is equivalent to 2% of the full range of the scale of the dependent variable. To illustrate this effect size in substantive terms: if 10% of respondents increase their level of satisfaction with democracy by one on a 1–5 scale, this would be an effect size of 2.5% of the full range of the scale. As such, the effect of coalition feeling is substantive as well as significant. For comparison, the effect of winner-loser status (‘one of the most robust findings in political science’ (Daoust, Plescia, and Blais Reference Daoust, Plescia and Blais2023: 162)) is equivalent to around 1% of the full range of the scale of the dependent variable, that is, only half as strong as the effect we find for coalition feeling. Also worth noting based on Figure 1 is that for respondents who had the most negative views (i.e., zero on the 0–10 scale) of the coalition which formed, the predicted effect is not statistically significant from zero, supporting our argument that feelings toward the coalition matters for changes in satisfaction with democracy.
Predicted levels of change in SWD at different levels of coalition feeling.
95% confidence intervals shown. Range of the dependent variables: −1 to +1; Based on models 1 and 2 in Table 3.

The results shown in Table 3 provides convincing support for the timing hypothesis – the effect of coalition feelings is significant and in the expected direction once the coalition has formed while it was not in the expected direction immediately after the elections. Overall, we can conclude that our findings are not artefacts of individual elections.
Robustness checks
In order to increase the confidence in our findings, we run a number of robustness checks. Firstly, we explore whether results differ when winner-loser status is determined based on respondents’ self-reported vote choice in the post-election survey. As can be seen in Appendix D, our findings are fully robust to this alternative specification.
Secondly, as values in the dependent variable that are below −1 or above +1 are relatively rare (see Table A-5 in the Appendix), one might suspect that the results are affected by a few observations with large changes in satisfaction with democracy between the elections. To account for this aspect, we conduct robustness analyses in which all positive changes in satisfaction with democracy are recoded as +1 and all negative changes −1 (see Appendix E). The results are always robust to these different specifications.
Thirdly, we explore whether voters who take a greater interest in politics respond differently to government formation in terms of their satisfaction with democracy. To do so, we first re-run the models including a variable measuring respondents’ self-reported level of interest in politics. As can be seen in Table F-1, the results are fully robust to controlling for respondents’ level of interest in politics. We also re-run the models interacting coalition feeling with political interest, to explore whether the effect of coalition feeling systematically varies with the level of interest a person takes in politics. The results of these models are shown in Table F-2, with the marginal effects visualised in Figure F-1. In the two Austrian elections and the German 2021 elections, the effect of coalition feeling is only present among those with higher levels of political interest. This pattern is reversed for the German 2017 elections.
Fourthly, we explore whether the effect of coalition feeling is greater for those respondents who have stronger partisan feelings. We do this first by re-running our models including a variable measuring party identification (the relevant question was not available for Austria in 2017, so we cannot explore this question for this election). In the two German elections, the relevant question was asked both in the pre-election and in the post-coalition formation waves, so we run separate models for these two measurements. In Austria, the question was asked in the post-coalition wave only. As can be seen in Table G-1 (Germany 2017), Table G-2 (Germany 2021), and Table G-3 (Austria 2019), with the partial exception of Germany 2017 (partisanship measured in the pre-election wave), the results appear to be robust to controlling for partisanship. Secondly, we re-run the models interacting coalition feeling with partisanship, to explore whether the effect of coalition feeling systematically varies with the level of partisanship. The results of these models are shown in Table G-4 (Germany 2017), Table G-5 (Germany 2021), and Table G-6 (Austria 2019), with the marginal effects visualised in Figure G-1, Figure G-2, and Figure G-3. In Germany 2017 and Austria 2019, there is no evidence that the effect of coalition feeling systematically varies according to partisanship. In Germany 2021, the effect of coalition feeling is stronger for respondents with higher levels of partisanship than those with lower levels of partisanship, but this difference is only significant in the post-coalition wave.
Fifthly, we explore the potential role played by policy congruence between a respondent and the government which forms. As policy congruence is a well-established predictor of satisfaction with democracy (Mayne and Hakhverdian Reference Mayne and Hakhverdian2017; Singh and Mayne Reference Singh and Mayne2023), and coalition preferences are likely to at least partly incorporate voters’ perceptions of the overall policy position of the coalition, we explore the effect of policy congruence in Appendix H. We find here that Left-Right distance is clearly the inferior predictor: It is only significant in the expected (negative) direction in two country-years (Austria 2017 and Germany 2017), whereas coalition preference was significant in the expected (positive) direction in all four country-years for the post-coalition period. Furthermore, Left-Right congruence only captures the timing effect in one of the three cases (Germany 2017). Overall, it is clear that coalition preference is clearly the superior predictor of changes in satisfaction with democracy.
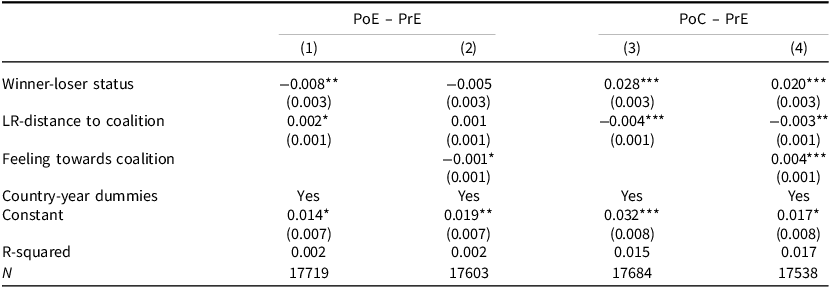
However, this leaves the question of what the results for coalition preference look like when we control for Left-Right distance between a respondent and the coalition. We first conduct a pooled analysis of all four cases at the same time, with a setup similar to the models shown in Table 3, again including country-year dummies to pick up any election-specific effects. The results of this are shown in Table 4. We present four models: for both PoE-PrE and PoC-PrE, we have a model with just Left-Right distance, and a model with both distance and coalition preference. Model 1 (post-election period) finds a weak positive effect of greater Left-Right distance on changes in satisfaction with democracy. This is only significant at the 5% level but more importantly the positive relationship contradicts the expectation that greater Left-Right distance would lead to lower satisfaction with democracy. Model 3 (post-coalition period) finds a highly significant effect in the (expected) negative direction. In models 2 and 4, we add the coalition feeling variable. As in Table 3, the models analysing the post-election period in all four elections at the same time find a weak negative effect of coalition feeling, significant only at the 5% level. Left-Right distance is no longer significant in model 2. In model 4, again similar to the post-coalition period model in Table 3, we find a significant effect in the expected (positive) direction for coalition feeling, significant at the.1% level, even while controlling for Left-Right distance. Left-Right distance remains significant, but the effect size decreases somewhat. The results of the pooled analysis are thus robust to the inclusion of the Left-Right distance variable.
Left-right congruence models using combined dataset

*P < 0.05, **P < 0.01, ***P < 0.001 (Respondent-clustered standard errors in brackets).
In Table H-2, we re-run the country-specific models. For the PoC-PrE models, Left-Right distance is significant in two country-years (Austria 2017 and Germany 2017) and is in the incorrect (positive) direction in the other two country-years. Coalition feelings are in the expected, positive, direction in all four PoC-PrE models, but only statistically significant in two of these (Austria 2019 and Germany 2021, both at the .1% level). The results in Table 4 thus likely reflect this cross-country diversity: there is substantial variation in the correlation between the Left-Right distance and coalition feeling variables across the country-years, ranging from a Pearson’s R of −.62 (Austria 2017) to −.17 (Austria 2019), with Germany 2017 (−.39) and Germany 2021 (−.41) between these extremes. It is thus clear that while Left-Right distance and coalition feeling are in part related to each other, the extent to which this is the case varies greatly. In other words, the two variables are capturing different aspects of voters’ feelings about coalitions and are not simply proxies for each other.
Sixthly, we explore whether the effect of coalition feeling depends on a respondent’s winner-loser status, by re-running our models including an interaction term between these two variables. The results of the models are shown in Table I-1, with the marginal effect of winning as coalition feeling varies, visualised in Figure I-1. As can be seen in the top half of Figure I-1, in the post-election period, there are no significant differences between the effect of coalition feeling depending on whether a respondent is a winner or a loser. In the post-coalition period, no significant differences are found in Germany 2017 and Austria 2017, while in Germany 2021 and in Austria 2019, the effect of coalition feeling is stronger for respondents who voted for a losing party, compared to those who voted for a winning party. This supports our argument that coalition feelings are key to understanding changes in satisfaction with democracy, as the effects of views regarding the desirability of a coalition in part are generally stronger for those voters who did not vote for a party entering government.
Seventhly, we explore the role of respondents’ expectations regarding which coalition would form, as this expectation could influence their assessment of that coalition. To explore this, we re-ran our models for the post-coalition period controlling for how likely a respondent thought a coalition was to form. As can be seen in Table J-1, our results are robust to this alternative specification in three of the four cases, but in Germany 2017, while the effect remains positive, it is now only significant at the 10% level.
Eighthly, we note that of the four country-year cases, the findings are weakest for Germany 2017, being significant at only the 5% level in the post-coalition period, and significantly negative in the post-election period. We explore this in greater detail in Appendix K. We start by noting that the finding of a negative effect of coalition feeling on satisfaction with democracy in the post-election period is most likely driven by the fact that the post-election survey was conducted during negotiations for a so-called ‘Jamaica’ coalition government (CDU/CSU-FDP-Green), which later failed, meaning that the voters were assessing the ‘wrong’ coalition in the post-election survey, underlining the importance of also conducting post-coalition surveys. We explore this by re-running our analyses, coding voters for the three ‘Jamaica’ parties as winners and measuring coalition feeling regarding the ‘Jamaica’ coalition. The results of this are shown in Table K-1. As can be seen, in the post-election period, the effect of coalition feeling is now essentially zero. This is also the case in the post-coalition period, which we would expect given that this government did not form. While the CDU/CSU remained the biggest party and returned to power after the 2017 election, they had nonetheless suffered substantial electoral losses (over 8% points relative to 2013), As can be seen in Table K-2, where we replace the winner/loser variable with a CDU/CSU voter variable, despite winning, these voters were significantly and substantially much less satisfied with democracy in the post-election period (which also explains the negative effect of the winner/loser variable in the post-election period in Table K-2). However, this negative effect disappears once the government has formed, and the benefits of returning to office had become concrete, again underlining the importance of post-coalition surveys.
The 2017 German election is also unusual in that there is no overall increase in satisfaction with democracy following the election. As can be seen in Table K-3, unlike in Austria 2019 or Germany 2021, where there was an increase in satisfaction with democracy both immediately following the election and then a further significant increase following the formation of the new government, Germany 2017 sees a significant decrease in satisfaction with democracy after the coalition formation process, with an overall effect of zero when comparing the pre-election and post-coalition periods. It seems likely that this is driven by the combination of a very long government formation process which first led to an acrimonious failure of the ‘Jamaica’ coalition to form, and the fact that the government which eventually formed was the Grand Coalition which had already governed from 2013 to 2017, and which lost almost 14% points of the popular vote in the 2017 election.
Finally, we explore the role played by winner-loser status in the four elections analysed. As noted above, the finding that winners have higher levels of satisfaction with democracy is very well-established, but we do not consistently find this in our analyses. The reason for this is the inclusion of our main explanatory variable (coalition feeling). As can be seen in Table 1, when running our models without this variable, the effect of winner-loser status is consistently significant and positive in the post-coalition period, with the exception of Germany 2017, the particularities of which were discussed in greater detail above. The picture is more mixed for the post-election period, but as we have argued above, the relevant moment to assess the effect of winner-loser status is after the government has formed. The consistent significant effect of coalition feeling on satisfaction with democracy and the lack of a consistent effect of winner-loser status thus underline the importance of coalition feelings for explaining changes in satisfaction with democracy.
Conclusion
In many countries, election night creates clear winners and losers, as either the governing party has kept or lost its majority. People’s satisfaction with democracy shifts when the television shows the exit poll. Winners jump up and scream, and their satisfaction with democracy jumps up as well. Losers feel dejected, which is reflected in how they feel about democracy. This is typically how majoritarian Westminster systems function. In proportional, consensus democracies, the dynamic is different: the real contest begins after the votes are counted. The government formation is the ‘second half’ of the game. In this phase, parties that gained votes in the elections may be left empty-handed while those who lost the elections may still join the government. And even then, joining the government may not be a reason for joy, if the party you voted for decides to join a government with a party that you dislike.
In this article, we argued that voters’ views of the coalition government which forms after an election is key to understanding changes to their levels of satisfaction with democracy. Both an understanding of satisfaction with democracy as driven by future (expected) changes in public policy and one that sees satisfaction with democracy as a function of a voter getting psychological satisfaction from their preferred party or combination of parties winning would predict that voters’ views of the government would matter, and that for losers, a liking for the government which forms would counteract (at least in part) their having voted for a losing party.
Analysing four elections using high-quality panel data, we found support for both our hypotheses: Voters’ views of the coalition which forms matters for changes to their satisfaction with democracy, and the effect of coalition preferences is stronger once the coalition has actually formed than immediately after the election. Our results are highly significant and comparable in size to existing longitudinal studies of the effect of winner/loser status on changes in satisfaction with democracy (see, e.g., Plescia, Daoust, and Blais Reference Plescia, Daoust and Blais2021; Singh, Karakoç, and Blais Reference Singh, Karakoç and Blais2012).
We find similar patterns for different coalition formations: both for coalitions that have been formed before and for novel ones, both for coalitions that includes parties from the flanks and centrist coalitions, both for coalitions that were expected to form beforehand and those that even researchers did not see coming. This diversity makes it likely that similar patterns occur in other systems where coalition formation is not directly clear after the election. But given that we only look at two countries and four formations, we of course cannot be fully certain of the generalisability of our results. That said, our results clearly suggest that coalition formation processes and preferences shape satisfaction with democracy in ways different to what the literature currently suggests. We suggest that election studies, particularly in countries where coalition governments are the norm, should consider conducting three-wave instead of two-wave or one-wave surveys, in part, in order to be able to answer such questions. Typically, there is a pre-election wave and a post-election wave. We propose adding a post-formation wave in election studies within consensus democracies with extended coalition formation processes. Given our findings that government composition significantly shapes citizens’ satisfaction with democracy, we believe that adding a ‘third wave’ to electoral research is useful. Future research could delve further into satisfaction with democracy by seeing to what extent policy preferences shape this satisfaction after the formation. Does agreeing or disagreeing with particular elements of the government agreement make citizens more likely to update their satisfaction with democracy? Studies like Gärtner et al. (Reference Gärtner, Gavras and Schoen2020) approximate this with party positions, but the actual outcomes of coalition negotiations are not necessarily the weighted mean of party positions in some low-dimensional policy space (Willumsen and Otjes Reference Willumsen and Otjes2026).
Yet there are other attitudes that may also be shaped by the formation. There is a cornucopia of options: firstly, does the formed coalition lead voters to regret their vote choice? So far, studies of voting regret look at post-election regret (Blais and Kilibarda Reference Blais and Kilibarda2016) without incorporating how citizens feel about the coalition that their vote did or did not contribute to. Secondly, does it affect their political cynicism? The feeling that citizens only care about one’s vote and not one’s opinion may be strengthened (or weakened) by the outcomes of negotiations (Agger, Goldstein, and Pearl Reference Agger, Goldstein and Pearl1961). Thirdly, does it affect their attitudes towards compromises (Wolak Reference Wolak2020)? After seeing how the ‘sausage’ of compromise is actually made, people may change their view about how they value such outcomes. Fourthly, does it affect their attitude towards democratic reform, in particular those that would give citizens a greater say over the executive (Ziemann Reference Ziemann2009)? Fifthly, does it affect their trust in political actors (Levi and Stoker Reference Levi and Stoker2000), in particular those that have negotiated and made compromises? And finally, does it affect where voters place political parties ideologically? There is some attention to how coalition formation affects voters’ estimates of their left-right positions, but this work suffers from the lack of panel data that spans the post-formation period (Falcó-Gimeno and Fernandez-Vasquez Reference Falcó-Gimeno and Fernandez-Vasquez2020). Given that the answers to some of the questions we have outlined only become apparent with time, panel data which covers the post-coalition period, in other words, the period during which the government actually governs and implements its coalition agreement, may have to be incorporated into electoral studies.
It remains an open question what drives the coalition preferences of voters. We have shown in this article that these preferences clearly affect how citizens evaluate election outcomes. But we do not know to what extent coalition preferences are driven by voters’ policy preferences or their attitudes towards other aspects of the parties. We also do not know whether voters mainly respond positively to their most preferred party entering the coalition or whether they respond negatively to a party they dislike entering the coalition. Exploring and disentangling the drivers of coalition preferences is thus a fertile field for future research.
Supplementary material
To view supplementary material for this article, please visit https://doi.org/10.1017/S1475676526101157
Data availability statement
Data available upon request.
Acknowledgements
This paper was previously presented at the 2024 European Political Science Association Conference. We thank Annika Werner, the participants in the session ‘Support for Democracy I’ and the anonymous reviewers for their comments and suggestions.
Financial support
None of the authors have received funding related to this publication.
Competing interests
The authors declare none.


 Open access