


1. Introduction
Fused silica optics is widely used in high-power laser facilities such as inertial confinement fusion (ICF) due to its high transparency and excellent thermal and chemical stabilities. However, there exist some intrinsic defects and many kinds of flaws on the surface associated with the fabrication process of fused silica optics. These defects could absorb ultraviolet laser and cause the initial laser damage [Reference Miller, Suratwala and Bude1] and then further degrade the laser-induced damage threshold (LIDT) of fused silica optics. Some approaches, such as ion beam etching [Reference Kamimura, Akamastsu and Yamamoto2, Reference Adesida, Ping and Youtsey3], chemical etching [Reference Miller, Suratwala and Bude1, Reference Tankahagi, Ishitani and Kuroda4], and CO2 laser treatment [Reference Adams, Bolourchi and Bude5, Reference Feit and Rubenchik6], have been employed to mitigate the initial damage sites. Among these methods, CO2 laser treatment is one important method to repair the initial damage site by heating effect. Some investigations demonstrated that the LIDT may return to the normal level or higher after CO2 laser treatment [Reference Brusasco, Penetrante, Butler, Maricle and Peterson7, Reference Brusasco, Penetrante and Butler8]. Although there have been some reports on the optical and mechanical effects of CO2 laser treatment for scratches and laser-induced damage sites on the surface of fused silica, as well as the physical model of the secondary treatment or annealing process to eliminate residual stress [Reference Doualle, Gallais, Cormont, Hebert, Combis and Rullier9, Reference Doualle, Gallais, Cormont, Donval, Lamaignere and Rullier10], there is no report about the evolution of defects on the fused silica surface during this process.
Some works revealed that the intrinsic defects and laser-induced structural defects in fused silica optics include the E′-center [Reference Griscom, Friebele and Sigel11], which comprised an unpaired electron of single silicon bonded to just three oxygens, oxygen-deficiency center (ODC) [Reference Zatsepin, Biryukov and Kortov12], nonbridging oxygen hole center (NBOHC) [Reference Pacchioni, Skuja and Griscom13], peroxy radical (POR) [Reference Griscom14], and Si nanocluster [Reference Rebohle, von Borany, Fröb, Gebel, Helm and Skorupa15]. The presence of defects in the silica matrix can dramatically change its structural, electrical, and optical properties. So, photoluminescence (PL) spectra are one significant tool to understand the evolution of the defects in the fused silica optics during high-power laser irradiation. According to PL analysis, the electron structural information of various defect species and the distribution of defects on the surface should be obtained for fused silica optics.
Some groups investigated the luminescence properties of the defects in fused silica in the past few decades. Demos et al. assigned the luminescent bands around 400 nm and 650 nm to ODC and NBOHC defects [Reference Demos, Staggs and Kozlowski16], separately. The other emission bands in the range from 450 nm to 600 nm are attributed to the combination of the self-trapped exciton (STE). Švrček et al. concluded that the emission band of the Si nanocluster can be in a wide range around 700 nm. The concentration of various defects in the laser-induced initial damage site would increase dramatically compared with the pristine area. The initial damage site will probably expand exponentially due to higher defect density as reported [Reference Norton, Hrubesh and Wu17–Reference Švrček, Fujiwara and Kondo19].
In this paper, PL properties of defects near the surface for the laser damage site and CO2 laser treatment site are systematically investigated. The correlation between the distribution of different defects and LIDT in the same site is analyzed.
2. Experimental
The experiments were conducted on UV-grade Corning 7980 fused silica samples with 40 mm square and a thickness of 4 mm. They were firstly etched in the buffered hydrofluoric (HF) acid solutions and then cleaned by deionized water.
Laser-induced damage sites were generated on the output surface of pristine samples by using a triple-frequency Nd:YAG laser (Saga) which delivers a pulse width of 6.3 ns at 355 nm with a diameter of 800 μm at 1/e 2. The diameter of the damage area is about 250 μm.
The CO2 laser of the repairing treatment is a commercial radio frequency power excited CO2 laser (Coherent GEM-100L), with a maximum output power of 100 watt and power stability of ±3%.
The photoluminescence spectra were recorded by using a spectrometer (LabRAM HR800, Jobin Yvon) with a confocal microscope and a multichannel air-cooled CCD detector. The excitation sources were an Ar ion laser (λ 0 = 514.5 nm; source power: 20 mW) and He-Cd laser (λ 0 = 325 nm; source power: 40 mW). All spectra were recorded at room temperature.
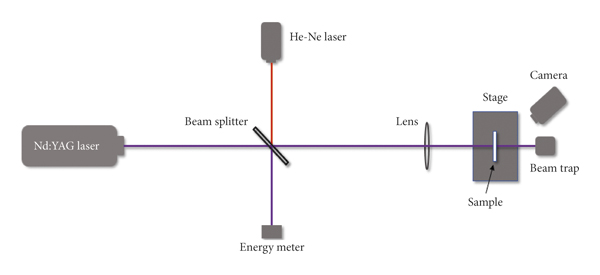
Laser-induced damage threshold is obtained by the R-on-1 testing mode. The schematic diagram of the measurement setup is shown in Figure 1. On each selected site, the laser fluence was progressively increasing, until the first damage occurred. For each set of parameters, a series of sites were selected and analyzed, and the results given in this work are based on a statistical analysis on the fused silica samples.
Schematic diagram of the laser-induced damage threshold measurement. The setup consists of a single-longitudinal-mode Nd:YAG laser at 355 nm, a He-Ne laser collimating light source, a beam splitter, a focusing lens, an energy meter, and a two-dimensional stage.
3. Results and Discussion
Figure 2(a) shows the photoluminescence spectra at the pristine region and the damaged region of the fused silica sample with the excitation of 325 nm laser. The corresponding decomposition peaks are displayed in Figures 2(b) and 2(c), respectively. The shoulder peak around 400 nm is from ODC defects. The broad emission bands centered at 490 nm and 580 nm can be definitely ascribed to the transition from the laser-induced STE [Reference Zatsepin, Biryukov and Kortov12, Reference Pacchioni, Skuja and Griscom13]. The peaks around 650 nm and 750 nm are assigned to the luminescence bands of NBOHC and Si nanocluster defects, respectively. The weak emission indicates the low concentration for these defects in the clear pristine sample. These defects in pristine fused silica optics can have a high absorption for the UV laser and become an initial laser damage site according to existing reports [Reference Miller, Suratwala and Bude1, Reference Griscom, Friebele and Sigel11, Reference Zatsepin, Biryukov and Kortov12]. In other words, the low defects’ density can guarantee the high LIDT value. The contribution from the NBOHC and Si nanocluster is hardly observable for the pristine region, but the obvious peaks occur for the two defects in the damaged region as seen in Figure 2.
(a) PL spectra of the pristine region and damaged region of the fused silica sample with 325 nm excitation. The decomposition peaks for (b) the pristine region and (c) the damaged region.
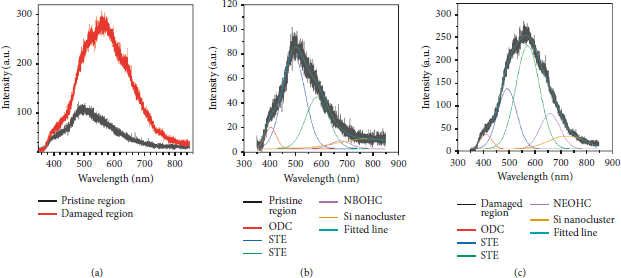
Figure 3 compares the photoluminescence spectra of the pristine region, ion beam etching-treated region, and the edge region of the laser-induced damage site with the excitation of a 514.5 nm laser. The sharp peaks at 526 nm, 536 nm, and 543 nm are the response to Raman modes for Si-O-Si, fourfold rings, and threefold rings in fused silica, respectively [Reference Griscom, Friebele and Sigel11].
(a) PL spectra of the fused silica sample with 514.5 nm excitation. Curve #1: pristine region, curve #2: the edge region of the laser-induced damaged site, and curve #3: the ion beam etching-treated region. The inset is the microscopic image of the selected damage site. (b) The magnification of the inset. (c) The microscopic image of the etching region.
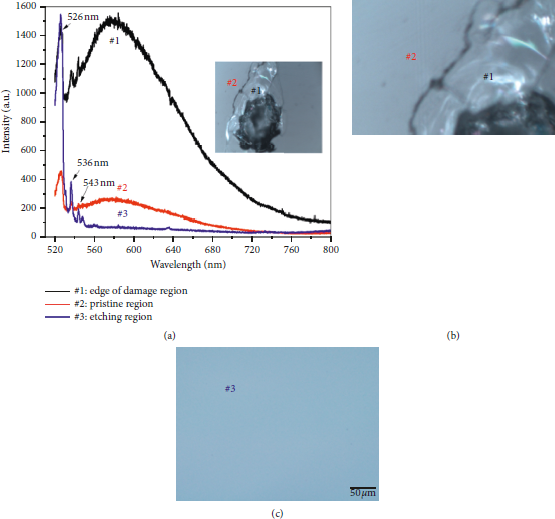
The broad weak fluorescence of curve #2 in Figure 3 for the pristine region is similar to that in Figure 2 with 325 nm excitation. Ion beam etching process can smooth the surface of the optics and mitigate a part of the existing surface defects. The microscopic image of the etching region is shown in Figure 3(c). It is smoother and has higher uniformity compared with the pristine region.
Except for Raman peaks, no emission bands can be detected for the ion beam etching-treated sites as seen in curve #3 of Figure 3(a). This verified that the ion beam etching process can remove the flaws localized on the surface and enhance the LIDT value.
The strong luminescent band centered at 580 nm is quite prominent as shown in curve #1 of Figure 3(a) for the edge region of the laser-induced damage area. It indicates that the laser-induced damage process generates a higher concentration of defects. In general, the type and relative concentration of defects depend on the peak position and intensity of PL spectra, respectively. As the description given above, the laser-induced self-trapped excitons dominate the emission around 580 nm. These defects could result in the damage of fused silica under ultrahigh power running of the UV laser due to the strong absorption. Investigating the influence on the LIDT from these defects, the values of LIDT at different sites are measured by the R-on-1 testing mode [Reference Li, Yan and Yang20]. The LIDT, the type, and the relative concentration of defects for different regions are given in Table 1. The LIDT values for the pristine surface and ion beam-treated region are 13.9 J/cm2 and 17.2 J/cm2, separately. The low LIDT value of 4 J/cm2 is the response to the edge region of the laser-induced damage site. The results from Table 1 reveal that the PL intensity is inversely proportional to the LIDT value of the fused silica optics. Further comparing the contribution from different defects for the pristine region and damaged region, the laser-induced STEs dominate the damaged threshold value. These results indicate that the PL can be employed to check the quality of pristine fused silica and evaluate the possible LIDT value based on the confirmed reference standard sample.
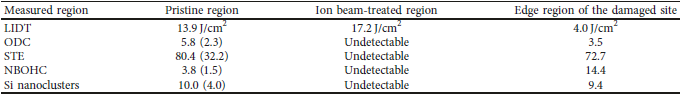
The PL intensity is normalized. The intensity of the pristine region possesses 40% of the intensity for the damaged site. The value in the bracket for the pristine region is the relative ratio to the PL intensity of the damaged region.
CO2 laser treatment is the most effective method for fused silica materials to mitigate the defects on the surface. Figure 4(a) shows the optical microscopy image of the CO2 laser treatment site. The PL spectra of three different regions are shown in Figure 4(b). This laser-induced damage site has been overtreated by the CO2 laser, and the ablation trace can be observed in its edge region. The PL spectrum for the edge region has relative high intensity around 500 nm from the laser-induced STE and the shoulder at 400 nm from the ODC according to the previous reports [Reference Pacchioni, Skuja and Griscom13, Reference Griscom14]. The measured LIDT value in this region is 4.5 J/cm2, and it supports the same inverse proportional correlation between PL band intensity centered at 500 nm and the LIDT.
(a) Optical microscopy images of the CO2 laser treatment site. (b) PL spectra of different regions under 325 nm excitation.
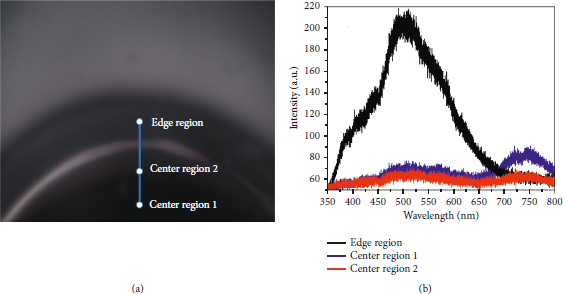
In spite of the weak fluorescence for center regions 1 and 2, a new luminescence band centered at 750 nm obviously occurs. This band is ascribed to the Si nanoclusters. The fabrication process and Si-implanted a-SiO2 after 1100°C annealing can generate the nanoclusters [Reference Stesmans, Jivanescu, Godefroo and Zacharias21]. These inducing paths are all related to the CO2 laser heating process. The intensity at center region 1 is higher due to near the center and bathing in higher temperature during the laser irradiation. These results are quite helpful to understand the mechanism of defects’ evolution of the CO2 laser treatment process. It should also be noticed that the LIDT value in center region 1 of the CO2 laser-treated site is 19.2 J/cm2 higher than 17 J/cm2 for center region 2 as shown in Figure 5. This indicates that CO2 laser-treated fused silica optics can run under higher fluence compared to the pristine fused silica optics.
Luminescent intensities of defects and LIDT values for different regions in Figure 4. Each photoluminescence spectrum area is normalized to that at the edge region.
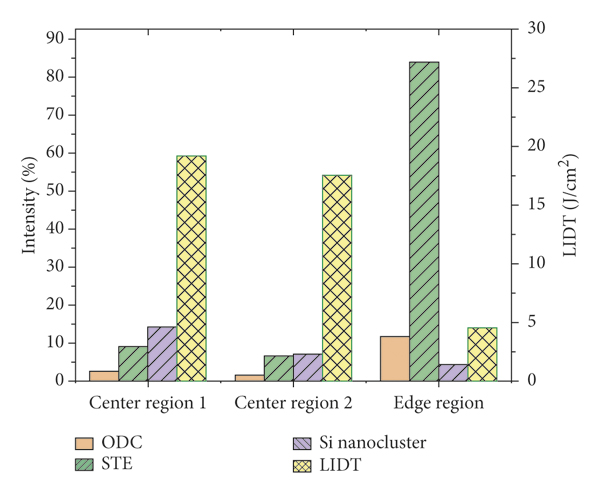
Combining Table 1 with Figures 4 and 5, we can conclude that the weak photoluminescence can be taken as the criterion of the high LIDT value; furthermore, the higher nanocluster contribution protects the damage of fused silica under higher laser power running. In fused silica materials, the self-trapped exciton is known to be correlated with the absorption precursor according to the existing reports; this is consistent with the results shown in Figure 5. The relationship between the LIDT and Si nanocluster needs to be studied further.
4. Conclusions
PL technique combined with the laser-induced damage threshold measurement is employed to investigate the distribution of the defects on the surface of the fused silica sample. The inverse proportional correlation between fluorescence and LIDT value is built according to the experimental results. The weak photoluminescence and the higher Si nanocluster concentration can enhance the LIDT value for the fused silica optics after CO2 laser treatment. The investigation reveals that the fluorescence can be employed to check the quality of pristine fused silica and evaluate the possible laser-induced damage threshold value. The wide emission from the ODC and self-trapped excitons dominates the low LIDT value. The current results are helpful for understanding the evolution of action from CO2 laser treatment and fused silica optics.
Data Availability
The data used to support the findings of this study are available from the corresponding author upon request.
Disclosure
Qiao Chen and He Wang are the coauthors.
Conflicts of Interest
The authors declare that they have no conflicts of interest.
Acknowledgments
This work was supported by the National Natural Science Foundation of China (nos. 12074360, 21905263, and 51677175), the Science Challenge Project (no. TZ2016001), and the Fundamental Research Funds for the Central Universities.


 Open access