


Introduction
Yellow fever (YF) is a mosquito-borne viral infection that remains endemic in tropical Africa and South America. YF symptoms can range from asymptomatic reaction to severe symptoms like vomiting, nausea, organ failure, or death. The annual estimate, recorded by the World Health Organization, is between 29,000 and 60,000 deaths [Reference Frierson1]. To combat the viral spread, the YF 17D vaccine was first released in 1937 by the Rockefeller Institute as one of the early live-attenuated vaccines. Max Theiler and his team extracted the YF virus from an African man and passed the live virus into chicken embryos and mouse brain tissue. The YF 17D vaccine can provide lifelong immunity for vaccinated individuals. As a live-attenuated virus, there is a risk of vaccine-associated disease, and the vaccine is not recommended for pregnant or immunocompromised individuals, nor for certain persons with recognized risk factors, including older age, thymus disorders, and autoimmune disorders. However, serious adverse events (AEs) are relatively rare, making it a low-risk vaccination compared to the risk of YF infection [Reference Beck and Barrett2]. The YF 17D vaccination is regarded as a travel vaccination in the USA and is electively administered to individuals traveling to endemic areas by a travel medicine clinic.
In rare instances, the YF vaccination can lead to severe AEs. Yellow Fever Vaccine-Associated Neurotropic Disease, which includes viral encephalitis, meningitis, Guillain-Barré syndrome, and bulbar palsy [3–Reference Oliveira, Araujo, Sousa, Donis, Moreira and Makssoudian4], occurs at a rate of 0.8 cases per 100,000 doses administered. Less frequently, at a rate of 0.3 cases per 100,000 doses, a disseminated condition similar to natural YF disease, known as Yellow Fever Vaccine-Associated Viscerotropic Disease (YEL-AVD), can occur, resulting in liver failure, hemorrhage, and potentially multi-organ system failure and death [Reference Goldstein, Bell and Gunson5,Reference Fernandes, Gomes, de Oliveira, Duarte-Neto, de Sousa and LK6].
To continuously improve vaccination safety and surveillance for AEs, our objective is to determine whether we can develop a machine learning (ML) framework that analyzes clinical electronic health record (EHR) data to predict the risk of severe AEs from vaccination in a patient population by utilizing documentation from the YF vaccinated group.
The increasing availability of real-world data from EHR systems has created new opportunities for population-level risk stratification and clinical surveillance. However, EHR-derived datasets present inherent analytical challenges, including high dimensionality, possibly correlated clinical variables (multicollinearity), and incomplete or missing data resulting from variations in clinical documentation and care delivery. These characteristics complicate traditional statistical modeling and motivate applying varying ML methods based on their differences in assumptions, robustness, and interpretability.
The potential of EHRs in the context of vaccination data remains largely unexplored. Vaccination data illustrate how EHRs could provide essential insights for surveillance of varying-risk populations.
In this study, we will examine the well-defined YF vaccination population from our previous EHR analyses, leveraging the fact that YF vaccination in the USA is administered exclusively through FDA-approved travel between 2017 and 2021 [Reference Farnsworth, Khanipov, Botnar, Weaver, Barrett and Golovko7]. To construct this framework, we evaluated five predictive model algorithms, including random forest (RF), gradient boosting, extreme gradient boosting (XGBoost), logistic regression (LR), and Bernoulli naïve Bayes (BNB).
These ML algorithms were chosen to identify the best approach for analyzing the YF vaccination dataset. LR was selected as a baseline model due to its interpretability and widespread use in clinical risk prediction, despite its sensitivity to multicollinearity among predictor variables. BNB was included for its computational efficiency, suitability for high-dimensional data, and robustness to class imbalance in clinical groups, despite its assumption of predictor independence. In contrast, the three tree-based ensemble methods (RF, GB, and XGBoost) were selected for their ability to model nonlinear relationships, handle complex interactions and missing data, and reduce the impact of multicollinearity through recursive feature splitting. To validate the model responses, we implemented K-fold validation and performance metrics such as precision, accuracy, recall, F1-score, and receiver operating characteristic area under the curve (ROC-AUC) calculations to provide a comparative output to identify the best framework for YF clinical data. By comparing these models, we aim to assess how different algorithmic assumptions influence predictive performance in the context of vaccination safety surveillance.
Methods
Cohort design and population
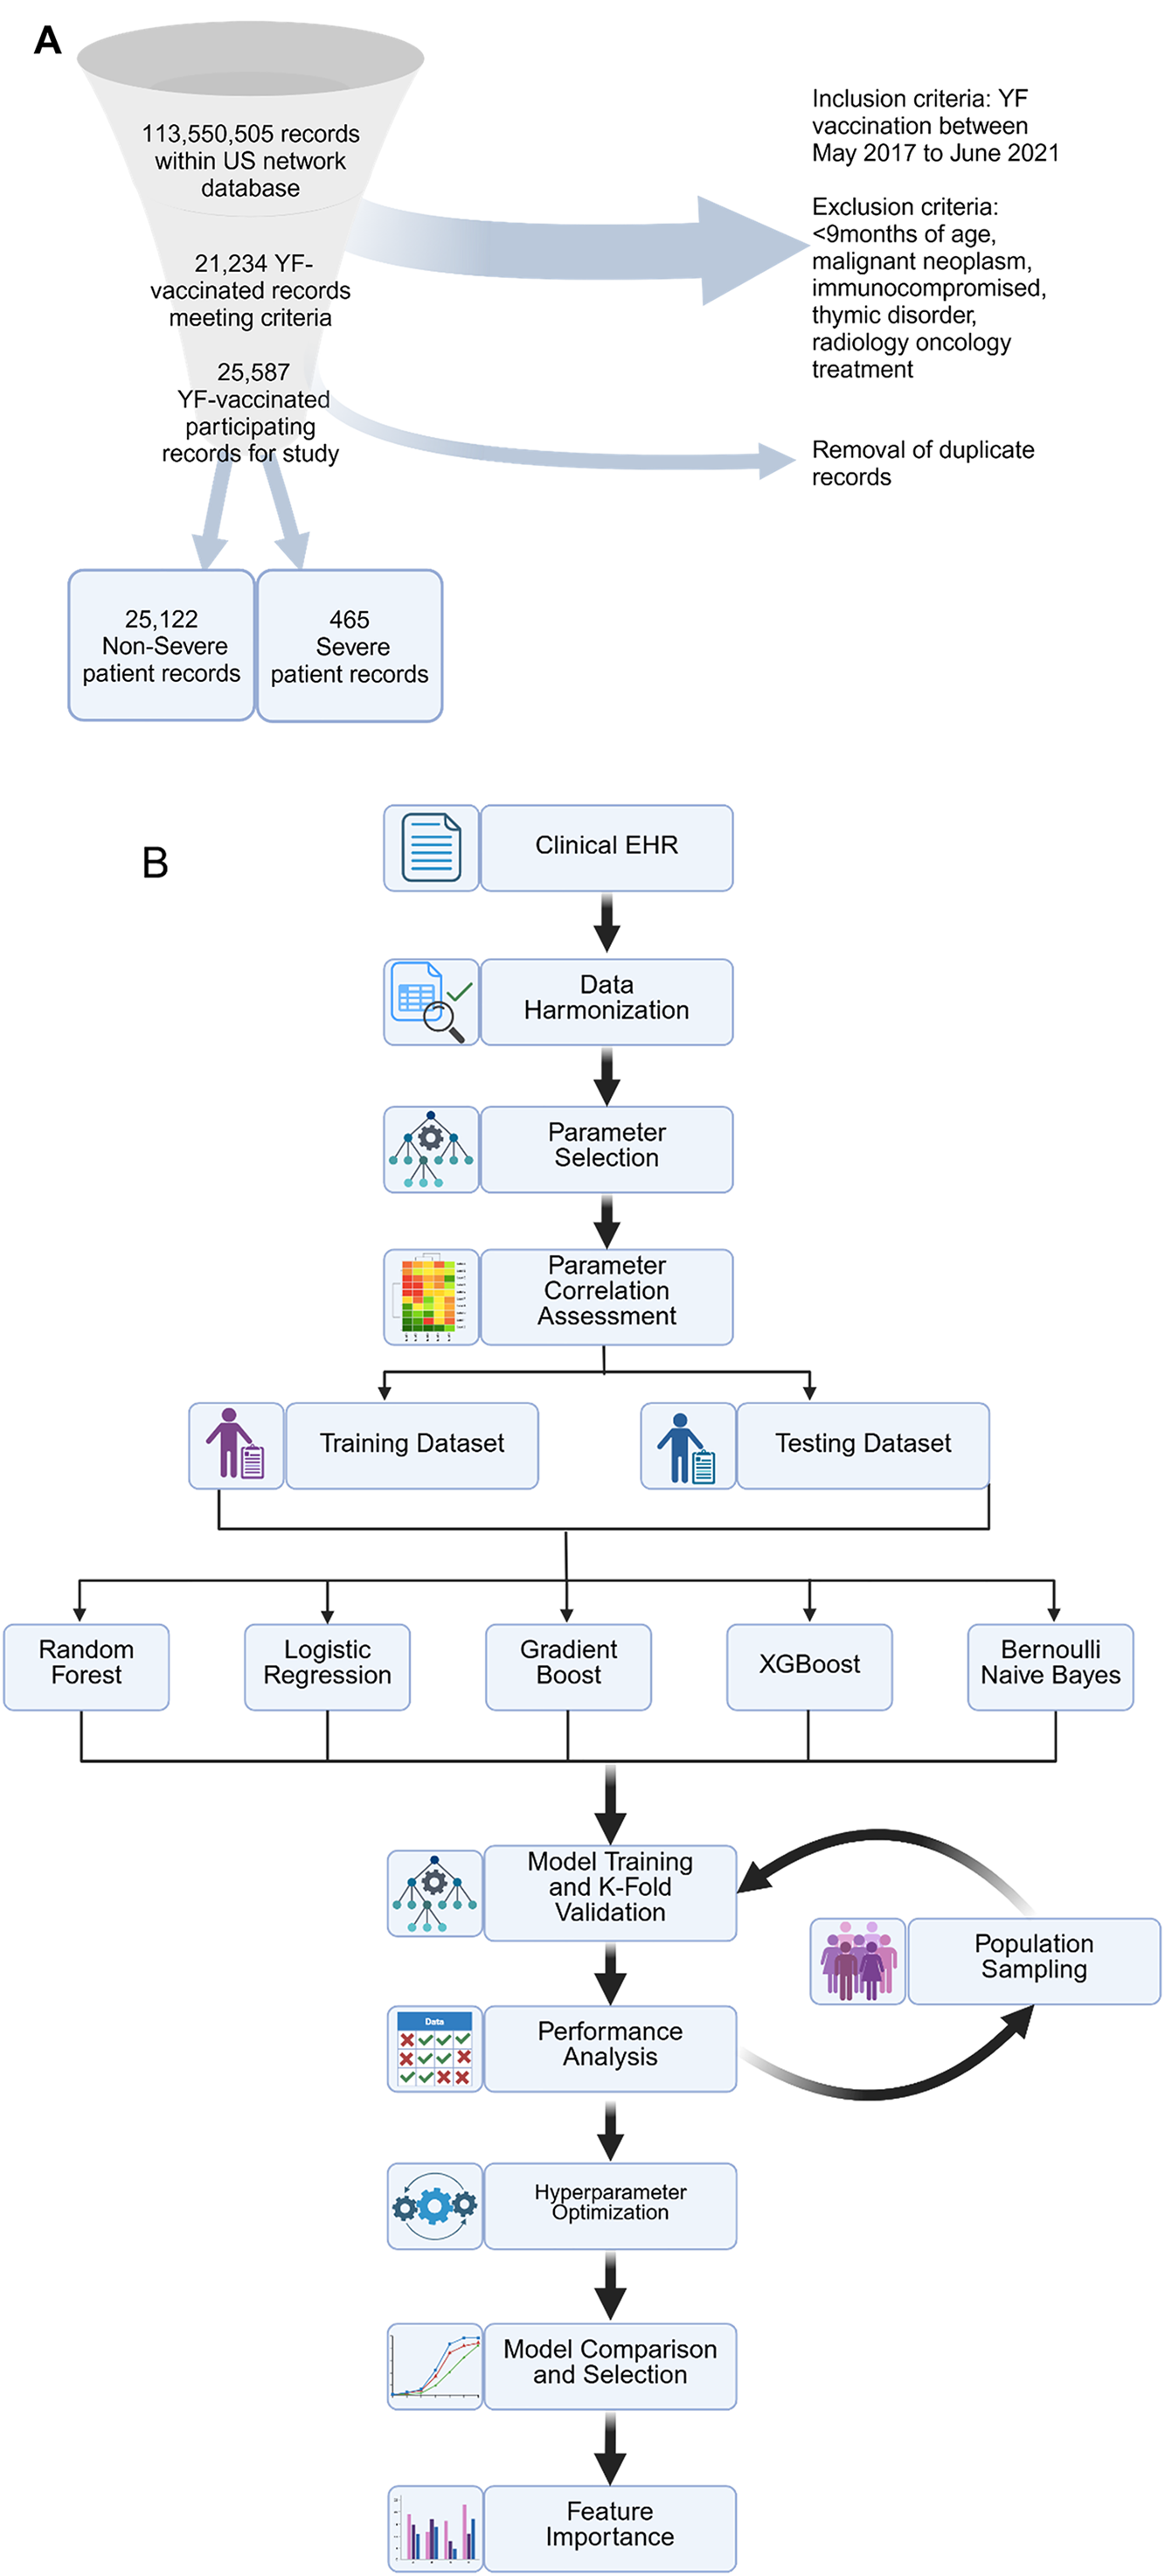
The framework for classifying YF vaccination patient records is shown in Figure 1. The patient cohorts and requested data were exported from the TriNetX database, a health research network with a website interface granting access to EHRs. These records include data on patient diagnoses, laboratory data, medications, procedures, and genomic information from multiple healthcare organizations (HCOs). Using the same dataset from one of our earlier studies, the EHR extracted from the US Collaborative Network (with natural language processing) contained data involving 113,550,505 patients from 64 HCOs from all demographics within the USA [8]. TriNetX provides de-identified EHRs compliant with the Health Insurance Portability and Accountability Act of 1996 and Safe Harbor privacy principles [9,Reference Botnar, Nguen, Farnsworth, Golovko and Khanipov10].
(a) Flowchart of the record selection process from the TriNetX database. The initial population of the entire US Collaborative network database for the two cohorts was determined by adverse patient outcomes. (b) Workflow for comparative analysis of the five ML algorithms and the necessary data quality, harmonization, and selection. The selected population was split into two different datasets to train and validate the chosen models.

Figure 1. Long description
Panel A: A flowchart of the record selection process from the TriNetX database. The process starts with 113,550,505 records within the US network database. It narrows down to 21,234 yellow fever-vaccinated records meeting criteria, then to 25,587 records participating in the study. After removing duplicates, it results in 25,122 non-severe and 465 severe patient records. Panel B: A workflow diagram for comparative analysis of five machine learning algorithms. It begins with clinical electronic health records (EHR) and proceeds through data harmonization, parameter selection, and parameter correlation assessment. The selected population is split into training and testing datasets. The training dataset undergoes model training and K-fold validation using Random Forest, Logistic Regression, Gradient Boost, XGBoost, and Bernoulli Naive Bayes algorithms. Performance analysis, hyperparameter optimization, model comparison and selection, and feature importance are then conducted.
The participating records satisfied the specified inclusion criteria: individuals who had received the YF vaccination between May 2017 and June 2021. This timeframe was chosen to replicate the timeframe the YF 17D vaccine, Stamaril®, was approved for administration in place of the normally distributed YF-Vax®. Both vaccines are manufactured by Sanofi. YF vaccination status was determined by the presence of one of four possible YF vaccination codes: v04.4, 99.43 diagnostic International Classification of Diseases 9th and 10th Revision code (ICD-9-CM and ICD-10-CM), 89,890 medical prescription normalized (RxNorm), or 90,717 Current Procedural Terminology code. The exclusion criteria were as follows for one year before vaccination: age younger than 9 months, diagnosis of malignant neoplasm, immunocompromised, diagnosis of thymic disorder, allergy to vaccine components, or radiology or oncology treatment (Supplemental Figure 1). From the overall database population of 113,550,505 individual patients, 25,587 individuals met the inclusion and exclusion criteria within the set timeline after duplicate record removal.
Two cohorts were formed to represent patients with severe AEs one month after vaccination and patients who did not experience severe AEs after vaccination. Of the 25,587 patient population, 25,122 individuals are in the non-severe AE cohort, and 465 are in the severe AE cohort. The distinction of AEs is listed in Supplemental Figure 2. The non-severe AE cohort includes individuals who did not report any medical outcomes within 30 days of vaccination or mild medical outcomes such as headache, fatigue, dizziness, typically not requiring medical intervention. In contrast, the severe AE cohort encompasses life-threatening or system-wide conditions such as encephalitis, Guillain-Barré syndrome, liver failure, or severe respiratory failure requiring hospitalization, and can lead to long-term health consequences.
Input data and necessary software
For the clinical data framework, we integrated and employed open-source platforms to facilitate the computational analysis: EHRchitect (version 1.1.0) for data harmonization, sklearn (version 1.6.1) for algorithm database, data preprocessing, and performance metrics, XGBoost (version 2.1.3), and imblearn (version 0.13.0) for random undersampling [Reference Botnar, Nguen, Farnsworth, Golovko and Khanipov10–19]. In this study, the input data files were requested from the existing clinical database, TriNetX. Exported files from TriNetX are CSV text files that include a singular patient in each row and column of parameters (lab values, medical history, demographic information, etc.). This clinical framework was developed in Jupyter Notebook (version 7.0.8) using Python (version 3.10) [20]. The necessary packages include pandas, seaborn, and numpy. The framework can run on any operating system that supports Python version 3.8+, including Windows (10/11), macOS, and major Linux distributions (Ubuntu 20.04+, Debian 11+, Fedora 32+, CentOS 8+, and Arch Linux).
Data harmonization
We employed the EHRchitect software (v.1.1.0) to harmonize data exported from TriNetX and define patient cohorts based on predefined inclusion and exclusion criteria [Reference Botnar, Nguen, Farnsworth, Golovko and Khanipov10]. The preprocessing workflow encompassed handling missing values, removing duplicate records, and standardizing data inputs. Patient records without a date of birth were removed from consideration. Missing values concerning race, sex, or ethnicity were labeled with the “unknown” value. All duplicate records were removed. Data was further standardized with all date fields formatted as “YYYY-MM-DD,” and the age of vaccinations is calculated as the difference between the date of birth and the date of the vaccination. Cohort selection was guided by a configuration file outlining the selection criteria, and the resulting datasets were exported as CSV files. These files served as input for model training in subsequent analytical steps.
The study parameters with binary values were encoded using 1 if the patient possessed the feature and 0 if the patient did not. An exception is sex, where male was indicated with 1 and female was indicated with 0. We used OneHotEncoder from sklearn to encode demographic parameters such as ethnicity and race [11]. Age, the only continuous variable among the parameters, was stratified into four age groups (0–16, 16–32, 32–60, and 60+) and encoded as ordinal categories (0–3) for modeling. Age binning was designed to minimize noise, and similarly, data analysis for the input algorithms. The binning age groups were designed based on the differences in medical diagnosis outcomes within the age groups we had found in our previous study [Reference Farnsworth, Khanipov, Botnar, Weaver, Barrett and Golovko7].
No statistical imputation (e.g., mean, median, etc.) was performed on the dataset. Missing categorical values were retained as a distinct ‘unknown’ category to preserve data integrity. All ML models (LR, naïve Bayes, RF, gradient boosting, and XGBoost) were trained using the same preprocessed datasets and feature representations. This consistent preprocessing ensures that differences in model performance are attributed to model characteristics rather than differences in data handling.
Parameters
Due to the extensive amount of data involving the patient’s health records, we have identified 14 relevant diagnostic parameters, including four known factors as comorbidities in developing severe YF infections inflicted by the YF virus, two known disease outcomes of severe YF infection, and eight common chronic conditions considered risk factors in Medicare and are known contributors to poorer cancer prognosis. Each of the 14 diagnostic parameters includes multiple ICD-9 or ICD-10 diagnostic codes to describe the related condition; the complete list of all diagnostic codes is in Supplemental Figure 3 [22]. These parameters are expressed as “1,” meaning the ICD-10 diagnostic code is present in the patient’s medical history, and “0” represents the lack of the code. This change will reduce unnecessary labels and computational complexity. We also included demographic parameters, including age, sex, race, and ethnicity – the source HCOs collected each parameter during clinical visits. Any multicollinearity among predictors was assessed using Spearman’s rank correlation [21].
Predictive models
Five algorithms were tested to determine the optimal method to analyze the YF 214 vaccination dataset. The LR method is highly interpretable and effective in analyzing binary data [25]. RF is a commonly used model for clinical data as it is equipped with embedded bootstrapping, decreasing the possibility of overfitting the dataset and avoiding selection bias, which are common concerns when modeling clinical data [Reference Magazzino, Mele and Coccia27]. GB, like the RF method, employs ensembled decision trees as the basis for classification and prediction [13]. In contrast to RF, GB algorithms possess a greater number of hyperparameters, allowing us to modulate how the data is analyzed. The lower the learning rate, the longer the models take, increasing the number of decision trees made; controlling the generation of trees can assist in avoiding overfitting the data [Reference Dos Santos, França and Lima Filho29]. XGBoost aligns with other boosting methods. XGBoost generates decision trees sequentially and assigns weights to all independent variables; however, the XGBoost algorithm includes more extensive error corrections to optimize its predictive or classifying output values and overcome challenges of missing values within a dataset, a necessary feature to accurately analyze raw RWD [Reference Ganie, Pramanik, Bashir Malik, Mallik and Qin23, 30]. Due to the additional correctional methods, XGBoost algorithms require high computational power and have lower interpretability of their results. BNB is computationally efficient and performs well on highly dimensional datasets [Reference Pate, Riley and Collins32,Reference Ghosh and Cabrera33]. The BNB algorithm effectively overcomes noise and works with imbalanced data, which is crucial when clinical outcomes are rare.
Given that the structure of EHR data is often coded as presence or absence indicators (e.g., diagnosis or demographic features), we will transform all input variables into a standardized binary format to improve model interpretability. Although this setup aligns naturally with LR, we included additional models due to their established performance in clinical data modeling. These models are capable of capturing nonlinear relationships and complex parameter interactions [Reference Ahmed, Ahammed, MdM, MdA, Akhter and Talukder34,Reference Chen35].
Random undersampling
Most approved vaccinations in the USA have a high efficacy rate, including the YF 17D vaccine. As a result of this high efficacy, vaccination data contains an imbalance between the populations with normal, non-severe reactions to vaccination and patients who presented with severe AEs. To overcome this challenge and develop a framework that applies to vaccination, requiring us to address this imbalance rather than exclude a large population of our healthy patients, we employed methods of random undersampling in our population [19].
Imbalanced datasets are more likely to introduce bias in the training dataset that can influence the ML algorithms to ignore the minority cohort to increase their accuracy by solely focusing on the majority class. Random undersampling allows the datasets to become rebalanced and promotes the algorithm to interact more with the minority cohort. We performed ten independent random undersampling data groups with cohort ratios ranging from 0.1 to 1.0 (minority population: majority population), depending on model performance. This range enables us to identify the optimal population ratio for achieving accurate results while preserving the natural imbalance, thereby providing a suitable model for real-world vaccination data where population imbalance remains constant. The model performance was then assessed based on the average scoring metric of the undersampling.
Performance matrix and model validation methods
The performance of the proposed models will be compared and evaluated using calculations based on a confusion matrix, including precision, accuracy, recall, F1-score, and ROC-AUC [16]. To ensure model robustness and reduce the risk of overfitting, we employ stratified K-fold validation within the training datasets. We used 10-fold cross-validation (K = 10), where the dataset was partitioned into 10 subsets, maintaining class distribution across folds. [17]. After model development and tuning, we assess the final generalized performance with the validation dataset to create a two-tiered evaluation process to prevent data leakage. Finally, SHapley Additive exPlanation (SHAP) evaluation serves as a parameter importance ranking [24, Reference Oliveira, Duarte and Vieira Filho37]. All model and validation input parameters are discussed in Supplemental Figure 4.
Results
Demographic and clinical parameter baseline results
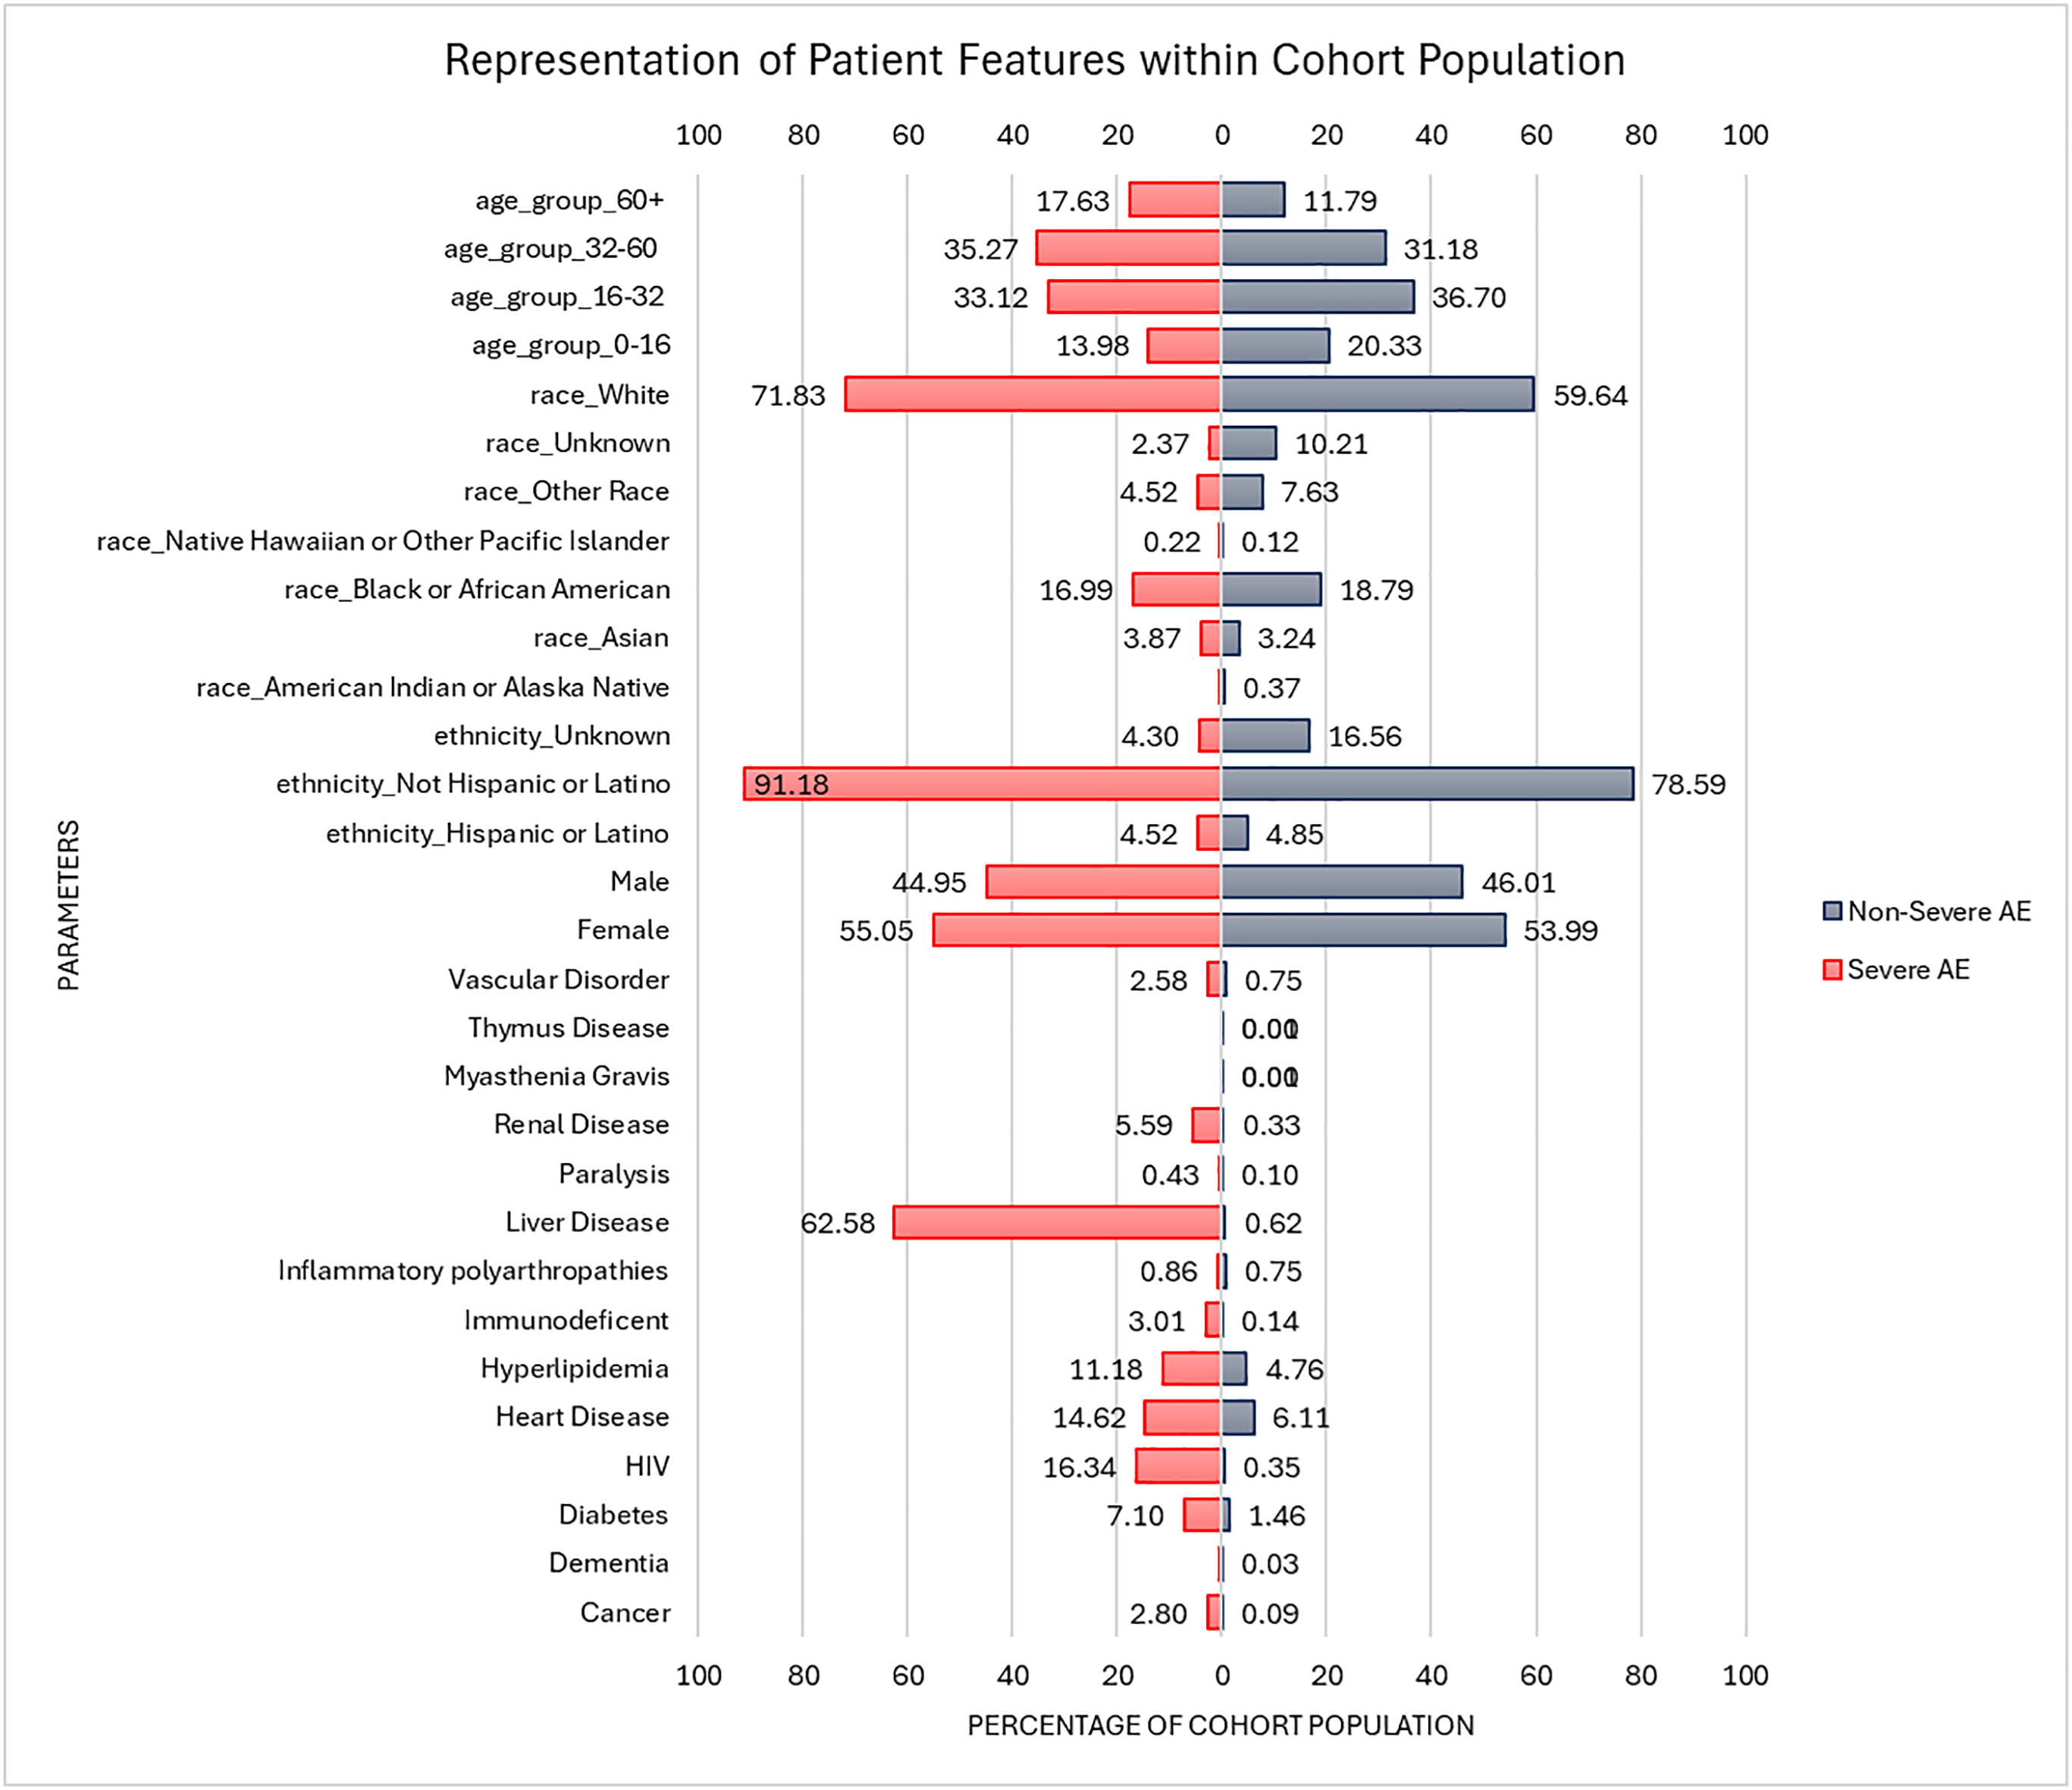
Our YF vaccinated population includes 465 individuals who experienced severe AEs following vaccination and 25,122 individuals who did not experience severe AEs to the YF-17D vaccination. We conducted a baseline comparison of the parameter representation percentage for both cohorts in Figure 2.
Baseline parameters of study participants in the severe and non-severe cohorts. The population percentage within their respective cohorts is expressed on the x-axis. Patient records of those who possess the demographic parameter or confirm a diagnostic history of the clinical parameters are shown in this graph. Conditions, including hyperlipidemia, cardiovascular disease, HIV, and diabetes, were more prevalent in the adverse event cohort, reflecting baseline clinical differences leveraged by machine learning models for risk discrimination.

Among the 14 clinical parameters, the most significant difference between the two cohorts is that there is a higher population (62%) of individuals who experience severe AEs and have a history of liver disease than those who experienced non-severe AEs (<1%). It is important to note the differences in baseline clinical 288 characteristics between the non-severe and severe AE cohorts. These 289 differences will emphasize the heterogeneity in diagnostic backgrounds, which could improve 290 discrimination of the ML framework between higher and lower risk individuals.
We had examined the relationships among parameters using Spearman’s rank correlation, a nonparametric method that does not assume normality. The strongest positive association observation was between heart disease and hyperlipidemia (p = 0.42), indicating a weak correlation. Overall, no strong or moderate correlations were identified, suggesting a low risk of multicollinearity among the input variables for subsequent modeling.
Multicollinearity was preliminarily assessed using Spearman’s correlation analysis. No strong pairwise correlations (|p| ≥ 0.7) were observed, suggesting a low likelihood of severe multicollinearity. With no strong correlations observed indicates a low risk of instability in model estimates. While LR and BNB can be sensitive to correlation predictors, low levels of multicollinearity suggest that there will be minimal impact [Reference Sai, Chettri, Panigrahi, Garg, Bhoi and Barsocchi38]. Tree-based methods, including RF, GB, and XGB, are inherently robust to multicollinearity, supporting validity in our approach for cross-model comparisons.
Baseline model results
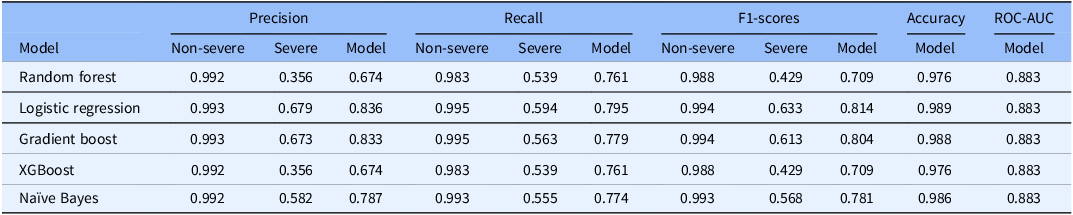
Initial testing of five ML models was conducted using the study parameters without altering the imbalances of the cohorts within the dataset or hyperparameters. This allowed us to create a baseline performance score using basic model optimization with less computational time. The precision, recall, and F1-scores for each cohort were calculated, and the overall metric scores of the models are presented in Table 1. In our efforts to create a modeling framework that accurately classifies at-risk patients for severe reactions to vaccination, we have concentrated on the model’s ability to avoid false negative scores, thus reducing the risk of a type 2 error. Consequently, we have aimed to develop a high-precision modeling framework for this clinical dataset. To enhance the algorithm’s performance later, we recorded the baseline performance of RF, LR, gradient boost, XGBoost, and BNB, with model precisions of 67.4%, 83.6%, 83.3%, 67.4%, and 78.7%, respectively. Table 1 indicates that the model with the highest precision is LR, showing an 83.6% precision score and cohort-specific precision scores of 99.3% for the non-severe cohort and 67.9% for the severe cohort.
The initial performance results of the five modeling algorithms. The performance matrix can be evaluated based on singular cohort predictions and on the overall model predictions

Random undersampling
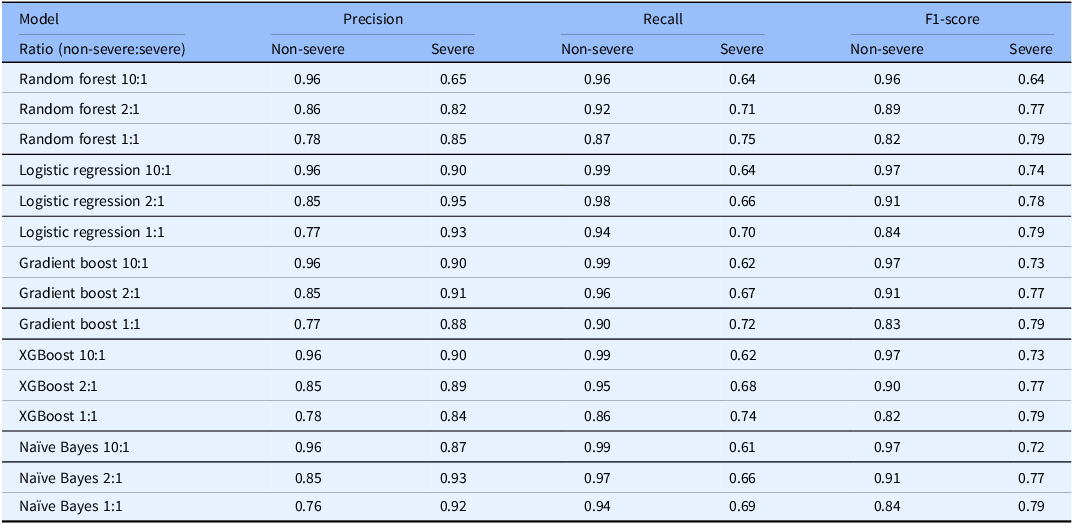
The trending difference between the non-severe and severe cohorts’ performance scores results directly from the imbalance in population, which can lead modeling algorithms to favor predicting the majority cohort while neglecting the minority cohort to optimize prediction accuracy. To enhance modeling performance and reduce potential cohort selection bias, we implemented the random undersampling methodology from imblearn. The results are presented in Table 2. For models LR, gradient boost, XGBoost, and BNB, the highest precision performance scores were achieved with higher sampling ratios and fewer iterations, recording 93.5%, 93.24%, 93.31%, and 91.72%, respectively. In contrast, RF modeling precision (84.91%) and recall (82.18%) scores improved with smaller sampling ratios and greater numbers of iterations. The rebalancing of the cohort population did enhance the performance of all tested models. The most dramatic improvement was observed in the RF modeling algorithm, which saw its best precision, recall, and F1-scores increase by 23.51%, 10.08%, and 32.01%, respectively.
The performance results of the five modeling algorithms with random undersampling. Random undersampling extracts a smaller ratio of the patient population to present a more balanced cohort. The sampling is repeated in iterations to involve all data points within both cohorts. The sampling strategy ratio is a result of the cohort population ratio of the resampling subsets; 0.1, 0.5, and 1.0 indicate a ratio of 10:1, 2:1, and 1:1 of the non-severe and severe cohorts, respectively

Table 2. Long description
The table presents the performance metrics of various modeling algorithms using random undersampling. It includes precision, recall, and F1-score for non-severe and severe cohorts across different sampling ratios. The table has 12 rows and 7 columns. The columns are labeled as Model, Precision Non-severe, Precision Severe, Recall Non-severe, Recall Severe, F1-score Non-severe, and F1-score Severe. The rows are labeled with different models and their respective sampling ratios. Row 1: Random forest 10:1, 0.96, 0.65, 0.96, 0.64, 0.96, 0.64. Row 2: Random forest 2:1, 0.86, 0.82, 0.92, 0.71, 0.89, 0.77. Row 3: Random forest 1:1, 0.78, 0.85, 0.87, 0.75, 0.82, 0.79. Row 4: Logistic regression 10:1, 0.96, 0.90, 0.99, 0.64, 0.97, 0.74. Row 5: Logistic regression 2:1, 0.85, 0.95, 0.98, 0.66, 0.91, 0.78. Row 6: Logistic regression 1:1, 0.77, 0.93, 0.94, 0.70, 0.84, 0.79. Row 7: Gradient boost 10:1, 0.96, 0.90, 0.99, 0.62, 0.97, 0.73. Row 8: Gradient boost 2:1, 0.85, 0.91, 0.96, 0.67, 0.91, 0.77. Row 9: Gradient boost 1:1, 0.77, 0.88, 0.90, 0.72, 0.83, 0.79. Row 10: XGBoost 10:1, 0.96, 0.90, 0.99, 0.62, 0.97, 0.73. Row 11: XGBoost 2:1, 0.85, 0.89, 0.95, 0.68, 0.90, 0.77. Row 12: XGBoost 1:1, 0.78, 0.84, 0.86, 0.74, 0.82, 0.79. Row 13: Naïve Bayes 10:1, 0.96, 0.87, 0.99, 0.61, 0.97, 0.72. Row 14: Naïve Bayes 2:1, 0.85, 0.93, 0.97, 0.66, 0.91, 0.77. Row 15: Naïve Bayes 1:1, 0.76, 0.92, 0.94, 0.69, 0.84, 0.79.
Hyperparameter optimization and K-fold validation
To further improve our scores, each model was evaluated for optimal hyperparameters to better match the algorithm with the characteristics of the clinical dataset. We tested various hyperparameter combinations to enhance the alignment between the dataset and the model, thereby boosting performance. Hyperparameter tuning was conducted using a fixed set of model-specific parameters optimized for classification performance (Supplemental Figure 4). For LR, the model was trained using an L2 penalty with C = 1, a liblinear solver, and a maximum of 100 iterations, and no class weighting was applied. The RF model was configured with n_estimators of 50, a maximum tree depth of 5, a minimum samples per split of 10, and a minimum samples per leaf of 1. The GB classifier included 100 N-estimators at a learning rate of 0.05, a maximum depth of 4, subsample set to 0.8, and minimum samples per split and leaf of 15 and 2, respectively. The XGBoost model was tuned using logloss as the evaluation metric and enabled categorical feature integration. Finally, BNB was trained with alpha set to 0.1, binarized at 0.5, and with the fit prior setting enabled. All models were initialized with a fixed random state to ensure reproducibility across cross-validation folds.
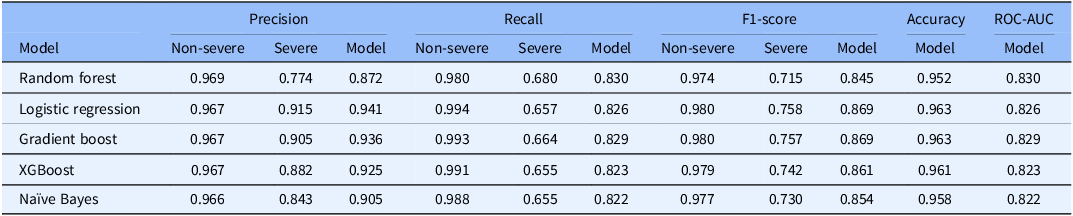
For K-fold validation, we incorporated 10-fold stratified cross-validation (K = 10) to further assess the efficiency of our tested models for comparative analysis. Each model yielded results within a close range for the overall precision score, with RF reporting the lowest at 87.2% and LR reporting the highest at 94.1%. It is anticipated that LR would report a high-precision value due to the conversion of nearly all study parameters, except for the patient’s age, which was converted to binary values. LR achieved the best overall metric scores with precision, accuracy, and ROC-AUC scores of 94.1%, 96.3%, and 0.826, respectively (Table 3).
The performance results of the five modeling algorithms with hyperparameters for each respective model, with integrated stratified K-fold cross-validation with 10 iterations

Independent dataset validation
We used an independent sampling of the original dataset to validate the performance of the LR classification algorithm (Table 4). The validation precision score of 99.4% for determining true positives of the non-severe AE and 76.0% for determining severe AEs within patient records after immunization, with the overall model reporting an 87.7% precision. The ROC-AUC score, or the statistical relationship between the false positive and true positive rates, was 0.818. Based on these findings, the LR model was deemed a suitable algorithm for the classification modeling within the clinical vaccination data analysis framework.
The final performance results of the logistic regression validation model test

SHAP parameter importance
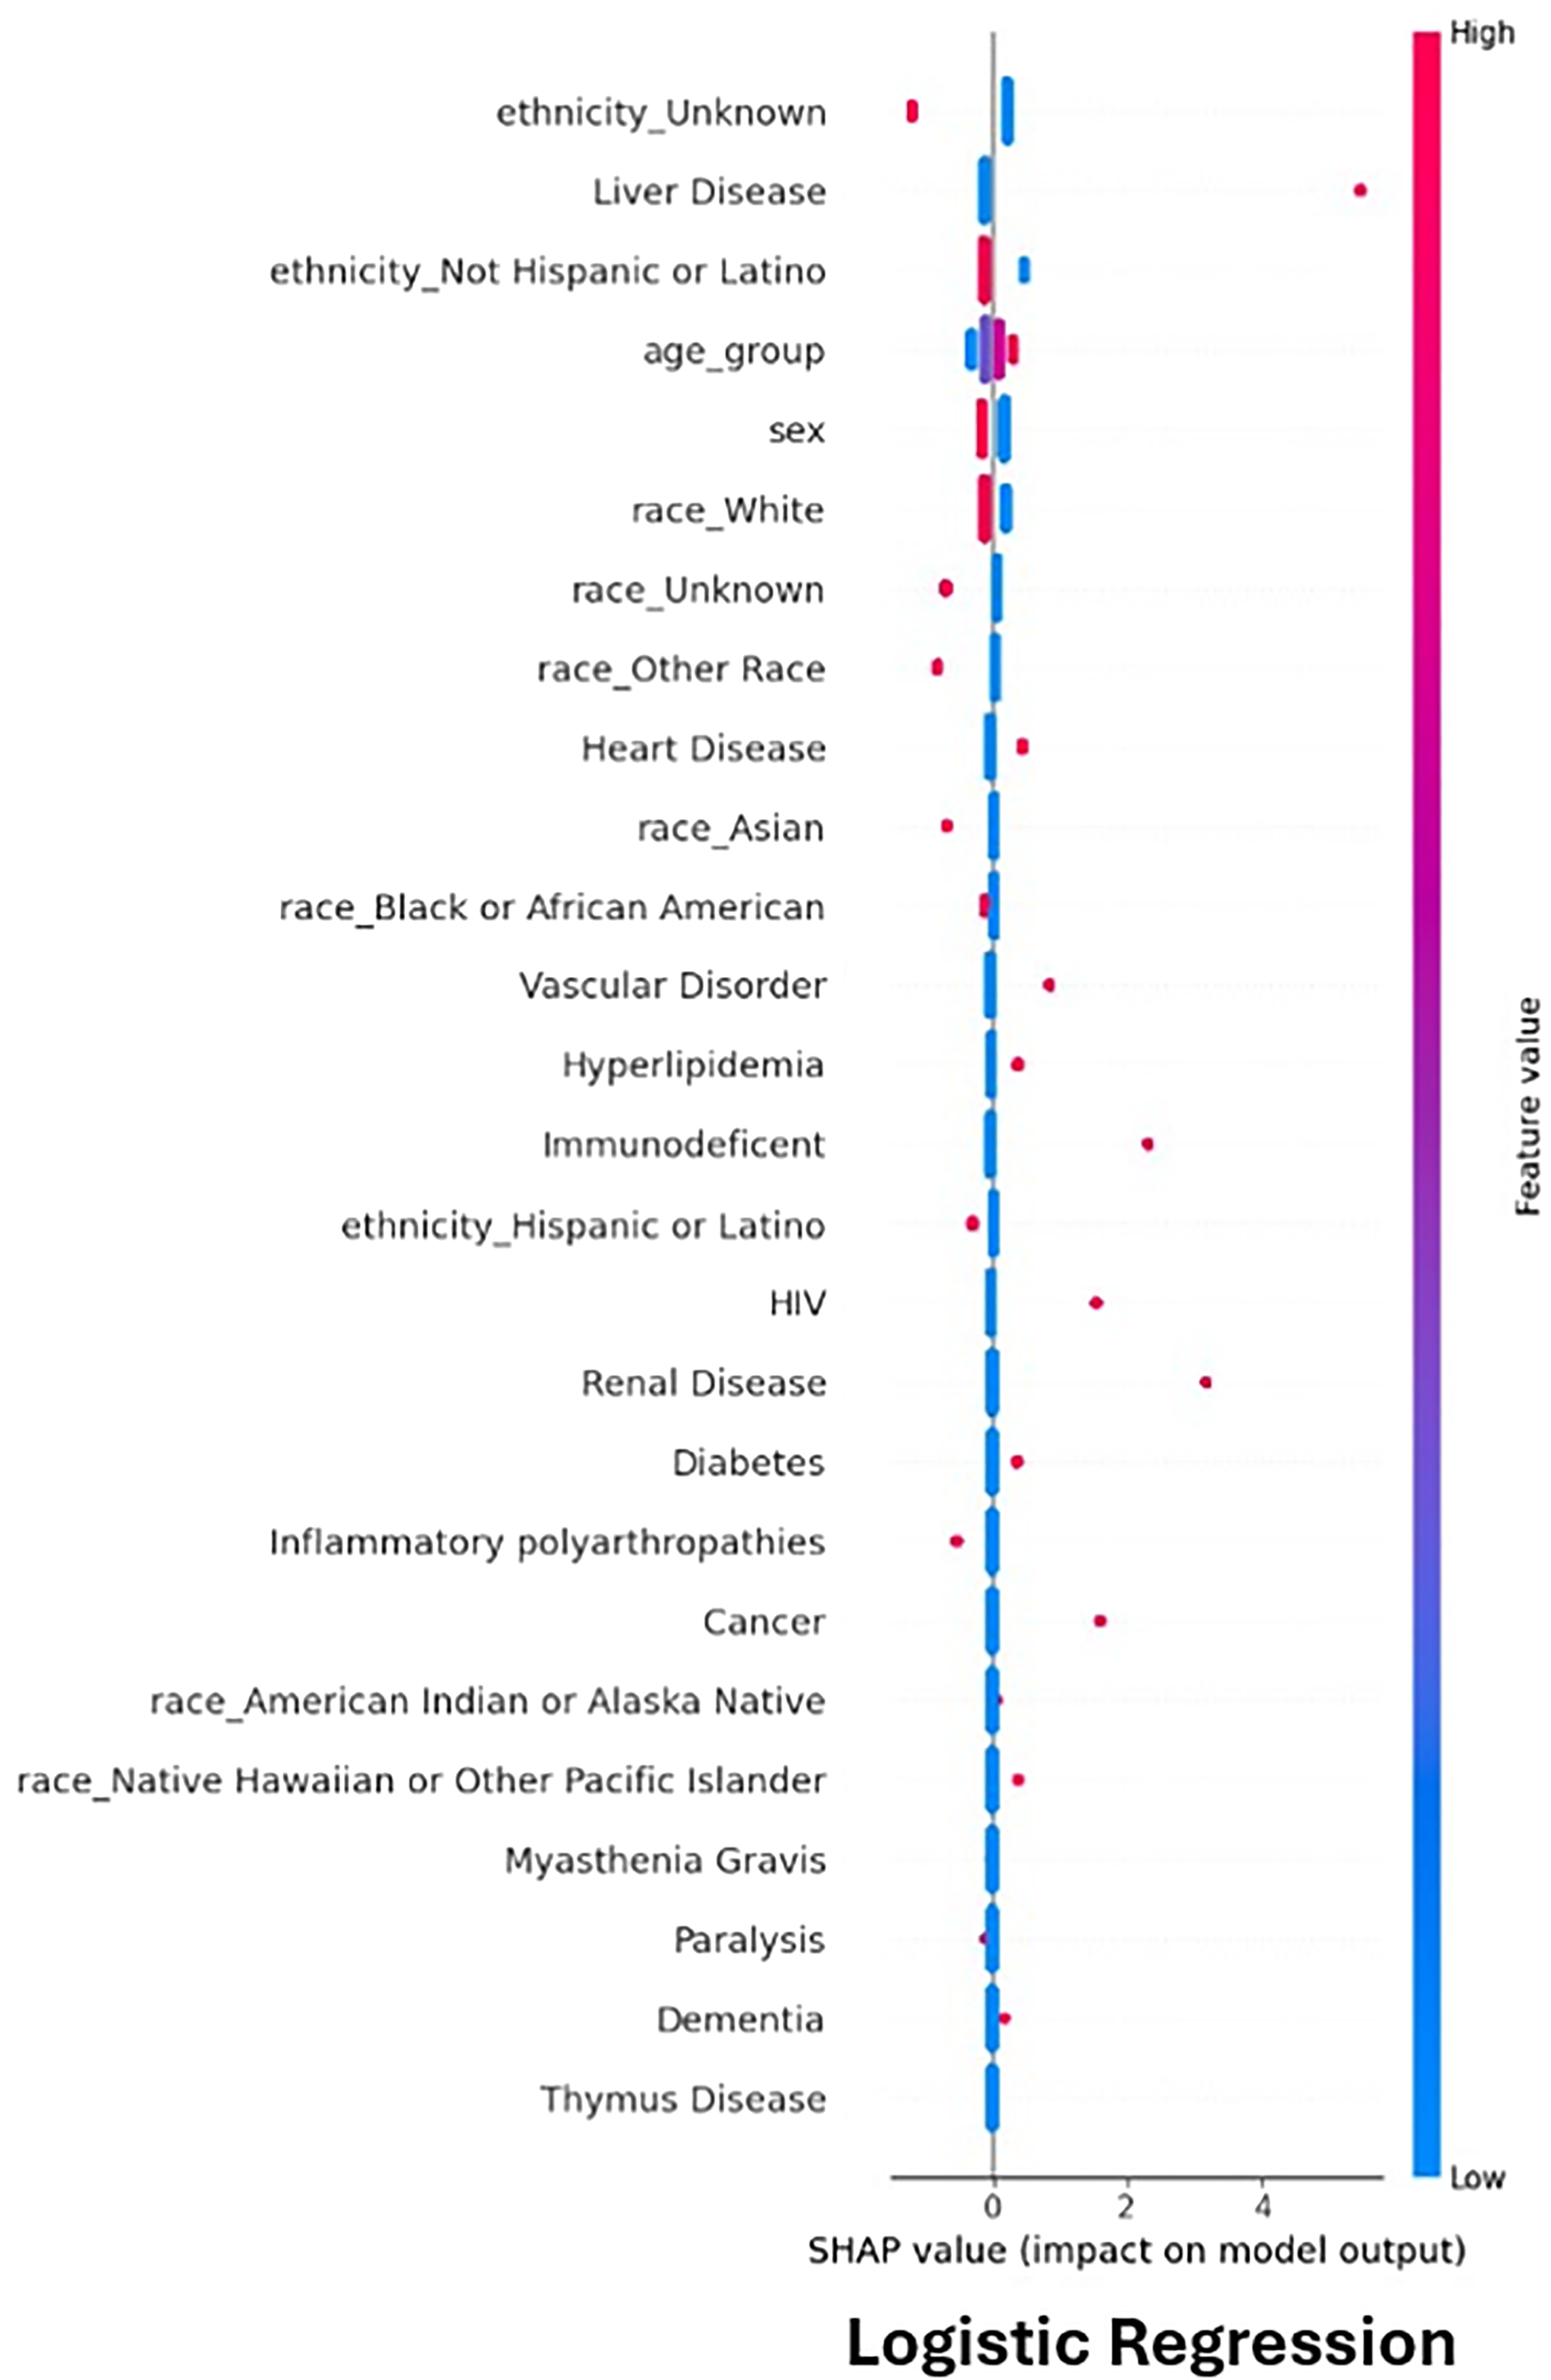
Observing parameter importance can provide insights into the decision-making process of the LR algorithm (Figure 3). The LR algorithms ranked a medical history of liver disease as the most significant parameter for classification, followed by records of renal disease in patients before vaccination. Clinical parameters that showed minimal contribution to patient classification include a history of dementia, paralysis, diabetes, and HIV infection. This observation could result from the limited representation of these patients in our dataset. Regarding demographic parameters, there is no clear indication that differences in sex, race, or ethnicity affect the prediction of a patient experiencing a severe reaction versus a non-severe reaction.
The SHAP results for the parameters used in the LR modeling algorithm. In correlation to the color legend, higher values within the parameter are represented by the color red, and lower values are represented by the color blue; since all parameters (except age_group) were converted to binary values, then all red indicates the presence of the parameter in patients record and blue represents the lack of the presence of the parameter in the patient record. The distance from the black zero line indicates the importance of the parameter to the classification of patient records. Highly influential parameters will dramatically change the score, ranking them with a higher Shapley value.

Similar framework studies use these rankings as a basis for parameter engineering by eliminating or combining study parameters together to reduce the number of input variables, increasing the simplicity of the decision-making algorithms within the tested models. However, we opted not to follow this approach because the performance results of our tested models did not improve with parameter engineering, nor was there a conclusive optimal number of parameters when using feature engineering algorithms within our framework.
Discussion
As the prevalence and application of ML increase in clinical environments, it is crucial for translational scientists to develop robust ML frameworks capable of analyzing the complexities of real-world data, including missing data, population imbalances, and challenges that often accompany data processing. Numerous studies have employed ML models to provide insights into patient prognosis, radiology image analysis, the development of treatment regimens, or subtype cancer diagnosis; however, the use of EHR paired with ML for vaccine research remains in its early stages [25–Reference Magazzino, Mele and Coccia27].
This study presents a new approach to developing a framework of ML algorithms to predict at-risk populations for AEs following immunization. We examined the performance of five ML algorithms using clinical EHR data. Each algorithm’s performance is evaluated based on performance metrics, including precision, recall, F1-score, accuracy, ROC-AUC, and an independent validation dataset. The results demonstrate that these models performed well with clinical data, and each model provides valuable insights into the classification of vaccination reactions. To enhance the interpretability and transparency of the ML algorithms and their functions, we reported the performance of both cohorts separately and together as a unified model. After optimizing each modeling algorithm, the precision scores exceeded expectations, with the lowest model score being 87.2%. The ROC-AUC scores of each model were appropriate for patient classification.
The parameter importance analysis indicated that a history of liver or renal disease significantly contributes to classifying patients in the severe AE cohort. Considering the systemic effects of liver disease on patients may explain their subsequent diagnosis of liver disease again, regardless of vaccination status. Having a history of liver disease was expected to be a defining result due to the majority of the severe cohort (62%) having a record of liver disease in their medical history, in contrast to the less than 1% of the comparative non-severe AE cohort. Currently, there is limited information regarding patients with a history of liver or renal disease who receive YF vaccination or experience increased AEs in these populations. YEL-AVD refers to severe AEs following YF immunization due to the dissemination of the virus within the organs post-vaccination. A possible mechanism proposed by Lemos et al. suggests that YF-infected hepatocytes prominently express ITPR3, a calcium channel, which can enhance hepatocyte proliferation. The YF-infected cells proliferate uncontrollably, triggering oxidative stress and reperfusion in the liver, ultimately leading to cellular necrosis [Reference de, França and Lima Filho28,Reference Dos Santos, França and Lima Filho29]. Future studies are necessary to determine whether susceptibility to liver disease significantly affects the efficacy of the YF vaccine in patients with a history of liver disease.
Current vaccine safety research depends on AEs that occur during vaccination clinical trials, along with individuals reporting their symptoms to their physicians or Vaccine Adverse Event Reporting System communication centers. Real-world data enables the retrospective examination of patient records to explore potential risk factors that may remain unreported. Larger databases allow for increased cohort sizes and support long-term data analysis.
However, our study has certain limitations based on our population records. Our focus on the YF vaccine has created a specialized group; the YF vaccine is neither mandatory nor routinely administered in the USA. Our population consists of individuals seeking vaccination at travel clinics. This results in a population imbalance between the two cohorts with severe and non-severe reactions, as a significant portion of our population is made up of healthy adults. Additionally, all records were collected from the TriNetX database, limiting the hospital locations from which our information was obtained to those with data-sharing agreements with TriNetX. Finally, the records used comprise real-world data collected for a primary purpose, which may have restricted their suitability for secondary research. This suggests that the records could be lacking information that a YF vaccine-focused clinical trial would typically gather from patients. Despite the challenges inherent in using real-world data, we have implemented multiple forms of validation and performance assessments to address potential population biases and improve the transparency and interpretability of our resulting framework. For future research, we will continue to validate and expand the applicability of this vaccine framework to analyze data for various types of vaccinations.
Conclusion
In conclusion, this study examined five different modeling algorithms to establish a framework for analyzing real-world data and predicting patient responses to vaccination. We incorporated an LR algorithm to assess our clinical data to achieve a high-precision performance model for classifying patient predictions. We validated these methods and algorithms using an independent dataset and comprehensive evaluation metrics to create a clear framework for predicting whether a patient’s medical history and demographic information will result in a severe reaction to the YF vaccine. Although our findings highlight a strong precision classification, this may lead to lower recall and increased risk of false negatives. In future work, model thresholds and performance metrics could be tailored to clinical context to ensure a balanced trade-off between minimizing false positives and capturing all relevant cases.
Supplementary material
The supplementary material for this article can be found at https://doi.org/10.1017/cts.2026.10754.
Author contributions
Madison Farnsworth: Conceptualization, Data curation, Formal analysis, Investigation, Methodology, Validation, Visualization, Writing – original draft, Writing – review & editing; Kostiantyn Botnar: Conceptualization, Data curation, Formal analysis, Methodology, Resources, Software, Validation, Writing – review & editing; Justin T. Nguyen: Methodology, Validation, Writing – review & editing; Riley K. Watson: Conceptualization, Validation, Writing – review & editing; Trevor L. Murphy: Conceptualization, Validation, Writing – review & editing; Susan L.F. McLellan: Formal analysis, Supervision, Validation, Writing – review & editing; Kamil Khanipov: Conceptualization, Formal analysis, Investigation, Methodology, Supervision, Validation, Writing – review & editing; George Golovko: Conceptualization, Data curation, Formal analysis, Funding acquisition, Methodology, Project administration, Resources, Supervision, Validation, Writing – review & editing.
Funding statement
The authors acknowledge funding and support from the West African Center for Emerging Infectious Diseases (U01 AI15180), part of the Centers for Research in Emerging Infectious Diseases (CREID) Program of the NIH. The authors acknowledge the Sealy Center for Structural Biology and Molecular Biophysics at the University of Texas Medical Branch at Galveston for providing research resources. A predoctoral fellowship from the Sealy Institute for Vaccine Sciences supported MGF. This study was conducted with the support of the Institute for Translational Sciences at the University of Texas Medical Branch, which is partially funded by a Clinical and Translational Science Award (UL1TR001439) from the National Center for Advancing Translational Sciences at the National Institutes of Health.
Competing interests
The authors declare that there are no conflicts of interest regarding the publication of this paper. The research was conducted independently, and no external parties influenced the study design, data collection, analysis, or interpretation of the results. All authors have approved the final manuscript and agree with its submission.



 Open access

