


Introduction
Mountain glaciers throughout the world are vital hydrologic resources and sensitive indicators of climate change. In the Pacific Northwest, glaciers provide stability to aquatic ecosystems, hydroelectric industries and municipal and agricultural water supplies by providing runoff during the annual summer drought. Several rare, threatened or endangered species of fish, including bull trout (Salvelinus confluentus) and summer-run Chinook salmon (Oncorhynchus tshawytscha) (Reference Mantua, Tohver and HamletMantua and others, 2010), depend on the cold water released by glaciers during the summer. Alpine glaciers host unique ecosystems and are the sole habitat for species such as the ice worm (Mesenchytraeus solifugus) (Reference HodsonHodson and others, 2008). Predation of ice worms by rosy finches (Leucostitche arctoa) and other alpine species links the glacier ecosystem to adjacent alpine food webs.
These ecosystems, industries and water resources are all directly affected by the sensitive response of glaciers to climate change. Increasing air temperature increases the rate of glacial melt and lengthens the melt season. In winter, increasing temperatures can change the phase of the precipitation from snow to rain, resulting in less snow accumulation, particularly in the warm snowpacks common in this region (Reference Nolin and DalyNolin and Daly, 2006). Glaciers in these mountains are also relatively small and thin with high balance gradients, allowing them to rapidly adjust their size to a changing climate. Combined, these factors lead to rapid adjustment in the extent of small alpine glaciers, making them unstable components of alpine hydrologic systems at multi-decadal timescales.
The climate of this region has changed significantly in the past 50 years. Reference Rasmussen and ConwayRasmussen and Conway (2001) reported that mean summer temperature in western Washington State, USA, increased by 1°C from 1948 to 1996, while average January–March temperature at Blue Glacier has increased by 3°C (Reference Rasmussen and ConwayRasmussen and Conway, 2001). The last inventory of glaciers in the Olympic Mountains, Washington, in 1980 identified 266 glaciers (Reference SpicerSpicer, 1986; Fig. 1). Quantifying changes in the area and volume of these glaciers in the past 30 years is an important step towards understanding the impacts of a warming climate on the hydrology, regional aquatic ecosystems and water supplies on the Olympic Peninsula. In this paper, we present a new geospatial database of the area and hypsometry of all glaciers larger than 0.01 km2. These data are used to assess changes in glacier size, distribution and volume since 1980, and are combined with a positive degree-day model to estimate modern summer runoff produced by glaciers for three large watersheds.
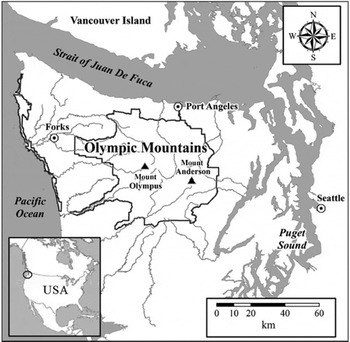
Location of the Olympic Peninsula and Washington State and boundary of Olympic National Park.
Study Area
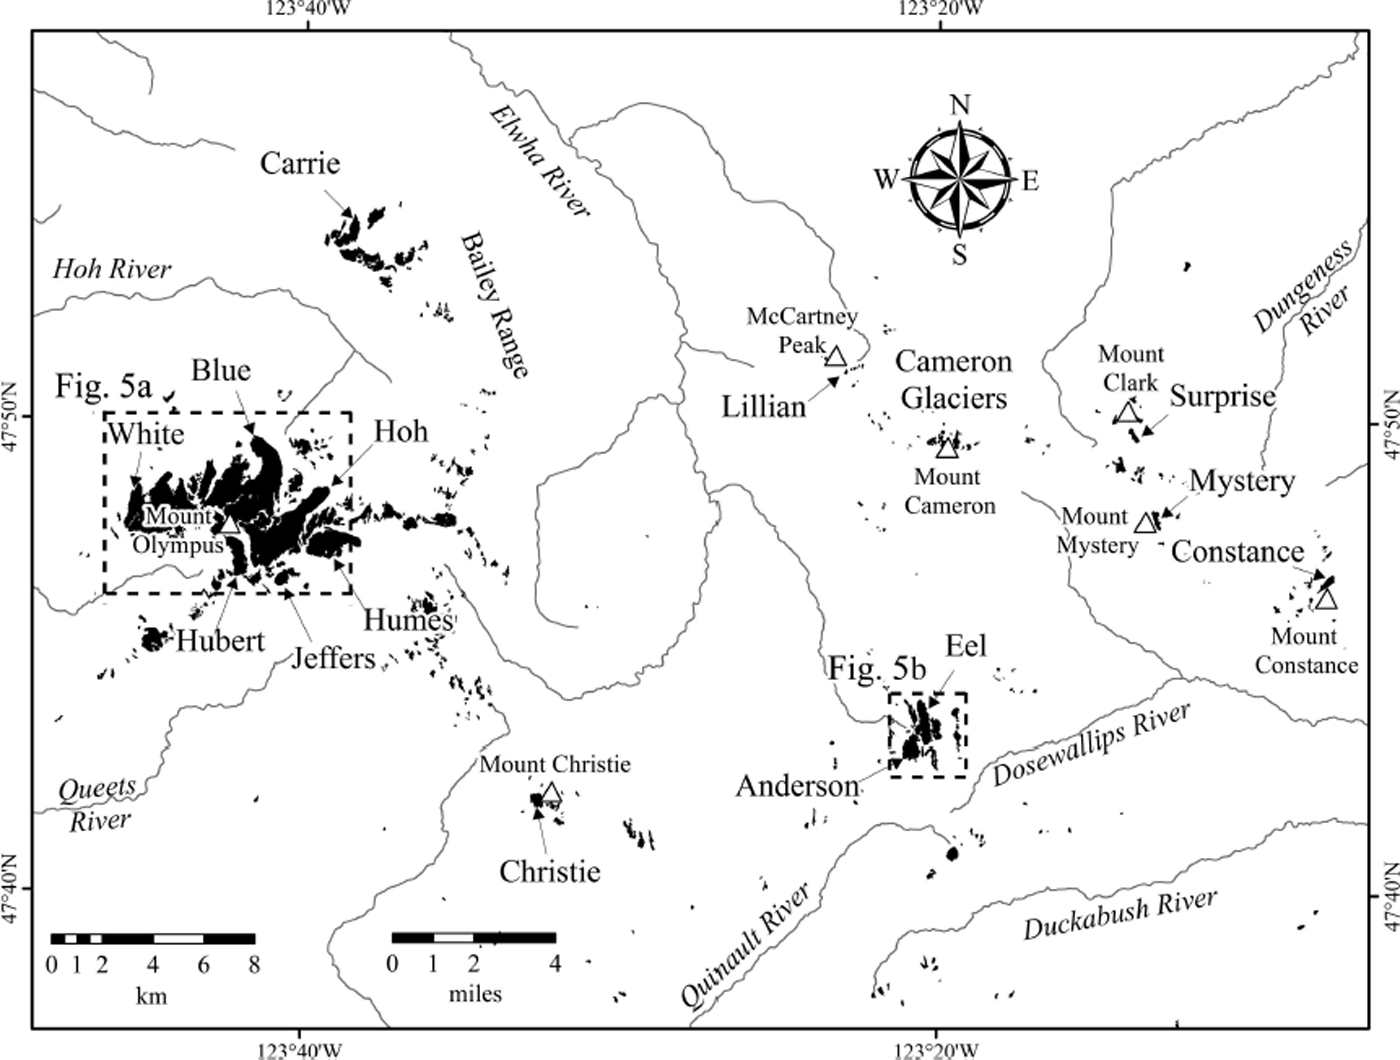
The Olympic Peninsula is located on the western edge of North America; it is incised by the Pacific Ocean to the west and Puget Sound to the east (Fig. 1). The center of the peninsula is marked by rugged mountains isolated by deep valleys. The bedrock geology of the Olympic Mountains is composed largely of uplifted basalt and sedimentary rocks that accumulated on the floor of the Pacific Ocean from about 18 to 57 Ma ago (Reference Tabor and CadyTabor and Cady, 1978). The climate of the peninsula varies dramatically with aspect, elevation and distance from the Pacific Ocean. The western slopes of the highest Olympic peaks are estimated to receive as much as 6.6 m a−1 precipitation (PRISM Group, 2006). Eastern peaks, by contrast, receive <2 m a−1. Most precipitation falls between November and April, and glaciers receive ≥10 m of snowfall each winter (Reference Davey, Redmond and SimeralDavey and others, 2006). Mean annual temperature and temperature range also vary from west to east, with higher elevations on east side peaks typically 1.5–2.0°C warmer than west side locations (Reference Davey, Redmond and SimeralDavey and others, 2006). The climate has pronounced interannual and decadal variations in temperature and precipitation associated with the Southern Oscillation (El Niño/La Niña) and the Pacific Decadal Oscillation (Reference Mantua, Hare, Zhang, Wallace and FrancisMantua and others, 1997). Erosion by glaciers, streams, hillslope processes and active tectonic uplift has created 2400 m of local relief, from the summit of Mount Olympus (2429 m) to sea level. Repeated ice ages and development of long alpine valley glaciers carved deep U-shaped troughs that radiate from the center of the peninsula (Reference Tabor and CadyTabor and Cady, 1978). Glaciers are currently distributed across the mountains, with the largest on Mount Olympus on the wetter windward side of the range (Fig. 2).
Modern glacier distribution in the central Olympic Peninsula.
Methods
The glacier geospatial database was developed using 1 m pixel size orthorectified vertical air photographs taken in 2009 by the US National Agriculture Imagery Program (NAIP). Each glacier was digitized directly from the photographs at a scale of 1 :2000, with vertices spaced every 5 m. All perennial accumulations of ice >0.01 km2 in area were included in the inventory.
Up to three polygons were digitized for each glacier. The first area mapped represents the minimum extent of what is clearly glacier ice, as determined by the presence of crevasses, surface ponds or blue glacial ice. This outline includes only that part of the glacier that is free of debris, but may include minor areas of debris cover if the debris is discontinuous or thin. The second polygon mapped had significant debris cover, seasonal snow, or shadows over glacial ice, as confirmed by the presence of crevasses, glacial ice exposed on crevasse walls or steep glacier margins, and ice-marginal channels. The third area delineated included a few sites where we could not positively determine from the NAIP imagery if there was ice beneath thick, hummocky debris near a glacier’s terminus.
The use of up to three polygons per glacier has two purposes. Firstly, quantifying debris-covered area on the glacier allows for observations of how debris cover may be influencing the rate of change of glaciers. Secondly, having a maximum outline for areas of possible ice allows for a quantification of overall glacier area uncertainty, providing a level of significance and statistical credibility to the geospatial data.
Glacier change during the past several decades was quantified by comparing our new inventory with those of Reference MatthesMatthes (1946), Reference MeierMeier (1961) and Reference SpicerSpicer (1986). The Spicer data were obtained from aerial photographs taken between 1976 and 1982, and this inventory is particularly useful because it was based on higher-resolution images than those available to Meier or Matthes.
High-precision elevation transects were measured in autumn 2010 along longitudinal profiles on four glaciers using GPS. GPS positions were collected at 1 s intervals and were processed using the kinematic Precise Point Positioning (PPP) service from the Canadian Natural Resources Department (Reference Heroux and KoubaHeroux and Kouba, 2001). PPP processing uses corrected satellite orbits and does not require a fixed reference station. The measurement uncertainty was ±1 m determined by reference measurements taken over solid ground near the glacier margins. The glaciers chosen represent a west-to-east precipitation gradient, and despite the limited number the sample represents about two-thirds of the glacier area. Glacier thickness changes were made by comparing elevation profiles with elevations from the 1987 US Geological Survey digital elevation models (DEMs) based on photography from the same year. To calculate volume loss, the thinning amount within each 20m elevation bin was averaged and then multiplied by the area of the glacier in that bin. The upper parts of the glaciers well above the equilibrium-line altitude were not profiled, but we observed little thinning in these areas. For Blue Glacier, the icefall and steep terminus could not be profiled. For the icefall, we fit a quadratic equation to the thinning/elevation relationship, but the choice is not critical because of the small glacier areas. We extrapolated the rate of thinning to estimate loss for the lowest elevation band at the terminus, and assumed that it had a wedge shape.
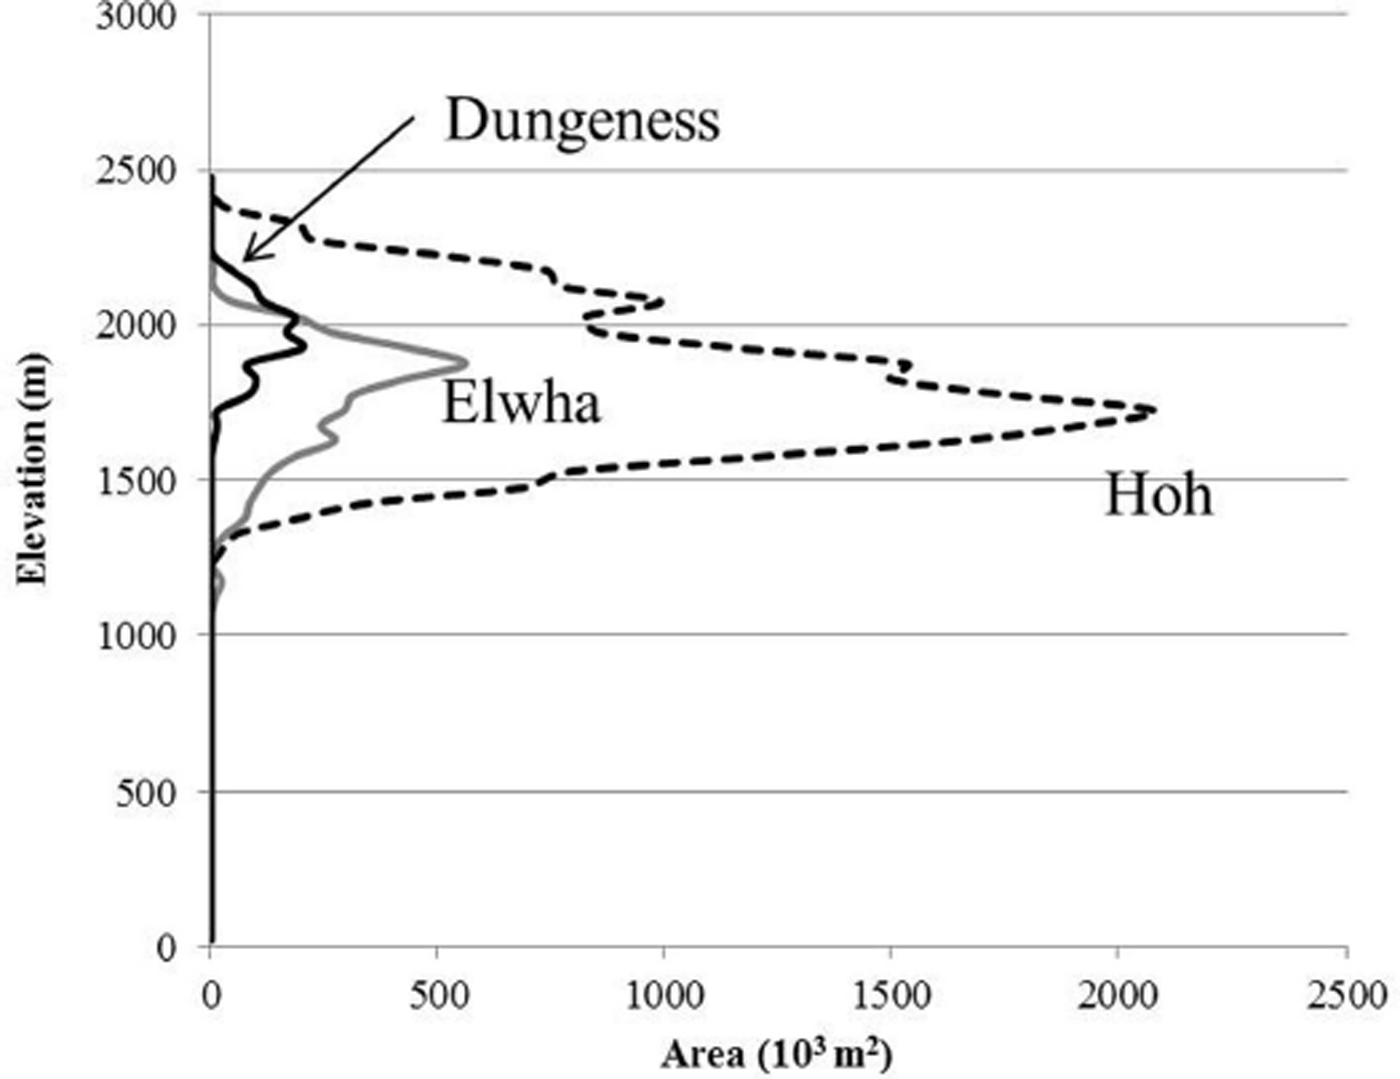
Annual glacial meltwater discharge in the Hoh (5.1% glaciated), Elwha (0.5%) and Dungeness (0.3%) basins was estimated using a model based on glacier hypsometry and summer melt (Figs 2 and 3; Reference Riedel, Burrows and WengerRiedel and others, 2008). Summer (1 May–30 September) melt was estimated with a positive degree-day (PDD) model (Reference Rasmussen and WengerRasmussen and Wenger, 2009). Glacier hypsometry across a watershed was calculated in 50m elevation bands using a 1987 10m DEM as a base map and glacier area from our inventory.
Modern area–altitude distribution of glaciers in three large watersheds.
The PDD model is based on air temperature at the elevations of glaciers, and was calibrated with summer balance measurements taken from 1963 to 1994 at altitudes of 1500 and 2050 m a.s.l. on Blue Glacier (Reference Conway, Rasmussen and MarshallConway and others, 1999). Upper-air temperatures were acquired from the US National Centers for Environmental Prediction/US National Center for Atmospheric Research (NCEP/NCAR) reanalysis database for the nearest gridpoint (47.5°N, 125°W), ∼150 km west-southwest of Blue Glacier. Upper-air temperatures were used because they more accurately represent air temperatures at the glacier surface than do nearby terrestrial-based temperature measurements (Reference Rasmussen and WengerRasmussen and Wenger, 2009).
Following methods outlined by Reference De Woul and HockDe Woul and Hock (2005) and Reference Rasmussen and WengerRasmussen and Wenger (2009), summer melt at a given altitude bs · (z) is:

where Σ T + represents summation of average daily air temperature accounting only values >0°C for a selected period. The coefficients α and β are determined by linear regression, minimizing model error. Air temperature at 1500 and 2050m is determined by linear interpolation of 1200 UTC air temperatures at 850 and 700 mbar levels (approximate altitudes of 1450 and 3000 m, respectively). Melt above, between and below these elevations was based on a linear regression.
The model did not partition ice, firn and snow contributions to total glacier melt and used a single melt coefficient. We did not attempt to separately quantify these phases for two reasons. First, the melt season starts weeks earlier at the terminus of these glaciers than in their accumulation zones. Thus even late in the melt season glacial runoff includes snow (and firn), making it difficult to pick a date when there is mostly ice melt, particularly when the mass balance was positive the previous year and a lot of firn is exposed to surface melting. Second, the glacier microclimate delays snowmelt on the glacier interannually as well as seasonally compared with the surrounding landscape. These considerations make glacial snow and firn melt important factors when considering the hydrologic importance of glaciers.
Results and Discussion
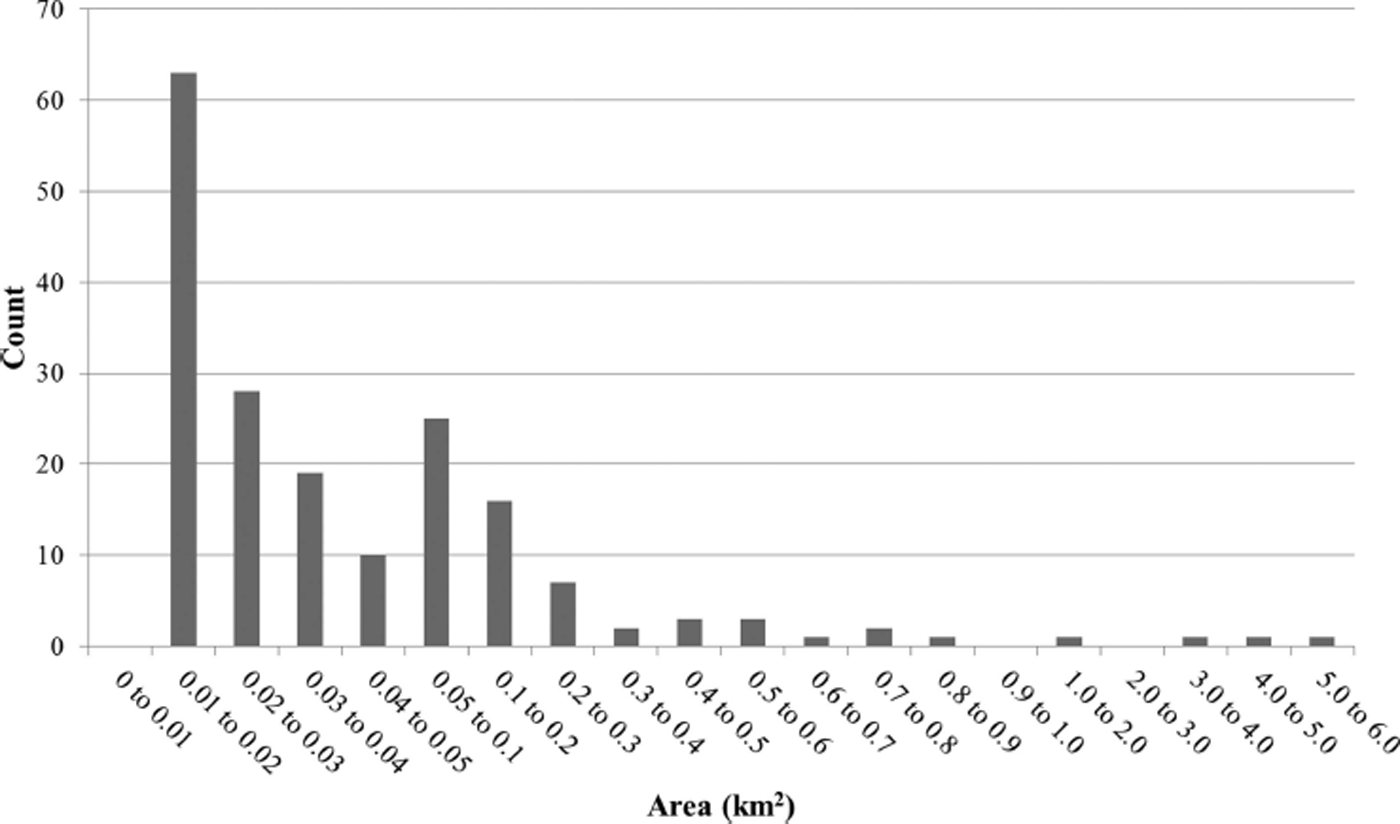
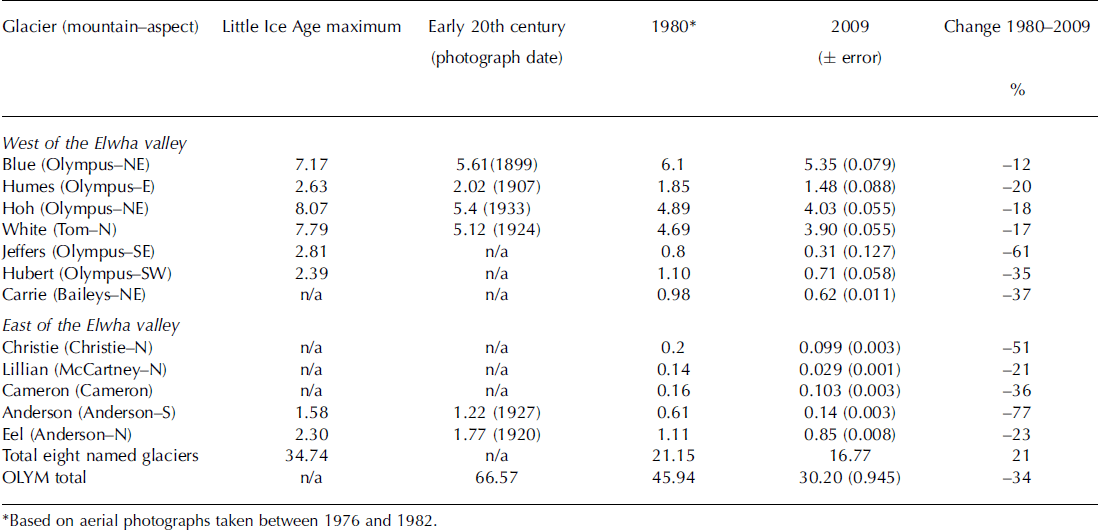
There are currently 184 glaciers larger than 0.01 km2 on the Olympic Peninsula, but 120 are <0.1 km2 and only four are >1 km2 (Fig. 4). The higher-resolution NAIP photographs and field checks allowed us to identify another 117 small snow–firn–ice patches smaller than 0.01 km2 covering ∼0.5 km2. Some of these were >0.01 km2 in 1980 and now fall into this smaller size category. Previous estimates also missed some glaciers greater than 0.01 km2 because of the lower resolution of the photographs available at the time (Table 1; Reference MeierMeier, 1961; Reference SpicerSpicer, 1986). Changes in the number of glaciers also reflect substantial glacier thinning, which can cause one large glacier to divide into two (or more) smaller glaciers. For example, continued climate warming will eventually lead Blue Glacier to divide.
Histogram of the number of glaciers by size category; note size of categories changes. Perennial snow and ice features <0.01 km2 not shown.
Area (km2) of select glaciers at various times in the past century. Data for 1980 and early 20th century from Reference SpicerSpicer (1986). See Figure 2 for locations
We identified ∼0.83 km2 of debris-covered ice, half of which is on Blue and Black Glaciers on Mount Olympus. Reference SpicerSpicer (1986) identified 12 ‘rock glaciers’ in a previous inventory, but we did not track changes in them individually. The presence of debris-covered ice is expected to increase as the climate warms, glaciers thin and, in some cases, glacier flow velocities decline. Debris cover of more than a few centimeters can dramatically slow melting, and in the future many of the Peninsula’s glaciers may become rock glaciers. Reference HeusserHeusser (1957) noted that debris cover on lower White and Hoh Glaciers slowed recession in the early 20th century. Ferry Glacier was one of the 50 largest glaciers in the Olympics Mountains in 1980, with an area of 0.17 km2, but by 2009 what remained of the glacier was covered by a rockfall, making it difficult to determine how much, if any, ice remains.
All the glaciers counted in a previous inventory have decreased in size in the past 30 years, and our count represents a decrease of 82 glaciers from the 266 noted in ∼1980 (Fig. 2; Reference SpicerSpicer, 1986). Total glacier cover now stands at 30.20 ± 0.95 km2, not including features smaller than 0.01 km2. Uncertainty associated with the 1 m resolution of the NAIP imagery is compounded by shadows and debris cover, and varies substantially between glaciers; larger glaciers have ten times the uncertainty of smaller glaciers (Table 1). Total uncertainty represents only ∼6% of the total estimated change in glacier area, not enough to affect the conclusion that glaciers are in rapid decline.
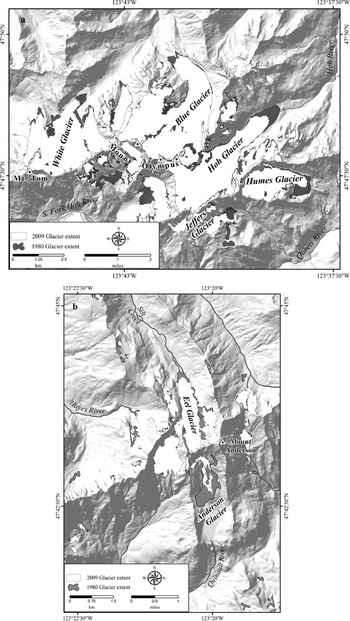
Combined glacier area decreased by 15.7 km2 from 1980 (45.9 km2) to 2009 (30.2 km2), a loss of 34% (Table 1; Reference SpicerSpicer, 1986). Mean glacier area decreased from 0.17 km2 in 1980 to 0.11 km2 in 2009. In 1980, eight of 266 glaciers were >1 km2 (Reference SpicerSpicer, 1986); there are now only four that exceed that size (Blue, Hoh, White and Humes glaciers). All of these glaciers are on Mount Olympus, the highest mountain on the Peninsula, located on the windward (wet) west side of the Olympic Mountains (Figs 2 and 5). Other clusters of glaciers in the 0.05–0.2 km2 size range occur in the Bailey Range and on Mount Christie and Mount Anderson (Fig. 2). These summits are all either on the wetter windward side of the range (Baileys) or benefit from storms that penetrate deep into the mountains along the Quinnault River.
Change in glacier extent on Mount Olympus (a) and Mount Anderson (b) from AD ∼1980 to present.
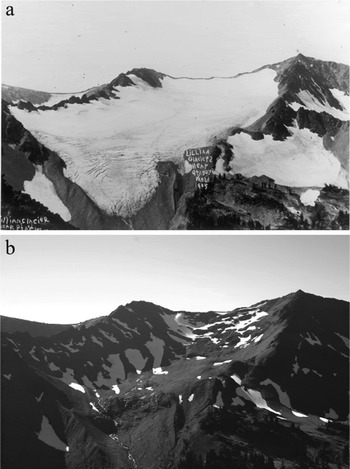
Aspect and distance inland from the Pacific moisture source have had a strong influence on glacier response to the warming climate. Glaciers in the eastern part of the Peninsula and those that face south lost more area than those facing north and on the wetter windward slope (Table 1). Glacier losses were most pronounced in the drier northeastern part of the Peninsula where, for example, little remains of Lillian Glacier on McCartney Peak (Fig. 6). For the most part, glaciers east of the Elwha River now exist almost exclusively on shaded northern aspects where melting is slower and they may benefit from secondary sources of accumulation (e.g. wind redeposition and snow avalanche).
Changes in Lillian Glacier on McCartney Peak from 1905 (a; NPS photograph) to the present (b; photograph by J. McLean).
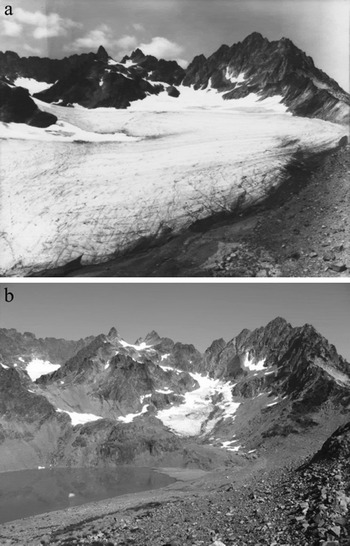
The influence of aspect is well illustrated on Mount Anderson. Since 1980, Anderson Glacier has lost 77% of its area compared with a 23% loss for adjacent north-facing Eel Glacier (Table 1; Figs 5 and 7). Aspect is also a critical factor to glacier status on Mount Olympus, where southeast-facing Jeffers Glacier shrank by 61% in 30 years, while north-facing Hoh and White Glaciers declined by 17–18% (Fig. 5). North-facing glaciers east of the Elwha lost 21–51% of their area in 30 years, whereas the north-facing glaciers on Mount Olympus lost 12–20% over the same period. Glaciers in the Bailey Range with north aspects had area losses comparable with glaciers on the south side of Olympus and with north-facing glaciers east of the Elwha (e.g. Carrie Glacier; Table 1).
Changes in Anderson Glacier from 1936 (a; photograph by A. Curtis) to the present (b; photograph by R. Hoffman).
The rate of ice loss for six glaciers from AD ∼ 1900 to 1980 was 0.26 km2 a−1, although this included a period of positive balance at Blue Glacier from 1959 to 1975 (Reference HubleyHubley, 1956; Reference SpicerSpicer, 1986; Reference Rasmussen and ConwayRasmussen and Conway, 2001). Since 1980, the rate of decline in combined ice extent across the Olympic Mountains doubled to 0.54 km2 a−1. Accelerating decline of glacier area is also reflected in strongly negative cumulative balance on Blue Glacier since the mid-1980s (Reference Rasmussen and ConwayRasmussen and Conway, 2001).
Decline in glacier area in recent decades on the Olympic Peninsula exceeds losses east of the Fraser–Puget lowlands. In the southern Coast Mountains of British Columbia, glacier area declined 10% from 1985 to 2005 (Reference Bolch, Menounos and WheateBolch and others, 2010), while Reference Granshaw and FountainGranshaw and Fountain (2006) estimated loss of glaciers in the North Cascades National Park over a 40 year period ending in 1998 at ∼7%. The more rapid loss of glaciers in the Olympics is more comparable with the observed loss of 20% over a similar period on Vancouver Island (Reference Bolch, Menounos and WheateBolch and others, 2010). Rapid loss of glaciers in coastal ranges is likely due to their sensitivity to changes in temperature that strongly influence spring ablation and early-fall accumulation (Reference LaChapelleLaChapelle, 1965). Accumulating evidence indicates that the recent loss of glacier area and volume through multiple decades for all glaciers in the Pacific Northwest has not occurred since at least AD 1694 (Reference Malcomb and WilesMalcomb and Wiles, 2013).
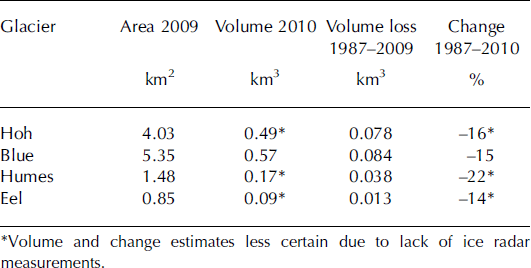
Glacier area measurements were combined with surface elevation profiles to assess thickness changes from 1987 to 2010 for four of the largest glaciers in the Olympic Mountains (Table 2). Only Blue Glacier has ice thickness data and a known glacier volume (Reference Allen, Kamb, Meier and SharpAllen and others, 1960); the other glacier volumes were estimated assuming an average ice thickness and by the ratio of the glacier’s area to Blue Glacier’s area. Blue Glacier on Mount Olympus had the largest volume loss since 1987 because it has the largest area. The largest percent change, however, was for south-facing Humes Glacier at −22%, while north-facing Blue and Hoh Glaciers lost 15% and 16%, respectively (Table 2). In addition to its aspect, Humes Glacier had the most significant volume reduction because it is at a lower elevation than its neighbors Hoh, Blue and White glaciers. Further to the east, north-facing Eel Glacier has lost ∼14% of its volume (0.013 km3) since 1987.
Volume change estimates for four glaciers 1987–2010. Volume changes are not adjusted to water equivalence
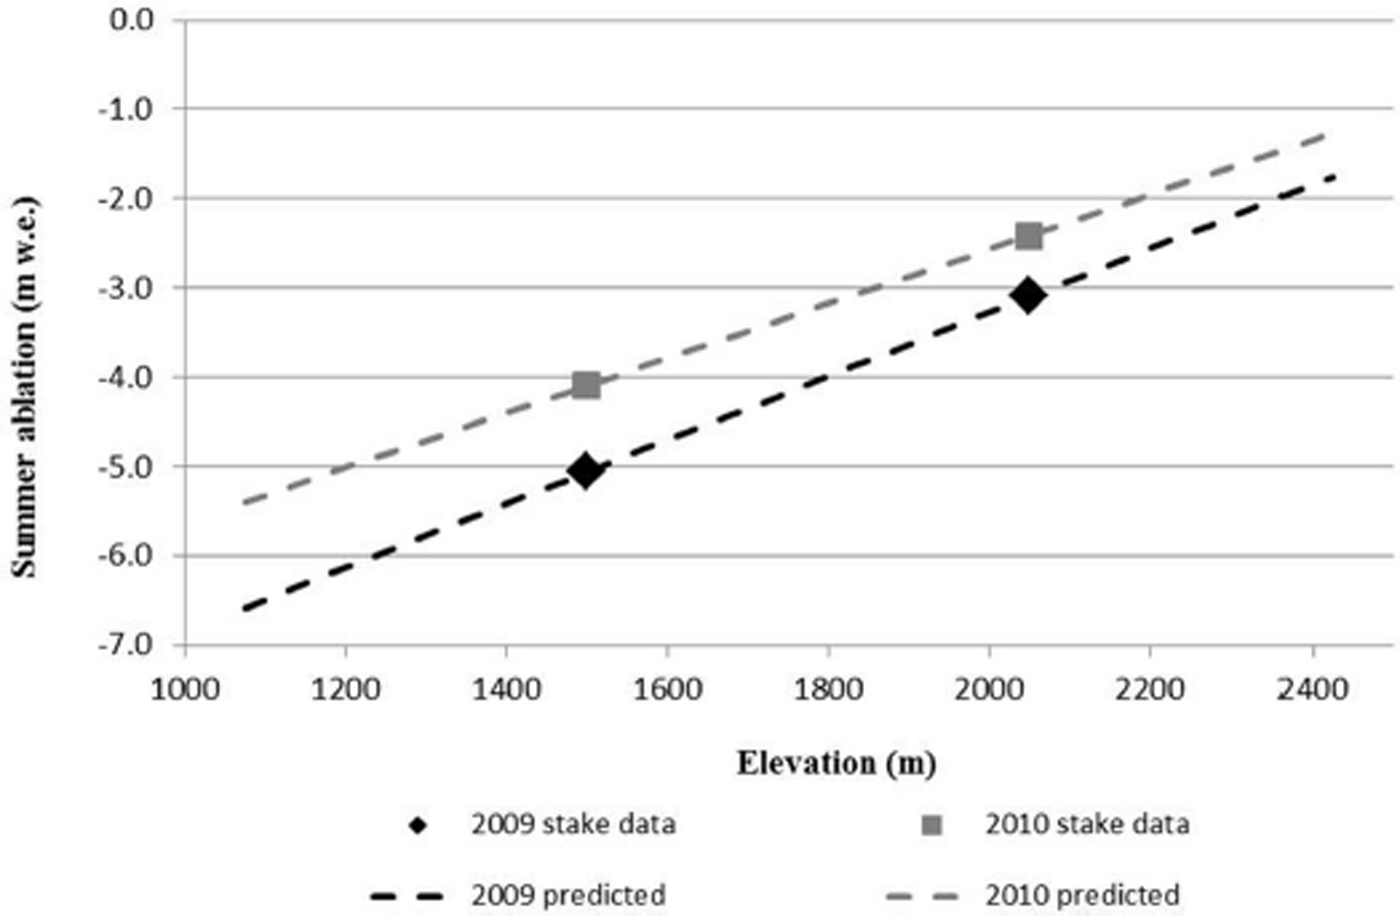
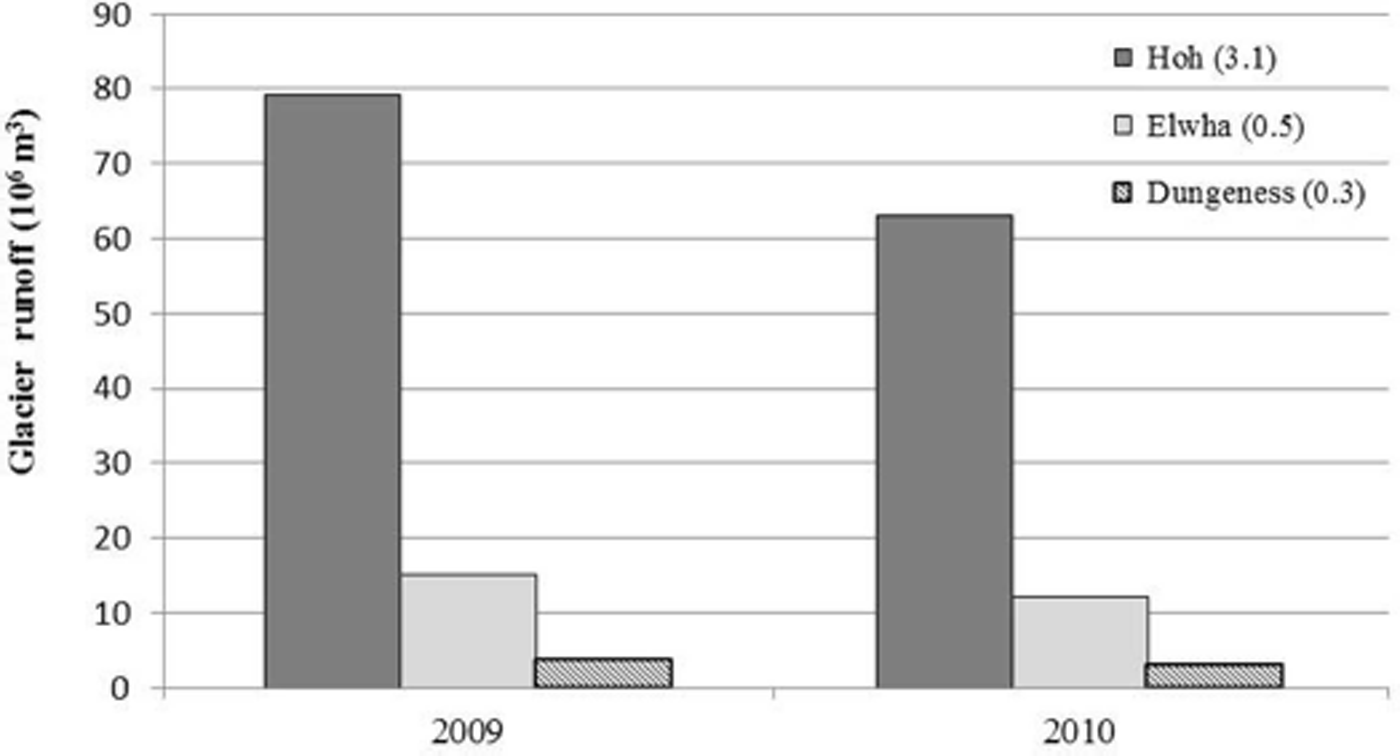
Even with a 34% decline in area and 20% decline in volume in the last 30 years, glaciers continue to provide significant amounts of water to streams on the Olympic Peninsula. We used the hypsometry of glaciers and summer-melt versus elevation curves from the PDD model to estimate glacial contribution to summer streamflow for three large basins that represent a range in climate and glacial cover (Table 3; Figs 8 and 9). As shown in Figure 8, the model accurately reproduced the amount of summer melt as measured by melt stakes at two locations. The model and melt data also show that summer melt at 1500 m varies by ∼20–25% (±1 m) between extreme years, with less variability at higher elevations. Model error at 1500m is 0.50 m w.e. a−1 (r 2 = 0.68) based on the residual mean sum of errors; at 2050 m it is 0.28 m w.e. a−1 (r 2 = 0.76). These values represent an error of ∼10% in the total summer melt estimate.
Degree-day model of Blue Glacier summer balance (dashed line) used to estimate range in glacier runoff. Measured values (square and diamond) from Reference Conway, Rasmussen and MarshallConway and others (1999).
Modern range in summer (1 May–30 September) glacial runoff for three Olympic Peninsula watersheds determined by a PDD model for negative (2009) and positive (2010) net mass-balance years. Runoff includes snow, firn and ice from glaciers in each basin. Percentage of basin above gage site covered by glaciers shown in parentheses.
Range of modern glacial ice, snow and firn contribution to summer (1 May–30 September) streamflow for three rivers
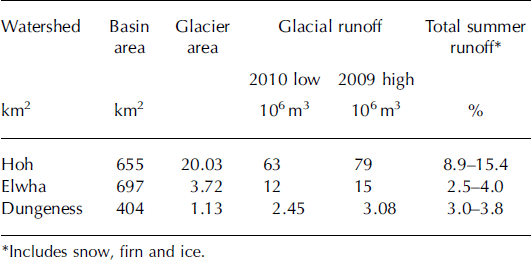
About 66% of the glacier-covered landscape in the Olympic Mountains is found in the Hoh River watershed (20 km2); more than half of the remaining glacial cover is in the Queets and Elwha watersheds (Fig. 2). Based on the PDD model and basin-wide glacier hypsometry, glaciers currently provide 63–79 ± 7 × 10⁶ m3 of water to the Hoh River annually from 1 May to 30 September. In the Elwha watershed, glaciers provide 12–15 ± 1.3 × 10⁶ m3 of summer runoff, while in the Dungeness basin they provide 2.5–3.1 ± 0.28 × 10⁶ m3. The other large watersheds on the Olympic Peninsula have <5% glacial contribution to summer streamflow. Given a 20% loss in glacier volume, glacial runoff on the Peninsula has decreased a similar amount in the past 30 years.
Our PDD model estimates of glacial runoff combine snow, firn and ice contributions, but we recognize that they are likely dominated by snowmelt. Reference LaChapelleLaChapelle (1965) suggested snowmelt was 1.6 and 4.2 times firn and ice melt on Blue Glacier in 1958 and 1962, respectively, and that ice melt occurred primarily in September and October. Given reduced winter accumulation in the last 50 years and a longer melt season (Reference Rasmussen and ConwayRasmussen and Conway, 2001), the snow to firn/ice melt ratios are now probably smaller.
The volume loss calculations allowed us to assess the glacier ice (not snow or firn) contribution to summer streamflow in the Hoh basin (Tables 2 and 3). Volume of ice loss for Hoh and Blue Glaciers averaged ∼6.3 × 10⁶ m3 w.e. a−1 from 1987 to 2010; assuming a similar contribution from the other 10.65 km2 of glaciers in the Hoh valley, the 23 year average annual glacial ice ablation is ∼11.7 × 10⁶ m3 w.e. Using the PDD model estimate of an average annual total glacier summer contribution of 71 × 106 m3 w.e. for the Hoh River, the ice fraction contributed ∼16% of total glacier runoff for May–September, mostly late in the melt season.
Estimates of glacier volume loss and results from the glacial runoff model highlight the importance of glaciers to late-summer streamflow at the Hoh River gaging station near Forks (Fig. 1). Comparing the streamflow data with the PDD model results, glacial snow, firn and ice contribute 35.9–39.7 × 10⁶ m3 w.e. or 18–30% of total streamflow for August–September, compared with 9–15% for the entire melt season.
Volume change estimates also provide a means to assess the glacial ice (not snow and firn) contribution to late-summer streamflow, assuming that all the volume loss was ice that melted in August and September. The average August–September discharge in the lower Hoh River for the past 23 years is 160 × 106 m3. Based on the 23 year volume loss estimate of average annual ice melt of 11.7 × 10⁶ m3 w.e. for the Hoh basin, glacier ice provided 7% of the discharge on the lower Hoh River and 31% of the total glacier contribution (including snow and firn). Although a small fraction of total streamflow, the glacier ice contribution occurs when the contribution from snow and firn melt has declined and summer rainfall is minimal, and represents the average minimum reduction of August–September stream-flow that would occur in the lower Hoh River in the future if glaciers disappeared. The importance of this ‘fossil’ water is magnified during summers when the previous winter’s snowfall is low, and will become more critical in the future as the snowpack declines.
The marked loss of glaciers on the Olympic Peninsula in the past 30 years is largely a result of a 1°C rise in mean annual temperature (Reference Rasmussen and ConwayRasmussen and Conway, 2001), and illustrates how sensitive these relatively small, thin, low-elevation, temperate glaciers are to climate change. This temperature increase has directly increased the summer melt rate, lengthened the melt season and decreased the duration of the accumulation season, resulting in less winter snow accumulation. Reference LaChapelleLaChapelle (1965) notes that the elevation of the freezing level is particularly important in early fall as it controls how much precipitation falls as snow, while Reference Rasmussen, Conway and HayesRasmussen and others (2000) suggest that spring weather is a more important influence on ablation. Cool, cloudy conditions that often prevail in spring in this maritime climate lead to lower melt rates at the time of the summer solstice, particularly during the wet and cold phases of the Southern Oscillation and Pacific Decadal Oscillation. Recent climate warming appears stronger in winter at Blue Glacier, where average winter temperature has risen 3°C in the past half-century (Reference Rasmussen, Conway and HayesRasmussen and others, 2000). As a result, average winter snow accumulation has decreased 500 mm near 1500 m at the glacier terminus since 1948 (Reference Rasmussen, Conway and HayesRasmussen and others, 2000).
Most of the glaciers on the Peninsula are currently not in equilibrium with the present climate, and are expected to continue to shrink in the near future even if accumulation increases and temperature stops rising. In the next several decades, glaciers are likely to continue to disappear rapidly based on projected future temperature increases of several degrees in the next 70 years. Reference Mote and SalathéMote and Salathé (2010) estimate that mean annual temperature in Washington State will increase by at least 1.2°C by 2040 and at least 2.8°C by 2080. Future temperature increases may be even higher near the elevation of glaciers, given positive feedback mechanisms. Further, it is possible that the periodic increases in precipitation associated with the cool wet phase of the Pacific Decadal Oscillation may have waned in the past few decades with a warming climate (Reference Josberger, Bidlake, March and KennedyJosberger and others, 2007).
The preponderance of small glaciers remaining on the Peninsula (145 of 184 are <0.1 km2) means that most are vulnerable to melting away completely in the near future (Fig. 2). The glaciers most threatened by future climate warming are generally those that face south in the drier and warmer climate prevalent on the eastern side of the Peninsula. Glaciers on the northeast part of the mountains on Mount Deception, McCartney Peak and Cameron Peak may be the most threatened due to their isolation from Pacific moisture and climate model projections of higher summer potential evapotranspiration that could translate to higher summer melt rates (Reference ElsnerElsner and others, 2010). Glaciers on the northern side of the Bailey Range and in the headwaters of the Queets and Elwha Rivers should fare slightly better because of their proximity to large valleys that funnel moisture from the Pacific Ocean. However, their accumulation zones are several hundred meters lower than those on the large glaciers of Mount Olympus. If the climate warms at the projected rates, it is likely that within a century glaciers in the Olympic Mountains will be confined to the Mount Olympus massif.
Loss of glaciers due to warming climate has several significant implications for the Olympic Peninsula, including loss of glacial habitat, exposure of vast areas of loose glacial sand and gravel, higher summer stream temperatures and lower late-summer flows in most watersheds. Decline in glacier meltwater production will exacerbate changes in aquatic habitat associated with a warming climate. Reference Mantua, Tohver and HamletMantua and others (2010) identified summer temperature and streamflow as critical physical habitat features for salmon. Loss of glaciers will reduce summer streamflow and contribute to higher summer stream temperatures to the detriment of species such as the bull trout (Salvelinus confluentus) (Reference Halofsky, Peterson, O’Halloran and HoffmanHalofsky and others, 2011). Other ecosystems will also be affected by the loss of glaciers. For example, alpine food webs will be diminished by the loss of species such as the ice worm, which is preyed upon by rosy finches and other alpine species.
Conclusions
The glacier geospatial database we developed provides an important benchmark for assessing glacier extent and glacial runoff changes in the Olympic Mountains for the past 30 years and into the future. The combined area of all glaciers has decreased 34% in the past 30 years, with ice loss accelerating to a rate more than twice as fast as that from 1900 to 1980. Only four of the 184 remaining glaciers are >1 km2 in area. Glaciers on the southern side of the mountains, at lower elevations, and in the northeastern part of the Peninsula exhibited the greatest area and volume losses and are the most likely to disappear in the next century. Glacier decline in the past 30 years in the Olympics is greater than in the Cascades and southern Coast Mountains, but is comparable with Vancouver Island. Based on ice volume losses, glacial contribution to summer streamflow has declined ∼20% in the past 30 years, but remains significant for the Hoh River at 63–79 ± 7 × 10⁶ m3 a−1. Glaciers contribute <5% to summer streamflow in all other large watersheds in the Olympic Mountains. Delivery of this cold, fresh water to streams becomes more critical in the late summer when rainfall is minimal and snowmelt has declined. On the lower Hoh River, glacial ice contributes 7% of the August–September streamflow, which represents the minimum reduction in flow that would occur if all the glaciers melted away. Continued loss of glaciers will directly impact aquatic ecosystems through higher stream temperatures and lower summer base flows.
Acknowledgements
We thank the US National Park Service Climate Change Program for funding this research, and Olympic and North Cascades national parks and Portland State University for in-kind support. Sharon Brady, Roger Hoffman and Steve Dorsch contributed GIS and cartographic expertise. Finally, we want to acknowledge Richard Spicer for the valuable baseline he created on the status of Olympic glaciers in the early 1980s.



