


Introduction
Of the reported carbonatite–silicate rock associations, 11% of occurrences are spatially associated with kimberlites and lamprophyres (Woolley and Kjarsgaard, Reference Woolley and Kjarsgaard2008; Schmidt et al., Reference Schmidt, Giuliani and Poli2024). India hosts approximately 26 carbonatite occurrences, the majority of which are associated with diverse syenites, pyroxenites and ijolite-series rocks (Krishnamurthy, Reference Krishnamurthy2019). Notably, Rio Tinto Exploration reported, for the first time, a purported diamond-bearing hypabyssal ‘carbonatite–kimberlite’ breccia at Khaderpet, within the Wajrakarur Kimberlite Field of the Dharwar Craton (Chatterjee et al., Reference Chatterjee, Haggerty, Beard, Smith and Townend2008). The Khaderpet carbonatite-volcaniclastic breccia remains inadequately studied, even though the Wajrakarur Kimberlite Field is well known for the occurrence of diverse kimberlites, lamproites and lamprophyre (Chalapathi Rao and Srivastava, Reference Chalapathi Rao and Srivastava2009; Fareeduddin and Mitchell, Reference Fareeduddin and Mitchell2012; Kaur and Mitchell, Reference Kaur and Mitchell2013; Shaikh et al., Reference Shaikh, Patel, Ravi, Behera and Pruseth2017). Previous investigations of the Khaderpet carbonatite have focused primarily on basic petrographic observations and bulk-rock geochemical data (Chatterjee et al., Reference Chatterjee, Haggerty, Beard, Smith and Townend2008; Smith et al., Reference Smith, Haggerty, Chatterjee, Beard and Townend2013) and lack a comprehensive mineralogical characterization.
In the present study, the first detailed mineralogical description of the Khaderpet carbonatite, including in situ trace element data for different calcite types and apatite, as well as bulk-rock carbon and oxygen isotopic compositions, are presented. However, no detailed petrogenetic model for the Khaderpet complex is proposed, nor is a genetic link between the carbonatite and the associated ultramafic volcaniclastic breccia put forward, as the available petrological and mineralogical information on the host rocks (Smith et al., Reference Smith, Haggerty, Chatterjee, Beard and Townend2013) is extremely limited. Moreover, the host rocks have undergone extensive alteration by deuteric and meteoric fluids, as well as contamination by abundant mantle-derived xenocrysts and country rock clasts, which obscures the primary mineralogy and precludes reliable classification. The authors have been unable to procure samples of the host volcaniclastics, which might indicate their petrological affinities. Hence, the focus here is only on documenting the magmatic, hydrothermal and supergene processes involved in the formation of this unique allanite-bearing calcite carbonatite occurrence.
Geological occurrence and petrography of the Khaderpet carbonatite
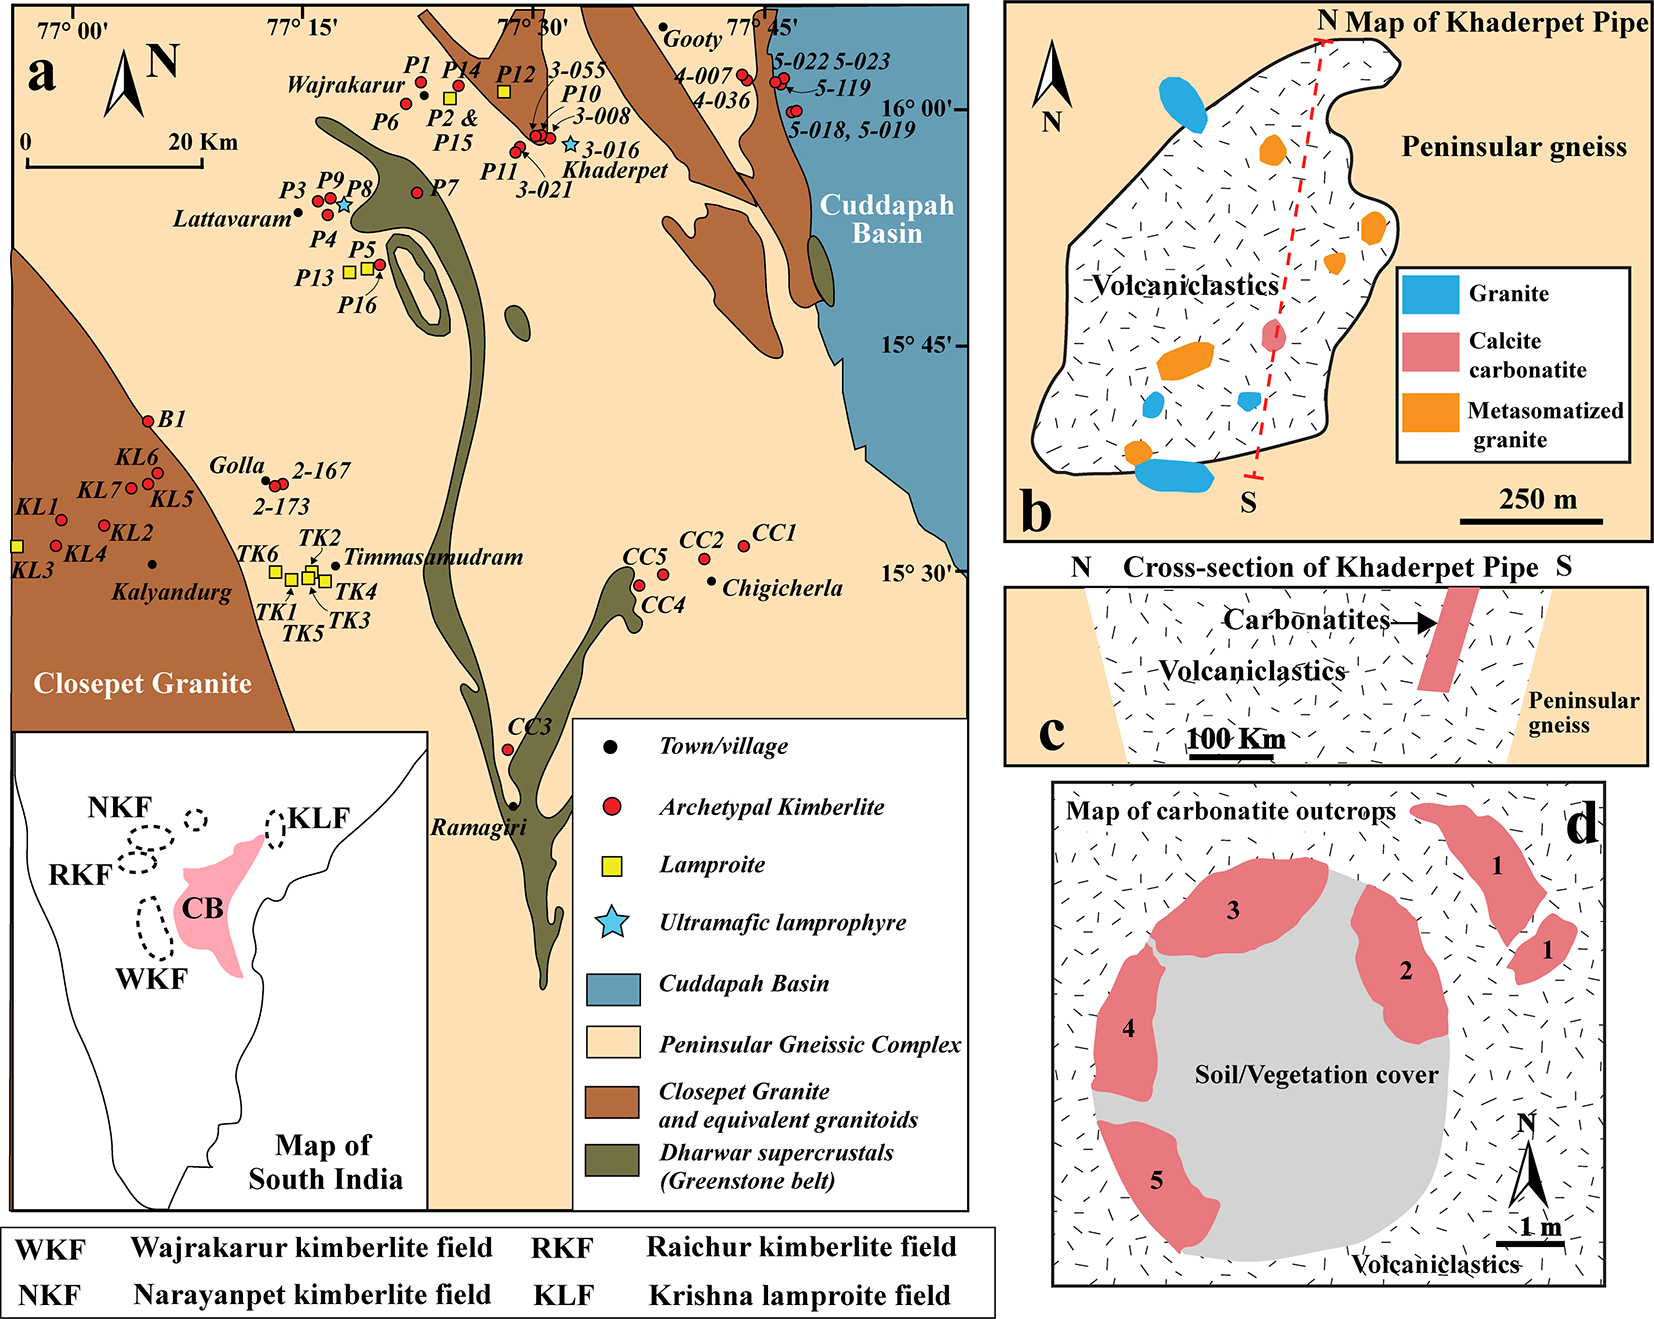
The Khaderpet occurrence is located at the eastern part of the Wajrakarur-Lattavaram cluster of the Wajrakarur Kimberlite field (Fig. 1a). Most of the intrusions in the Wajrakarur-Lattavaram cluster have been described as kimberlites (Scott Smith, Reference Scott Smith2007; Chalapathi Rao et al., Reference Chalapathi Rao, Gibson, Pyle and Dickin2004; Shaikh et al., Reference Shaikh, Patel, Ravi, Behera and Pruseth2017), while several others have been identified as lamproites (P-2, P-5, P-12, P-13 and P-15; Kaur and Mitchell, Reference Kaur and Mitchell2013; Reference Kaur and Mitchell2016; Dongre et al., Reference Dongre, Jacob and Stern2015). In addition, two occurrences, P-9 and 3-016 (Khaderpet), have been classified as ultramafic lamprophyres (Smith et al., Reference Smith, Haggerty, Chatterjee, Beard and Townend2013; Dongre et al., Reference Dongre, Viljoen, Belyanin, Le Roux and Malandkar2020). The Khaderpet carbonatite occurs as a small plug-like, ovoid body (45 m x 60 m; Smith et al., Reference Smith, Haggerty, Chatterjee, Beard and Townend2013) within an altered ultramafic volcaniclastic breccia that intruded the basement peninsular gneiss complex (Fig. 1a–b). Drilling operations by Rio Tinto Exploration have approximately delineated the depth and width of the carbonatite outcrops to >50 m and ∼20 m, respectively (Smith et al., Reference Smith, Haggerty, Chatterjee, Beard and Townend2013) (Fig. 1c–d). However, our recent field observations indicate that the surface outcrop of the carbonatite body is much smaller (∼10 m x 10 m) and separated by the soil cover into smaller, irregular, isolated bodies (Fig. 1d).
(a) Generalized geological map of the Wajrakarur Kimberlite Field, Eastern Dharwar Craton, southern India, showing the main kimberlite clusters: Wajrakarur–Lattavaram, Timmasamudram, Kalyandurg, and Chigicherla (modified after Nayak and Kudari, Reference Nayak and Kudari1999). The inset map illustrates the distribution of kimberlite and lamproite fields across southern India. (b) Schematic geological map and (c) cross-section of the Khaderpet pipe. (d) Plan-view map of the carbonatite outcrops.

Figure 1 Long description
A) The generalized geological map of the Wajrakarur Kimberlite Field in Eastern Dharwar Craton, southern India, displays main kimberlite clusters: Wajrakarur–Lattavaram, Timmasamudram, Kalyandurg and Chigicherla. Symbols indicate towns, archetypal kimberlite, lamproite, ultramafic lamprophyre and carbonatite. The inset map shows kimberlite and lamproite fields across southern India, including Wajrakarur, Narayanpet, Raichur and Krishna fields. B) The schematic geological map of the Khaderpet pipe highlights peninsular gneiss, volcaniclastic breccia and carbonatite. C) The cross-section of the Khaderpet pipe illustrates the distribution of carbonatite within volcaniclastic breccia and peninsular gneiss. D) The plan-view map of carbonatite outcrops shows soil/vegetation cover and isolated carbonatite bodies within volcaniclastic breccia.
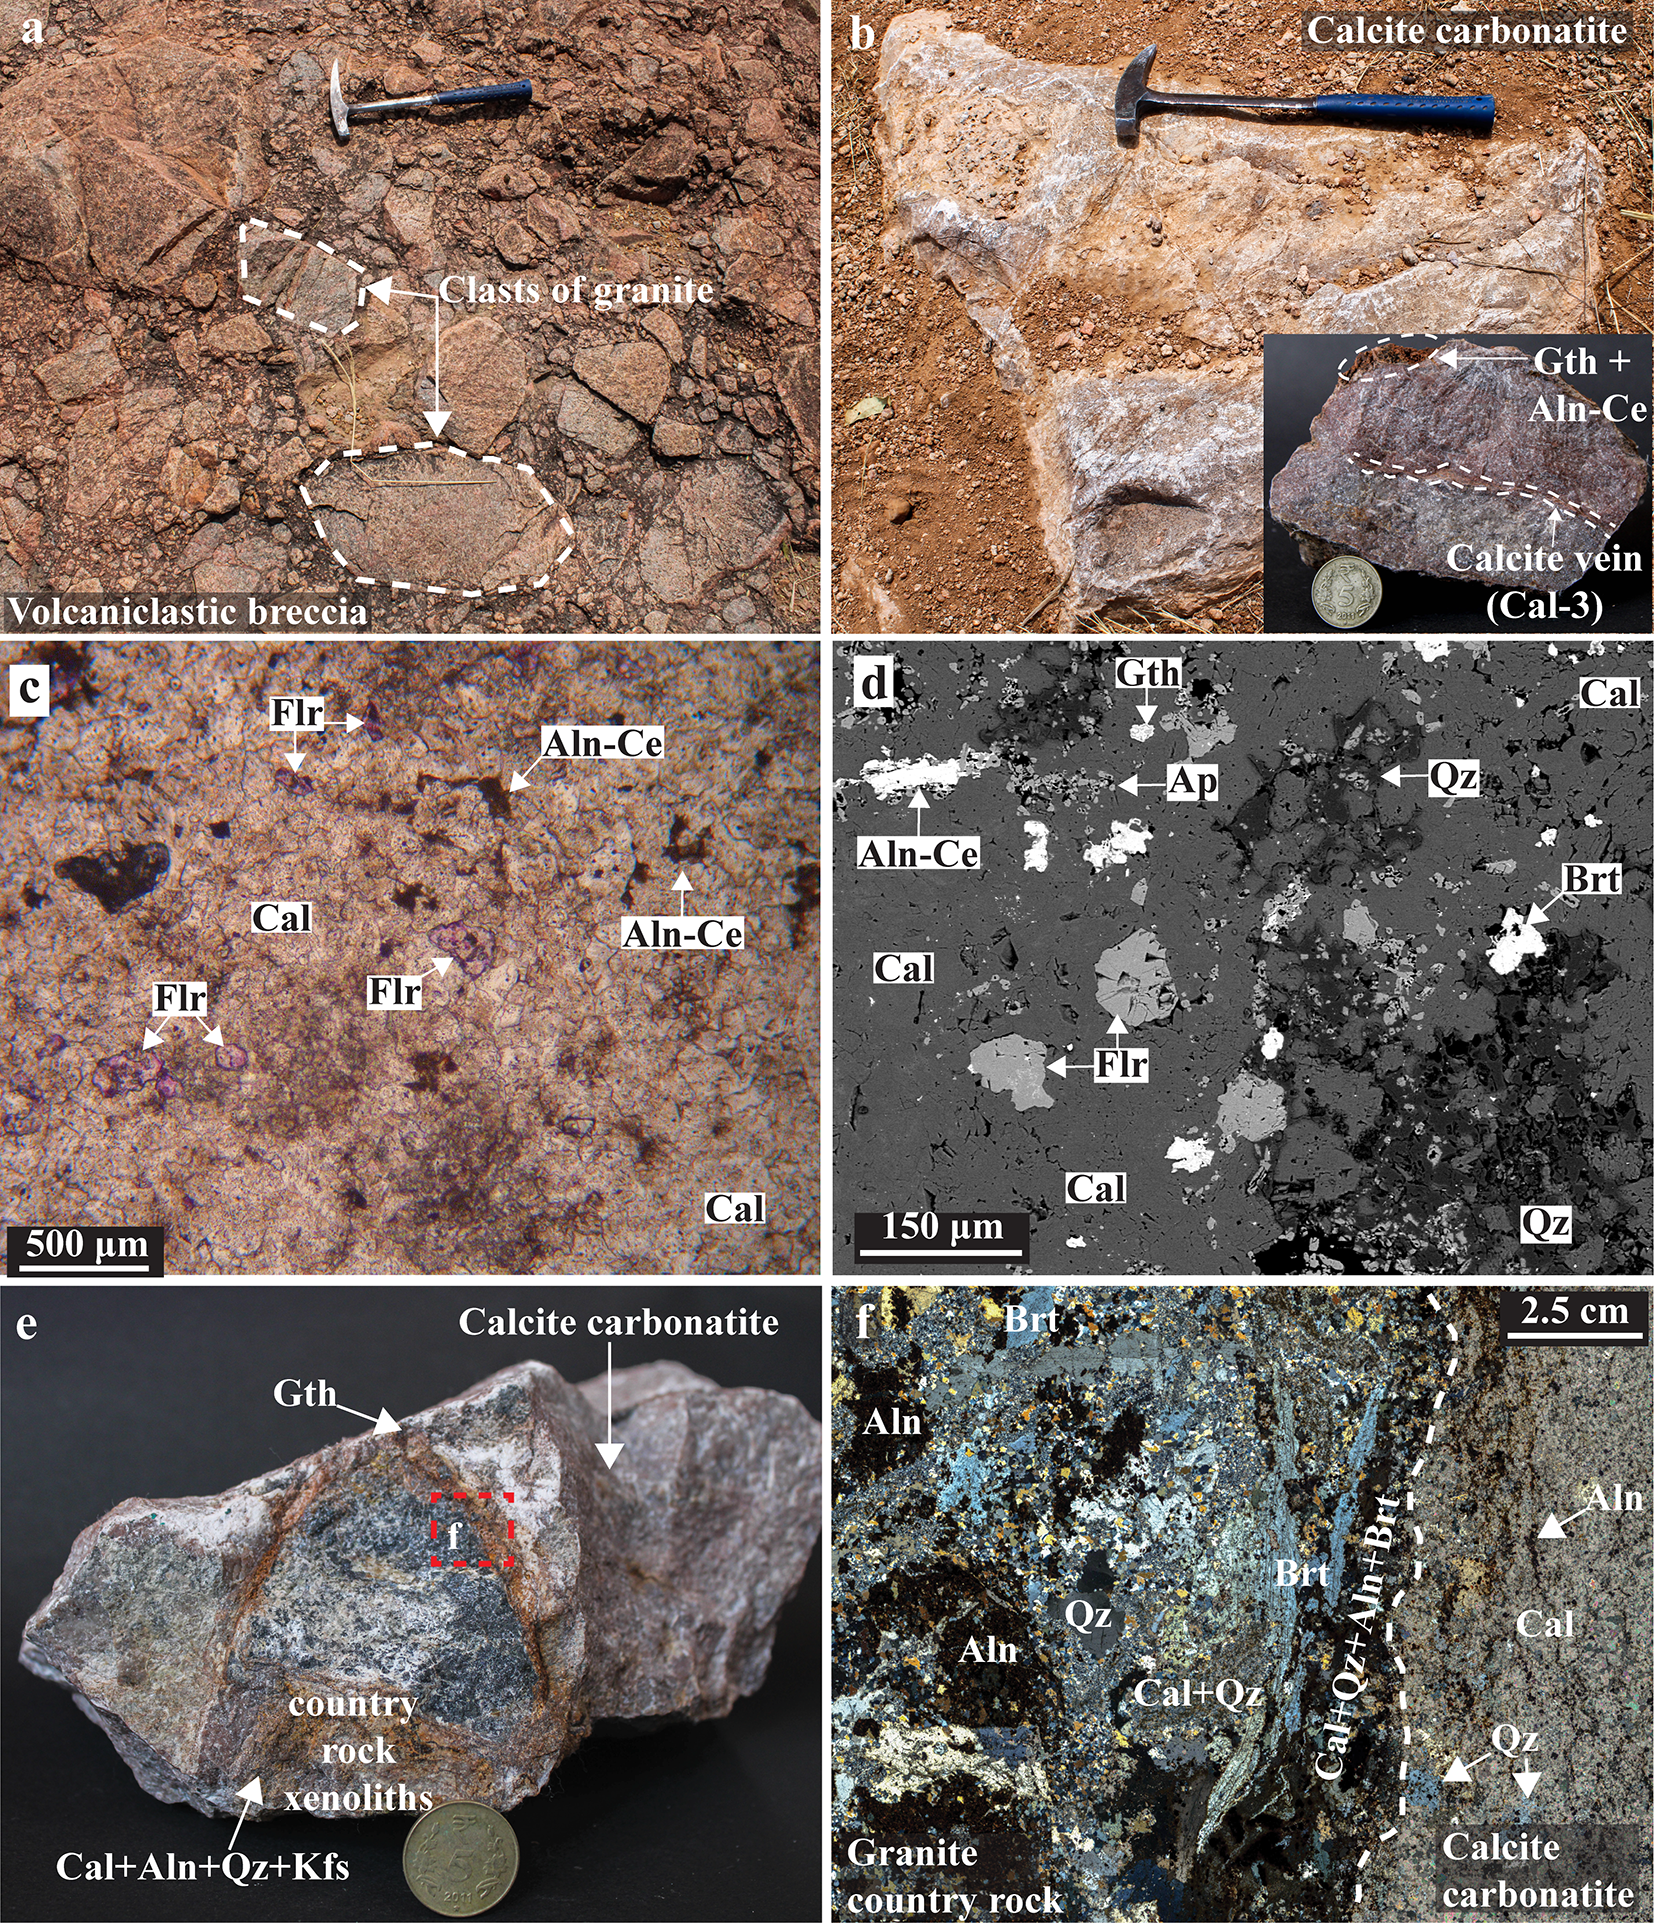
The Khaderpet volcaniclastics are primarily a clast-supported lithic breccia, containing angular-to-subrounded clasts predominantly composed of granite and quartz monzonite derived from country rocks (Fig. 2a; Chatterjee et al., Reference Chatterjee, Haggerty, Beard, Smith and Townend2008; Fareeduddin and Mitchell, Reference Fareeduddin and Mitchell2012; Smith et al., Reference Smith, Haggerty, Chatterjee, Beard and Townend2013). The clasts show a green-to-reddish brown tint due to the formation of secondary chlorite and hematite at the expense of biotite and feldspar, respectively (Smith et al., Reference Smith, Haggerty, Chatterjee, Beard and Townend2013). The matrix contains olivine micro-phenocrysts, now pseudomorphed by calcite, talc and clay minerals, together with finely disseminated titanite and late crosscutting carbonate veins. Accessory phases are pyrope, magnesiochromite, chrome diopside, magnesian ilmenite and Ti-poor andradite (Chatterjee et al., Reference Chatterjee, Haggerty, Beard, Smith and Townend2008). Additionally, mantle-derived xenocrysts of chromite, peridotite- and eclogite-derived garnet, chrome diopside and diamond are present (Chatterjee et al., Reference Chatterjee, Haggerty, Beard, Smith and Townend2008; Fareeduddin and Mitchell, Reference Fareeduddin and Mitchell2012). The occurrence of Ti-poor andradite and MgO-poor (∼13 wt.%) and CaO (∼10 wt.%) rich bulk rock compositions have been suggested to indicate a probable affinity with ultramafic lamprophyres (Fareeduddin and Mitchell, Reference Fareeduddin and Mitchell2012). However, the limited mineralogical information, extensive alteration of primary phases by deuteric or meteoric fluids, and the abundance of diverse mantle xenocrysts and country rock xenoliths preclude classification of these rocks.
(a, b) Field photographs showing occurrences of mm-to-cm scale angular-to-subrounded granite clasts hosted by volcaniclastic silicate host rocks and grey calcite carbonatite. Inset image in (b) shows a hand-specimen image of the carbonatite with a supergene assemblage of goethite (Gth) and allanite-(Ce) (Aln-Ce) at its surface and a late calcite (Cal) vein. (c) Transmitted light photomicrograph showing disseminated anhedral fluorite (Flr) and Aln-Ce crystals in a fine-grained, equigranular calcite matrix. (d) Back-scattered electron (BSE) image showing disseminated anhedral Flr and fine-grained apatite (Ap) clusters commonly overgrown by Aln-Ce, with late-stage residual quartz (Qz), baryte (Brt), and accessory Gth within the Cal matrix. (e, f) Hand-specimen and transmitted-light photomicrograph showing calcite carbonatite hosting granite xenoliths with reddish-brown goethite alteration zones, displaying variable degrees of alteration and an assemblage dominated by Aln, Qz, Cal and Brt along the carbonatite-xenolith contact. A hammer (42 cm in length; a and b) and coins with diameters of 27 mm (b, inset) and 23 mm (e) are used for scale.

Figure 2 Long description
Image A shows a field photograph with angular-to-subrounded granite clasts within volcaniclastic breccia. A hammer is used for scale. Image B displays calcite carbonatite with a hammer for scale and an inset showing a hand-specimen with goethite and allanite-(Ce) on its surface, alongside a calcite vein. Image C is a transmitted light photomicrograph showing disseminated fluorite and allanite-(Ce) crystals in a calcite matrix. Image D is a back-scattered electron image showing fluorite, apatite clusters, allanite-(Ce), quartz, baryte and goethite within the calcite matrix. Image E shows a hand-specimen of calcite carbonatite hosting granite xenoliths with goethite alteration zones, labeled with minerals like allanite, quartz and baryte. Image F is a photomicrograph showing calcite carbonatite and granite country rock with mineral assemblages along the contact, including allanite, quartz, calcite and baryte. Coins and a hammer are used for scale in several images.
The carbonatite appears in shades of grey and reddish brown and is composed predominantly of calcite (>90 vol.%), exhibiting a fine-grained, allotriomorphic granular texture (Fig. 2b,c). In addition to calcite, (5–10 vol.%) accessory apatite, fluorite, quartz, allanite-(La), -(Ce) and Fe-hydroxides are present. Trace minerals (<1 vol.%) include baryte, REE-fluorocarbonates, pyrite and pyrochlore (Fig. 2c,d). Fluorite commonly occurs as anhedral crystals disseminated within the calcite matrix (Fig. 2d). Late-stage intergrowths of baryte and quartz occur as veins or patches interstitial to matrix calcite (Fig. 2d). Although Smith et al. (Reference Smith, Haggerty, Chatterjee, Beard and Townend2013) reported the presence of flow textures, oblate spheroids of calcite in a fine-grained saponite matrix, and the occurrence of titanite and clay minerals, none of these features were observed in the carbonatite examined in this study. Granite xenoliths enclosed within carbonatite typically exhibit a brownish-to-dark grey colouration (Fig. 2e). The contact zone between the carbonatite and these xenoliths is variably metasomatized, forming a secondary assemblage dominated by allanite-(La), -(Ce), quartz, baryte, calcite and minor Fe-hydroxide in decreasing order of modal abundance (Fig. 2f).
Analytical methods
The petrography and mineralogy were determined using a conventional polarizing microscope, Raman spectroscopy (Horiba Jobin Yvon LabRAM HR800, IISER Tirupati), and back-scattered electron (BSE) imaging with a field emission scanning electron microscope (FE-SEM, SIGMA VP, Carl Zeiss, University of Warsaw). Quantitative mineral compositions were determined using a field emission electron probe microanalyser (EPMA, JEOL JXA-8530F, AIST, Japan) and a Hitachi FE-SU70 scanning electron microscope equipped with an Oxford AZtec EDS system (Lakehead University, Canada). Trace element concentrations in calcite and apatite were analysed by laser-ablation inductively coupled plasma mass spectrometry (LA-ICP-MS; Agilent 8900 with Laser Blender Raijin, AIST, Japan). Stable carbon and oxygen isotope compositions were measured using an automated carbonate digestion system (Thermo scientific Kiel IV carbonate device) connected to a Finnigan Delta V Plus mass spectrometer (University of Nevada, Las Vegas). Analytical details are further elaborated in Supplementary Material 1.
Compositions and paragenesis of the minerals
Calcite
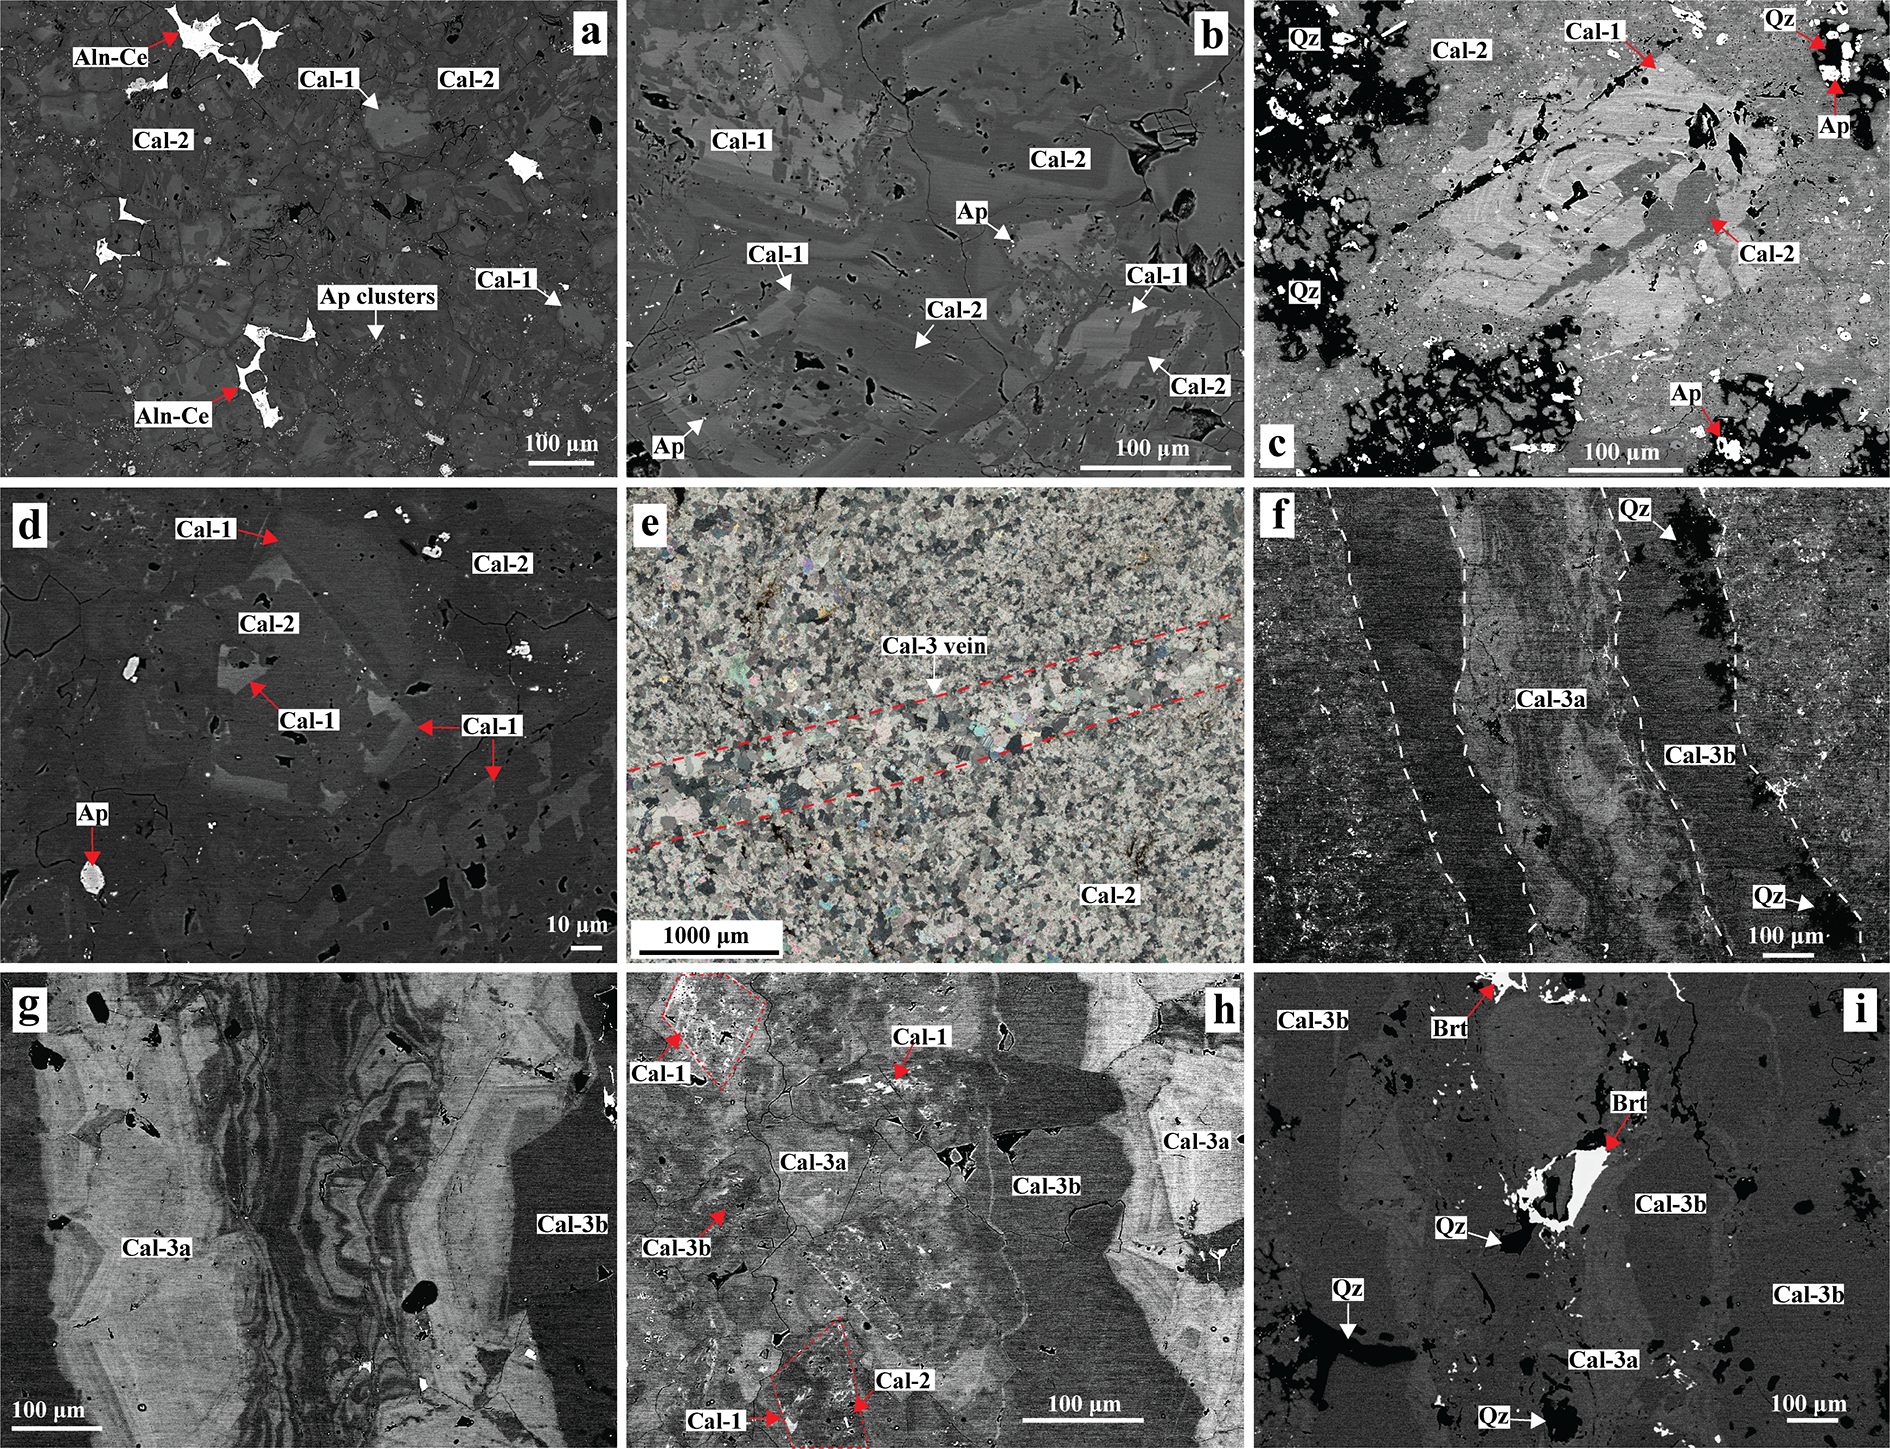
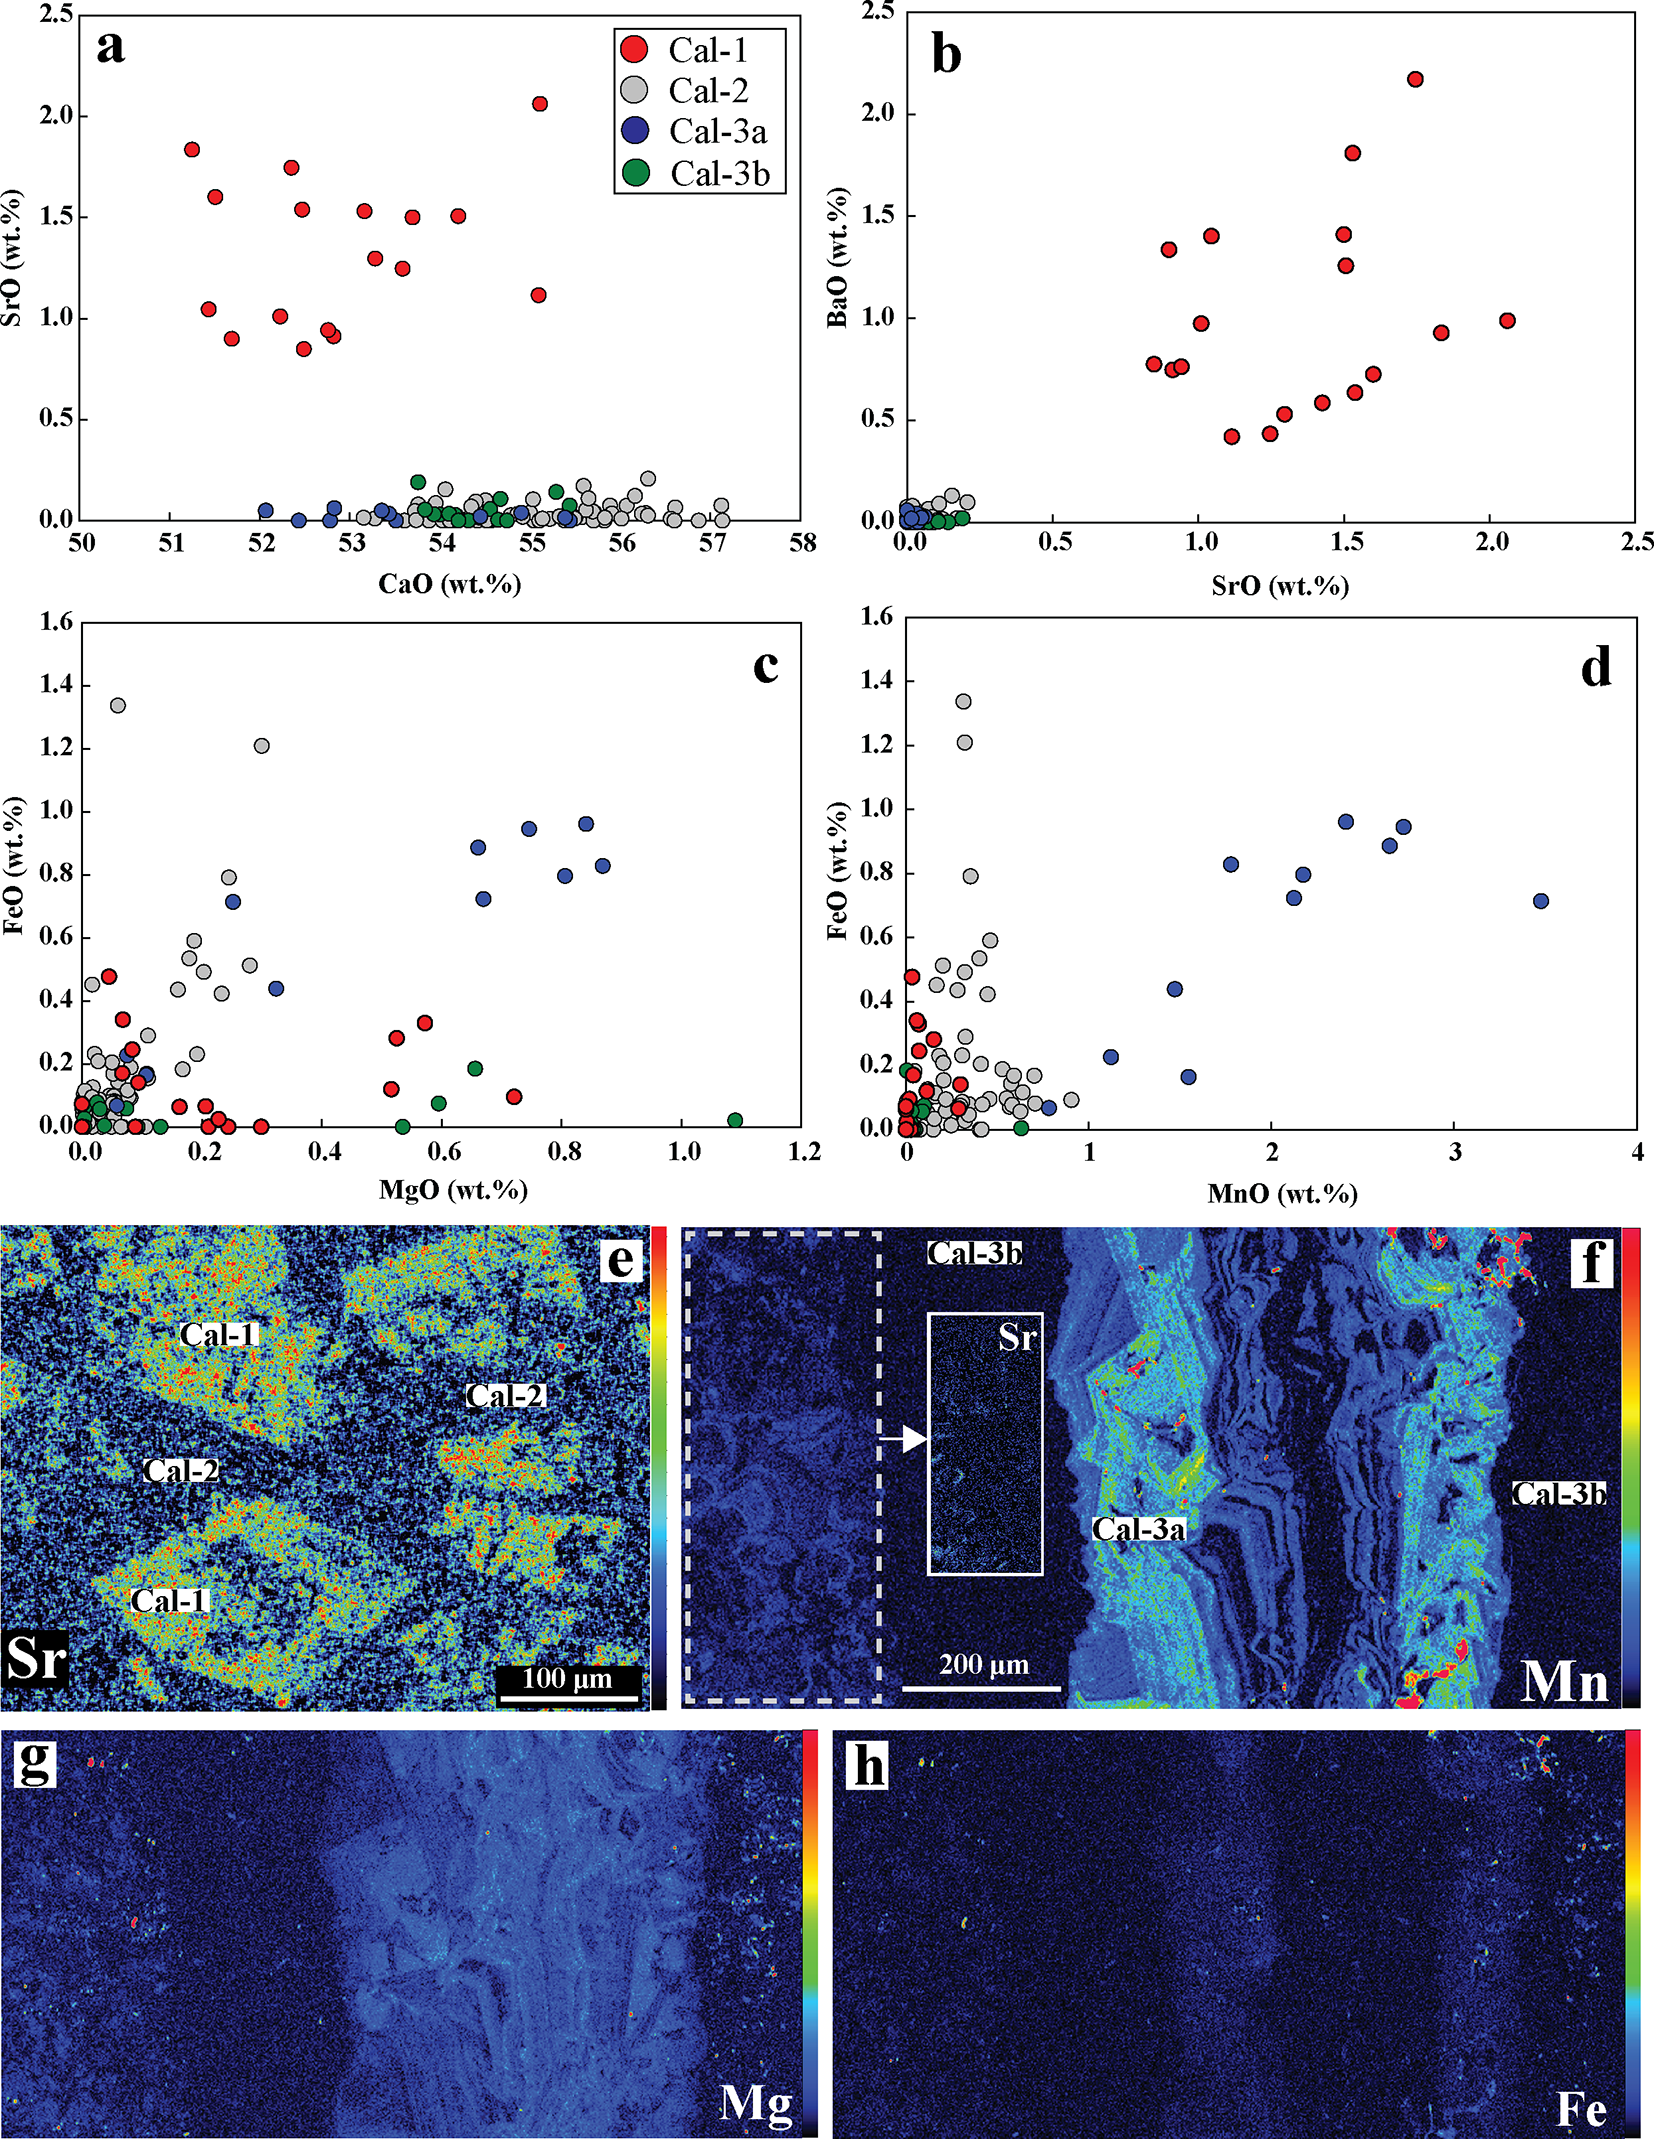
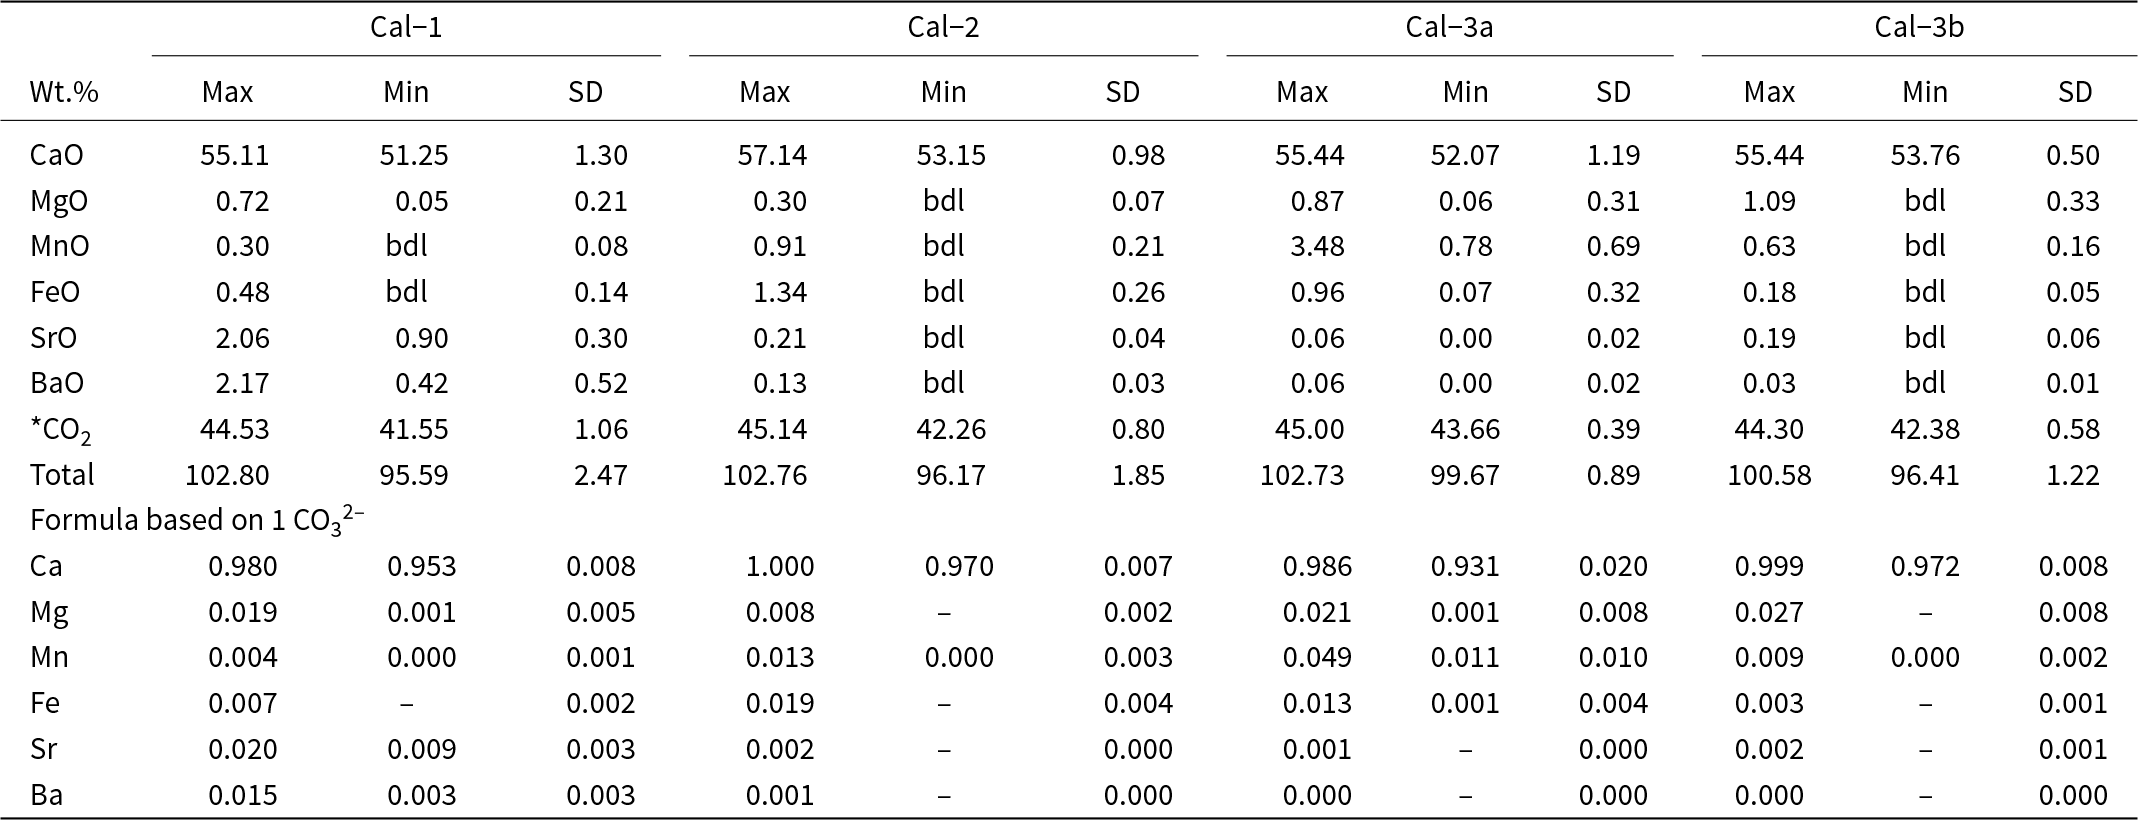
On the basis of texture and BSE-imagery, calcite is classified into three types: calcite-1, calcite-2 and calcite-3. Calcite-1 occurs as high-AZ (AZ: average atomic number) rhombohedral phenocrysts that display both oscillatory and intermediate-AZ patchy zonation and are commonly fragmented, resorbed and partially replaced by the low-AZ calcite-2, which constitutes the carbonatite matrix (Fig. 3a–d). Calcite-3 forms coarse-grained veins that crosscut the calcite-2 matrix (Fig. 3e). The BSE images show that calcite-3 veins consist of two distinct subzones: a high-AZ core calcite-3a and a low-AZ peripheral zone calcite-3b (Fig. 3f–i). The high-AZ core (calcite-3a) commonly exhibits rhythmic zoning, characterized by alternate bright and dark bands of varying thickness (400–1000 µm) (Fig. 3g). Rhombohedral relicts of calcite-1, pseudomorphed by calcite-2, can be found encased within the calcite-3 (calcite-3a and calcite-3b) zones (Fig. 3h). The calcite-1 phenocrysts have the highest concentrations of Sr and Ba (0.8–2.1 wt.% SrO and 0.4–2.2 wt.% BaO) compared to other calcite types (Fig. 4a–b, e; Fig. 5b–d; Tables 1–2). Calcite-1 has low Mg, Fe and Mn contents comparable to most calcite-2 and calcite-3b (Table 1; Fig. 4c–d, f–h; Supplementary Material 2, Table S1). In contrast, the high-AZ calcite-3a is characterized by the highest Mn (0.78–3.48 wt.% MnO) and has high Fe and Mg contents compared to other calcite types (Fig. 4d, f). The majority of calcite-2 and calcite-3b approach the end-member composition with variable Mg (up to 0.3 wt.% and 1.1 wt.% MgO, respectively), Fe (up to 1.3 wt.% and 0.2 wt.% FeO, respectively) and Mn (up to 0.9 wt.% and 0.6 wt.% MnO, respectively) with negligible Ba and Sr contents (Table 1; Fig. 4c–d; Supplementary Material 2, Table S1).
Back-scattered electron (BSE) images (a–d, f–i) and a transmitted-light photomicrograph (e) illustrating the textural characteristics of the different calcite (Cal) types. (a–d) Cal-1 forms bright rhombohedral phenocrysts showing both oscillatory and intermediate-AZ patchy zoning, and is commonly fragmented, resorbed and partially replaced by the darker Cal-2 matrix. (e) Coarse Cal-3 veins crosscut the fine-grained Cal-2 matrix. (f–i) BSE images show that Cal-3 veins comprise two subzones: a bright Cal-3a core and a darker Cal-3b rim. Cal-3a typically displays rhythmic zoning with alternating bright and dark bands of variable thickness, and encloses rhombohedral relicts of Cal-1 pseudomorphed by Cal-2. Cal-3b is intergrown with late hydrothermal quartz (Qz) and baryte (Brt).

Figure 3 Long description
The image A showing a grayscale micrograph with multiple boxed text labels placed across the field, several white arrows and a scale bar at the lower right. The image B showing a grayscale micrograph with several boxed text labels distributed across the field, a few arrows and a scale bar at the lower right. The image C showing a grayscale micrograph with a large lighter-toned central area, multiple boxed text labels, several red arrows and a scale bar at the lower right. The image D showing a grayscale micrograph with boxed text labels, several red arrows pointing to small features and a scale bar at the lower right. The image E showing a grayscale micrograph with a red dashed line running diagonally across the field, boxed text labels near the line and a scale bar at the lower left. The image F showing a grayscale micrograph with a vertically banded or layered texture, boxed text labels near the bands and a scale bar at the lower right. The image G showing a grayscale micrograph with irregular darker and lighter regions, boxed text labels and a scale bar at the lower left. The image H showing a grayscale micrograph with multiple boxed text labels, several red arrows and a scale bar at the lower right. The image I showing a grayscale micrograph with boxed text labels, several red arrows and a scale bar at the lower right.
(a–d) Binary plots illustrating the compositional variation among the different calcite (Cal) types based on CaO, SrO, BaO, FeO, MgO and MnO (wt.%). Cal-1 displays exceptionally high SrO and BaO contents relative to the other calcite types, whereas Cal-3a is enriched in FeO, MgO and shows the highest MnO concentrations. (e–h) X-ray elemental maps highlight these trends, with (e) Cal-1 showing significantly elevated Sr relative to the surrounding Cal-2 matrix and (f–h) Cal-3a veins exhibiting higher Mn, Mg and Fe contents compared to Cal-3b. Inset image (f) show the presence of relict Sr-rich Cal-1 in Cal-2 matrix overgrown by Mn-Fe-Mg rich Cal-3a adjacent to the Cal-3 vein.

Figure 4 Long description
The image A showing a scatter plot with x-axis label CaO (wt.%) and y-axis label SrO (wt.%). The x-axis ranges from 50 to 58. The y-axis ranges from 0 to 2.5. A legend lists Cal-1, Cal-2, Cal-3a and Cal-3b. Plotted points include Cal-1 points between CaO about 51 to 54 and SrO about 0.8 to 1.8 and Cal-2, Cal-3a, Cal-3b points clustered near CaO about 54 to 57 and SrO about 0.0 to 0.3. The image B showing a scatter plot with x-axis label SrO (wt.%) and y-axis label BaO (wt.%). The x-axis ranges from 0.0 to 2.5. The y-axis ranges from 0 to 2.5. Plotted points include a group at SrO about 0.0 to 0.3 with BaO about 0.0 to 0.2 and Cal-1 points spanning SrO about 0.6 to 2.2 with BaO about 0.4 to 2.2. The image C showing a scatter plot with x-axis label MgO (wt.%) and y-axis label FeO (wt.%). The x-axis ranges from 0.0 to 1.2. The y-axis ranges from 0.0 to 1.4. Plotted points include many points at MgO about 0.0 to 0.3 with FeO about 0.0 to 0.6 and a set of Cal-3a points around MgO about 0.6 to 1.0 with FeO about 0.6 to 1.1. The image D showing a scatter plot with x-axis label MnO (wt.%) and y-axis label FeO (wt.%). The x-axis ranges from 0 to 4. The y-axis ranges from 0.0 to 1.4. Plotted points include many points at MnO about 0.0 to 0.6 with FeO about 0.0 to 0.6 and Cal-3a points around MnO about 1.5 to 3.5 with FeO about 0.6 to 1.0. The image E showing an elemental map labeled Sr, with labels Cal-1, Cal-2, Cal-3a and Cal-3b placed on the map. A scale bar reads 100 micrometer. The image F showing an elemental map labeled Mn, with labels Cal-3a and Cal-3b placed on the map. The text Sr appears within a boxed area. A scale bar reads 200 micrometer. The image G showing an elemental map labeled Mg. The image H showing an elemental map labeled Fe.
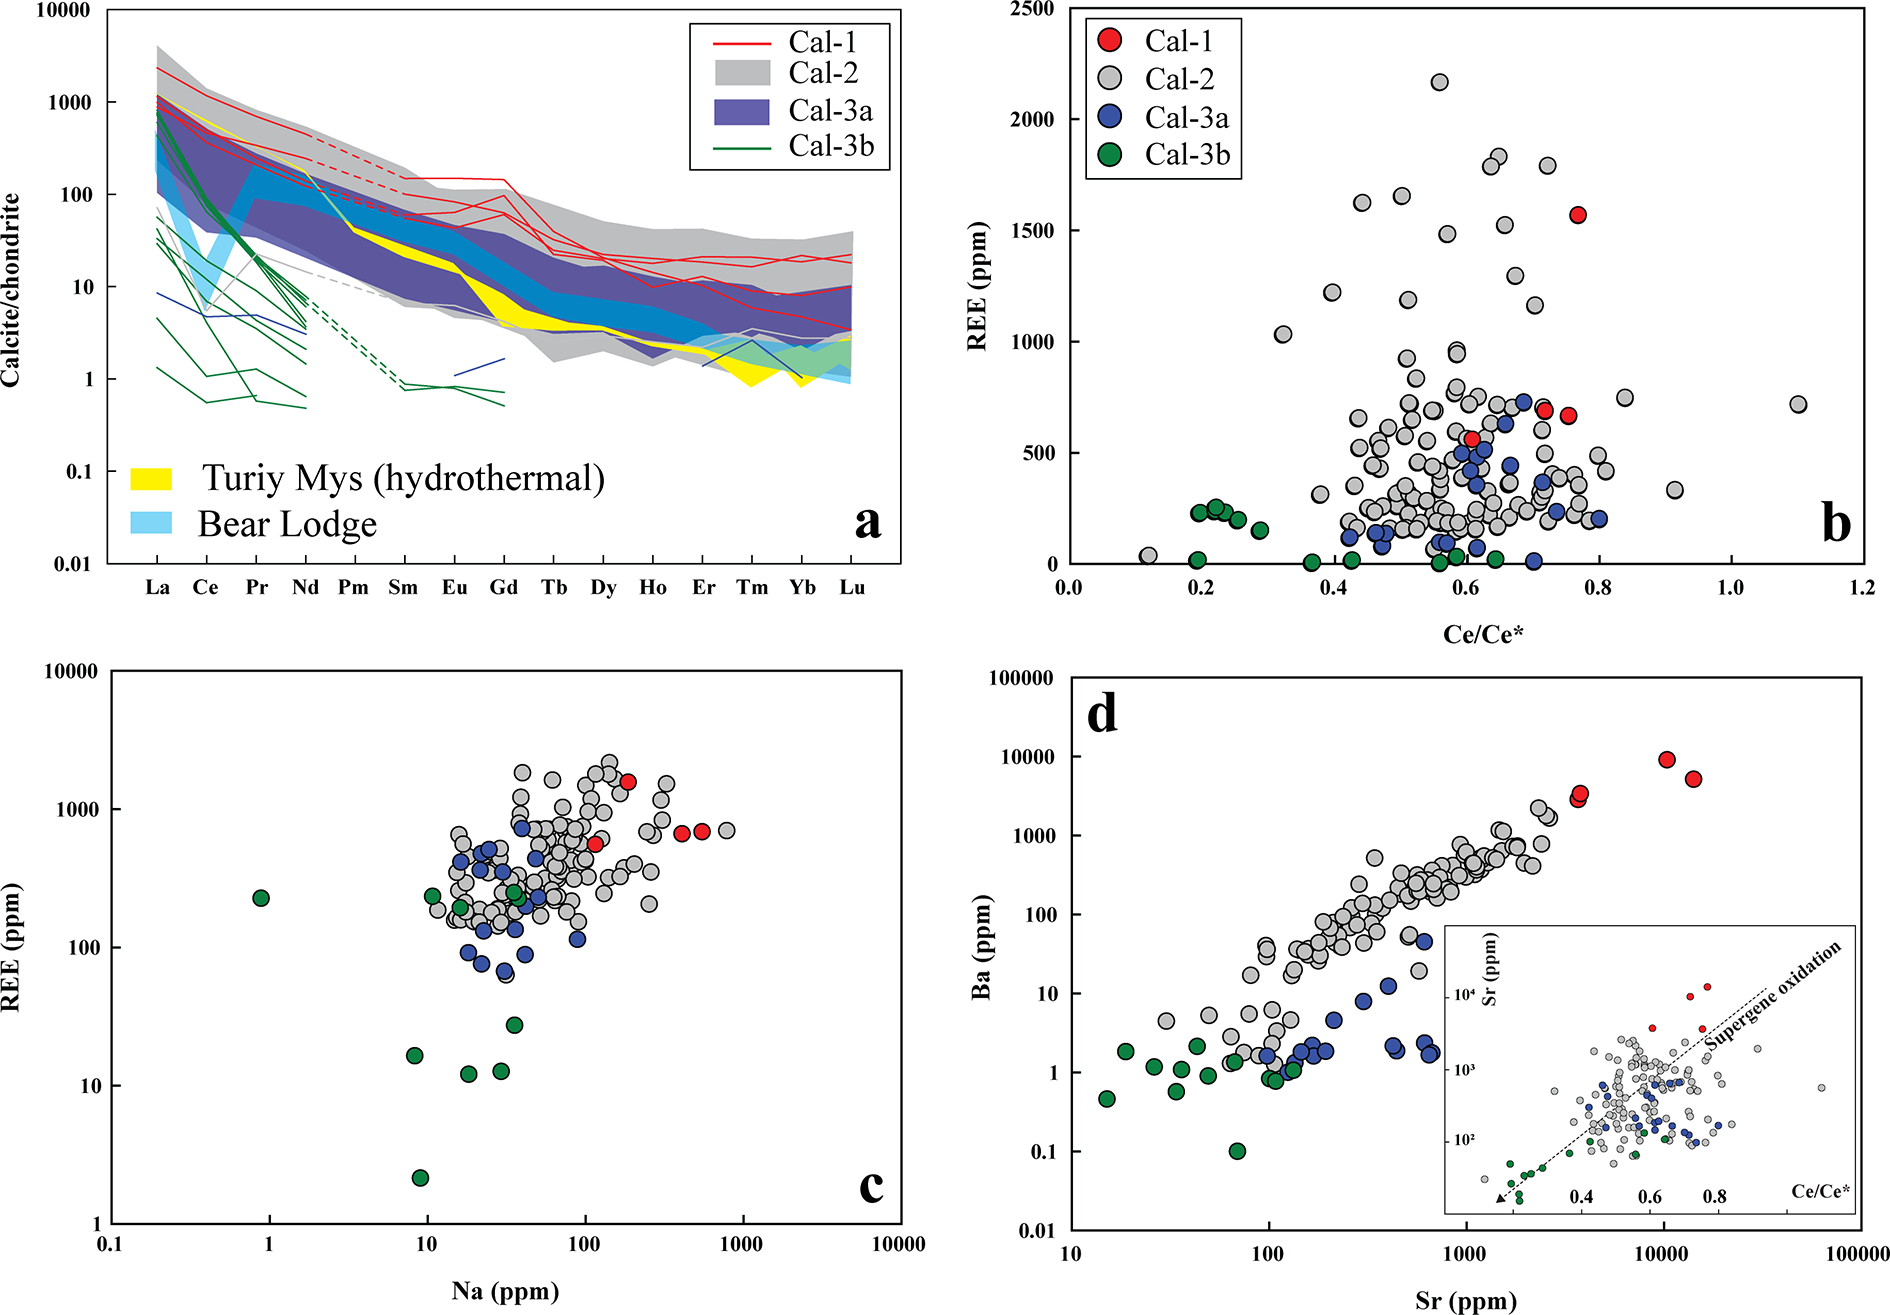
(a) Chondrite-normalized rare earth element (REE) patterns for calcite. Most calcite types (Cal-1, Cal-2 and Cal-3a) show pronounced light REE (LREE) enrichment and overlapping compositions. Normalizing values are from McDonough and Sun (Reference McDonough and Sun1995). For comparison, hydrothermal calcite from Turiy Mys (yellow) and supergene calcite from Bear Lodge (blue) are also shown (data source: Chakhmouradian et al., Reference Chakhmouradian, Reguir, Couëslan and Yang2016b). (b) All calcite types exhibit negative Ce anomalies. Calcite-3b is distinguished by its very low heavy REE (HREE) concentrations and its strongest negative Ce anomalies. (c, d) Concentrations of REE, Na, Sr and Ba decrease progressively from Cal-1 to Cal-2, Cal-3a and Cal-3b. The inset plot in (d) demonstrates a systematic decrease in Sr and Ce/Ce* from Cal-1 to Cal-2, Cal-3a and Cal-3b, consistent with a progressive supergene oxidation signature in calcite.

Figure 5 Long description
The image A showing a line graph with the vertical axis label “Calcite/chondrite” and tick labels 0.01, 0.1, 1, 10, 100, 1000. The horizontal axis shows element labels “La”, “Ce”, “Pr”, “Nd”, “Sm”, “Eu”, “Gd”, “Tb”, “Dy”, “Ho”, “Er”, “Tm”, “Yb”, “Lu”. A legend lists “Cal-1”, “Cal-2”, “Cal-3a”, “Cal-3b”, “Turiy Mys (hydrothermal)” and “Bear Lodge”. Multiple lines are plotted for each calcite type across La to Lu. The lines for Cal-1, Cal-2 and Cal-3a form overlapping bands that start higher at La and decrease toward Lu. The Cal-3b lines plot lower than the other calcite types across most elements and also decrease from La toward Lu. The Turiy Mys (hydrothermal) and Bear Lodge lines plot as additional reference patterns across La to Lu. The image B showing a scatter plot with the vertical axis label “REE (ppm)” and tick labels 0, 500, 1000, 1500, 2000. The horizontal axis label is “Ce/Ce” with tick labels 0.0, 0.2, 0.4, 0.6, 0.8, 1.0, 1.2. A legend lists “Cal-1”, “Cal-2”, “Cal-3a”, “Cal-3b”. The plotted points form a main cluster between Ce/Ce about 0.4 to 0.7 and REE about 0 to 1000, with additional points extending upward to about 2000 REE. Cal-3b points cluster at low REE values near the bottom of the plot, around Ce/Ce* about 0.3 to 0.6. Cal-1 and Cal-2 include points at higher REE values, including points above 1000. The image C showing a scatter plot with the vertical axis label “REE (ppm)” and tick labels 1, 10, 100, 1000, 10000. The horizontal axis label is “Na (ppm)” with tick labels 0.1, 1, 10, 100, 1000, 10000. A legend lists “Cal-1”, “Cal-2”, “Cal-3a”, “Cal-3b”. Most points cluster between Na about 100 to 1000 and REE about 100 to 1000. Cal-3b points plot at lower REE values than the main cluster, including points around REE about 10 to 100 with Na around 10 to 1000. Several Cal-1 points extend to higher REE values, reaching into the 1000 to 10000 range. The image D showing a scatter plot with the vertical axis label “Ba (ppm)” and tick labels 0.1, 1, 10, 100, 1000, 10000. The horizontal axis label is “Sr (ppm)” with tick labels 0.1, 1, 10, 100, 1000, 10000. A legend lists “Cal-1”, “Cal-2”, “Cal-3a”, “Cal-3b”. The points form an upward pattern where higher Sr values align with higher Ba values. Cal-1 includes points at the highest Sr and Ba values, reaching into the 1000 to 10000 range on both axes. Cal-3b points plot at lower Sr and Ba values, commonly between about 1 to 1000 Sr and about 0.1 to 100 Ba. Panel D includes an inset scatter plot with the vertical axis label “Sr (ppm)” and the horizontal axis label “Ce/Ce*”. The inset contains multiple points and two diagonal reference lines with text labels that are not fully legible. Across the four plots, the figure combines one rare earth element pattern plot (A) with three element relationship scatter plots (B, C, D) using the same calcite-type categories listed in the legends.
Minimum–maximum values and standard deviations of major oxide compositions in calcite

Table 1 Long description
The table reports maximum, minimum, and standard deviation for major oxide weight percent and corresponding cation proportions for four calcite groups: Cal-1, Cal-2, Cal-3a, and Cal-3b. CaO dominates in all groups, ranging from 51.25 to 57.14 wt percent, with Cal-2 reaching the highest CaO maximum. Recalculated carbon dioxide spans about 41.55 to 45.14 wt percent, and totals range from 95.59 to 102.80 wt percent, indicating variable analytical totals among groups. Minor oxides are generally low: MgO is at most 1.09 wt percent, FeO at most 1.34 wt percent, and several minima are reported as below detection. Cal-3a stands out for elevated MnO, from 0.78 to 3.48 wt percent, higher than the other groups whose MnO maxima are 0.91 wt percent or less. SrO and BaO are highest in Cal-1, with maxima of 2.06 wt percent and 2.17 wt percent, while the other groups show much lower maxima, at or below 0.21 wt percent for SrO and 0.13 wt percent for BaO. In the cation proportions, calcium is near one across all groups, while magnesium, manganese, iron, strontium, and barium are small and sometimes absent where values fall below detection. Values marked below detection or shown as missing should be treated as non-quantified rather than true zeros, and the carbon dioxide values are derived from stoichiometry rather than directly measured.
Notes: *CO2 is recalculated based on stoichiometry, bdl: below detection limits
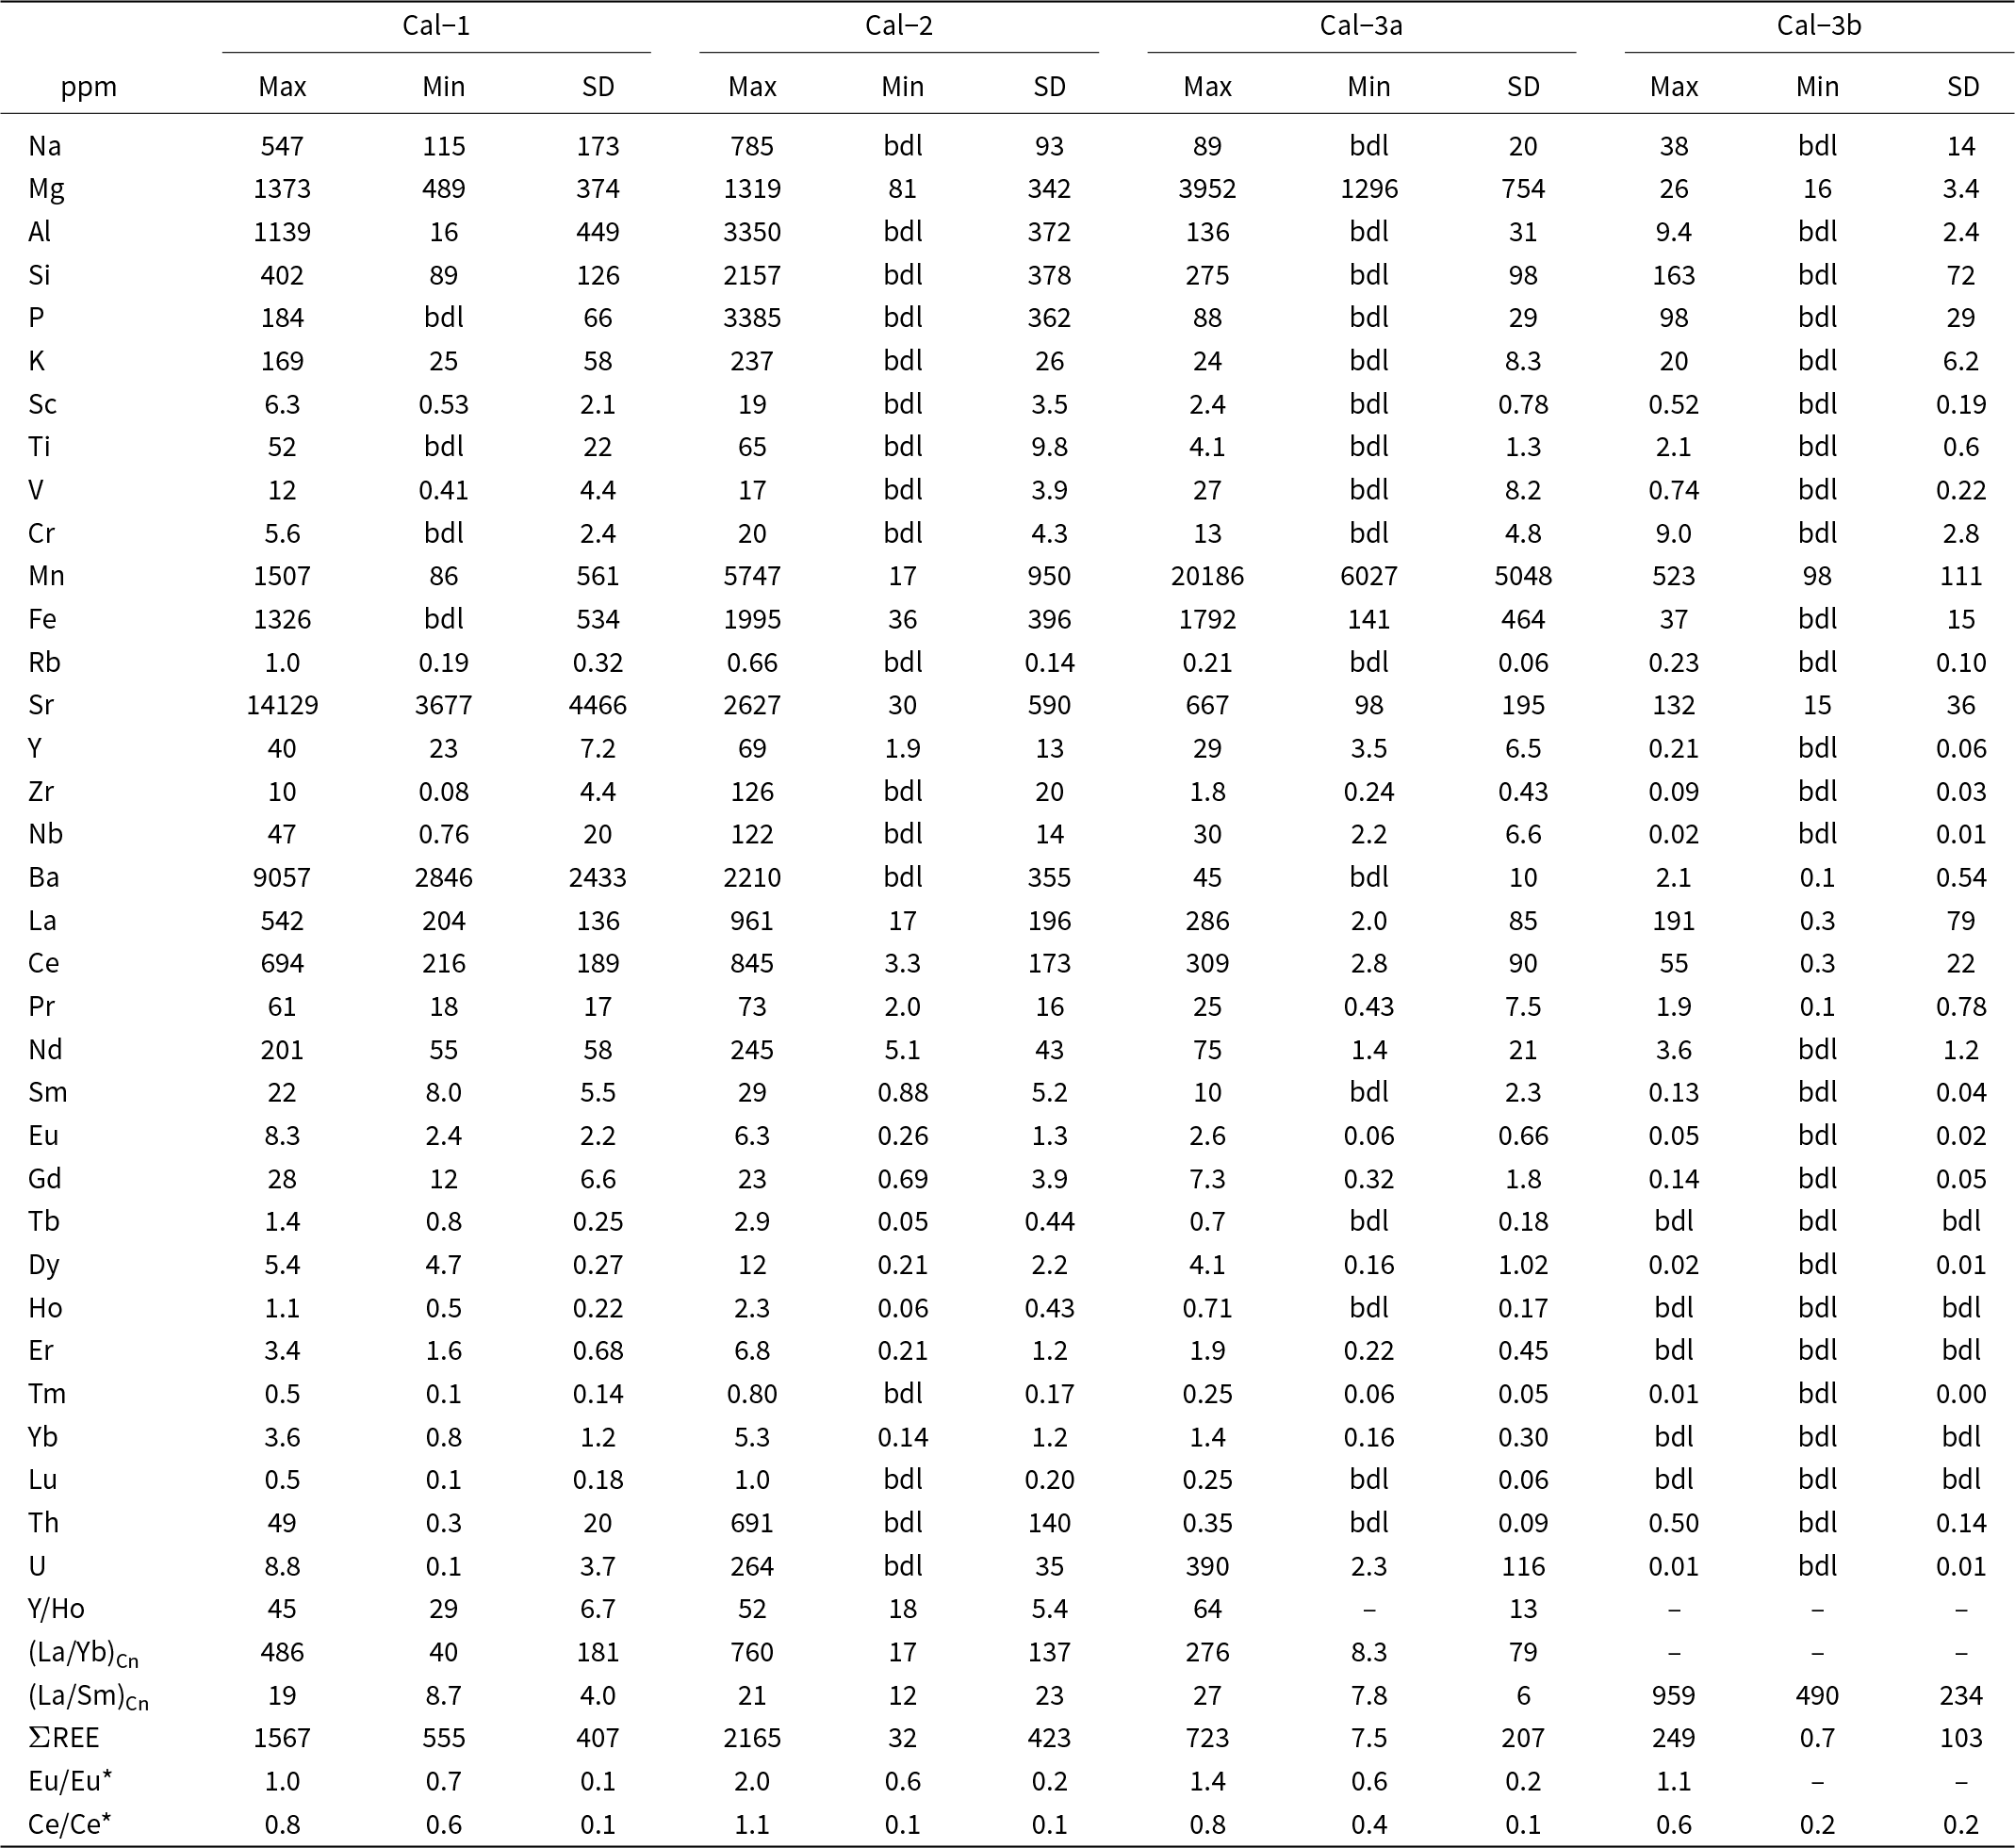
Calcite-1, calcite-2 and calcite-3a exhibits overlapping and negatively sloping light rare earth element (LREE)-enriched [(La/Yb)Cn: 8–760)] distribution patterns with a steep decline from La to Sm [(La/Sm)Cn: 5–135], followed by a gradual decrease in heavier lanthanides (Table 2; Fig. 5a). Most calcite types (calcite-1, -2 and -3a) are characterized by La > Ce and exhibit negative Ce anomalies, with Ce/Ce* (CeCn/(0.5LaCn + 0.5PrCn)) values clustering predominantly between 0.8 and 0.4 (Fig. 5a–b). In contrast, calcite-3b shows a more pronounced negative Ce anomaly (Ce/Ce*: 0.2–0.6) and a steeper decrease from La to Sm [(La/Sm)Cn: 490–959], with heavier lanthanides typically below detection limits than other calcite types (Table 2; Fig. 5a; Supplementary Material 2, Table S2). In common with the REE data, Na concentrations in calcite-1 (115–547 ppm) and calcite-2 (up to 785 ppm) show considerable overlap, whereas calcite-3 generally exhibits the lowest Na content (calcite-3a: up to 89 ppm; calcite-3b: up to 38 ppm).
Minimum–maximum ranges and standard deviations of trace element concentrations in calcite

Table 2 Long description
The table reports trace element concentrations in calcite for four samples (Cal-1, Cal-2, Cal-3a, Cal-3b), giving maximum, minimum, and standard deviation values in parts per million. Many elements have minimum values listed as below detection limits, especially in Cal-3b, indicating frequent non-detections and added uncertainty at the low end. Cal-3a stands out for very high manganese (about 6,027 to 20,186 ppm) and elevated uranium (about 2.3 to 390 ppm), compared with much lower uranium in Cal-1 and Cal-3b. Cal-1 is enriched in strontium (about 3,677 to 14,129 ppm) and barium (about 2,846 to 9,057 ppm), far exceeding the ranges in Cal-2, Cal-3a, and Cal-3b. Cal-2 shows the highest thorium (up to about 691 ppm) and high maxima for several major trace elements such as sodium, aluminium, silicon, and phosphorus, though minima are often below detection limits. Rare earth element totals are highest in Cal-2 (up to about 2,165 ppm) and Cal-1 (up to about 1,567 ppm), moderate in Cal-3a (up to about 723 ppm), and much lower in Cal-3b (up to about 249 ppm), with Cal-3b also having many rare earth minima below detection. Ratio rows (for example Y to Ho and chondrite-normalised ratios) are incomplete for Cal-3a and Cal-3b, so cross-sample comparisons for those metrics are limited.
Notes: bdl: below detection limits; Cn: Chondrite-normalised; Ce* = CeCn/(0.5LaCn + 0.5PrCn); Eu* = EuCn/(0.5SmCn + 0.5GdCn)
Apatite
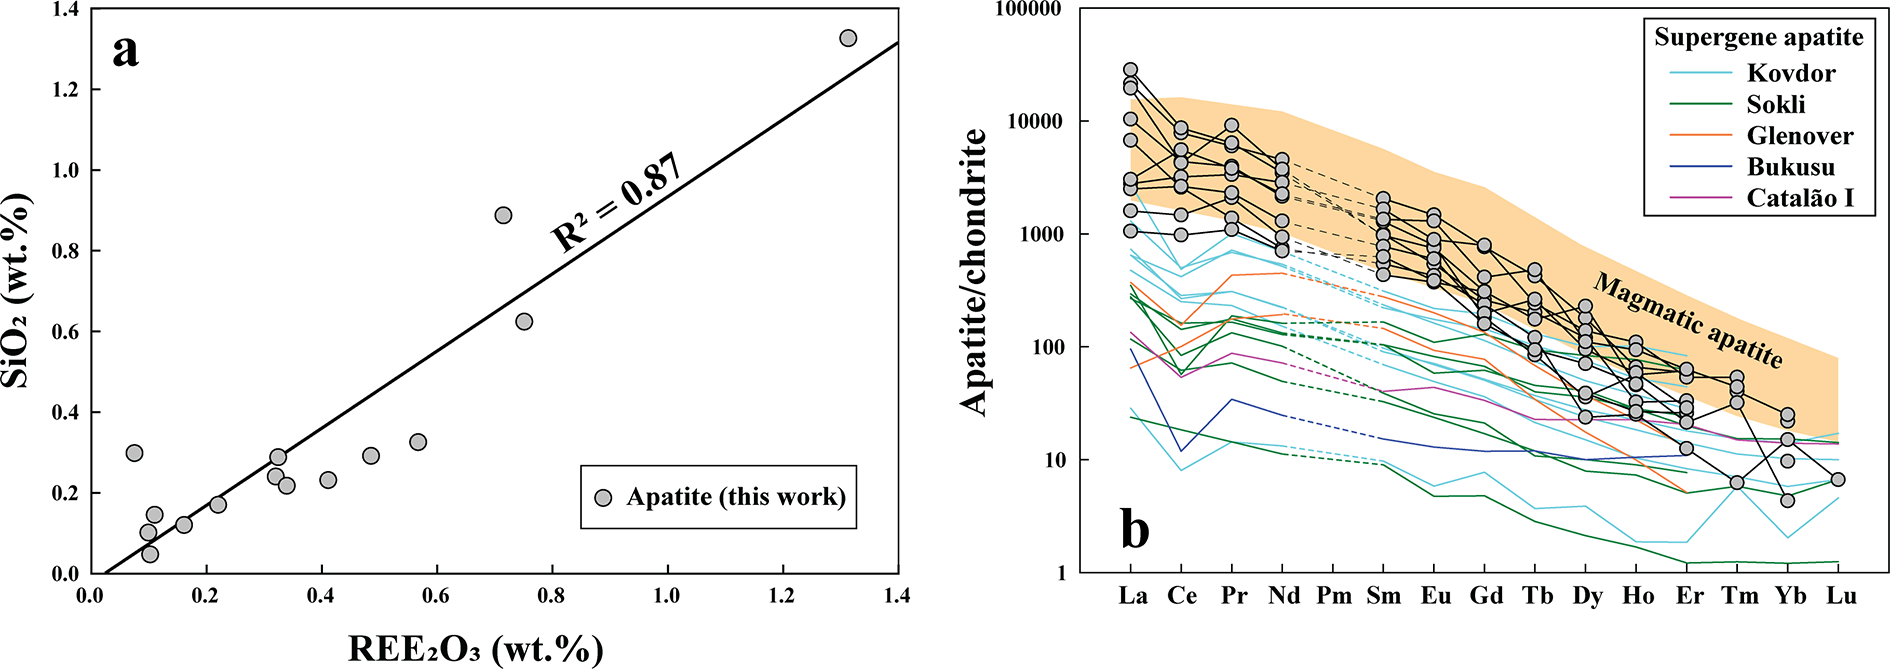
The majority of euhedral-to-subhedral apatite crystals are extremely fine-grained (5–20 µm) and exhibit a range of morphologies, including hopper-shaped, elongated and wedge-shaped habits (Fig. 6). Apatite occurs primarily as clusters or bands within the calcite-2 matrix (Figs 3a–d, 6a). Some apatite crystals in BSE images exhibit well-defined, darker euhedral cores overgrown by thin (<5 µm), compositionally distinct bright rims characterized by elevated Si contents (up to 1.3 wt.% SiO2, Supplementary Material 2, Table S3) (Fig. 6e–f). The absence of a carbonate band (CO32– ν 4) at 737 cm–1 and of a sulfate band (SO42– ν 4) in the range 640–672 cm–1 in the Raman spectra confirms that these anionic groups are not present in significant quantities (Zhukova et al., Reference Zhukova, Stepanov, Korsakov and Jiang2022; Supplementary Material 3, Fig. S1). All apatite compositions correspond to fluorapatite with variable fluorine contents (2.1–3.22 wt.%; Supplementary Material 2, Table S3). The apatite exhibits varying ΣREE (0.1–1.3 wt.% REE2O3), which correlates positively with Si content, suggesting a britholite-type substitution (Ca2+ + P5+ → REE3+ + Si4+) (Fig. 7a).
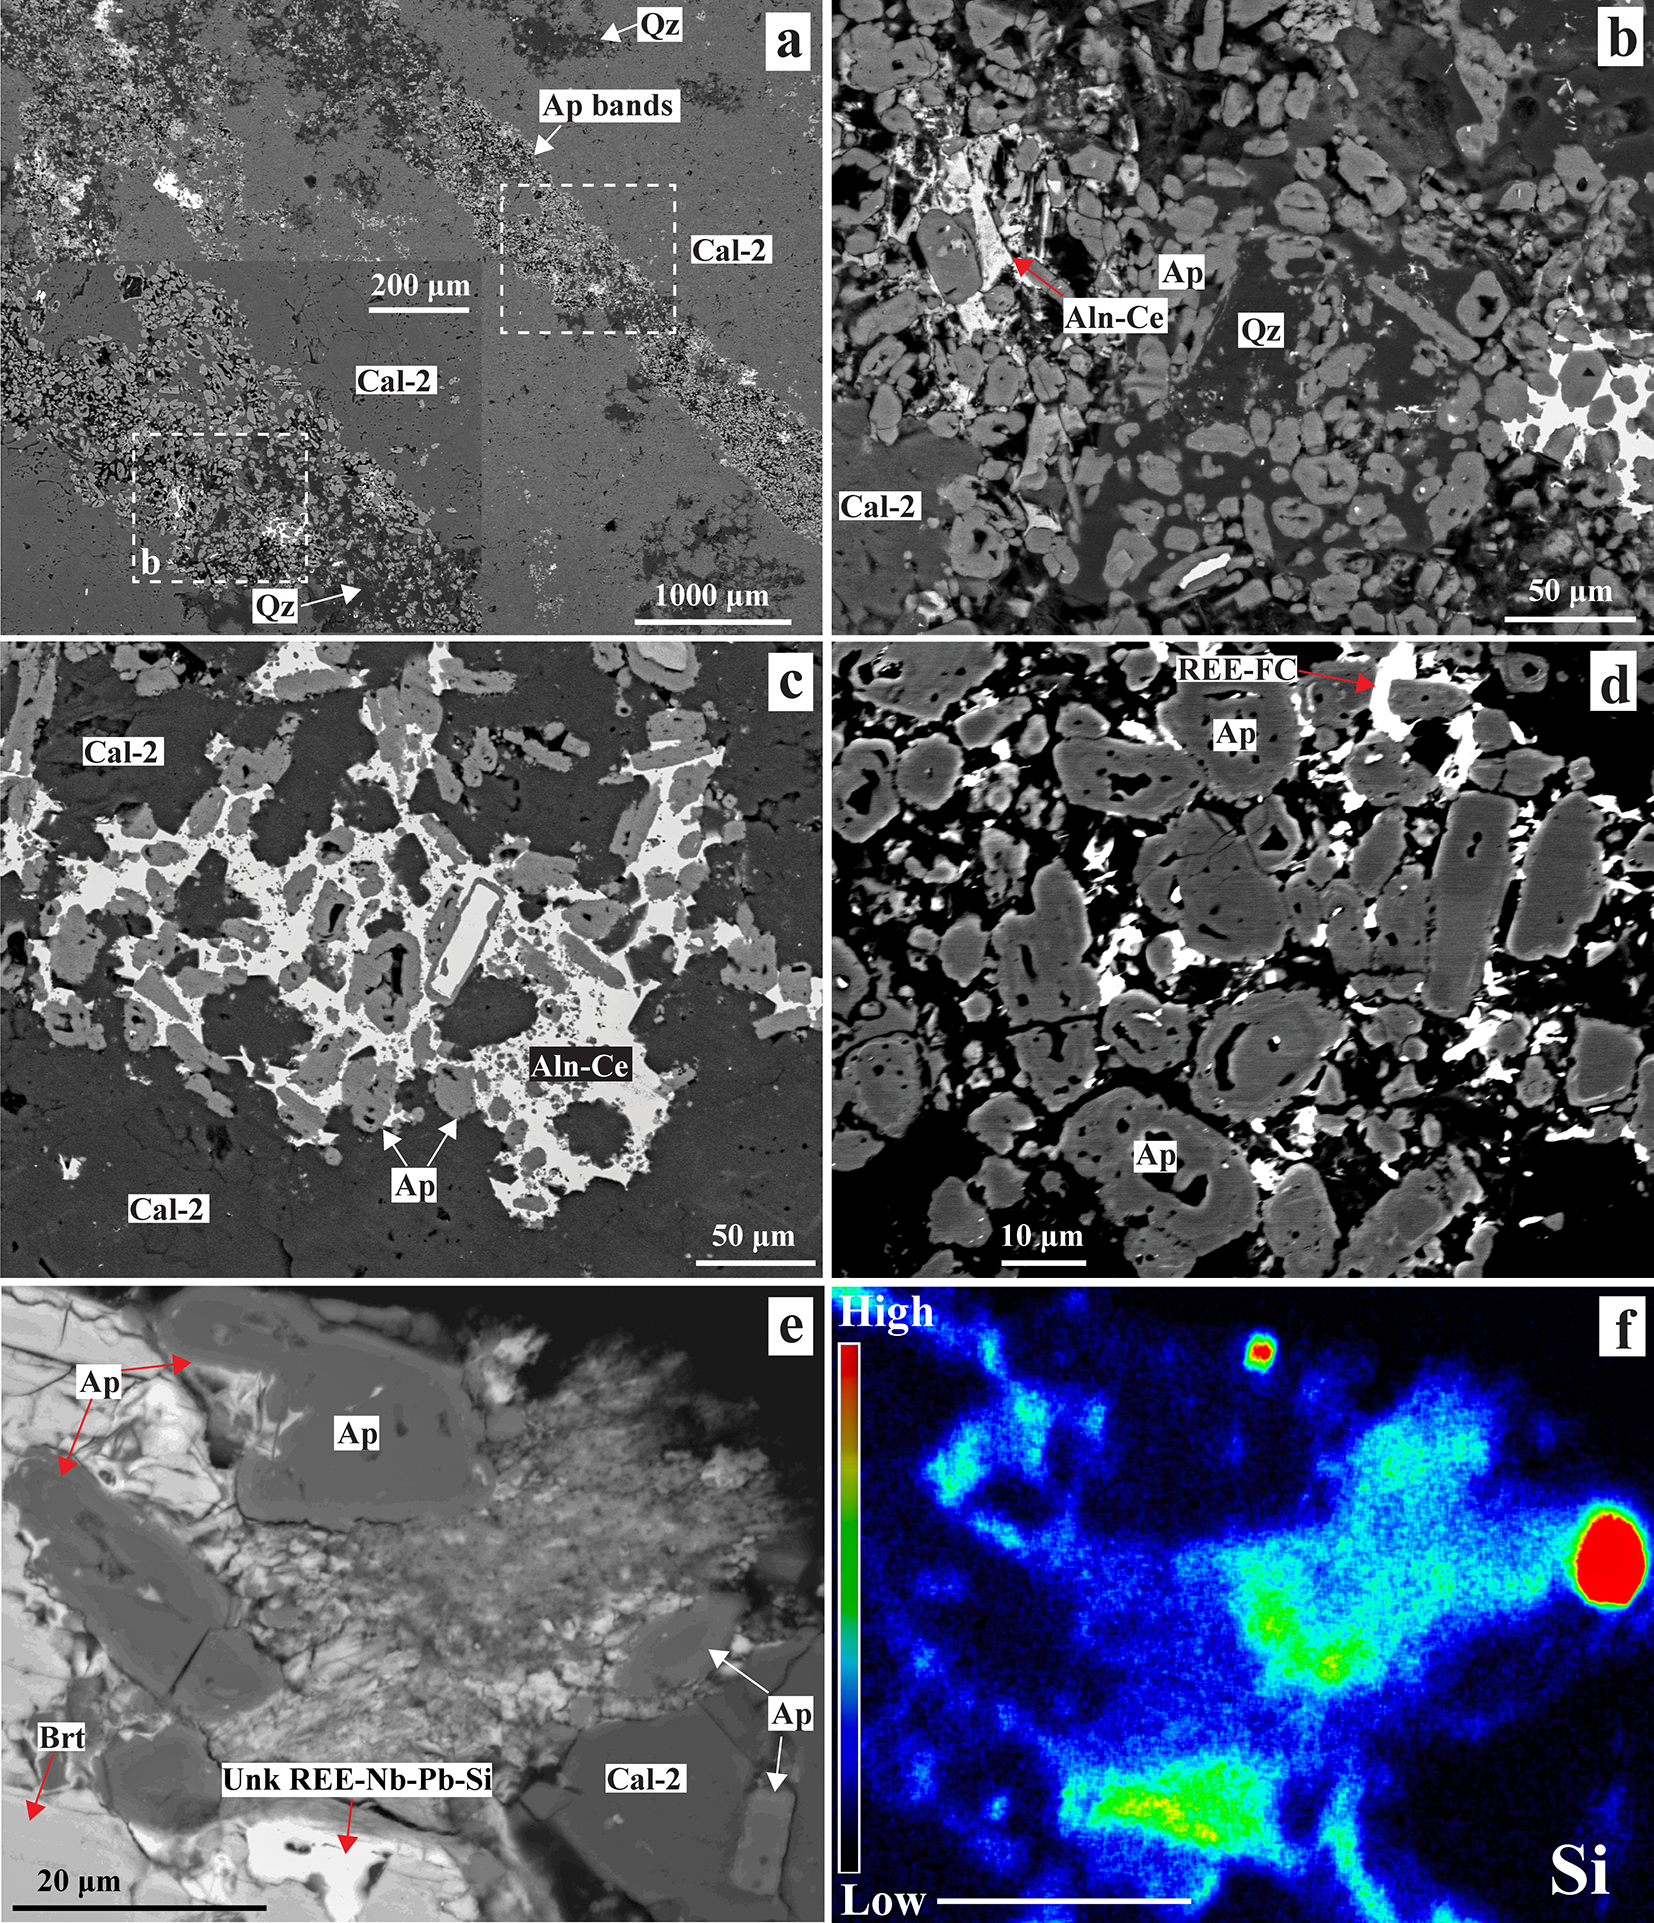
Back-scattered electron (BSE) images (a–e) show that apatite (Ap) occurs as fine-grained clusters, commonly confined to linear bands. These are locally overgrown by allanite-(Ce) (Aln-Ce) and are associated with late interstitial quartz (Qz) and REE-fluorocarbonates (REE-FC). Baryte (Brt) and a bright, compositionally complex phase enriched in REE, Nb, Pb and Si (Unk REE-Nb-Pb-Si) occur interstitially to Ap (e). (f) X-ray map revealing that the apatite rims and the unknown REE-Nb-Pb-Si phase exhibit elevated Si contents.

Figure 6 Long description
This figure consists of multiple panels illustrating the mineralization context of apatite using back-scattered electron (BSE) micrographs and a silicon (Si) X-ray map. The image A shows a BSE micrograph with apatite bands labeled 'Ap bands' and interstitial quartz labeled 'Qz', with a scale bar of 200 micrometers. The image B displays a BSE micrograph showing apatite clusters labeled 'Ap', allanite-(Ce) labeled 'Aln-Ce' and quartz labeled 'Qz', with a scale bar of 50 micrometers. The image C presents a BSE micrograph with calcite-2 labeled 'Cal-2', apatite labeled 'Ap' and allanite-(Ce) labeled 'Aln-Ce', with a scale bar of 50 micrometers. The image D shows a BSE micrograph with apatite labeled 'Ap', allanite-(Ce) labeled 'Aln-Ce' and REE-fluorocarbonates labeled 'REE-FC', with a scale bar of 10 micrometers. The image E illustrates a BSE micrograph with apatite labeled 'Ap', baryte labeled 'Brt' and an unknown phase enriched in REE, Nb, Pb and Si labeled 'Unk REE-Nb-Pb-Si', with a scale bar of 20 micrometers. The image F is an X-ray map showing elevated silicon content, with a color gradient indicating high and low levels of silicon. The absence of a specific measurement scale is noted. The images demonstrate the spatial relationships among apatite, quartz, calcite, allanite-(Ce), REE-fluorocarbonates, baryte and the Si-enriched unknown phase, highlighting how apatite occurs as bands and clusters, with allanite and REE-fluorocarbonates overgrowing or associating with apatite and the unknown phase occurring interstitially.
(a) Apatite compositions display a strong positive correlation between REE2O3 and SiO2 (wt.%) contents (R 2 = 0.87), consistent with a britholite-type substitution mechanism. (b) Chondrite-normalised trace element pattern for apatite shows LREE-enrichment. Some apatite crystals display an irregular, zigzag REE pattern and with both positive and negative Ce anomalies. Normalizing values are from McDonough and Sun (Reference McDonough and Sun1995). The magmatic and supergene apatite compositions from Kovdor, Sokli, Glenover, Bukusu and Catalão I are shown for comparison (Broom-Fendley et al., Reference Broom-Fendley, Siegfried, Wall, O’Neill, Brooker, Fallon, Pickles and Banks2021).

Figure 7 Long description
The image A showing a scatter plot with the label “a”. The horizontal axis label is “REE2O3 (wt.%)” with a range from 0.0 to 1.4. The vertical axis label is “SiO2 (wt.%)” with a range from 0.0 to 1.4. A diagonal straight line runs upward from near the origin toward the upper right. Text on the plot reads “R2 = 0.87”. Circular data markers are plotted along and near the diagonal line, including points near (0.0, 0.0), around (0.2, 0.2), around (0.4, 0.3), around (0.6, 0.5), around (0.8, 0.9), around (1.0, 1.1) and around (1.3, 1.3). A legend entry reads “Apatite (this work)”. The image B showing a line graph with the label “b”. The vertical axis label is “Apatite chondrite” with a range from 1 to 100000. The horizontal axis shows category labels in order: “La”, “Ce”, “Pr”, “Nd”, “Pm”, “Sm”, “Eu”, “Gd”, “Tb”, “Dy”, “Ho”, “Er”, “Tm”, “Yb”, “Lu”. Multiple lines with circular markers run from left to right, generally decreasing across the categories. A legend title reads “Supergene apatite” with legend entries: “Kovdor”, “Sokli”, “Glenover”, “Bukusu”, “Catalao I”. Text on the plot reads “Magmatic apatite”.
The small size of most apatite crystals poses a challenge for LA-ICP-MS analysis, as the laser beam diameter (typically ∼30 µm) often exceeds the crystal dimensions, leading to contamination from adjacent phases. However, a few analyses of larger apatite crystals (40–50 µm) show irregular but strongly enriched LREE distribution patterns [(La/Yb)Cn: 165–979; Supplementary Material 2, Table S4; Fig. 7b], with a broad range of both negative and positive Ce anomalies (Ce/Ce*: 0.5–1.62) and Y/Ho ratios (16–86), compared to the limited range observed in primary igneous apatite within carbonatites (Ce/Ce*: 0.6–0.9; Y/Ho: 20–29; Chakhmouradian et al., Reference Chakhmouradian, Reguir, Zaitsev, Couëslan, Xu, Kynický, Mumin and Yang2017). Additionally, the apatite is also characterized by low Na (up to 890 ppm), Sr (174–2448 ppm), Mn (up to 244 ppm), U (up to 74 ppm), Th (59–403 ppm) and high V (19–390 ppm) contents compared to primary igneous apatite reported from global carbonatite occurrences (Supplementary Material 2 and 3, Table S4, Fig. S2, respectively).
Allanite-(La) and allanite-(Ce)
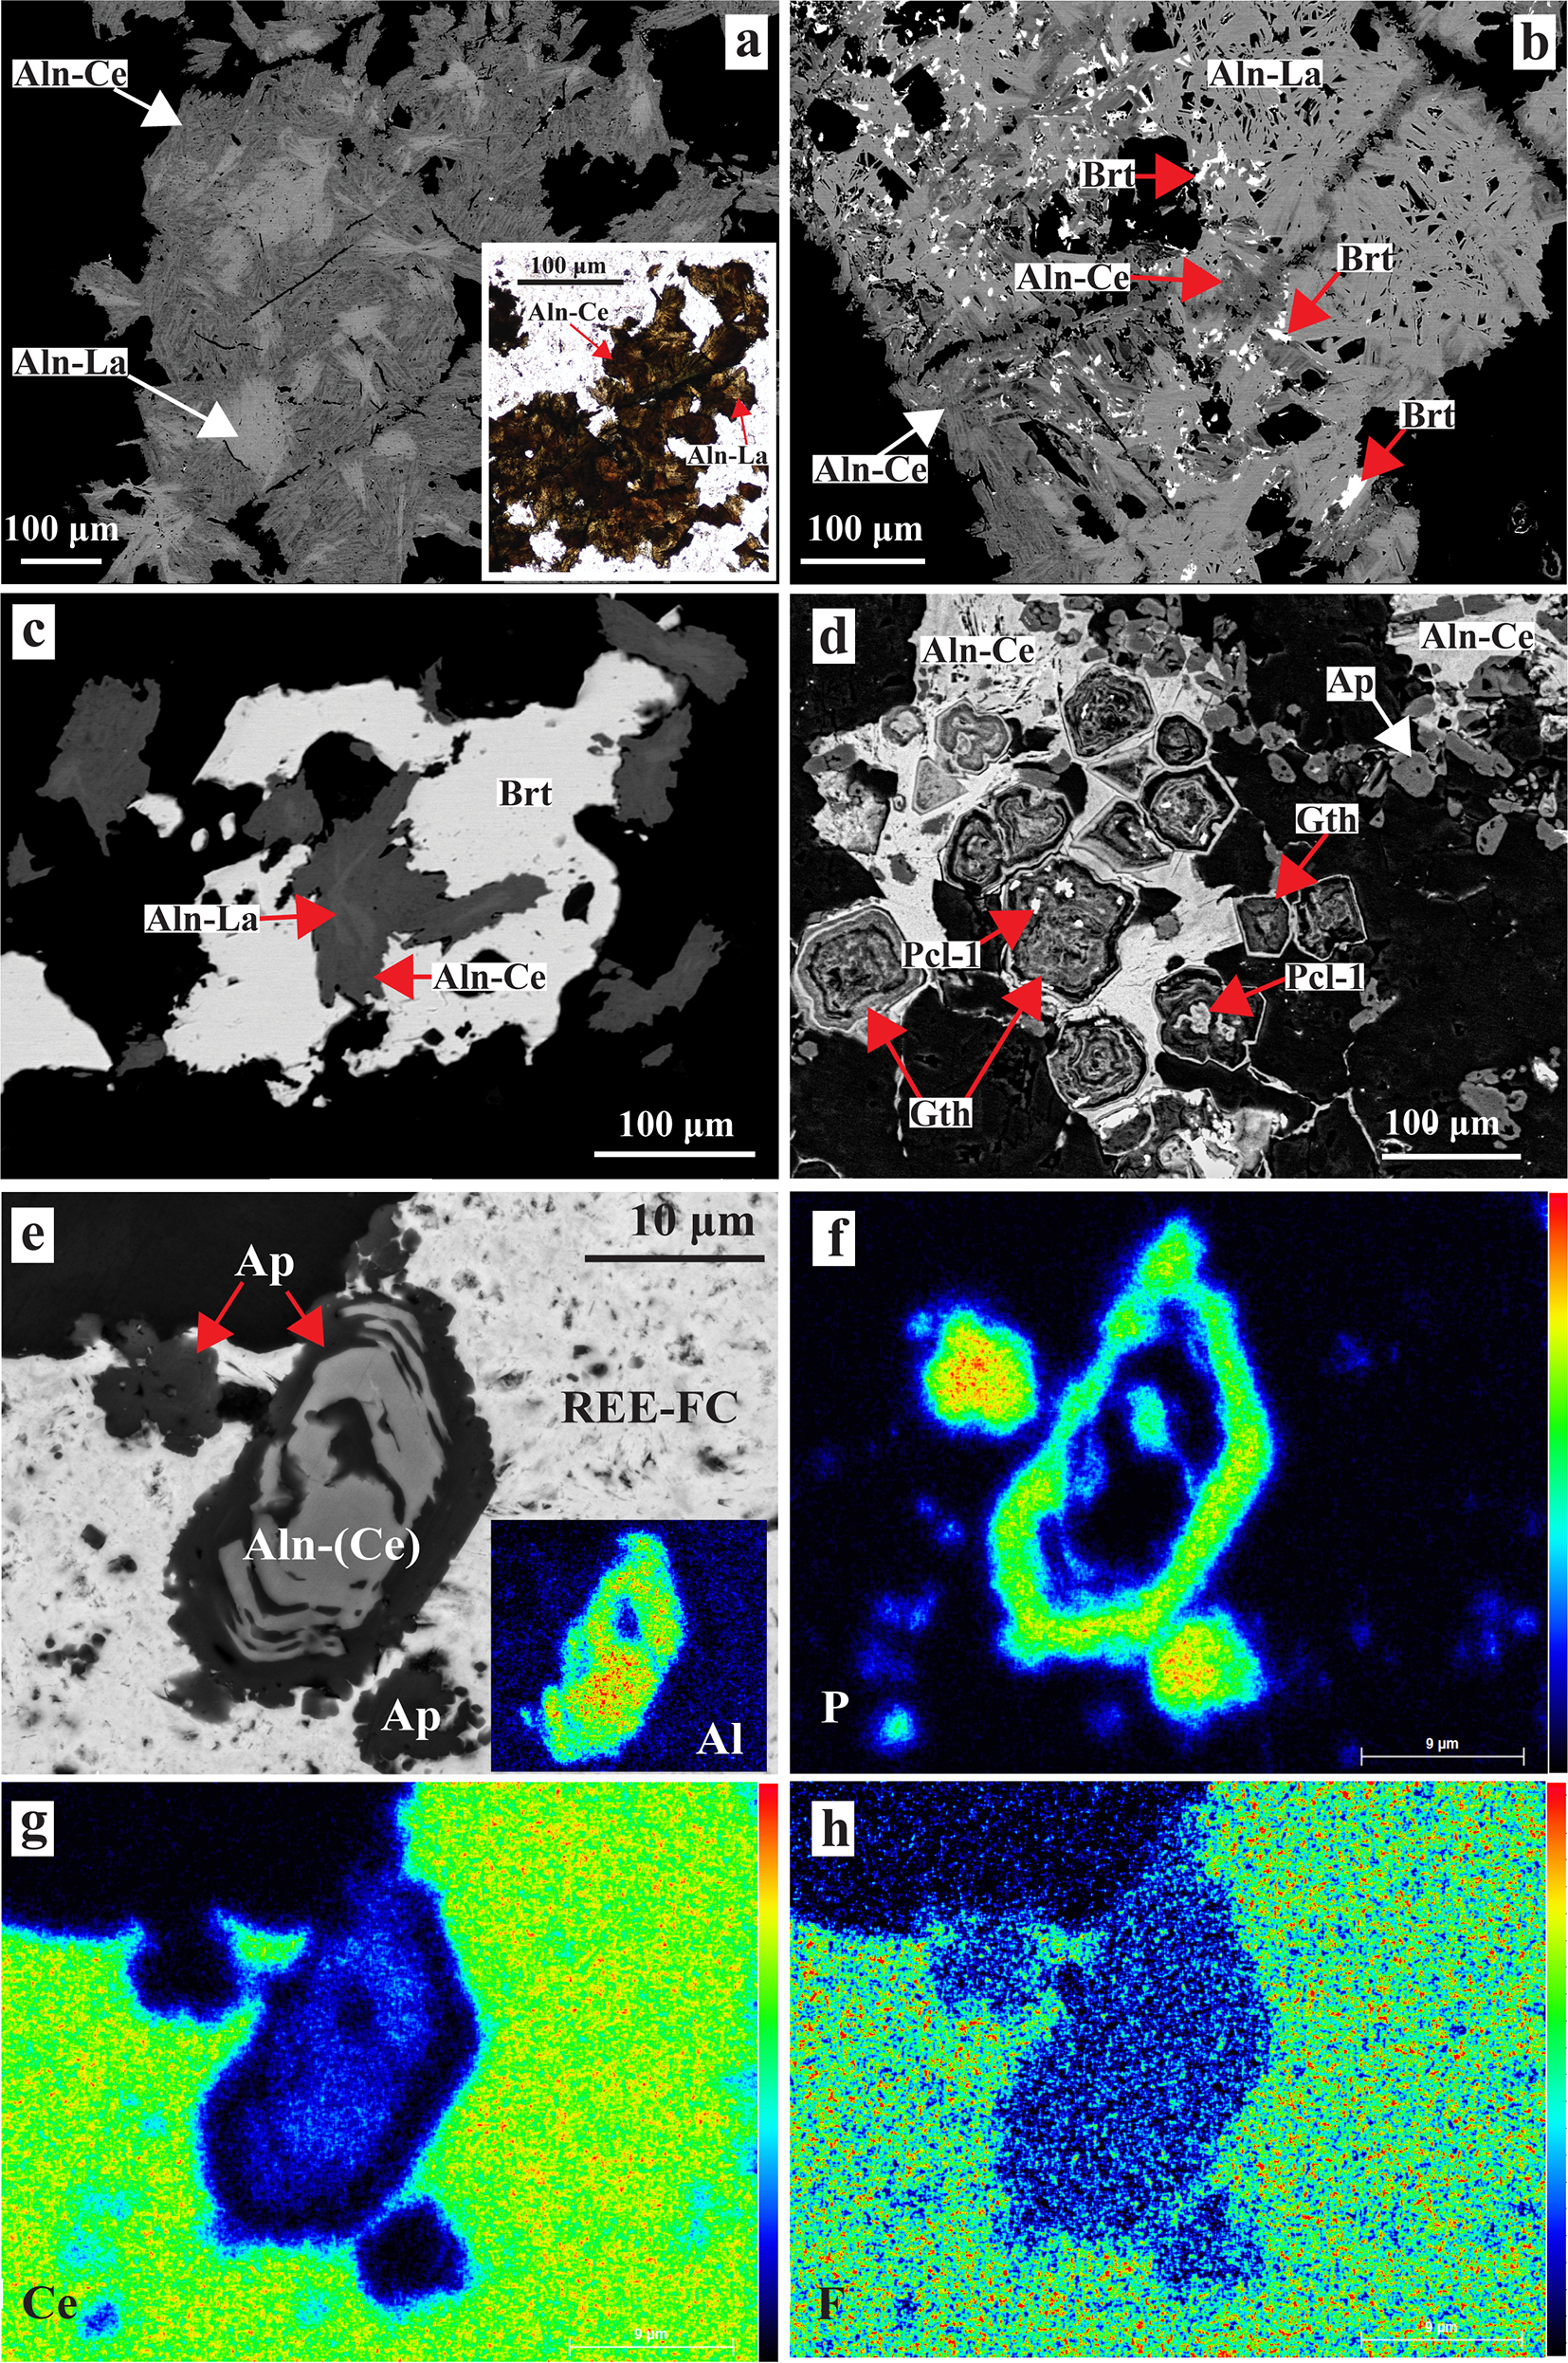
Allanite is the principal REE-bearing mineral in the Khaderpet carbonatite, occurring predominantly as disseminated acicular aggregates at the country-rock xenolith–carbonatite contact and within carbonatite (Figs 2f, 8a–c). Allanite forms paragenetically late, occurring as overgrowths on apatite and Fe-(hydr)oxides, and pseudomorphs precursor apatite (Figs 6c and 8d–h). Allanite shows distinct patchy BSE zonation, with high-AZ cores surrounded by low-AZ rims (Fig. 8a). The low-AZ domains not only form rims but also extend into the crystal interior as linear zones, where they are commonly intergrown with baryte (Fig. 8b, c).
(a–e) Back-scattered electron (BSE) images (a–e) and X-ray maps (f–h) showing textural relationships among allanite-(Ce, La) (Aln-Ce, -La), baryte (Brt), pyrochlore (Pcl), goethite (Gth), and REE-fluorocarbonate (REE-FC). (a) Aln-Ce, -La forms needle-like aggregates characterised by bright cores and darker rims, corresponding to Aln-La and Aln-Ce compositions, respectively. (b–c) Dark Aln-Ce rims and linear zones commonly intergrow with baryte. (d) Colloform and box-work Gth contain relict Pcl inclusions enclosed within skeletal Aln-Ce. (e) Ap is pseudomorphically replaced by Aln-Ce and accompanied by late-stage REE-FC. The REE-FC displays elevated Ce and F concentrations relative to Aln-Ce and Ap (f–h).

Figure 8 Long description
The image A showing a grayscale micrograph with multiple arrows and labels including “Aln-Ce” and “Aln-La”. A scale bar reads “100 µm”. A small inset at the lower right contains a brown-and-white micrograph with labels including “Aln-Ce” and “Aln-La” and a scale bar reading “100 µm”. The image B showing a grayscale micrograph with several red arrows pointing to features labeled “Brt”. Labels “Aln-Ce” and “Aln-La” are also present. A scale bar reads “100 µm”. The image C showing a high-contrast black-and-white micrograph with labels “Brt”, “Aln-La” and “Aln-Ce”. A red arrow points near the “Aln-Ce” label. A scale bar reads “100 µm”. The image D showing a grayscale micrograph with multiple labeled features including “Aln-Ce”, “Ap”, “Gth” and “Pcl”. Several red arrows point to different areas. A scale bar reads “100 µm”. The image E showing a grayscale micrograph with labels “Ap”, “Aln-(Ce)” and “REE-FC”. Two red arrows point toward the area labeled “Ap”. A scale bar reads “10 µm”. The image F showing a false-color map on a dark background with a vertical color scale bar at the right. Labels “P” and “µm” are present near the bottom. The map contains a ring-shaped region in green to yellow with red areas, surrounded by blue. The image G showing a false-color map with labels “Ce” and “µm”. The background is predominantly green to yellow, with a central dark blue region and a smaller dark blue region below it. The image H showing a false-color map with a predominantly blue central region and a surrounding field of green to yellow speckling. A “µm” label is present near the bottom.
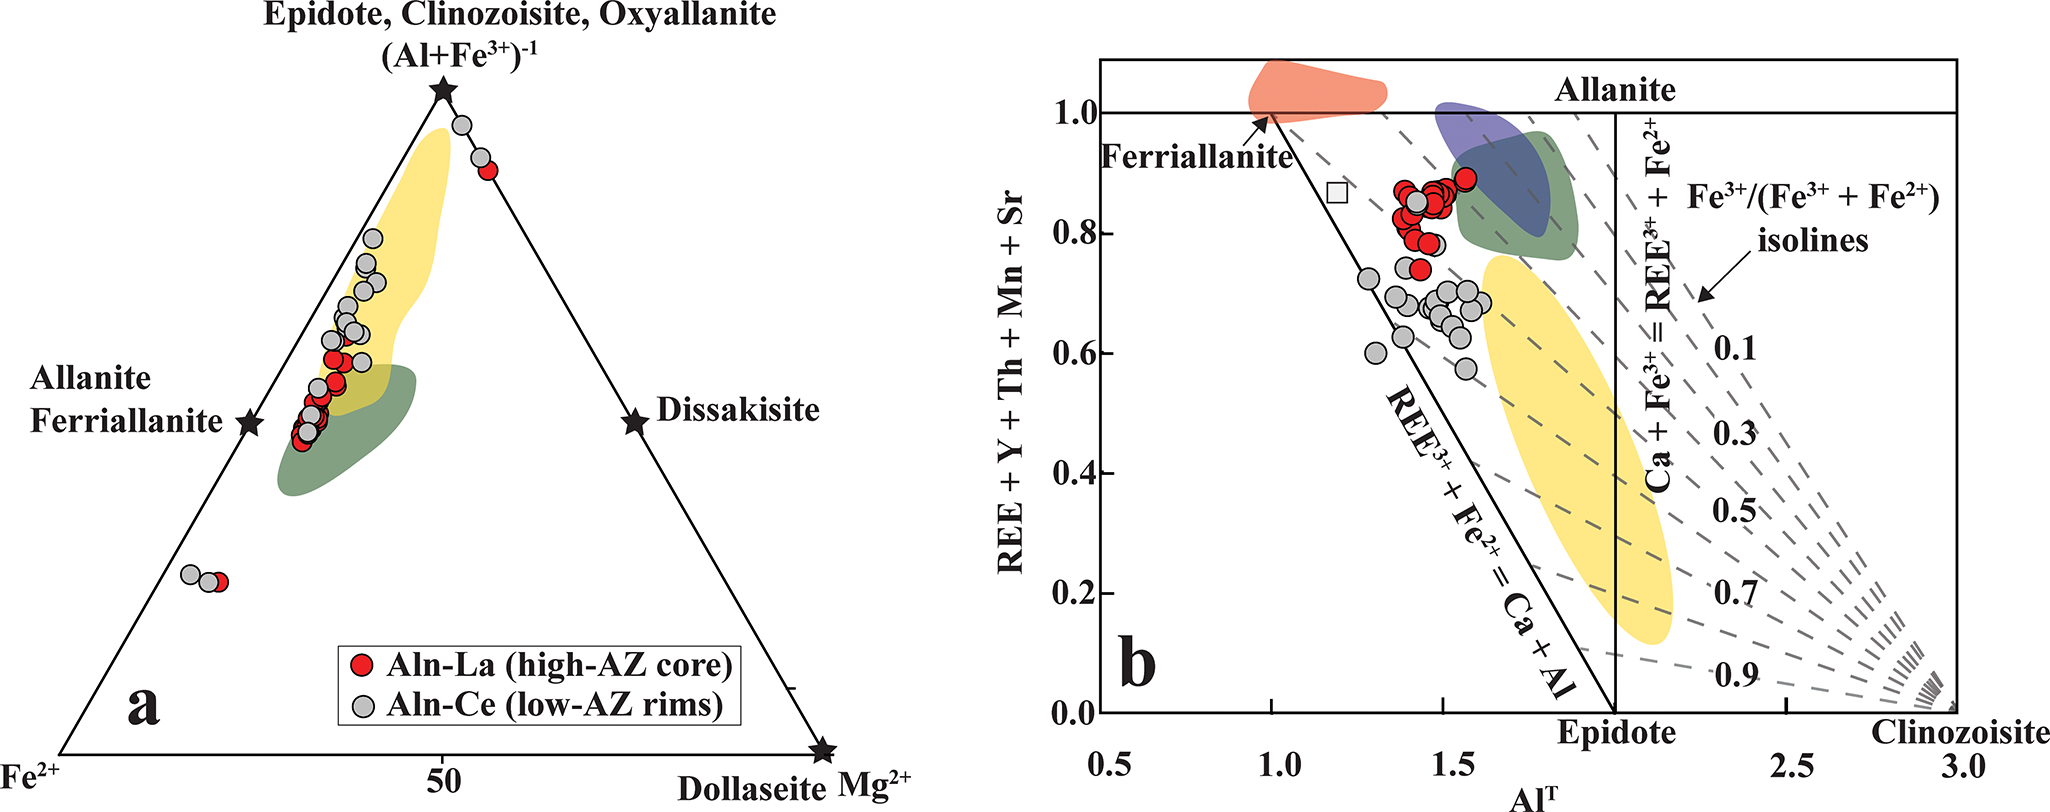
Allanite compositions fall between the allanite-ferriallanite and the epidote-clinozoisite-oxyallanite series (Fig. 9a; Table 3; Supplementary Material 2, Table S5). The high-AZ cores are La-dominant and correspond predominantly to allanite-(La), characterized by Fe3+/Fetotal <0.5 (Fig. 9b). In contrast, all low-AZ rims are Ce-dominant and classify as ferriallanite-(Ce) (Fig. 9b). The high-AZ cores are REE-enriched relative to the low-AZ rims (21.7–24.0 wt.% and 17.6–19.3 wt.% REE2O3, respectively; Table 3) and follow the epidote–allanite (REE3+ + Fe2+ = Ca + Fe3+) and clinozoisite–allanite (REE3+ + Fe2+ = Ca + Al) substitution mechanisms (Fig. 9b).
(a) Compositional variations of epidote-group minerals plotted in the Fe2+–Mg2+–(Al + Fe3+) ternary diagram (after Gieré and Sorensen, Reference Gieré and Sorensen2004) illustrate a range extending from allanite–ferriallanite compositions toward the epidote–clinozoisite–oxyallanite fields. (b) Bivariate plot of REE + Y + Th + Mn + Sr versus total Al (Alᵀ, apfu) (modified from Petrik, Reference Petrik1995) showing pronounced REE enrichment in the epidote-group minerals. The shaded fields represent compositional ranges of epidote-group phases from carbonatite (green) and clinopyroxenite (yellow) lithologies of the Hogenakkal carbonatite complex (Bhattacharjee et al., Reference Bhattacharjee, Chakrabarty, Mitchell, Patel, Kozlov, Fomina, Dey and Pal2024), and from the Pakkanadu (violet) (Mahapatro et al., Reference Mahapatro, Meshram and Korakappa2023) and Gundlupete (Brahma et al., Reference Brahma, Sahoo and Rajesh Durai2022) carbonatites.

Figure 9 Long description
The image A showing a ternary scatter diagram illustrating compositional variations of epidote-group minerals. The vertices are labeled Fe, Dollaseite Mg and Al plus Fe. The ternary proportions represent atomic fractions, summing to 100 percent. The legend identifies two point types: Aln-La (high-AZ core) and Aln-Ce (low-AZ rims). Red-filled circles represent high-AZ cores, trending toward allanite and ferriallanite fields, while gray-filled circles represent low-AZ rims, trending toward epidote and clinozoisite fields. Shaded regions indicate compositional fields, with points concentrated in the allanite-ferriallanite area. The image B showing a bivariate scatter plot with the x-axis labeled Al and the y-axis labeled REE plus Y plus Th plus Mn plus Sr, units not indicated. The plot includes dashed isolines labeled Fe subscript 3 plus over (Fe subscript 2 plus plus Fe subscript 3 plus), indicating varying Fe subscript 3 plus fractions. Red-filled circles cluster around Al 1.2 to 1.6 with high REE sums, while gray-filled circles cluster around Al 1.4 to 1.8. Shaded fields represent transitions toward epidote-clinozoisite at higher Al and lower REE sums. Both datasets show pronounced REE enrichment, with high-AZ cores being more REE-rich compared to low-AZ rims. The shaded band indicates a compositional transition and the isolines show changes in Fe subscript 3 plus fraction across the field.
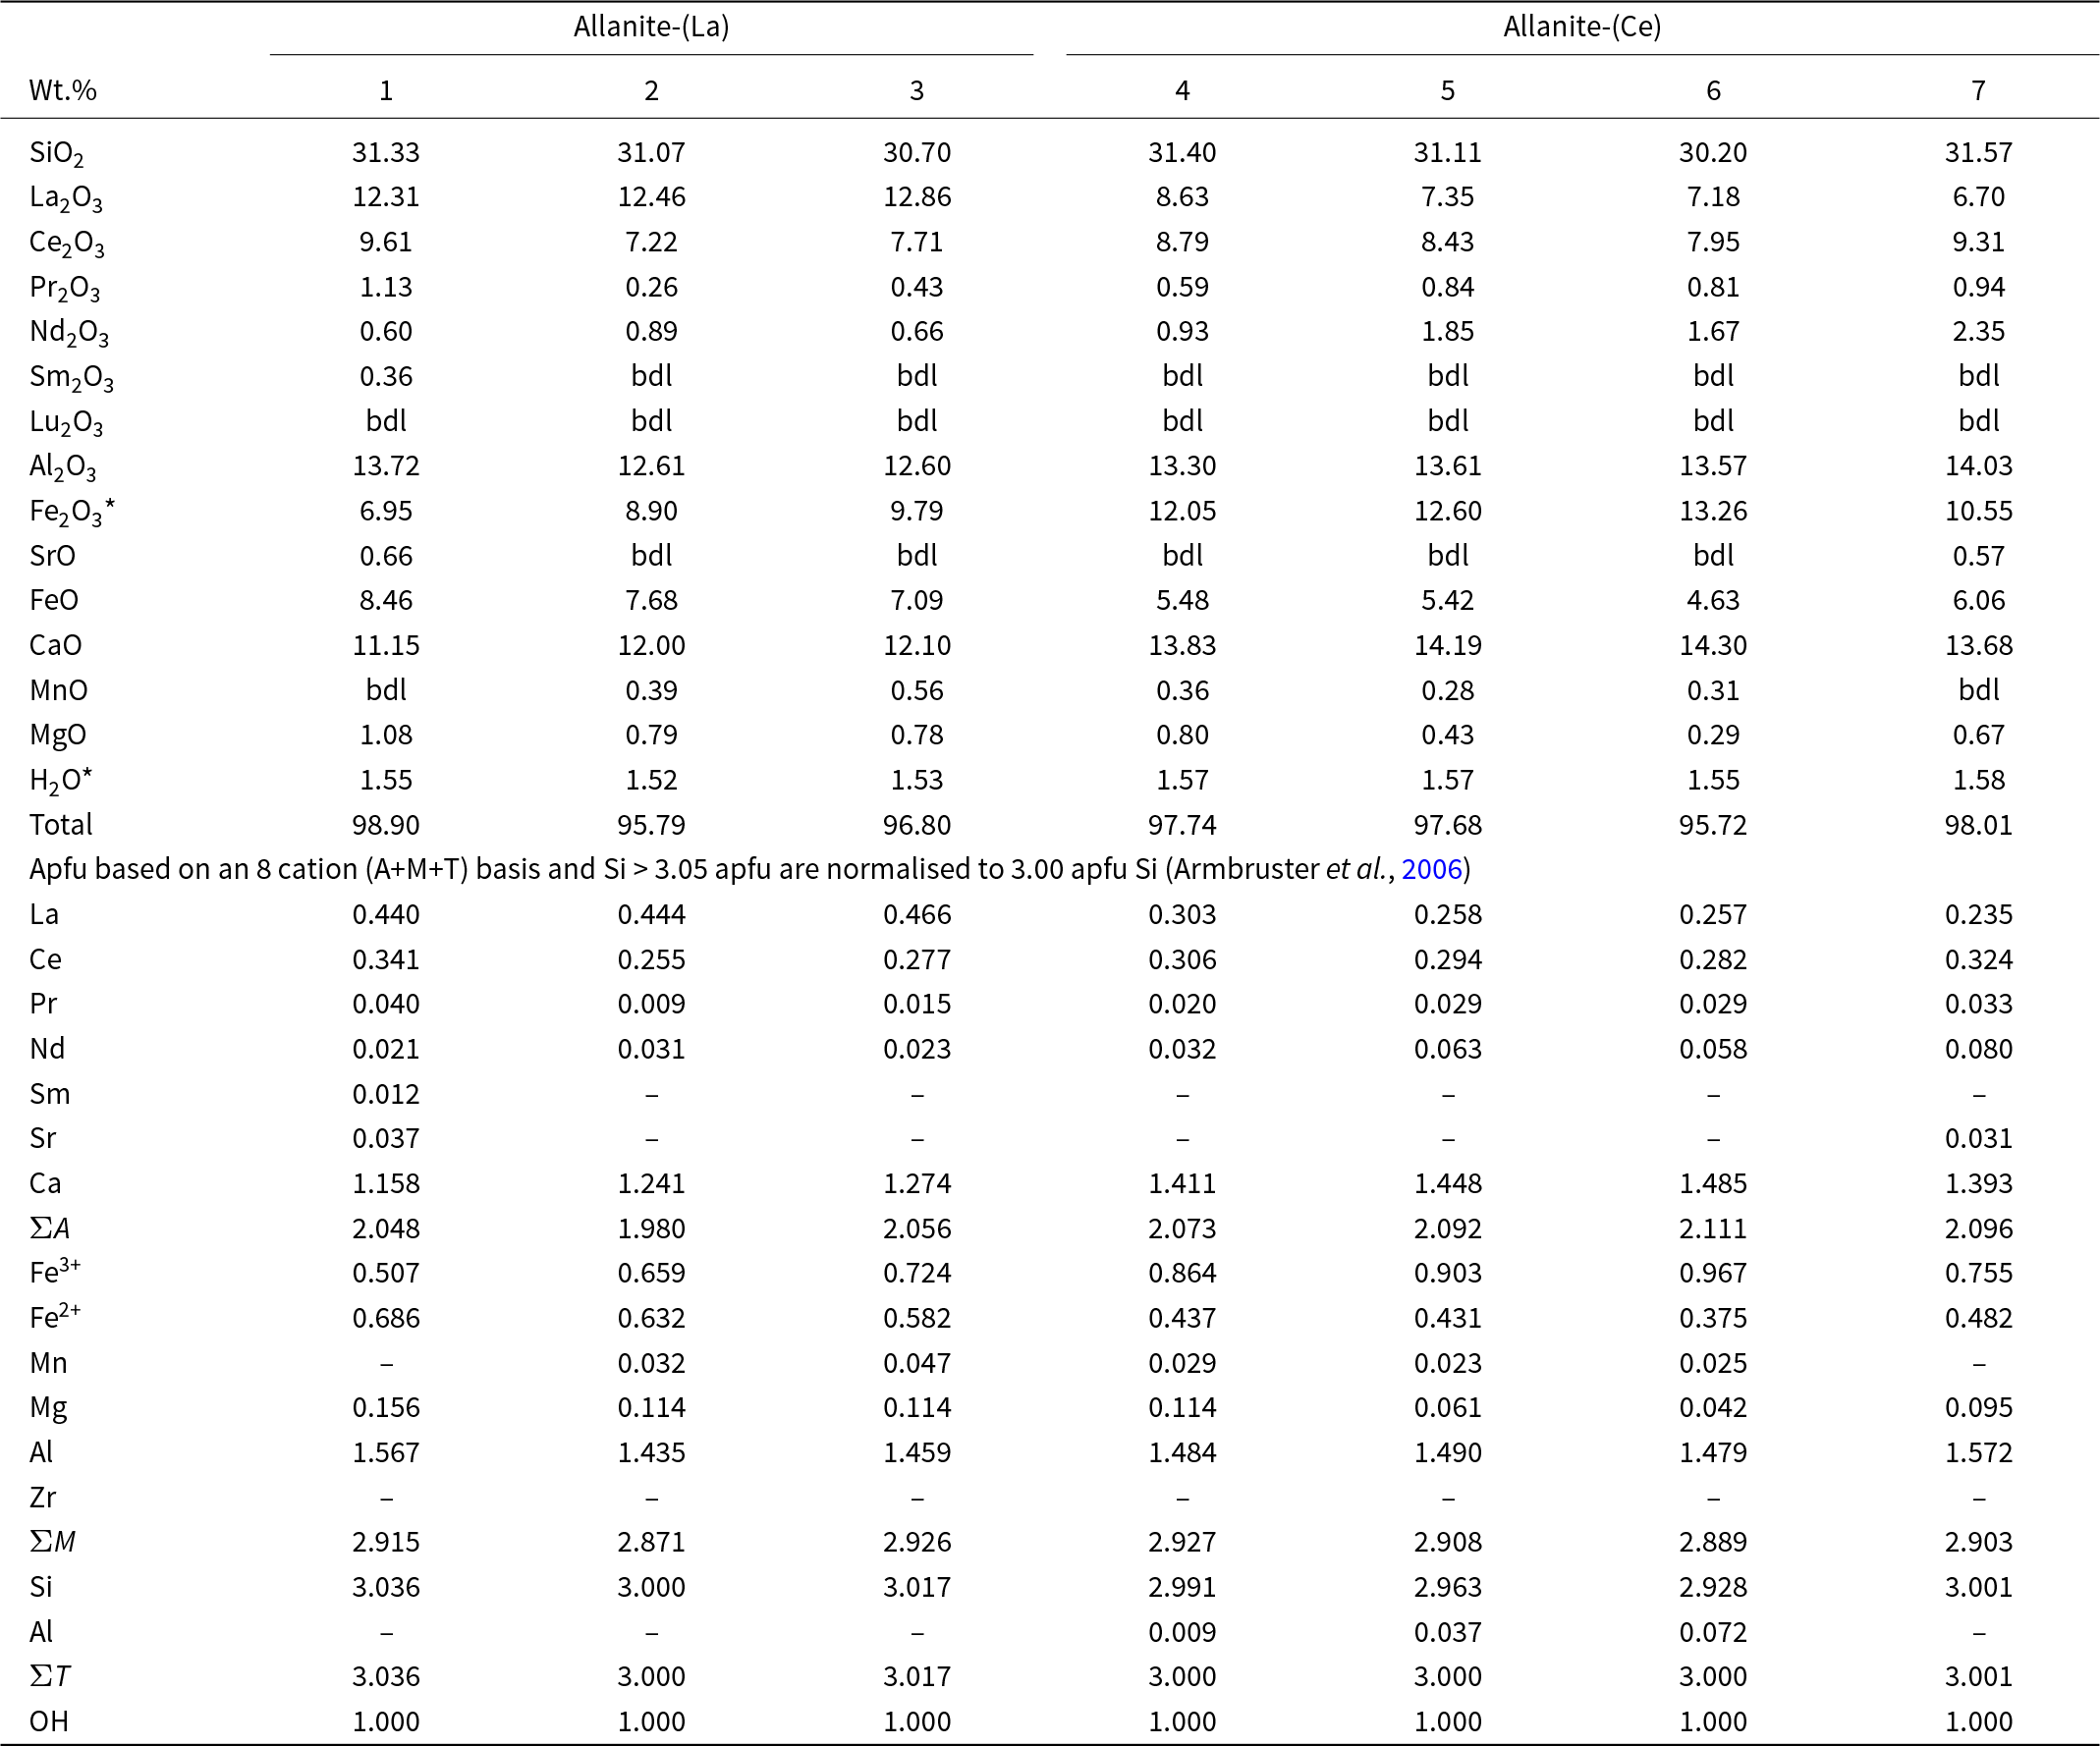
Representative compositions of allanite-(La, Ce)

Table 3 Long description
Seven electron-microprobe analyses report oxide weight percent compositions and calculated atoms per formula unit for allanite, grouped as three allanite-(La) samples and four allanite-(Ce) samples. SiO2 is consistent across all samples at about 30.20 to 31.57 wt percent, and Al2O3 ranges from about 12.60 to 14.03 wt percent. The allanite-(La) group has higher La2O3, about 12.31 to 12.86 wt percent, while the allanite-(Ce) group has lower La2O3, about 6.70 to 8.63 wt percent, with Ce2O3 broadly similar across the table at about 7.22 to 9.61 wt percent. CaO is higher in allanite-(Ce), about 13.68 to 14.30 wt percent, compared with about 11.15 to 12.10 wt percent in allanite-(La). Iron shows a shift toward more ferric iron in allanite-(Ce), with recalculated Fe2O3 star about 10.55 to 13.26 wt percent and FeO about 4.63 to 6.06 wt percent, versus Fe2O3 star about 6.95 to 9.79 wt percent and FeO about 7.09 to 8.46 wt percent in allanite-(La). Rare earth oxides beyond La and Ce are minor; Sm2O3 is only detected in sample 1, and Lu2O3 is below detection in all samples. Totals range from about 95.72 to 98.90 wt percent, and several entries are below detection limits. The formula-unit calculations indicate La is higher in allanite-(La) and Ca and ferric iron are higher in allanite-(Ce), but note that ferric iron and water values are recalculated from stoichiometry rather than directly measured.
Notes: bdl: below detection limits; Fe2O3* and H2O* are re-calculated based on stoichiometry
Pyrochlore
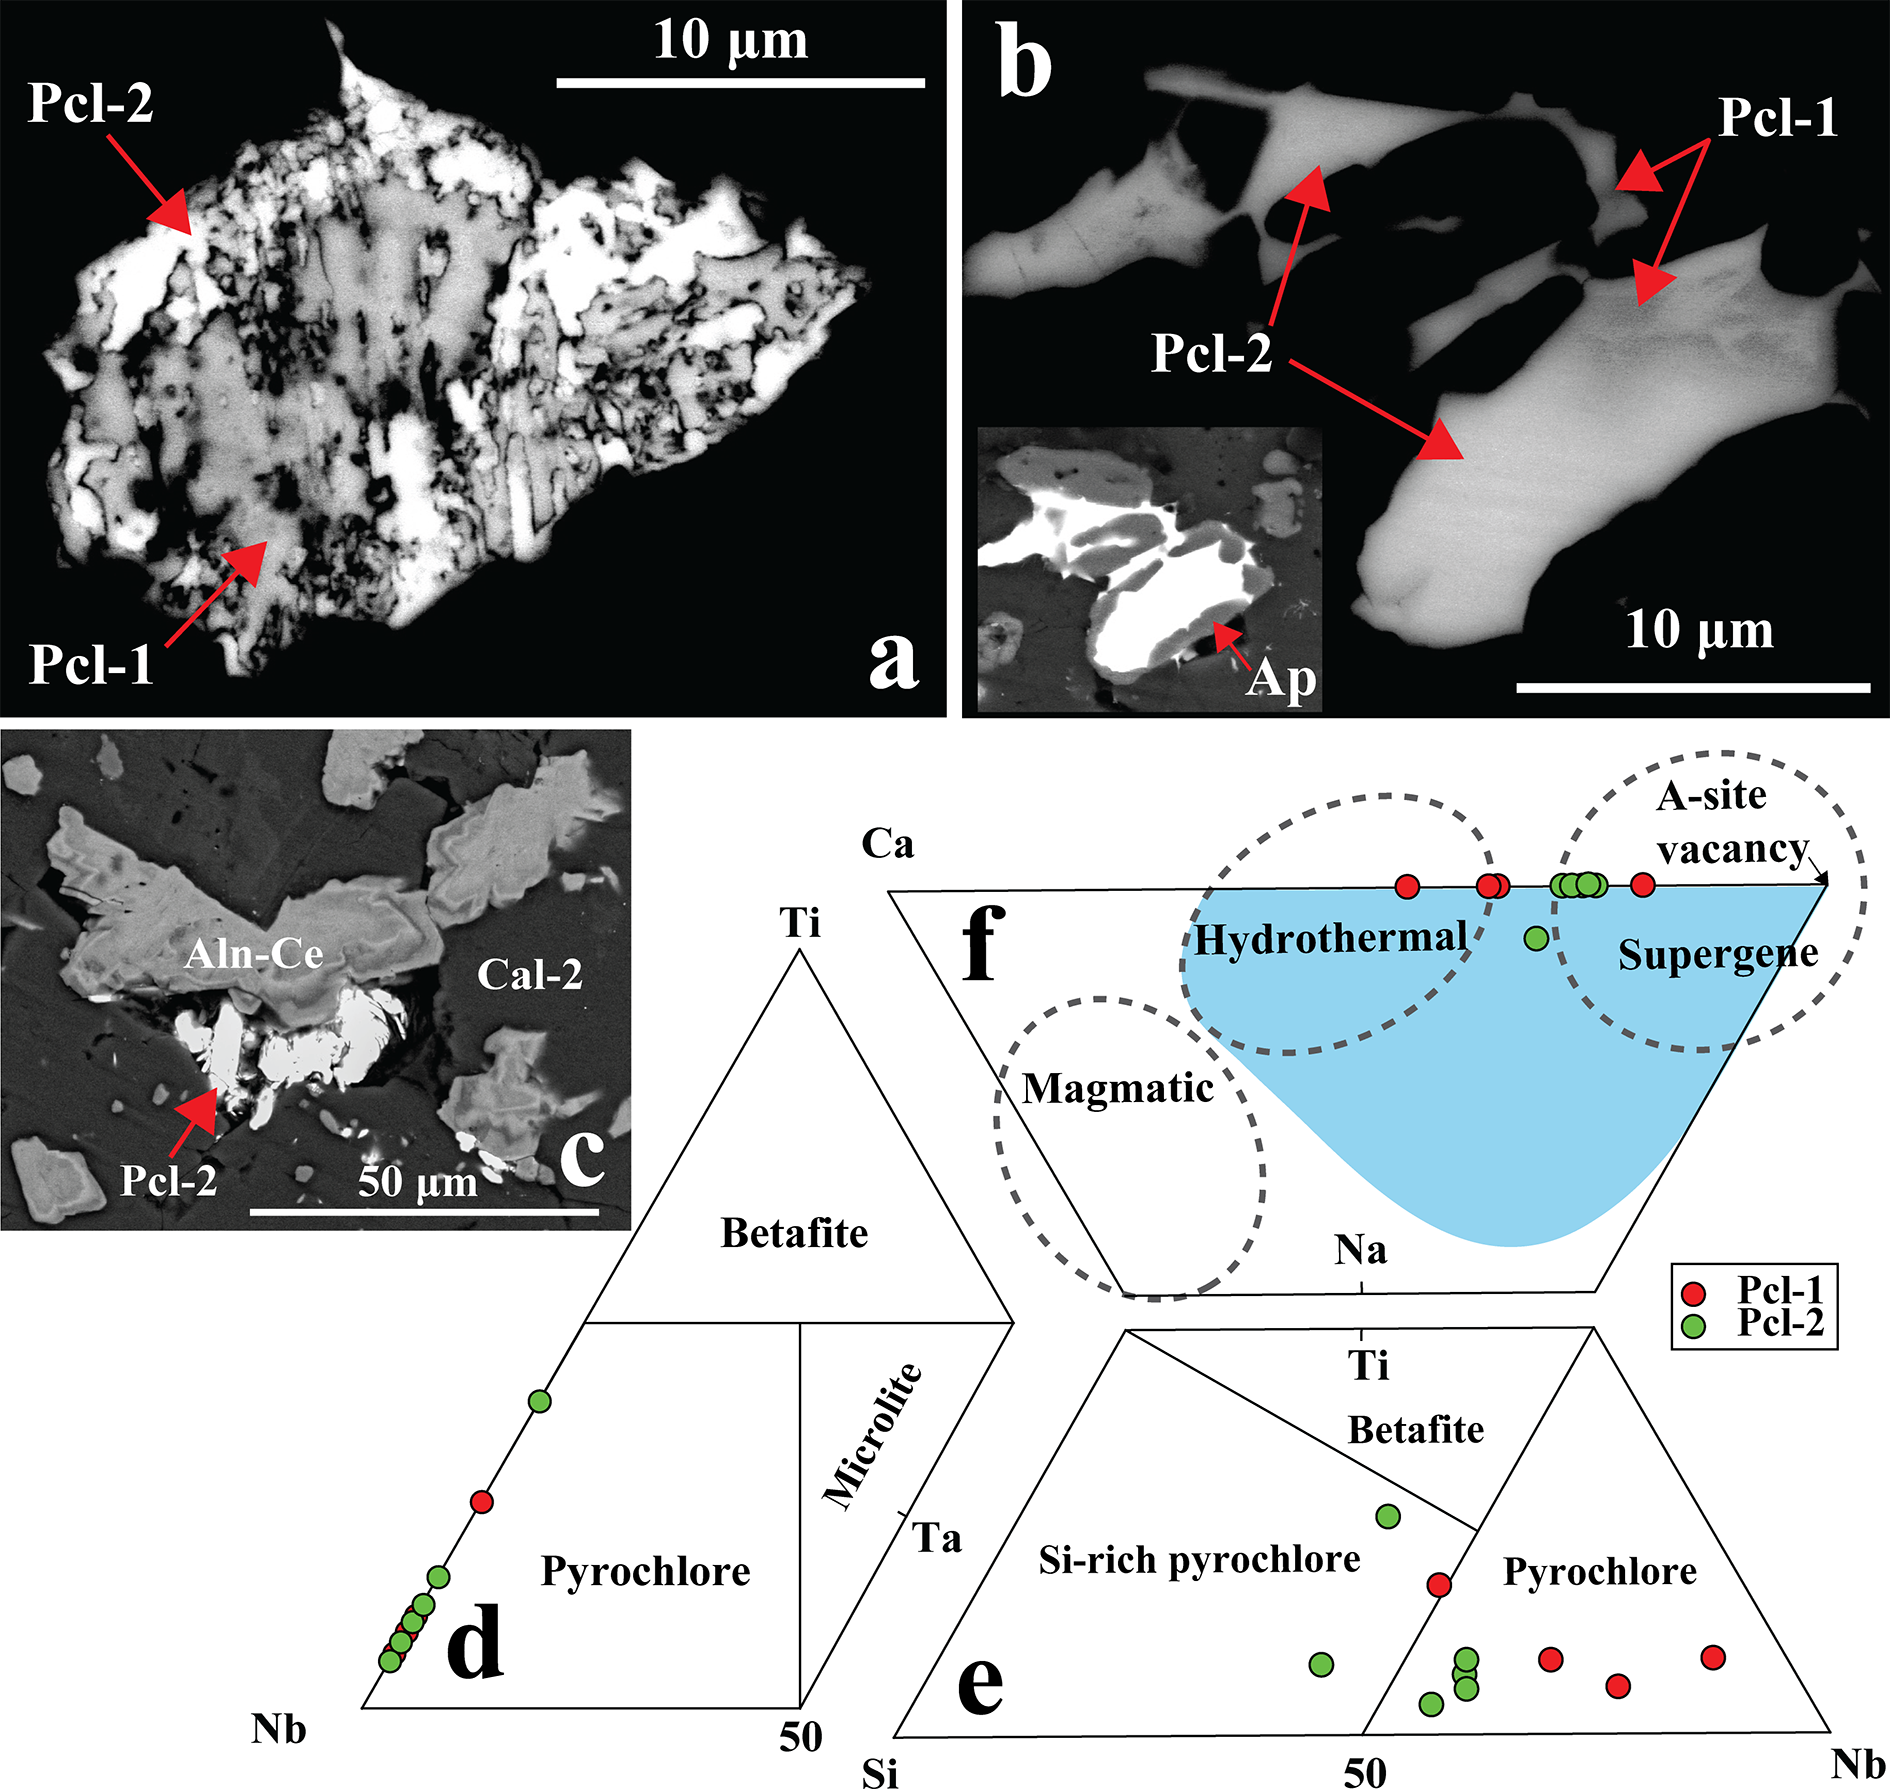
Pyrochlore is a trace mineral (<1 vol.%) in the Khaderpet carbonatite. On the basis of its texture and composition it is classified as Pcl-1 and Pcl-2 (Figs 10a, b). Pcl-1 occurs as relict crystals pseudomorphed by box-work goethite structures (Fig. 8d). In contrast, Pcl-2 occurs late in the paragenetic sequence forming high-AZ crystals that either replace the low-AZ Pcl-1 or form later infillings within apatite or vugs, and their growth is restricted to the grain margins of allanite-(Ce) (Fig. 10a–c). Both Pcl-1 and Pcl-2 have Nb dominant at the B-site of pyrochlore-group minerals (Fig. 10d; Table 4) (Atencio et al., Reference Atencio, Andrade, Christy, Gieré and Kartashov2010). However, a few of the pyrochlore crystals show Si4+ as the dominant cation of the dominant valence at the B-site (Fig. 10e; Table 4, compositions 4, 8, 9). The incorporation of Si at the B-site in pyrochlore is debated (Dumańska-Słowik et al., Reference Dumańska-Słowik, Pieczka, Tempesta, Olejniczak and Heflik2014; Mitchell, Reference Mitchell2015). However, the present calculations are consistent with previous studies on Si-rich pyrochlores from the Sevattur carbonatites, India (Dey et al., Reference Dey, Mitchell, Bhattacharjee, Chakrabarty, Pal, Pal and Sen2021b) and the Narssârssuk nepheline syenites, Greenland (Bonazzi et al., Reference Bonazzi, Bindi, Zoppi, Capitani and Olmi2006) and show that exclusion of Si from B-site results in a non-stoichiometric pyrochlore formula.
(a, b) Back-scattered electron (BSE) images showing dark pyrochlore (Pcl-1) partially to completely replaced by bright Pcl-2. Patchy-zoned pyrochlore occurs as late infillings within apatite (Ap) (inset in b), where the darker zones (Pcl-1) gradually grade into brighter Pcl-2. (c) Bright Pcl-2 occurs in vugs adjacent to allanite-(Ce) (Aln-Ce) within a calcite-2 (Cal-2) matrix. (d–f) Compositional plots show that the pyrochlore compositions fall within the pyrochlore-group field in the Nb–Ta–Ti ternary diagram (Atencio et al., Reference Atencio, Andrade, Christy, Gieré and Kartashov2010). In the Si–Nb–Ti ternary plot, compositions range from typical pyrochlore to Si-rich varieties. In the Ca–Na–A-site vacancy diagram (after Nasraoui and Bilal, Reference Nasraoui and Bilal2000), Pcl-1 plots mainly within the hydrothermal field, whereas Pcl-2 trends toward the supergene field. The light blue field representing hydrothermal pyrochlore is from Bhattacharjee et al. (Reference Bhattacharjee, Dey, Chakrabarty, Mitchell and Ren2022).

Figure 10 Long description
The image A shows a back-scattered electron image with dark pyrochlore labeled Pcl-1 partially replaced by bright Pcl-2. The arrows indicate the transition from Pcl-1 to Pcl-2. The image B displays another BSE image where Pcl-1 is seen alongside Pcl-2, with arrows marking the areas of replacement. An inset shows patchy-zoned pyrochlore within apatite, labeled Ap, where darker zones of Pcl-1 grade into brighter Pcl-2. The image C illustrates bright Pcl-2 occurring in vugs adjacent to allanite-(Ce), labeled Aln-Ce, within a calcite-2 matrix, labeled Cal-2. The image D presents a compositional plot in a Nb–Ta–Ti ternary diagram, showing pyrochlore compositions within the pyrochlore-group field. The image E depicts a Si–Nb–Ti ternary plot, indicating compositions ranging from typical pyrochlore to Si-rich varieties. The image F features a Ca–Na–site vacancy diagram, where Pcl-1 plots mainly within the hydrothermal field, while Pcl-2 trends toward the supergene field. The light blue field represents hydrothermal pyrochlore. Red and green dots indicate the positions of Pcl-1 and Pcl-2 in the diagrams.
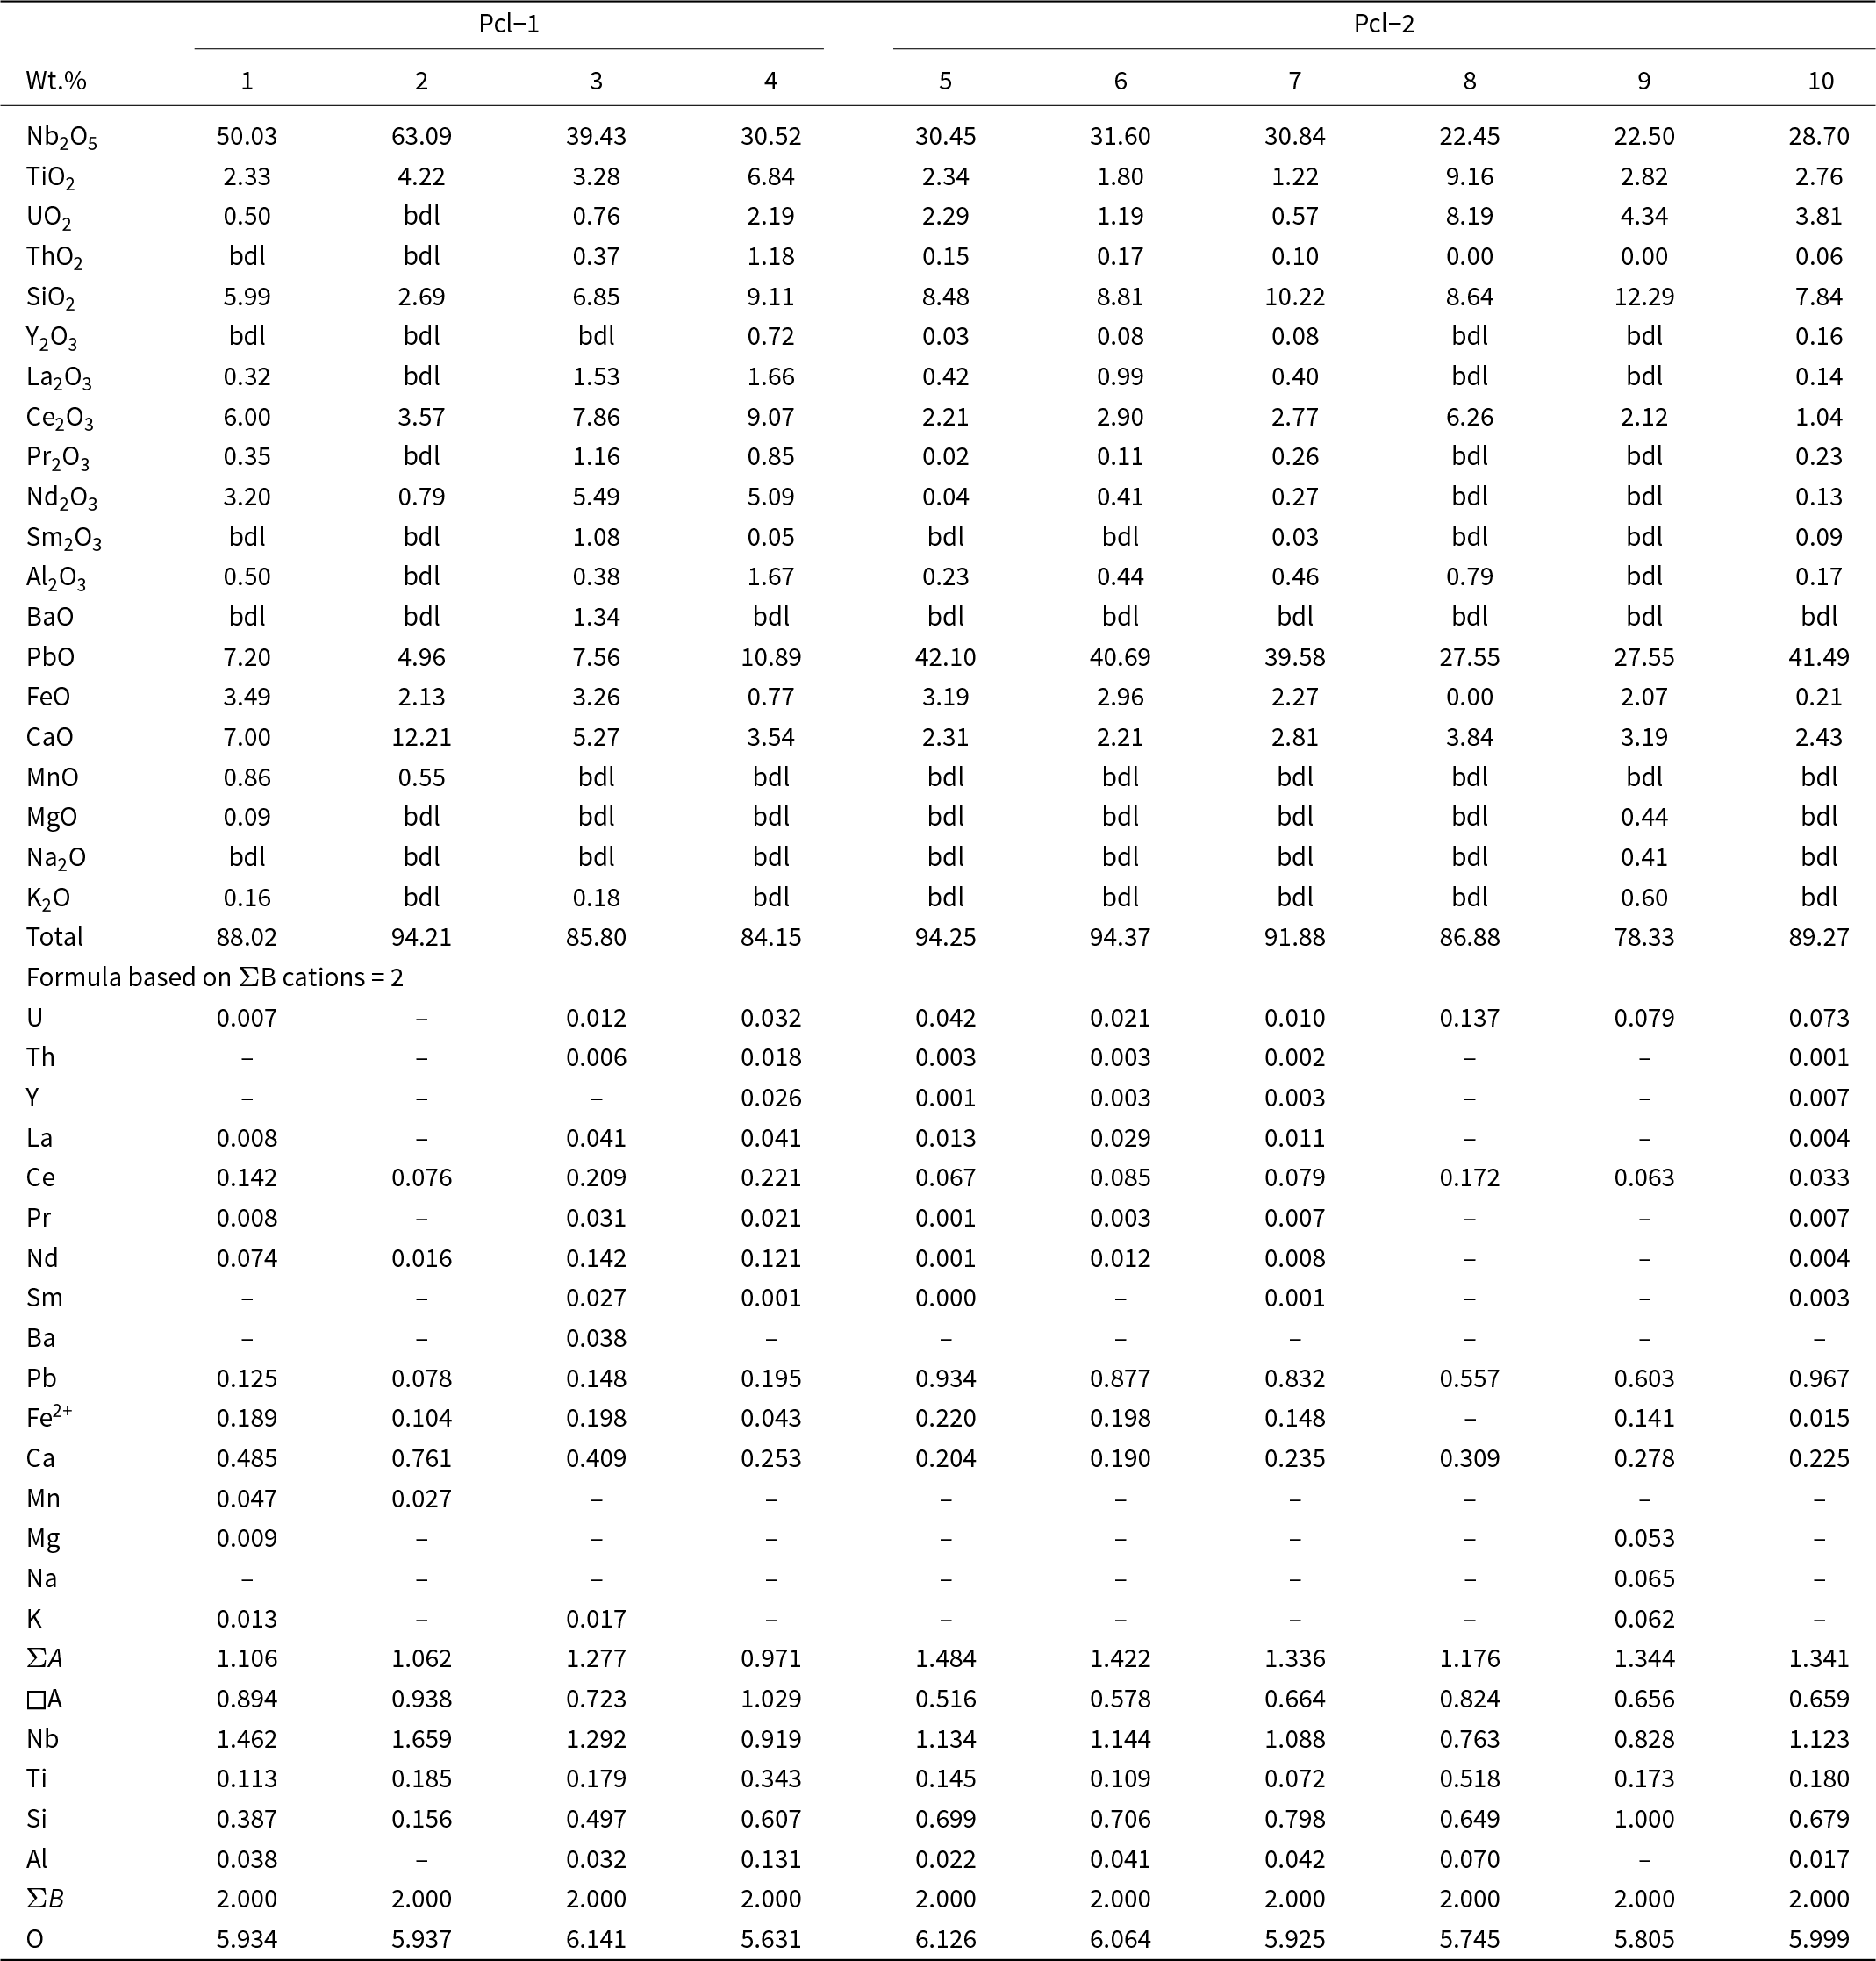
Representative composition of pyrochlore-group minerals

Table 4 Long description
The table reports oxide weight percent compositions and calculated cation proportions for 10 pyrochlore-group mineral analyses, grouped as Pcl-1 (analyses 1 to 4) and Pcl-2 (analyses 5 to 10). Niobium oxide is the dominant oxide in every analysis, ranging from about 22.45 wt percent (analysis 8) to about 63.09 wt percent (analysis 2). Lead oxide shows the largest spread, from about 4.96 wt percent (analysis 2) up to about 42.10 wt percent (analysis 5), and remains high in analyses 5 to 7 and 10 (roughly 39.6 to 41.5 wt percent). Titanium oxide varies from about 1.22 to 9.16 wt percent, peaking in analysis 8, which also has the highest uranium oxide at about 8.19 wt percent. Silicon oxide is moderate across the set (about 2.69 to 12.29 wt percent), with the maximum in analysis 9. Rare-earth oxides are generally low to moderate; cerium oxide is the most prominent among them (about 1.04 to 9.07 wt percent), while several other rare-earth entries are frequently reported as below detection. Totals range from about 78.33 to 94.37 wt percent, so comparisons should note that some components may be unmeasured or below detection, and the calculated cation proportions are normalized to a fixed basis for the B-site cations.
Notes: bdl: below detection limits
All of the Pcl-1 crystals have Ca as the dominant A-site cation, and are zero-valent-dominant pyrochlore, corresponding to kenocalciopyrochlore [(Ca◻)Nb2O6(◻); Table 4, compositions 1–3] or Ca-rich kenopyrochlore [(◻Ca)Nb2O6(◻); Table 4, composition 4] compositions, respectively (Bhattacharjee et al., Reference Bhattacharjee, Dey, Chakrabarty, Mitchell and Ren2022). In contrast, all Pcl-2 have Pb as the dominant cation at the A-site. Additionally, the absence of F– or OH– at the Y-site results in kenoplumbopyrochlore compositions, with an end-member formula of (◻Pb)Nb2O6(◻) (Table 4, compositions 5–10). Pcl-1 contains more ΣREE (4.4–17.1 wt.% REE2O3) and Ba (up to 1.3 wt.% BaO) than Pcl-2 (Table 4). In contrast, Pcl-2 is characterized by higher Pb (10.9–42.1 wt.% PbO), Si (8.5–12.3 wt.% SiO2), U (0.6–8.2 wt.% UO2) and Ti (1.2–9.2 wt.% TiO2) contents compared to Pcl-1 (5.0–7.6 wt.% PbO; 2.7–6.8 wt.% SiO2; 2.3–4.2 wt.% TiO2; up to 2.2 wt.% UO2). There is a relative increase in A-site vacancy from Pcl-1 to Pcl-2, coupled with decreasing Ca and increasing Pb contents in Pcl-2 (Fig. 10f). Pyrochlore inclusions within fluorite could not be analysed due to their small (<5 µm) size (Supplementary Material 3, Fig. S3).
Baryte
Baryte is a late phase intergrown with low-AZ allanite-(Ce), calcite-3, REE-fluorocarbonate and an unknown REE-Nb-Pb-Si phase (Figs 3i, 6e and 8b–c; Supplementary Material 3, Fig. S4). Baryte approaches the ideal end-member composition (BaSO4) with variable Sr (0.1–3.1 wt.% SrO; Supplementary Material 2, Table S6) content.
REE-fluorocarbonates
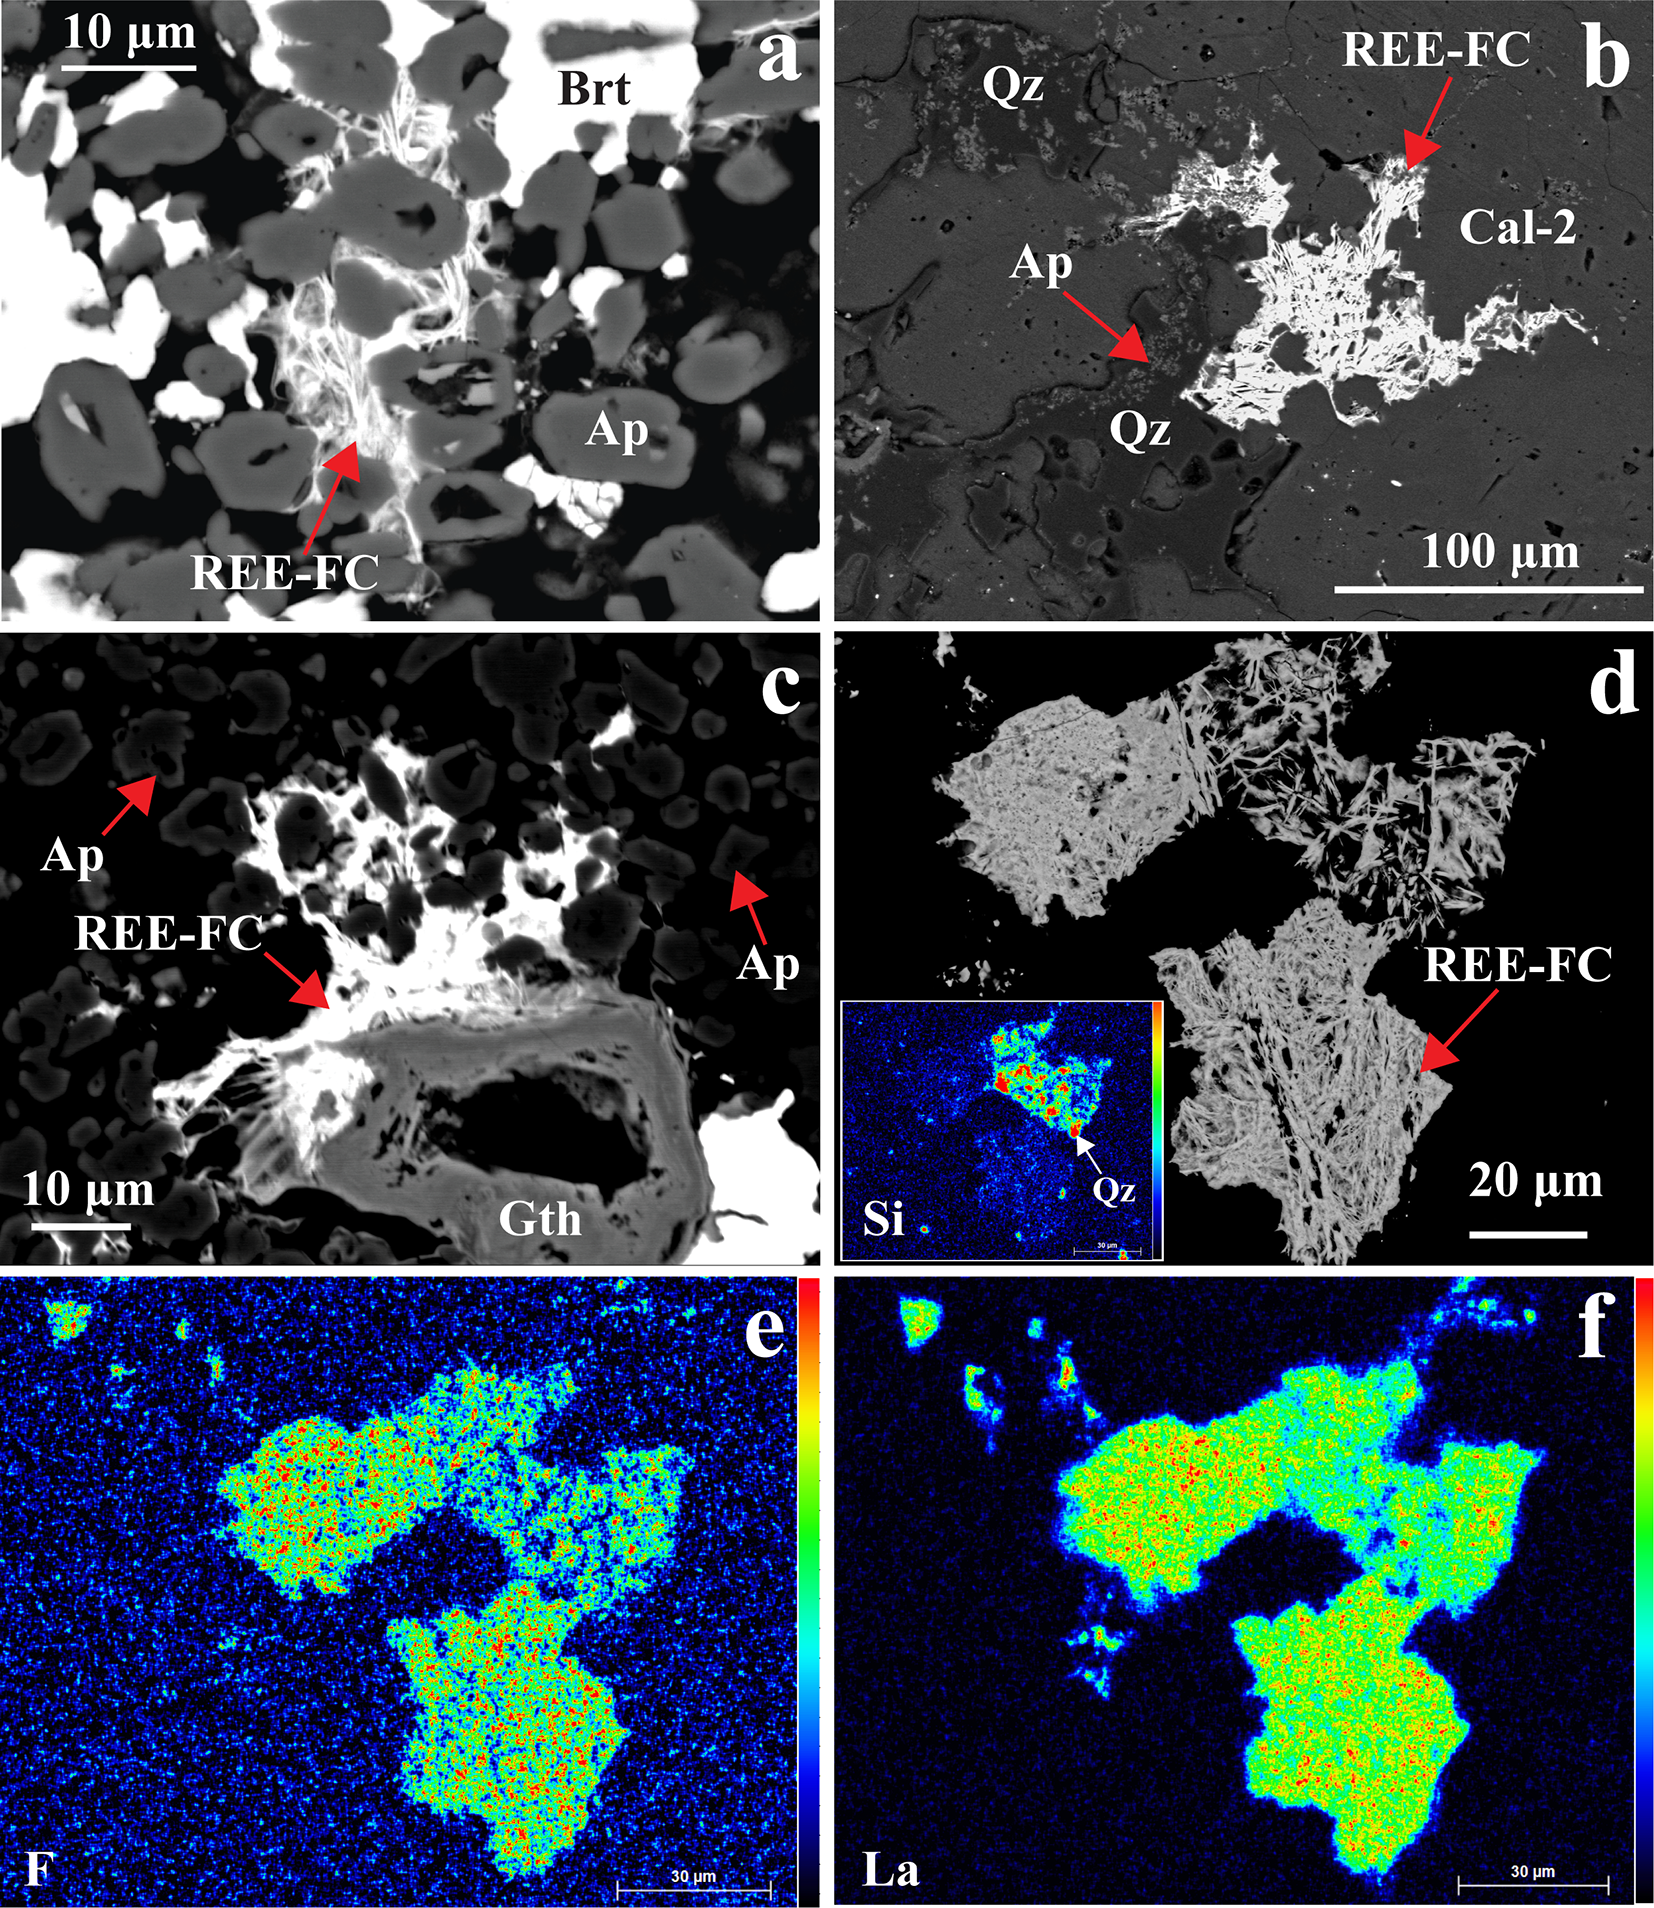
REE-fluorocarbonates are typically the latest minerals to form in the paragenetic sequence and occur as discrete crystals within vugs, intergrown with baryte, quartz and goethite and overgrowing precursor apatite and allanite-(Ce) (Fig. 11). The REE-fluorocarbonates occur as extremely thin (<5 µm) spindles, which are unsuitable for quantitative EPMA (Fig. 11). However, the presence of Ce, La and F is confirmed semi-quantitatively by X-ray maps and EDS spectra (Fig. 11d–f; Supplementary Material 3, Fig. S5). There are trace amounts of (<1 vol.%) small britholite-(Ce) (<10 µm) crystals within the calcite-2 matrix.
(a–c) Back-scattered electron (BSE) images showing late-stage intergrowths of baryte (Brt), REE-fluorocarbonate (REE-FC), goethite (Gth), and quartz (Qz) occurring interstitially between apatite (Ap) and calcite-2 (Cal-2). (d) BSE image with corresponding elemental X-ray maps (e–f) illustrating the intergrowth of REE-FC and Qz, characterized by elevated F and La concentrations. The inset X-ray map in (d) highlights enhanced Si, confirming the intergrowth of Qz with REE-FC.

Figure 11 Long description
The image A showing a grayscale micrograph with a scale bar labeled 10 micrometers at the top left and a small label “a” at the top right. Multiple irregular grains fill the frame. White, gray and black regions form a mottled texture. Red arrows point toward a bright, irregular area near the center. Text labels include “REE-FC”, “Brt” and “Ap”. The image B showing a grayscale micrograph with a scale bar labeled 100 micrometers at the bottom right and a small label “b” at the top right. A bright, branching to patchy region occupies the central area, surrounded by darker regions. Red arrows point to the bright region and to nearby areas. Text labels include “REE-FC”, “Qz”, “Ap” and “Cal-2”. The image C showing a grayscale micrograph with a scale bar labeled 10 micrometers at the bottom left and a small label “c” at the top right. A bright, irregular mass lies near the center-left, bordered by darker granular regions. Several red arrows point toward the bright mass and toward surrounding grains. Text labels include “REE-FC”, “Ap” and “Gth”. The image D showing a grayscale micrograph with a scale bar labeled 20 micrometers at the bottom right and a small label “d” at the top right. Two bright, irregular bodies are separated by dark background. A red arrow points to the right-hand bright body. The text label “REE-FC” is placed near the arrow. A small inset at the lower left contains a color map with the text “Si” and “Qz”. The image E showing a color intensity map on a black background with a small label “e” at the top right. A multicolored irregular shape occupies the center, with surrounding scattered pixels. A vertical color scale bar is placed along the left side of this sub-image. The text label “F” is at the lower left. The image F showing a color intensity map on a black background with a small label “f” at the top right. A multicolored irregular shape occupies the center, with smaller scattered regions nearby. The text label “La” is at the lower left. A scale bar is present at the bottom right with the unit micrometers.
Fluorite
Fluorite occurs as discrete anhedral to sub-rounded crystals in the calcite-2 matrix and has an ideal end-member (CaF2) composition (Fig. 1f, Supplementary Material 2, Table S7).
Other accessory minerals
BSE images and X-ray maps reveal that goethite (Supplementary Material 3, Fig. S6) commonly has a colloidal or box-work structure enclosed by skeletal allanite-(Ce) and baryte (Figs 8d). These colloidal structures commonly exhibit relict intermediate-AZ cores enriched in Fe, which are separated by thin, low-AZ zones characterised by lower Fe and higher Si concentrations (Supplementary Material 3, Fig. S4a–d). Pyrite is an accessory phase (<1 vol.%) and is either pseudomorphed by goethite or restricted as inclusions within fluorite (Supplementary Material 3, Fig. S3). Accessory (<1 vol.%) vanadinite locally replaces allanite-(Ce). It has an ideal end-member composition of Pb5(VO4)3Cl (Supplementary Material 1, Table S8). There are also late-forming unidentified REE-Pb-Nb-Si phases that are interstitial to apatite and contemporaneous with allanite-(Ce) (Fig. 6e, Supplementary Material 2, Table S9).
C–O isotope geochemistry
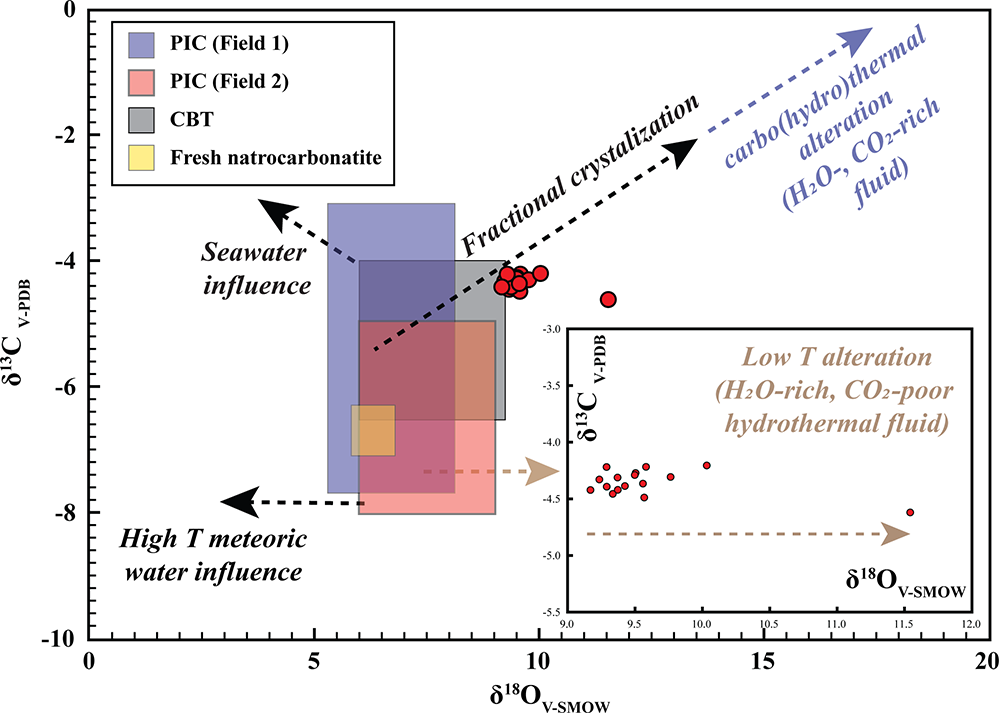
The carbon–oxygen isotopic data for Khaderpet bulk-rock calcite carbonatite show a narrow range of δ13C (–4.21 to –4.62‰, VPDB) that falls within the primary carbonatite range (Fig. 12; Supplementary Material 2, Table S10) and a broader range of δ18O (+9.17 to +11.54‰ VSMOW), and most data points extend outside the primary igneous carbonatite fields suggesting low-temperature hydrothermal alteration (Fig. 12).
Bulk-rock stable carbon and oxygen isotopic compositions (δ13CVPDB vs δ18OVSMOW) of the Khaderpet carbonatite. Fields for primary igneous carbonate (PIC) are modified from Jones et al. (Reference Jones, Genge and Carmody2013) (Field 1), Taylor et al. (Reference Taylor, Frechen and Degens1967) (Field 2) and the primary carbonatite carbonate (CBT) field is reproduced from Clark et al. (Reference Clarke, Le Bas, Spiro, Meyer and Leonardos1991); the field for fresh natrocarbonatite is from Keller and Hoefs (Reference Keller and Hoefs1995) and Jones et al. (Reference Jones, Genge and Carmody2013). Dashed arrows illustrate potential evolutionary or alteration trends affecting the isotopic systematics, including seawater interaction, fractional crystallization and carbo(hydro)thermal alteration. The inset highlights enrichment in δ18O at nearly constant δ13C, interpreted as reflecting low-temperature alteration by H2O-rich, CO2-poor meteoric–hydrothermal fluids (after Demény et al., Reference Demény, Ahijado, Casillas and Vennemann1998; Ray and Ramesh, Reference Ray and Ramesh2006).

Figure 12 Long description
Bulk-rock stable carbon and oxygen isotopic compositions (delta 13 C vs delta 18 O) of the Khaderpet carbonatite. The x-axis is labeled delta 18 O subscript VSMOW, ranging from 0 to 20 in increments of 5. The y-axis is labeled delta 13 C subscript VPDB, ranging from minus 10 to 0 in increments of 2. A legend in the upper left lists three items: PIC (Field 1), PIC (Field 2) and CBT. On the left side of the plot, three overlapping shaded rectangular fields occupy the region from about delta 18 O equals 0 to about delta 18 O equals 10 and from about delta 13 C equals minus 8 up to about delta 13 C equals minus 2. A label near the upper left reads Fresh natrocarbonatite. A vertical dashed line is drawn at delta 18 O equals 10. Red circular data points form a tight cluster near delta 13 C around minus 4 and delta 18 O around 10 to 12. Additional red points extend to the right of the dashed line, spread across delta 18 O values roughly from 11 to 18, with delta 13 C values roughly from minus 6 to minus 3. A large left-pointing arrow along the lower left is labeled High delta 18 O water influence. A large upward-pointing arrow on the left is labeled Seawater influence. A diagonal arrow pointing up and to the right is labeled Fractional crystallization. Another diagonal arrow pointing up and to the right near the top right is labeled Carbo(hydro)thermal alteration (delta 18 O rich, delta 13 C poor). A text label on the right reads Low T alteration (H2O-rich, CO2-poor) meteoric–hydrothermal fluids.
Discussion
Magmatic origin for Khaderpet carbonatite
Calcite is a primary liquidus phase in carbonatite-forming magmas of diverse compositions (Gittins et al., Reference Gittins, Harmer and Barker2005; Gittins and Mitchell, Reference Gittins and Mitchell2023). Magmatic temperatures usually favour the incorporation of Mg, Sr, Ba, Na and REE in the calcite structure provided these elements are present in the magma. Although determining the actual temperature of calcite crystallization in carbonatite systems is challenging, experimental data for simplified binary systems such as CaCO3–SrCO3 and CaCO3–BaCO3 suggest that significant incorporation of Sr and Ba (>1–2 wt.% SrO and BaO) into calcite occurs only at magmatic temperatures >600°C (Chang, Reference Chang1965, Reference Chang1971; Wilson, Reference Wilson, Kjarsgaard and Taylor2007). At Khaderpet, high-AZ calcite-1 phenocrysts are enriched in Sr and Ba (up to 2.0 and 2.2 wt.% SrO and BaO, respectively) and, on average, contain greater concentrations of Na and REE compared to other calcite types (Table 1; Figs 4, 5; Supplementary Material 2, Table S1), suggesting crystallizing temperatures above 600°C. The low Mg and Fe contents in calcite-1 further imply that it crystallized from a calcitic or calcite-normative magma. Magmatic fluorite typically exhibits rounded-to-sub-rounded morphologies due to minimization of surface energy (Veksler et al., Reference Veksler, Dorfman, Kamenetsky, Dulski and Dingwell2005; Chebotarev et al., Reference Chebotarev, Veksler, Wohlgemuth-Ueberwasser, Doroshkevich and Koch-Müller2019; Stepanov et al., Reference Stepanov, Aminov, Odinaev, Iskandarov, Jiang and Karmanov2024), whereas hydrothermal fluorite commonly forms drusy aggregates characterized by octahedral habits and oscillatory zoning (Schwinn and Markel, Reference Schwinn and Markl2005; Barker et al., Reference Barker, Bennett, Cox, Norman and Gagan2009; Cangelosi et al., Reference Cangelosi, Broom-Fendley, Banks, Morgan and Yardley2020). At Khaderpet, fluorite occurs as discrete anhedral crystals embedded within the calcite-2 matrix, unlike typical hydrothermal fluorite occurrences (Fig. 2c, d). Experimental studies on the CaCO3–CaF2 system indicate that eutectic crystallization of calcite and fluorite occurs at ∼ 880°C, decreasing to ∼600°C in the presence of H2O (Gittins and Tuttle, Reference Gittins and Tuttle1964).
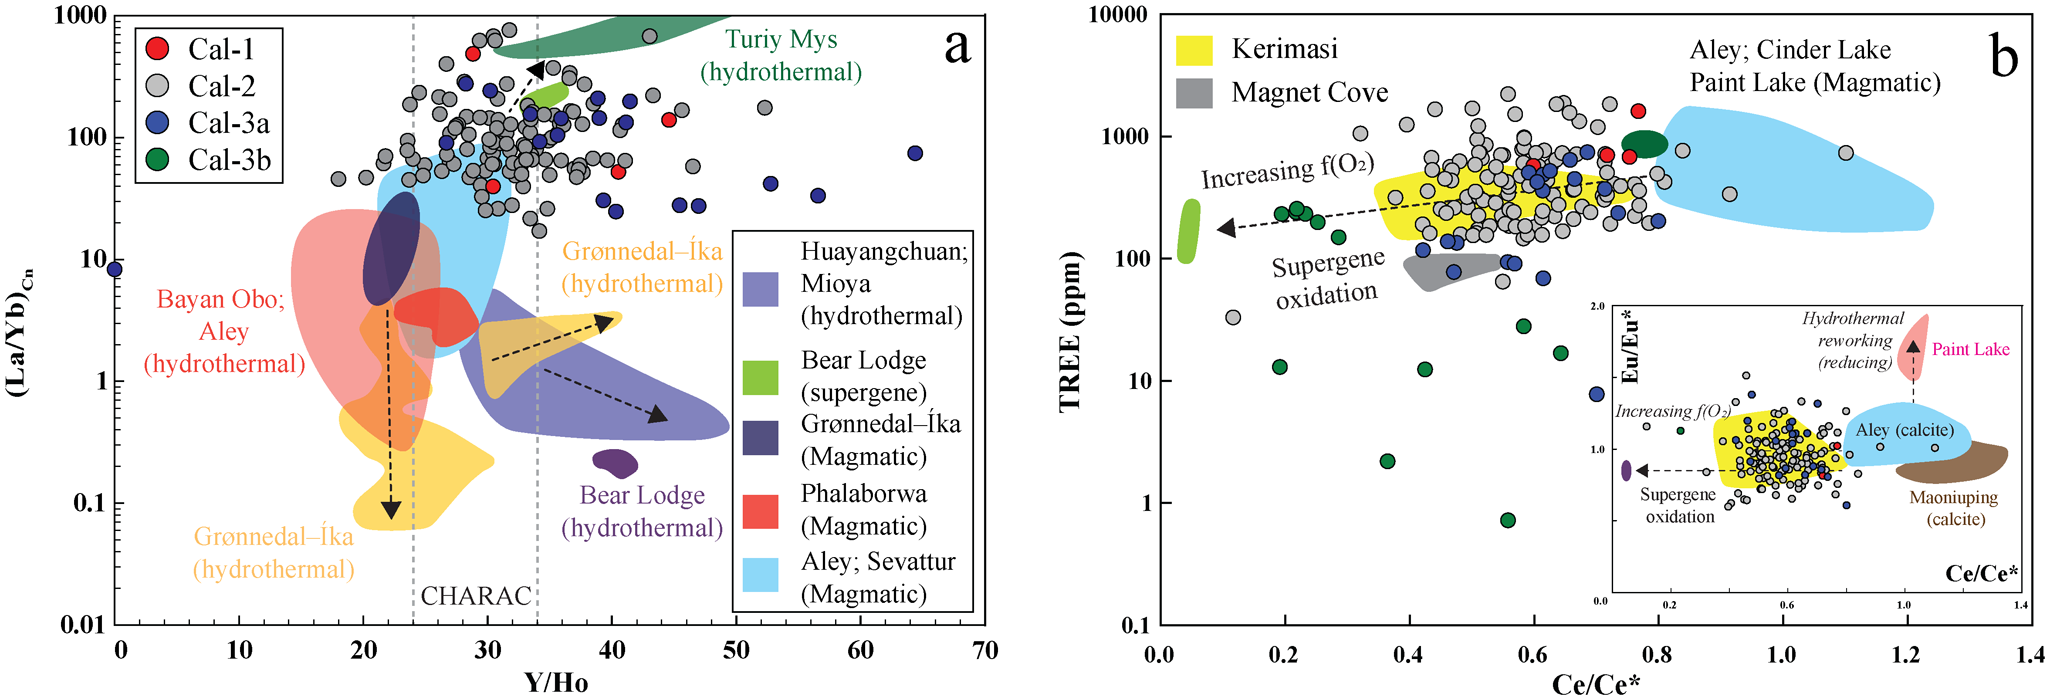
The (La/Yb)Cn and Y/Ho ratios serve as effective discriminators between magmatic and hydrothermal calcite from carbonatites (Fig. 13a; Chakhmouradian et al., Reference Chakhmouradian, Reguir, Couëslan and Yang2016b; Dey et al., Reference Dey, Chakrabarty, Mitchell, Bhattacharjee, Pal, Kynicky and Drüppel2024; Bhattacharjee et al., Reference Bhattacharjee, Chakrabarty, Brenna, Xu, Mitchell, Kozlov, Fomina and Sidorov2025). Most calcite types (calcite-1, calcite-2 and calcite-3a) have (La/Yb)Cn and Y/Ho ratios within the magmatic range [(La/Yb)Cn: >1–100; Y/Ho: 24–34], although a few show deviations beyond these limits (Fig. 13a). Such positive or negative deviations in Y/Ho from magmatic values are consistent with hydrothermal alteration by fluorine- and bicarbonate-rich fluids, respectively (Bau and Dulski, Reference Bau and Dulski1995). The presence of these anionic groups in hydrothermal fluids is corroborated by the occurrence of late-stage REE-fluorocarbonates interstitial to calcite-2 (Fig. 11). Coarse calcite-3 veins cross-cut the calcite-2 matrix, indicating a younger paragenetic stage (Fig. 3f–i). The calcite-3 veins comprise two distinct domains: a bright, Mn-Fe-Mg-rich calcite-3a core and dark, nearly pure calcite-3b peripheries (Fig. 4e–h). Most calcite-3a crystals exhibit overlapping (La/Yb)Cn, Ba, Sr and ΣREE contents with calcite-2 (Figs 5, 13), suggesting a common magmatic origin. During progressive crystallization, the solubility of Mg and other relatively small divalent cations that only partially substitute for Ca in the calcite lattice is expected to decrease (Chakhmouradian et al., Reference Chakhmouradian, Reguir and Zaitsev2016a). Hence, the sharp enrichment of Fe, Mg and particularly Mn in calcite-3a relative to the surrounding calcite-2 matrix contradicts a simple magmatic differentiation trend (Fig. 4a–d). The coarse grain size, vein-like crosscutting relationship with calcite-2, and overall higher Y/Ho ratios (up to 64), together with elevated Mn-Mg-Fe contents, suggest collectively that calcite-3a formed through recrystallization induced by externally derived and contaminated hydrothermal fluids. The elevated Mn concentrations in calcite-3a cores probably reflect slower precipitation from such Mn-enriched fluids, whereas the compositionally purer calcite-3b rims represent faster crystallization during the waning stages of hydrothermal activity (Pingitore et al., Reference Pingitore, Eastman, Sandidge, Oden and Freiha1988). A plausible source of the contaminating components is the phlogopite and amphibole xenocrysts within the calcite-2 matrix (Supplementary Material 3, Fig S7), or interaction with fluids derived from the volcaniclastic host rocks, which contain secondary serpentine and chlorite (Smith et al., Reference Smith, Haggerty, Chatterjee, Beard and Townend2013).
(La/Yb)Cn vs Y/Ho diagram showing that most calcite-1 (Cal-1) and calcite-2 (Cal-2) compositions plot within the magmatic field, overlapping those of Aley and Sevattur, with some data trending toward the Turiy Mys hydrothermal field. In contrast, the majority of calcite-3a (Cal-3a) exhibits elevated Y/Ho ratios (>34), consistent with hydrothermal reworking. (b) TREE (total rare earth element) versus Ce/Ce* illustrates that the Cal-1, Cal-2 and Cal-3a show negative Ce anomalies comparable to Kerimasi calcite, whereas Cal-3b displays stronger negative-Ce anomalies, trending towards the supergene calcite field characteristic of Bear Lodge. Inset Eu/Eu* vs Ce/Ce* plot shows that all calcite data cluster within the Kerimasi field. Eu/Eu*: EuCn/(0.5SmCn + 0.5GdCn) and Ce/Ce*: CeCn/(0.5LaCn + 0.5PrCn), where Cn corresponds to chondrite normalized (normalizing values are from Anders and Grevesse, Reference Anders and Grevesse1989); CHARAC range indicated by dotted lines in (a) (Bau, Reference Bau1996). The coloured fields represent magmatic and hydrothermal and supergene calcite from global carbonatite occurrences (data source: Chakhmouradian et al., Reference Chakhmouradian, Reguir, Couëslan and Yang2016b; Ranta et al., Reference Ranta, Stockmann, Wagner, Fusswinkel, Sturkell, Tollefsen and Skelton2018; Zheng et al., Reference Zheng, Liu, Smith, Kynický and Hou2023; Dey et al., Reference Dey, Chakrabarty, Mitchell, Bhattacharjee, Pal, Kynicky and Drüppel2024).

Figure 13 Long description
The image contains two scatter plots comparing calcite groups by element ratios and rare earth element patterns. The first plot, labeled 'a', has the x-axis labeled 'Y/Ho' ranging from 0 to 70 and the y-axis labeled '(La/Yb)Cn' ranging from 0.01 to 1000 on a logarithmic scale. The plot distinguishes calcite groups Cal-1, Cal-2, Cal-3a and Cal-3b, showing their distribution across magmatic and hydrothermal fields. The CHARAC band is highlighted, indicating typical magmatic values. Cal-1 and Cal-2 mostly fall within the magmatic field, while Cal-3a trends towards hydrothermal values with elevated Y/Ho ratios. Shaded regions represent reference fields like 'Bayon Obo (hydrothermal)' and 'Bear Lodge (hydrothermal)'. The second plot, labeled 'b', has the x-axis labeled 'Ce/Ce' from 0.0 to 1.4 and the y-axis labeled 'TREE (ppm)' from 0 to 10000. TREE stands for total rare earth elements. This plot shows negative Ce anomalies for Cal-1, Cal-2 and Cal-3a, similar to Kerimasi calcite, while Cal-3b trends towards supergene calcite fields. An arrow labeled 'Increasing oxygen fugacity' suggests a redox trend. An inset plot shows Eu/Eu versus Ce/Ce*, with calcite data clustering within the Kerimasi field. The plots illustrate how calcite groups separate into magmatic and hydrothermal fields, with implications for redox conditions and supergene processes.
Apatite, allanite and quartz as tracers for assimilation and contamination
The Khaderpet carbonatite hosts xenoliths of granite country rock (Fig. 2e; Supplementary Material 3, Fig. S7). The presence of REE-Si-enriched apatite, allanite, Si-rich pyrochlore and quartz collectively indicates the incorporation of externally derived Si into the carbonatite system through assimilation. Typically, increasing Si activity enhances REE incorporation into apatite through the britholite-type substitution (REE3+ + Si4+ = P5+ + Ca2+; Harlov, Reference Harlov2015). At Khaderpet, apatite contains up to 1.3 wt.% SiO2, with a strong positive correlation between REE and Si (R2 = 0.87; Fig. 7b), indicating assimilation of Si-rich country rocks. As britholite substitution is typically observed at high temperatures (>600°C) (Anenburg and Mavrogenes, Reference Anenburg and Mavrogenes2018; Giebel et al., Reference Giebel, Parsapoor, Walter, Braunger, Marks, Wenzel and Markl2019), the assimilation was probably initiated during the magmatic stage. Additionally, apatite occurs as euhedral-to-subhedral crystals within the calcite-2 matrix (Fig. 6), contrasting with the pill-shaped or subrounded magmatic apatite typically found in carbonatite, which forms through transport and rheological mixing (Chakhmouradian et al., Reference Chakhmouradian, Reguir, Zaitsev, Couëslan, Xu, Kynický, Mumin and Yang2017). This suggests in situ crystallization of apatite together with calcite-2, rather than mechanical incorporation from earlier magmatic stages. Geochemically, Khaderpet apatite show a transitory characteristic between the primary igneous and secondary supergene apatite from Kovdor, Glenover, Sokli, Bukusu and Catalão I (Fig. 7b; Supplementary Material 3, Figs S2, S8) suggesting alteration by supergene fluids consistent with the observation with calcite-2. Similarly, pyrochlore (Pcl-1 and Pcl-2) also exhibits hydrothermal and supergene characteristics, including significant A-site vacancies and elevated Si and REE with minor Ba contents (Table 4; Fig. 10d,e). It is well established that primary magmatic pyrochlore undergoes hydrothermal alteration, with decreasing Nb, Ta, Na, Ca and F and increasing Ba, Pb, Sr, REE, Si and A-site vacancies in the process (Lumpkin and Ewing, Reference Lumpkin and Ewing1995; Mitchell, Reference Mitchell2015; Dey et al., Reference Dey, Bhattacharjee, Chakrabarty, Mitchell, Pal, Pal and Sen2021a, Reference Dey, Mitchell, Bhattacharjee, Chakrabarty, Pal, Pal and Sen2021b; Bhattacharjee et al., Reference Bhattacharjee, Dey, Chakrabarty, Mitchell and Ren2022).
In contrast to uncontaminated carbonatite systems, where REE minerals such as burbankite, carbocernaite, monazite and REE-fluorocarbonates (bastnäsite, parisite and synchysite) are common (Chakhmouradian and Zaitsev, Reference Chakhmouradian and Zaitsev2012; Dey et al., Reference Dey, Chakrabarty, Mitchell, Bhattacharjee, Pal, Kynicky and Drüppel2024), the Khaderpet carbonatite is enriched in allanite. Typically, allanite is a minor accessory phase in carbonatites due to the low Si and Al activity in carbonatite-forming magmas and magma-derived fluids (Barker, Reference Barker2001). Therefore, allanite formation is favoured during contamination, wherein the Ca, Fe, REE and H2O already present in the evolved carbonatite-forming magma are sequestered into allanite when externally derived Si and Al become available through the reaction: REE3+ + CaO + FeO + Al2O3 + 3SiO2 + 3OH = (CaREE3+)Ʃ2(Al2Fe2+)Ʃ3(SiO4)(Si2O7)O(OH) (allanite) + H2O. Allanite commonly forms as reaction rims on silicate xenocrysts, as observed at Hogenakkal, India (Bhattacharjee et al., Reference Bhattacharjee, Chakrabarty, Mitchell, Patel, Kozlov, Fomina, Dey and Pal2024); Eden Lake, Canada (Chakhmouradian et al., Reference Chakhmouradian, Mumin, Demény and Elliott2008, Reference Chakhmouradian, Couëslan and Reguir2009); and the Dwyer Mine, Ontario (Martin and Schumann, Reference Martin and Schumann2022). In contrast, at Khaderpet, allanite commonly occurs as discrete patches or clusters, and its modal proportions increase significantly, reaching almost 25 vol.% near the carbonatite–granite xenolith contact (Fig. 2e,f). In addition, allanite occurs overgrowing apatite (Fig. 6c), suggesting that contamination coincided with apatite crystallization, and increasing Si and Al contents saturation promoted allanite formation.
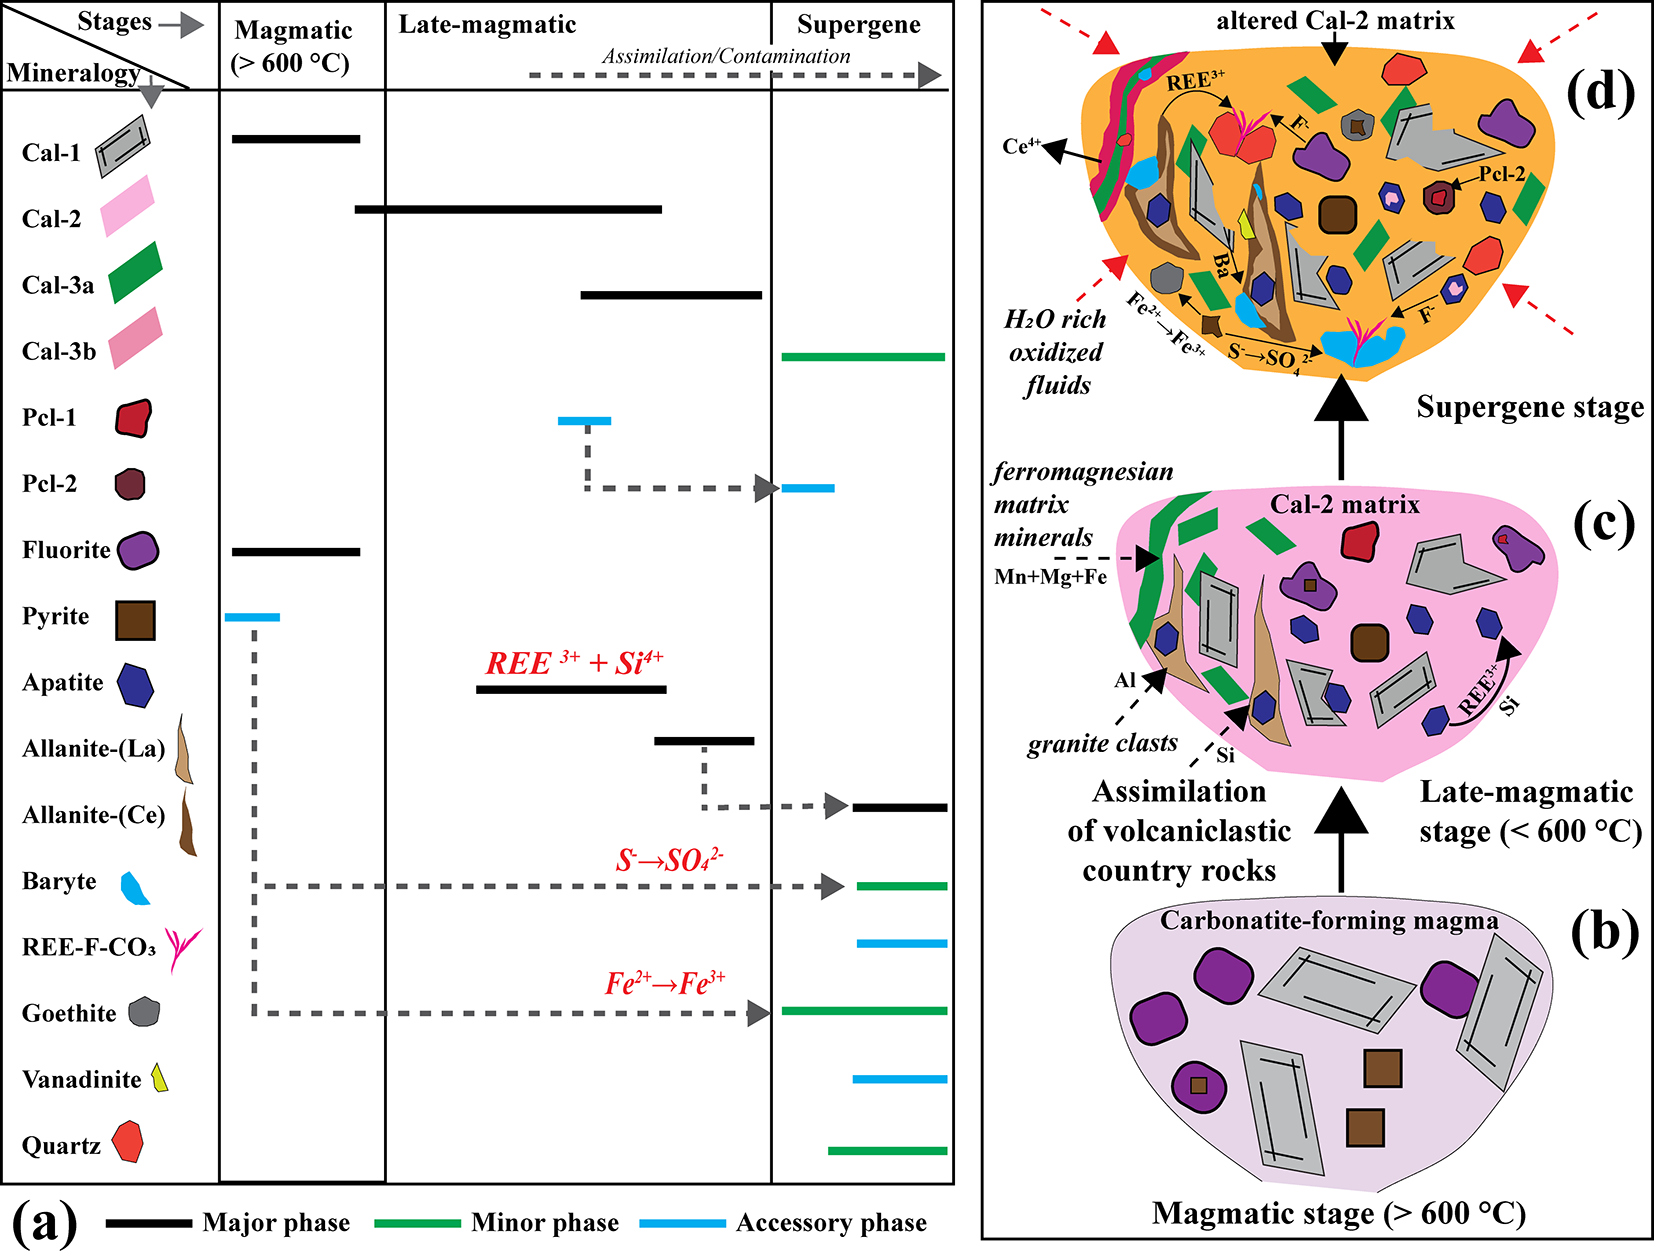
(a) Detailed paragenetic sequence illustrating the major, minor and accessory mineral assemblages across the magmatic, late-magmatic and supergene stages. Dotted lines represent mineral replacement, breakdown, or transformations linking successive generations. (b–d) Schematic representations of the magmatic, late-magmatic and supergene stages, respectively, depicting the progressive evolution and fluid–rock interaction processes responsible for the evolution of the Khaderpet carbonatite.

Figure 14 Long description
The image consists of four parts. The first part, labeled as (a), is a detailed paragenetic sequence illustrating major, minor and accessory mineral assemblages across three stages: magmatic, late-magmatic and supergene. The minerals listed on the left include Calcite-1, Calcite-2, Calcite-3a, Calcite-3b, Pyrochlore-1, Pyrochlore-2, Fluorite, Pyrite, Allanite, Allanite plus Ce, Baryte, REE plus CO subscript 3, Vanadinite and Quartz. Each mineral is represented by a horizontal line indicating its presence as a major, minor, or accessory phase during the respective stages. Dotted lines represent mineral replacement, breakdown, or transformations linking successive generations. The second part, labeled as (b), is a schematic representation of the magmatic stage, showing various minerals such as Calcite-1, Pyrochlore-1 and Fluorite, indicating crystallization at temperatures greater than 600 degrees Celsius. The third part, labeled as (c), depicts the late-magmatic stage, illustrating the assimilation of volcaniclastics and country rocks, with minerals like Calcite-2 and Pyrochlore-2. The fourth part, labeled as (d), represents the supergene stage, showing altered Calcite-2 matrix and interaction with H subscript 2 O-rich meteoric fluids, along with the presence of ferromagnesian minerals and Mn-Mg-Fe-rich phases. Each schematic representation visually demonstrates the progressive evolution and fluid-rock interaction processes responsible for the evolution of the Khaderpet carbonatite.
Regardless of the generally low silica activity in fluids derived from carbonatite-forming magmas, quartz is commonly associated with hydrothermal REE mineralization in several carbonatite complexes, including those from the Mianning-Dechang and Qinling provinces, Bayan Obo (China), Mountain Pass (USA) and Hogenakkal (India) (Zhang et al., Reference Zhang, Chen, Zhang and Tang2022; Huang et al., Reference Huang, Liu, Liu, Li, Liu, Tang, Fan, Li and Li2023; Bhattacharjee et al., Reference Bhattacharjee, Chakrabarty, Mitchell, Patel, Kozlov, Fomina, Dey and Pal2024). The presence of quartz in these systems is typically attributed to one or more of the following processes: (1) assimilation of silica-rich country rocks; (2) incorporation of xenocrystic quartz during magma ascent; or (3) interaction with externally derived, silica-rich hydrothermal fluids (Doroshkevich et al., Reference Doroshkevich, Viladkar, Ripp and Burtseva2009; Giebel et al., Reference Giebel, Parsapoor, Walter, Braunger, Marks, Wenzel and Markl2019). At Khaderpet, quartz occurs as a residual, interstitial phase between calcite-2 and apatite, but is contemporaneous with calcite-3b, baryte and REE-fluorocarbonates (Figs 3f, 6b, 12a–d), ruling out a xenocrystic origin. Its occurrence is therefore more plausibly linked to contamination, in common with Hogenakkal carbonatites (Bhattacharjee et al., Reference Bhattacharjee, Chakrabarty, Mitchell, Patel, Kozlov, Fomina, Dey and Pal2024, Reference Bhattacharjee, Chakrabarty, Brenna, Xu, Mitchell, Kozlov, Fomina and Sidorov2025).
Supergene alteration
The Khaderpet carbonatite exhibits δ13C (–4.62 to –4.21‰) values that fall within the ranges of primary igneous carbonatite (PIC) and primary carbonatite carbonate (CBT) (Clarke et al., Reference Clarke, Le Bas, Spiro, Meyer and Leonardos1991; Jones et al., Reference Jones, Genge and Carmody2013). However, their δ18O (9.17–11.54‰) values deviate slightly from the primary carbonatite fields, displaying a positive shift in δ18O with nearly constant δ13C values (Fig. 12). This trend cannot be explained by fractional crystallization or interaction with magma-derived carbohydrothermal fluids (CO2-H2O-dominated fluids), as both processes would result in coupled enrichment of δ13C and δ18O (Ray and Ramesh, Reference Ray and Ramesh2006; Chakhmouradian et al., Reference Chakhmouradian, Reguir, Kressall, Crozier, Pisiak, Sidhu and Yang2015). The most plausible explanation is the interaction of the Khaderpet carbonatite with a low-temperature H2O-rich, CO2-poor hydrothermal fluid (Wilson et al., Reference Wilson, Kjarsgaard and Taylor2007), resulting in enrichment of δ18O while preserving the mantle-like δ13C isotopic signature.
All Khaderpet calcite types (calcite-1 to calcite-3) and most apatites exhibit prominent negative Ce anomalies (Figs 7b, 13b). The intensity of the negative Ce anomalies increases, accompanied by a concomitant decrease in Sr and Ba, from calcite-1, calcite-2 and calcite-3a to calcite-3b, approaching the composition of supergene calcite from the Bear Lodge carbonatite (Fig. 13b). The negative Ce anomalies attributed to the oxidation of Ce3+ to Ce4+ under low-temperature, oxidizing hydrothermal conditions, which overprinted the primary trace element signatures of calcite and apatite (Sanematsu and Watanabe, Reference Sanematsu, Watanabe, Verplanck and Hitzman2016; Broom-Fendley et al., Reference Broom-Fendley, Siegfried, Wall, O’Neill, Brooker, Fallon, Pickles and Banks2021). The late-stage supergene oxidation at Khaderpet is also evidenced by the pseudomorphic replacement of hydrothermal pyrochlore-1 by pyrochlore-2, resulting in an increasing A-site vacancy, pyrochlore-1 and pyrite by goethite (Figs 8d, 10). Moreover, under supergene oxidizing conditions, allanite-(La) was altered to REE-depleted, Fe3+-rich ferriallanite-(Ce), often found in association with baryte (Figs 8b,c, 9b). The restricted occurrence of REE-fluorocarbonates interstitial to apatite and intergrown with quartz, baryte and goethite (Fig. 11a–c) suggests localized enrichment of SO42– and F– in the hydrothermal fluids derived from the breakdown of pyrite and apatite, respectively. In addition, the formation of late-stage vanadinite, along with an unidentified Nb-Pb-REE-Si phase (Fig. 6e,f), underscores the role of supergene oxidative processes during the final stages of alteration. The observed mobility of Pb and V, culminating in the precipitation of vanadinite, is characteristic of supergene enrichment in oxidizing, low-temperature environments, as documented in karst-hosted systems such as the Djebba Pb-Zn district (Garnit et al., Reference Garnit, Bouhlel, Kraemer, Halima and Beaudoin2022).
Conclusions
The Khaderpet carbonatite lacks primary silicate-oxide minerals (such as olivine, clinopyroxene, amphibole, phlogopite and spinel) that are commonly used as tracers or discriminants to identify the nature of parental magmas, particularly between calcite kimberlites, ultramafic lamprophyres and carbonate-bearing lamproites. Consequently, the nature of the parental magmas cannot be determined, and a petrogenetic model linking the carbonatite to the associated volcaniclastic silicate host rocks cannot be established.
Nevertheless, several textural, mineralogical and geochemical features of the Khaderpet carbonatite point to a magmatic origin. These include primary mantle-like δ13C isotopic compositions, high-temperature Ba-Sr-rich calcite-1 and fluorite assemblages, consistent with crystallization at temperatures of >600°C. The rounded morphology of fluorite, magmatic (La/Yb)n and Y/Ho ratios in most calcite-1 and calcite-2 crystals, and the occurrence of eutectic calcite–fluorite intergrowths further support magmatic crystallization (Fig. 14a,b). The presence of REE-Si-enriched apatite, allanite and Si-bearing pyrochlore, together with interstitial quartz, demonstrates assimilation of silica-rich country rocks. Britholite-type substitution in apatite, the abundance of allanite near xenolith contacts, and the enrichment of Si and Al all point to prolonged assimilation and contamination processes (Fig. 14c). Subsequent hydrothermal alteration led to recrystallization of calcite-2 and calcite-3a, producing elevated Mn, Fe and Mg contents and higher Y/Ho ratios in calcite-3a, while nearly pure calcite-3b reflects advanced hydrothermal alteration.
Isotopic data reveal that, although the Khaderpet carbonatite retains mantle-like δ13C signatures, the elevated δ18O values record interaction with low-temperature, H2O-rich, CO2-poor hydrothermal fluids of meteoric origin. Supergene oxidation is indicated by prominent negative Ce anomalies in calcite and apatite, along with the replacement of hydrothermal pyrochlore-1 by supergene pyrochlore-2, pyrochlore-2 and pyrite by goethite, and allanite-(La) by ferriallanite-(Ce) (Fig. 14d). The late formation of REE-fluorocarbonates, baryte and vanadinite reflects localized mobilization of F–, SO42–, Pb and V during near-surface oxidation (Fig. 14d).
Supplementary material
The supplementary material for this article can be found at https://doi.org/10.1180/mgm.2026.10211
Acknowledgements
SB and AC extend their sincere gratitude to Prof. Santanu Bhattacharya, Director, IISER Tirupati, for his support and for providing access to institutional facilities. SB acknowledges financial support from the Ministry of Education, Government of India, through the Institute Fellowship Program, and also thanks the Department of Geology, Rhodes University, for providing facilities used during the final stages of this work. RHM’s research on alkaline rocks is supported by Lakehead University and Almaz Petrology. The authors gratefully acknowledge Monojit Dey for his valuable support during fieldwork and for insightful discussions on various aspects of carbonatite mineralogy. They also extend sincere thanks to Grzegorz Gill, Anna Grabarczyk and Jakub Kotowski (Faculty of Geology, University of Warsaw, Poland) for their assistance in acquiring some of the BSE images. They also thank Sam Broom-Fendley and an anonymous reviewer for their constructive and thoughtful reviews, which significantly improved the quality and clarity of this manuscript. Stuart Mills, Craig Storey and Helen Kerbey are acknowledged for their careful editorial handling and guidance throughout the publication process. This work is presented in honour of the Mineralogical Society’s sesquicentennial, celebrating its remarkable legacy and enduring contributions to mineral science. We gratefully acknowledge the Society’s profound impact and its steadfast support of the global mineralogical community.
Competing interests
The authors report no financial or personal conflicts of interest that could have affected the results or interpretations presented in this study.


 Open access