


Scholars, pollsters, and news media have long reported on the fact that women and men vote for different kinds of candidates. Why might this occur? Theories of women’s early voting behavior argue that geography – differences in where women and men lived – explain sex gaps upon suffrage (Teele Reference Teele2024). Structural and economic theories argue that increases in women’s autonomy help explain why US women began to vote for more progressive presidential candidates in the 1980s (Iversen and Rosenbluth Reference Iversen and Rosenbluth2006; Manza and Brooks Reference Manza and Brooks1998). Cultural theories focus on the spread of post-materialist values across the globe that precipitated societal shifts, from women voting more conservatively than men to women voting more for the left. Feminist theories suggest that women’s feminist consciousness and distinct issue preferences explain why women tend to vote more progressively than men (Conover Reference Conover1988; Manza and Brooks Reference Manza and Brooks1998). Finally, voters’ gendered personalities – their masculinity or femininity – could explain why women and men prefer different candidates (Hatemi et al. Reference Hatemi, McDermott, Bailey and Martin2012; McDermott Reference McDermott2016).
Theories on the origins of sex gaps abound, but scholarship to date has yet to fully theorize how different explanations may apply to different contexts and how determinants of sex gaps may relate to each other. Additionally, research on this phenomenon has focused less on comparative politics than on the case of the United States, and it rarely examines Latin America. Research on this area of the world focuses on ideology, policy, and participation gaps rather than vote choice (Beall and Barnes Reference Beall and Barnes2020; Desposato and Norrander Reference Desposato and Norrander2009; Morgan Reference Morgan, Carlin, Singer and Zechmeister2015). Latin America merits greater scholarly attention. Latin American feminists mobilized for democracy and against authoritarian regimes in the 1970s–80s (Alvarez Reference Alvarez1990; Jaquette Reference Jaquette1994) and for reproductive rights and against gender violence during the 2010s (Reyes-Housholder and Roque Reference Reyes-Housholder and Roque2019; Zaremberg and Almeida Reference Zaremberg and de Almeida2022). Although historically viewed as culturally conservative, Latin Americans have elected women to the presidency eleven times since 1990.
We argue that understanding sex gaps in vote choice requires a theoretical framework that incorporates multiple factors that may matter differently according to context. Existing studies explore the socio-cultural and economic roots of sex gaps, bringing ideology to the forefront and often using it as a proxy for other attitudes and behaviors. We highlight ideology as an explanation for sex gaps in vote choice but not the only explanation. Other gender-related factors – specifically feminism and gendered personalities – may also contribute to sex gaps in electoral preferences, particularly in contexts where ideology does not constitute the most important cleavage. We thereby develop a more comprehensive account of sex gaps in vote choice that centers on ideology, feminism, and gendered personalities, and one that explores their distinct, yet at times reinforcing and complementary, roles in explaining sex gaps in vote choice.
We test the theoretical arguments with original surveys on presidential elections in Latin America.Footnote 1 We study three elections featuring ideologically distinct male candidates who clashed on salient feminist issues. We fielded the first survey in Chile after leftist Gabriel Boric won against far-right leader José Antonio Kast in the second round of December 2021. We implemented the next survey before the second round of presidential voting in Brazil on 30 October 2022, when center-left former president Luiz Inácio Lula da Silva defeated the far-right incumbent Jair Bolsonaro. The third survey was run in Argentina before the second round on 19 November 2023, in which right-wing libertarian Javier Milei triumphed over centrist Peronist Sergio Massa.
Our analysis of these elections revealed significant sex gaps in all three countries – women were more likely than men to vote for Boric rather than Kast, Lula instead of Bolsonaro, and Massa over Milei. Ideology and feminism primarily explain the differences in women’s and men’s presidential vote choice. Left-leaning respondents were more likely to vote for the leftist and centrist candidates. Women’s tendency to gravitate to the ideological left provides one explanation for the sex gaps in Chile and Brazil, but less so in Argentina. Feminists were also more likely to vote for Boric, Lula, and Massa with substantively strong effects, and in all three countries, feminism explains away the sex gaps. Unlike in countries as diverse as the United States, the Netherlands, and Australia (Coffé Reference Coffé2019; Hatemi et al. Reference Hatemi, McDermott, Bailey and Martin2012; McDermott Reference McDermott2016), gendered personalities do not appear to influence vote choice in Chile, Brazil, or Argentina.
This paper advances comparative research on gender and voting in three ways. First, we integrate diverse theories to explain sex gaps, most notably in terms of voters’ feminist identities and attitudes and their gendered personalities. Second, we produce and analyze new data to test long-standing sex gap explanations, developed on the cases of the United States and Western Europe, on the region of Latin America. Third, we explore gender and voting comparatively in three countries, enhancing the generalizability of our theoretical arguments. We expect future research applying this framework to elections in different countries or time periods to reveal context-dependent variations in the explanatory power of ideology, feminism, and gendered personalities.
An Integrated Theory of Sex Gaps in Presidential Vote Choice
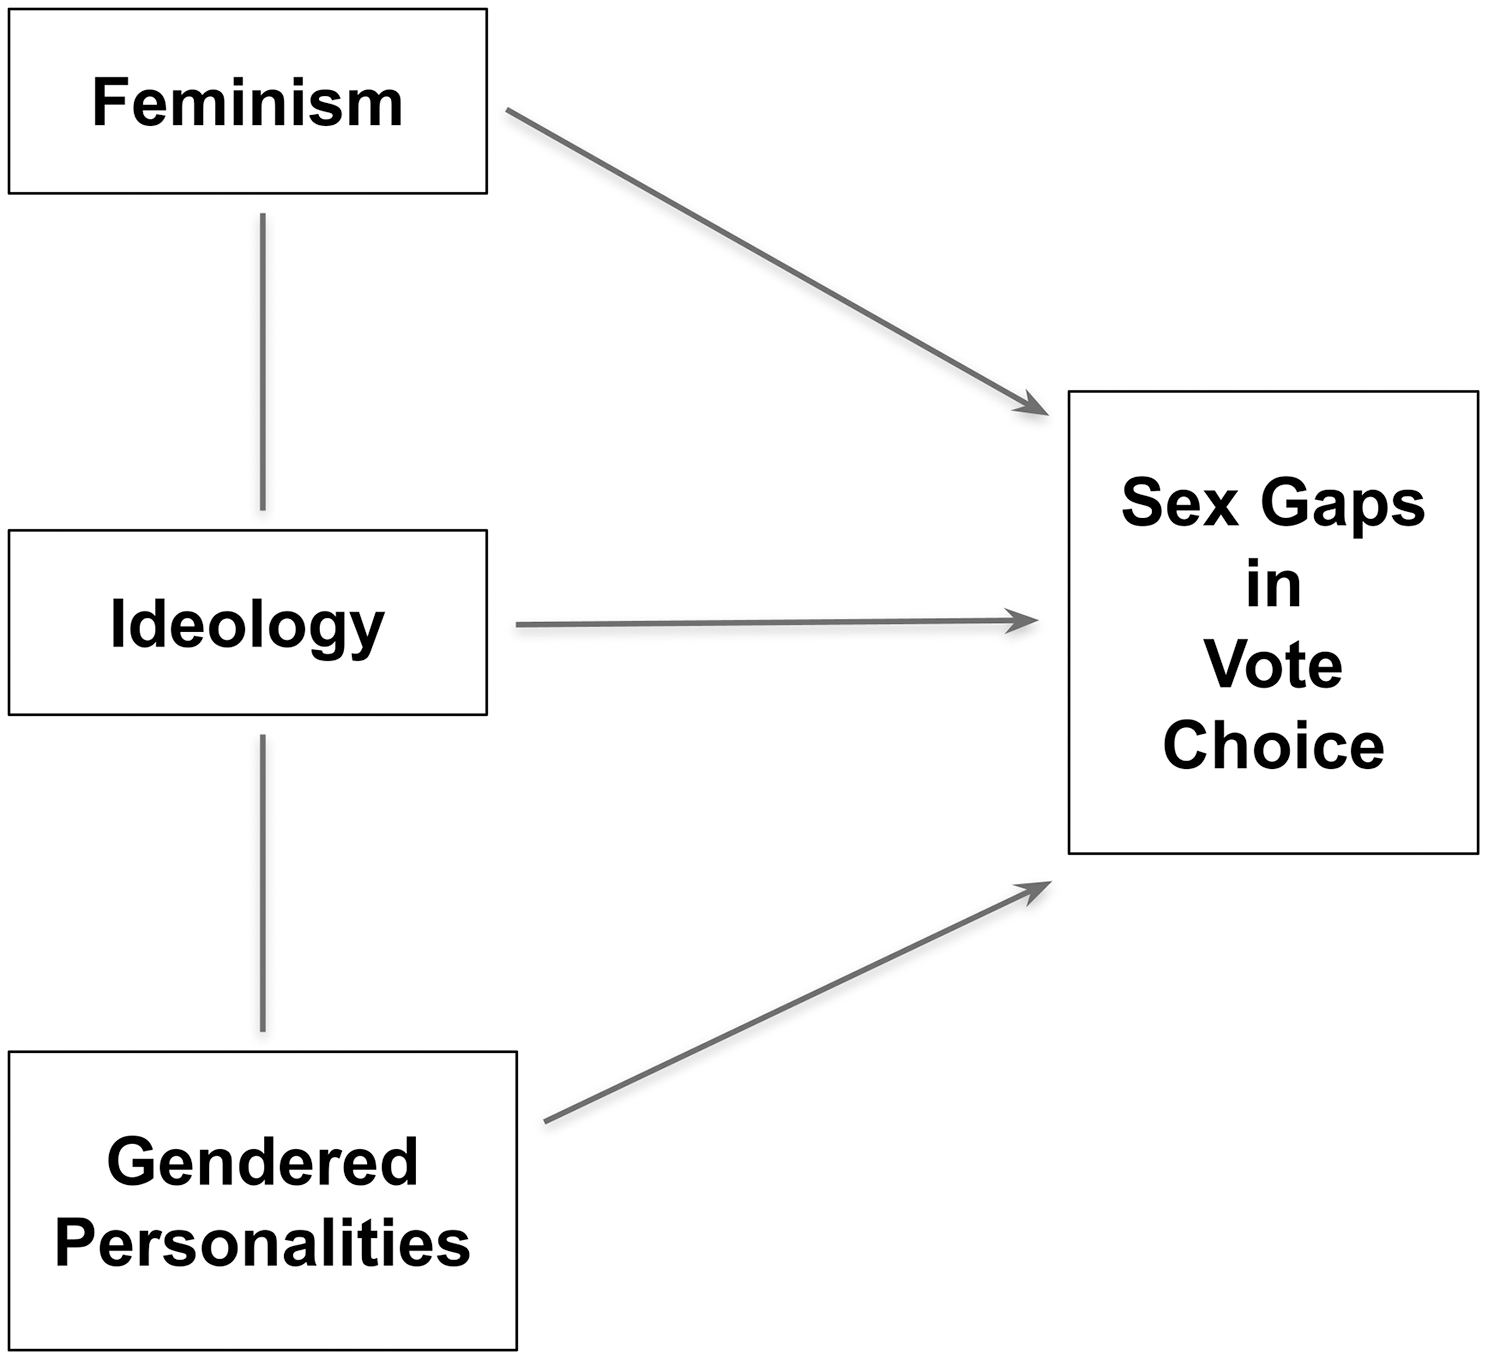
We expect women and men, on average, to support different presidential candidates in Latin America, and we argue that the explanatory power of ideology, feminism, and gendered personalities could depend on context. Figure 1 presents a theoretical model that depicts possible interconnectedness of ideology for both feminism and gendered personalities and the independent effects that each may have on sex gaps in vote choice.
A theory of sex gaps in vote choice.

Ideology
We start on the left of Figure 1 with the central variable of ideology. We argue that both socio-cultural and economic factors could contribute to Latin American women and men professing divergent ideologies, conceptualized on a left–right scale that often refers to social and economic policy. We further contend that these ideological differences often, but may not always, contribute to sex gaps in presidential vote choice in this area of the world.
To begin, cultural theories argue that in modern societies with increasing female autonomy, women tend to become more ideologically progressive than men. Drawing from the field of political sociology, modernization theorists such as Inglehart and Norris (Reference Inglehart and Norris2003) argued that changing national-level socio-economic conditions and societal views over the twentieth century explain the origins of ideological sex gaps in Western nations. ‘Traditional’ sex gaps refer to women adhering to more conservative ideologies and voting more conservatively than men, which sometimes occurred upon women’s suffrage. ‘Modern’ sex gaps refer to women professing more progressive ideologies and voting more progressively than men. Turning to Latin America, Desposato and Norrander (Reference Desposato and Norrander2009) found less of a role for socio-economic development than other factors in explaining sex gaps in political participation, but Morgan (Reference Morgan, Carlin, Singer and Zechmeister2015) shows that women’s employment is a strong driver of voting more progressively. She reasons that women’s greater access to formal employment at the individual level could produce modern sex gaps.
Economic theories for sex gaps arrive at similar predictions as cultural theories regarding women’s progressivism – or put differently, men’s conservatism – but via alternative, and possibly reinforcing, mechanisms. Improving on Becker’s efficiency model of the family, Iversen and Rosenbluth (Reference Iversen and Rosenbluth2006) argue that serious opportunities to divorce means that husbands and wives should be viewed as individual rational actors, with potentially conflicting preferences over social policy. Gender inequality in labor markets and women’s traditional roles as mothers mean that women will be more likely to prefer greater state intervention in the economy, especially with regard to family benefits (Iversen and Rosenbluth Reference Iversen and Rosenbluth2006). Because women may stand to gain more than men from expansive government, women might profess more left-leaning preferences.Footnote 2
Influential scholarship thereby spotlights cultural and economic forces to explain why women and men would differ in their ideological orientations. Importantly, Inglehart and Norris (Reference Inglehart and Norris2003) as well as Morgan (Reference Morgan, Carlin, Singer and Zechmeister2015) examine both ideology and vote choice as dependent variables. Iversen and Rosenbluth (Reference Iversen and Rosenbluth2006, 14) use ideology and support for left or center-left parties as their dependent variables. This suggests that ideology would serve as a proxy for rather than a determinant of electoral behavior.
We depart from this scholarship by explicitly theorizing left–right ideology as a determinant of vote choice in Latin America’s presidential races. Economic-distributive divides tend to characterize party systems in this area of the world, with only minor relevance of religious and regime-based cleavages (Kitschelt et al. Reference Kitschelt, Hawkins, Luna, Rosas and Zechmeister2010, 13). Surveys of Latin American legislators show that they consistently use left–right ideological labels (Zechmeister Reference Zechmeister, Zechmeister, Rosas, Kitschelt, Luna and Hawkins2010), which may provide a precondition for voters to then use ideology as a decision-making shortcut. Individuals who can and do place themselves on a left–right scale may tend to vote for candidates with whom they are most ideologically congruent. Empirical research shows that ideology remains a powerful predictor of electoral preferences in many, although not all, Latin American countries (Baker and Greene Reference Baker and Greene2011; Rosas Reference Rosas, Kitschelt, Hawkins, Luna, Rosas and Zechmeister2012; Zechmeister Reference Zechmeister, Zechmeister, Rosas, Kitschelt, Luna and Hawkins2010).
Still, not all voters can and do place themselves on a left–right ideological scale, curtailing the power of ideological accounts of sex gaps in presidential vote choice. Moreover, if voters’ left–right political commitments are weak, then other factors may override ideological considerations. Finally, two-party systems or second rounds of presidential elections in multiparty systems may only offer a truncated range of ideological choices, moving voters to make decisions based on other factors. For all these reasons, we theorize ideology as a factor that usually influences electoral decisions but is unlikely to fully account for sex gaps in presidential vote choice in Latin America.
Feminism
In addition to ideology, we argue that women and men likely differ in their identification as feminists and support for feminist stances, and as a result, voters’ feminism can help explain sex gaps in presidential vote choice in Latin America. Most research on the impact of feminism on vote choice has examined advanced industrialized nations. Decades of scholarship on sex gaps in the United States explored the role of feminism in vote choice (Conover Reference Conover1988; Manza and Brooks Reference Manza and Brooks1998; Simien et al. Reference Simien, Hayes and Conway2024; Winfrey and Williams Reference Winfrey and Williams2018). For example, scholarship considering intersectionality has shown that white women tend to vote for presidential candidates from the Republican Party, whereas minority women vote for nominees of the Democratic Party (Junn and Masuoka Reference Junn and Masuoka2020; Simien et al. Reference Simien, Hayes and Conway2024). Scholars have also argued that the origins of the US sex gaps center on shifts in men’s rather than women’s partisanship (Kaufmann and Petrocik Reference Kaufmann and Petrocik1999).
Voters’ feminist identities and attitudes could be particularly relevant to understanding the origins of sex gaps in presidential vote choice in Latin America. Feminist movements in Latin America have historically featured concerns both similar to and distinct from feminist movements in other parts of the world. Elite Latin American women mobilized in some countries for suffrage during the 1910s–50s (Baldez Reference Baldez2002, 21–32; Castillo Reference Castillo2023; Kirkwood Reference Kirkwood1986, 63–137). Women from different social classes joined forces against authoritarian regimes, most notably in Chile, Brazil, and Argentina during the 1970s and 1980s (Alvarez Reference Alvarez1990, 57–110; Baldez Reference Baldez2002, 146–95; Jaquette Reference Jaquette2009). Feminism, often spearheaded by university students or emerging within political parties, resurged in the 2010s. Feminists in Mexico and Brazil have organized to advance reproductive rights with varying degrees of success (Zaremberg and Almeida Reference Zaremberg and de Almeida2022). University students protested throughout Chile in 2018 against gender violence and sexism in education (Disi Pavlic et al. Reference Disi Pavlic, Paredes, Reyes-Housholder, Joignant and Somma2024; Reyes-Housholder and Roque Reference Reyes-Housholder and Roque2019).
Feminist achievements in Latin America are uneven and subject to contestation and reversals. Feminist movements in countries such as Peru and Paraguay appear less effective in shaping public policy. Relatively successful feminist movements in Mexico, Brazil, Argentina, and Chile have faced diverse forms of backlash (Biroli and Caminotti Reference Biroli and Caminotti2020; Zaremberg et al. Reference Zaremberg, Tabbush and Friedman2021). Radical populist leaders, who criticize feminist advances, have often promised to help restore traditional gender roles (Aguiar and Pereira Reference Aguiar and Pereira2019). Feminists in Latin America, in turn, have often mobilized against these perceived threats.
We theorize three ways in which feminism could affect presidential vote choice in Latin America, thereby helping to explain why women and men would vote for different candidates. First, women may be more likely to have a feminist consciousness (Kirkwood Reference Kirkwood1986, 21–38) and, consequently, prefer candidates whose discourse appeals to feminist voters (Conover Reference Conover1988; Simien et al. Reference Simien, Hayes and Conway2024; Winfrey and Williams Reference Winfrey and Williams2018, 7). Winfrey and Williams (Reference Winfrey and Williams2018) build on Conover’s (Reference Conover1988) work to develop a theory of group identification as an explanation for political attitudes and behavior. Women’s ‘group identification means that they feel a similarity to other women and a connection through shared concerns’, and this can lead women to vote for female candidates, for example, not just ‘because they are women’ but because of their group identification (Winfrey and Williams Reference Winfrey and Williams2018, 32). They argue that group identification leads to gender or feminist consciousness for many, but not all, women. We argue that, since women may be more likely than men to develop a feminist consciousness, they will be more likely to vote for candidates they perceive as feminist or against candidates they perceive as threatening to feminism.
Second, women may support feminist policies more than men (Conover Reference Conover1988; Winfrey and Williams Reference Winfrey and Williams2018, 8–10; Zaremberg and Almeida Reference Zaremberg and de Almeida2022). Feminist consciousness leads to distinct attitudes and political behavior in the United States (Winfrey and Williams Reference Winfrey and Williams2018, 43). This could happen even in the absence of self-identification as feminists. Consequently, women may be more likely to vote for presidential candidates who support feminism or promise feminist policy change.
A third way in which voters’ feminism could lead to differences in women’s and men’s preferences for presidential candidates refers to desires for certain traits in political leaders. Feminists, especially those in countries where women mobilized against authoritarian regimes (Jaquette Reference Jaquette1994; Kirkwood Reference Kirkwood1986), may prefer presidential candidates who are more democratic and less authoritarian (Conover Reference Conover1988). Potentially influenced by maternal feminism (Alvarez Reference Alvarez1990, 43–70; Jaquette Reference Jaquette1994, 223–28; Ruddick Reference Ruddick1989), feminists also might prefer horizontal or stereotypically feminine leadership, moving them to push back against authoritarian rhetoric, which may characterize some populist or far-right leaders (Mudde and Kaltwasser Reference Mudde and Kaltwasser2015). In sum, women may be more likely than men to prefer candidates who they perceive as feminist, candidates who promote feminist policies, and candidates who display democratic leadership. Because of their feminism, women may also be more likely to vote against presidential candidates they view as threatening or thwarting feminist advances.
We therefore expect feminism to directly affect vote choice, above and beyond ideology. Yet ideology and feminism are also often linked, and their relationships may depend on historical or cultural context. During recent decades, leftists and feminists in many parts of the world have tended to advocate for economic and social equality. Feminist voters may prefer candidates who support greater state intervention in the economy, regardless of whether the candidate explicitly promotes feminism. Some of the recent feminist protests and demands in Latin America appear to overlap with progressive agendas (Disi Pavlic et al. Reference Disi Pavlic, Paredes, Reyes-Housholder, Joignant and Somma2024; López Ricoy Reference López Ricoy2021; Reyes-Housholder and Roque Reference Reyes-Housholder and Roque2019; Zaremberg and Almeida Reference Zaremberg and de Almeida2022). Vocal far-right leaders, espousing anti-feminism, often lambast contemporary feminist movements.
While the direct effects of ideology and feminism on sex gaps in presidential vote choice remain our focus, we theorize a bi-directional link between ideology and gendered personalities (see Figure 1). If leftists and feminists both seek to prioritize egalitarian principles, then voters who lean to the left may also be more inclined to identify as feminists and hold feminist attitudes. This underscores the value of theoretically and empirically parsing out the roles of ideology and feminism. Because these independent variables may be related, studies of sex gaps which do not measure voters’ feminism will likely overestimate the impact of ideology in explaining women’s and men’s electoral differences. Such research would obscure whether it is left–right ideological orientations that explain sex gaps in vote choice or feminist identities and ideals.
Gendered Personalities: Masculine and Feminine
Finally, we theorize how voters’ gendered personalities could contribute to sex gaps in presidential vote choice in Latin America. Gendered personalities and political behavior scholarship builds on psychologist Bem’s (Reference Bem1974, Reference Bem1977) understanding of traits idealized in men and women. Gendered personalities imperfectly correlate with individuals’ identifications as women or men. While women may possess personality traits that are associated with women, such as compassion, more than men, not all women do. Conversely, while men may possess attributes associated with men, such as independence, not all men do. Bem innovated in measuring masculinity and femininity on different scales, allowing individuals to identify traits in themselves that are associated with men and traits that are associated with women or neither (Bem Reference Bem1974, Reference Bem1977).
The scholarship applying theories of gendered personalities to political behavior, to date, has focused almost entirely on advanced industrialized countries. This work argues that voters with masculine or feminine personality traits may prefer parties whose platforms, reputations, and candidates align with, promote, or embody such traits (Coffé Reference Coffé2019, 171; Hatemi et al. Reference Hatemi, McDermott, Bailey and Martin2012; Karpowitz et al. Reference Karpowitz, Monson, Preece and Aldridge2024; McDermott Reference McDermott2016; McDermott and Cassino Reference McDermott and Cassino2025). McDermott uses Bem’s short form sex inventory to classify US voters as masculine, feminine, androgynous (individuals with high quantities of both masculine and feminine traits) or undifferentiated (individuals with few masculine and feminine traits). Her nationally representative surveys reveal that these classifications predict partisan vote choice better than voters’ sex (McDermott Reference McDermott2016; Oliver and Conroy Reference Oliver and Conroy2020). Newer studies show that masculinity pervades US presidential politics (Karpowitz et al. Reference Karpowitz, Monson, Preece and Aldridge2024; McDermott and Cassino Reference McDermott and Cassino2025). Hilde Coffé (Reference Coffé2019) leveraged the Dutch Longitudinal Internet Studies for the Social Sciences, which employs Bem’s Sex Role Inventory, to test how gendered personalities affect electoral preferences. While respondents’ femininity had no impact, masculinity increased support for the radical populist right. Another study showed that gender identity based on childhood behavior and self-perceptions of masculinity and femininity influences voter preferences for Labor and Conservative parties in Australia (Hatemi et al. Reference Hatemi, McDermott, Bailey and Martin2012).
Latin America’s cultural history of machismo and marianismo, deeply debated and passionately contested (Navarro Reference Navarro, Montoya, Frazier and Hurtig2002), may inspire an expectation that voters’ gendered personalities influence presidential vote choice in this area of the world. Voters may be drawn to candidates who demonstrate gendered leadership styles congruent with their own gendered personalities. Latin American women seem to prefer women presidential candidates (Morgan Reference Morgan, Carlin, Singer and Zechmeister2015; Reyes-Housholder Reference Reyes-Housholder2019), but perhaps this relates more to gendered traits than to sex identification: more feminine voters may prefer candidates who demonstrate more feminine traits, such as compassion. More masculine voters in Latin America may prefer candidates with more masculine traits, such as independence. Masculinity may matter more than femininity in presidential elections because the presidency remains a preeminently masculine arena of power (Conroy Reference Conroy2016; Duerst-Lahti Reference Duerst-Lahti, Carroll and Fox2014; Reyes-Housholder and Thomas Reference Reyes-Housholder, Thomas and Schwindt-Bayer2018).
On the other hand, gendered personalities – as conceptualized by Bem’s followers – may not help explain sex gaps in Latin America. Bem’s instruments have mostly been tested and validated in the United States. It is not clear that Latin American voters think about masculine and feminine personality traits in the same ways. Latin America’s diverse feminist movements during the twentieth and twenty-first centuries could have shaped or eroded cultural conceptions of masculinity and femininity. Even if the conceptualization of gendered personalities is similar in regions of the world, it still may not be the case that they would predict presidential vote choice. Latin America’s volatile, multiparty systems may not map onto a neat and tidy masculine–feminine dichotomy as they do in stable two-party systems, such as the United States and Australia.
If gendered personalities do help explain sex gaps in vote choice, this would be most evident in contexts of polarized elections featuring far-right contenders for president. Latin Americans with more masculine personalities would be more likely to support presidential candidates with traditionally masculine leadership styles who promote conservative agendas centering on law and order or celebrating individuals’ autonomy. Those with more feminine personalities would be more likely to support candidates with progressive agendas that focus on compassion issues and social welfare and candidates who are less ideologically extreme.
While the direct effects of gendered personalities on vote choice remain our main line of argumentation, ideology and gendered personalities could relate to each other. McDermott (Reference McDermott2016, 65–66) theorizes how gendered personalities affect three dependent variables: vote choice, left–right ideology, and US party identification. She finds that those with feminine personalities tend to vote for Democrats, express more left-leaning ideologies, and identify with the Democratic Party. Conversely, those with masculine personalities tend to vote for Republicans, express more conservative ideologies, and identify with the Republican Party (2016, 57–81). Building upon McDermott’s (Reference McDermott2016, 66) work, those from the left may be more likely to prioritize ‘compassion’ issues. Individuals who describe themselves as compassionate – a trait idealized in women – may also be more likely to hold progressive political preferences and vote for candidates promoting compassion issues. Conversely, those with masculine personalities tend to embody, among other traits, ‘toughness and independence’ (McDermott Reference McDermott2016, 66), which may lead them to prefer less state intervention and greater individual freedoms. Those with ‘tough’ personalities may be more likely to think that they – and others – do not need the social safety nets that those on the left often seek to expand.Footnote 3 Ideology and gendered personalities may thereby relate to each other. Failing to consider one of these determinants could lead to an overestimation of the effect of the other determinant on sex gaps in presidential vote choice.
In sum, we expect that voters’ sex, ideology, feminism, and gendered personalities will influence their presidential vote choice. We moreover expect that ideology, feminism, and gendered personalities will help explain why women and men vote for different presidential candidates (that is, explain sex gaps in voting). Improvements in women’s status in the region, coupled with fresh waves of feminist movements, move us to anticipate that Latin American women will tend to vote for more progressive candidates than men.
Gender and Presidential Vote Choice in Chile, Brazil, and Argentina
We examine sex gaps in presidential vote choice in recent run-off elections in Chile, Brazil, and Argentina. These races feature man versus man competitions in countries where women had previously won presidential elections: Michelle Bachelet in Chile in 2006 and 2013; Dilma Rousseff in Brazil in 2010 and 2014; and Cristina Fernández in Argentina in 2007 and 2011. Scholars have revealed ways in which gender matters when women are running for president in Latin America (dos Santos and Jalalzai Reference dos Santos and Jalalzai2021; Franceschet et al. Reference Franceschet, Piscopo and Thomas2016; Hinojosa Reference Hinojosa2010; Piscopo Reference Piscopo and Murray2010; Reyes-Housholder Reference Reyes-Housholder2018; Thomas Reference Thomas2011), so focusing on all-male presidential elections allows us to hold that constant.
We study second-round elections because they provide a clearer comparison of vote choice for candidates who vary on our theorized explanations for sex gaps: ideology, feminism, and gendered personalities. Run-offs allow us to better test our theory because citizens in these rounds often vote against a particular candidate. This is important because presidential elections are often won and lost according to negative reactions against major candidates. We are less interested in measuring voters’ true preferences for a candidate, which is better observed in the first round. Additionally, second rounds in multiparty systems are more comparable to two-party presidential systems with just one round, such as the United States.
We selected match-ups where leftist or centrist men candidates competed against far-right men who held divergent positions on feminism. Then-deputy Gabriel Boric of the Convergencia Social Party, known for his leadership in Chile’s student movement, ran an explicitly feminist campaign (‘Camila Vallejo lidera programa de género de Boric’ 2021). Later referred to as the first feminist president in Latin America (Montes Reference Montes2022), Boric advocated for the expansion of reproductive rights and enjoyed solid backing from feminist organizations (Paredes Reference Paredes2021). Leader of the Partido Republicano, the ultra-conservative Catholic José Antonio Kast, promoted traditional gender roles, privileging the nuclear family in his platform. Chilean feminists criticized his proposals for essentializing women’s identities as mothers (Espinoza C Reference Espinoza2021). The two candidates clashed in a radio presidential debate in December 2021 when Boric challenged Kast on his opposition to progressive feminist reforms (Relájate 2021).
The 2022 round in Brazil also featured ideologically polarized candidates who clashed on gender issues. Luiz Inácio Lula da Silva’s center-left campaign did not consistently promote feminism, but Brazilian feminists often considered him a potential ally, given the role of feminist thought historically within his Partido dos Trabalhadores (PT) (Godinho Reference Godinho, Borba, Faria and Godinho1998; Macaulay Reference Macaulay2006). Jair Bolsonaro in 2018 continued a trend in conservative candidates winning the presidential elections in Latin America, but he stands out as the region’s first elected populist of the radical right, uniting the characteristics of populism, nativism, and authoritarianism (Tanscheit Reference Tanscheit2023). Bolsonaro distinguished himself as president by lashing out against ‘gender ideology’ and feminist and LGBTQ advances (Brioli and Tatagiba Reference Brioli and Tatagiba2023). Bolsonaro voters in 2018 and 2022 tended to resent the PT, support extreme law and order approaches to crime, and embrace economic liberalism (Rennó Reference Rennó2020, Reference Rennó2022; Tanscheit and Barbosa Reference Tanscheit and Barbosa2023).Footnote 4 Bolsonaro supporters also tended to be Catholic or evangelical and hold anti-abortion views (Brioli and Tatagiba Reference Brioli and Tatagiba2023).
Compared to Chile and Brazil, Argentina’s second round arguably was less polarized in terms of ideology and feminism. Despite past inconsistencies in his ideological stances, Sergio Massa appeared in 2023 as a centrist candidate with expertise in economics and security but not gender (Rivas Molina Reference Rivas Molina2023). With weaker feminist credentials than Boric’s, Massa did participate in the incumbent administration that legalized abortion in Argentina for the first time in 2020. Milei, in contrast, campaigned on a referendum to eliminate women’s new right to an abortion and the women’s ministry (Brigida Reference Brigida2023). Milei also denied the existence of wage gaps between men and women (Macor Reference Macor2023). Milei’s anti-feminist positions may have helped him shore up men’s support (Djankov and Lehmann Reference Djankov and Lehmann2023). Massa tried to use the ‘feminist card’ against Milei, presumably to energize women voters (Cuesta Reference Cuesta2023).
Finally, these candidates’ leadership styles sometimes diverged in gendered ways. Whereas the left-leaning candidates cultivated empathetic leadership styles that emphasized compassion issues and historically marginalized groups, the far-right contenders featured leadership styles corresponding to Bem’s idealized masculine traits. Candidate differences in gendered leadership styles were most evident in Chile, where Boric had re-emerged as a national figure with his participation in the 15 November peace agreement during the height of Chile’s uprising (Piérola Reference Piérola2019). His campaign and platform prioritized consensus-building and decentralization of power. Alluding to Pinochet’s hyperpresidentialist constitution, Boric reiterated his desire to leave the presidency as an institution with reduced formal power. He deployed maternal language in his campaign; for example, using the term ‘tenderness’ and emphasizing the importance of listening to diverse political actors. In contrast, Kast ran a stereotypically masculine campaign, promising to restore the law and order characteristic of Chile before the social uprising (Montes Reference Montes2021; Reyes-Housholder et al. Reference Reyes-Housholder, Suárez-Cao and Le Foulon2023). His campaign slogan, emphasizing masculine risk-taking, was ‘Atrévete por el future de Chile’, roughly translated as ‘Dare for the future of Chile’.
The 2022 Brazilian race also featured male candidates with contrasting, gendered leadership styles. Since his ‘peace and love’ campaign in 2002, during which he moderated his policy stances (Hunter Reference Hunter2010), Lula has emphasized compassion for historically marginalized groups. Bolsonaro, on the other hand, exuded a traditionally masculine leadership style through his embrace of the military and authoritarianism (Tanscheit Reference Tanscheit2023) as well as his ‘macho’ approach to the 2020 pandemic (Dembroff Reference Dembroff2020). Milei, in Argentina, embraced fiery, anti-establishment rhetoric to draw in young, male voters (Calvo et al. Reference Calvo, Kessler, Murillo and Vommaro2024), whereas MassaFootnote 5 was more toned down in his masculinity. Masculine traits of confrontation and aggression particularly characterize Bolsonaro and Milei.
In short, gender issues were salient in each of these all-male rounds of presidential voting. Boric, Lula, and Massa leaned towards the left and center and advocated for feminist policies to varying degrees. Kast, Bolsonaro, and Milei adhered to the far right and represented populist parties that advocated against feminist advances, especially reproductive rights, and for the return of traditional gender roles.
Research Design
We designed online surveys to test our theory of sex gaps in presidential vote choice in the 2021 Chilean, 2022 Brazilian, and 2023 Argentinian presidential elections. Original surveys were necessary because major cross-national surveys such as LAPOP and Latinobarometer rarely measure ‘gender’ in any way other than a respondent’s sex and often are not fielded close enough to elections for scholars to meaningfully measure vote choice.Footnote 6 These countries’ electoral systems stipulate that if no candidate wins more than a specific percentage of the vote in the first round, the top two candidates advance to a second round. The run-off election occurs about a month after the first round.
Voter registration was automatic, but voting was not compulsory in this Chilean election – 55.7 per cent of registered voters went to the polls for the second round in Chile (Servicio Electoral de Chile 2022). Voting in Brazil was compulsory with minimal sanctions for non-compliance – 79.4 per cent of registered voters participated in Brazil’s second presidential round (International IDEA 2022). Voting was also compulsory in Argentina, with fines of up to 500 pesos assessed to non-voters – turnout was 77.7 per cent of registered voters (‘IFES Election Guide | Elections: Argentinian Presidency 2023 Round 2’ 2023).
We fielded the Chile survey with Netquest during June and July 2022 with a sample size of approximately 1,500 respondents. This survey was six months after the election so our dependent variable is retrospective voting, specifically whether Chileans said they voted for Boric (1) or Kast (0) in the second round of the presidential election on 19 December 2021. We fielded the Brazilian and Argentine surveys with Netquest during the weeks between the first- and second-round elections in October 2022 and November 2023, respectively. The Brazilian survey had a sample size of approximately 1,500 respondents, whereas the Argentine survey featured close to 2,000 respondents.Footnote 7 Our dependent variable in Brazil and Argentina is vote intention, specifically whether Brazilians said they would vote for Lula (1) or Bolsonaro (0) in the second round of the presidential election on 30 October 2022, and whether Argentines said they would vote for Massa (1) or Milei (0) in the second round on 19 November 2023. This strategy enables us to study both retrospective and prospective vote choices, potentially enhancing the generalizability of our findings.Footnote 8
We measure sex gaps in voting via the estimated coefficient of vote choice regressed on a respondent’s sex. We coded women respondents as 1 and men as 0, using Netquest’s demographic information.Footnote 9 Our main independent variables are ideology, feminism, and gendered personalities.Footnote 10 Scholars measure ideology in a variety of ways. Inglehart and Norris (Reference Inglehart and Norris2003, 81) use World Values Survey questions that feature a scale of preferences for state intervention for social protection and safety net. Left and right ideology alternatively could refer to stances on ’social’ issues: for example, being liberal on reproductive rights and gay marriage. Iversen and Rosenbluth (Reference Iversen and Rosenbluth2006, 13–14) measure ideology with the International Social Survey Program’s question about the role of government spending and policy. We conceptualize and measure ideology in similar ways as the Eurobarometer, AmericasBarometer, and Latinobarometer; that is, we asked respondents to place themselves on a 1–10 ideological scale (left to right), with no prompting on whether this scale refers to economic or social dimensions.
We measure feminism in two ways. First, we asked respondents whether they considered themselves to be ‘feminist’. We coded the feminist self-identification variable with ‘yes’ responses as 1 and ‘no’ responses as 0. Second, we measured feminist attitudes by asking respondents to say how strongly, on a 5-point scale, they agreed with the following six statements: ‘When there are not many jobs available, men should have greater rights to a job than women’; ‘It is more important to educate boys than girls’; ‘Men make better political leaders than women’; ‘Men make better business executives than women’; ‘It is okay if a woman is paid less than a man for the same work’; and ‘Women should have the same rights as men’. We created an additive index from their responses on a 5-point scale from ’strongly agree’ to ’strongly disagree’, inverted it so that higher values are more feminist, and then standardized it on a scale from 0 to 1.Footnote 11 These two measures of feminism are related but are by no means identical, conceptually or empirically.Footnote 12 Self-identified feminism is a stronger statement of feminism than how much one agrees with the survey questions on feminist attitudes. Measuring feminism in both ways allows us to explore nuances in support for feminism and how it affects vote choice.
We measured gendered personalities in the same way as McDermott (Reference McDermott2016). We translated Bem’s short version of the sex-role inventory questionnaire to Spanish and Portuguese with the help of native speakers (see Appendix for translations). Our survey question asked respondents to rate themselves on twenty personality traits (ten that are stereotypically feminine and ten that are stereotypically masculine on a scale of 1 (never or almost never true about them) to 7 (always or almost always true about them). We averaged scores for each respondent of their answers on the feminine traits for the feminine variable and masculine traits for the masculine variable.Footnote 13
We include control variables in our models to account for possible confounders. We coded social class in all three countries using Netquest’s classification of socio-economic status (SES), yielding a variable ranging from 1 (low SES) to 6 (high SES). We coded education in Brazil and Argentina from a question using a 1–10 scale, from no education to post-graduate.Footnote 14 Netquest’s demographic data included respondents’ age, which is important because the results were not always representative of age, and we know that gendered attitudes and voting preferences can vary systematically according to this variable.Footnote 15 Vote preferences also vary with political interest, and Latin American women may be less politically interested than men (Hinojosa and Kittilson Reference Hinojosa and Kittilson2020). We consequently control for political interest with the following question: ‘How interested were/are you in politics during the presidential election?’ Possible responses were very interested (4), somewhat interested (3), a little interested (2), and not interested at all (1). All analyses are regression models (logit or OLS) predicting presidential vote choice with robust standard errors.Footnote 16
Results
Overall, we show that significant sex gaps in presidential voting preferences occurred in Chile, Brazil, and Argentina, with women being more likely to support Boric, Lula, and Massa than men.Footnote 17 Our results also reveal that these gaps are most often explained by feminism and, to a lesser extent, ideology. Gendered personalities are rarely statistically significant.
Sex Gaps in Chile, Brazil, and Argentina
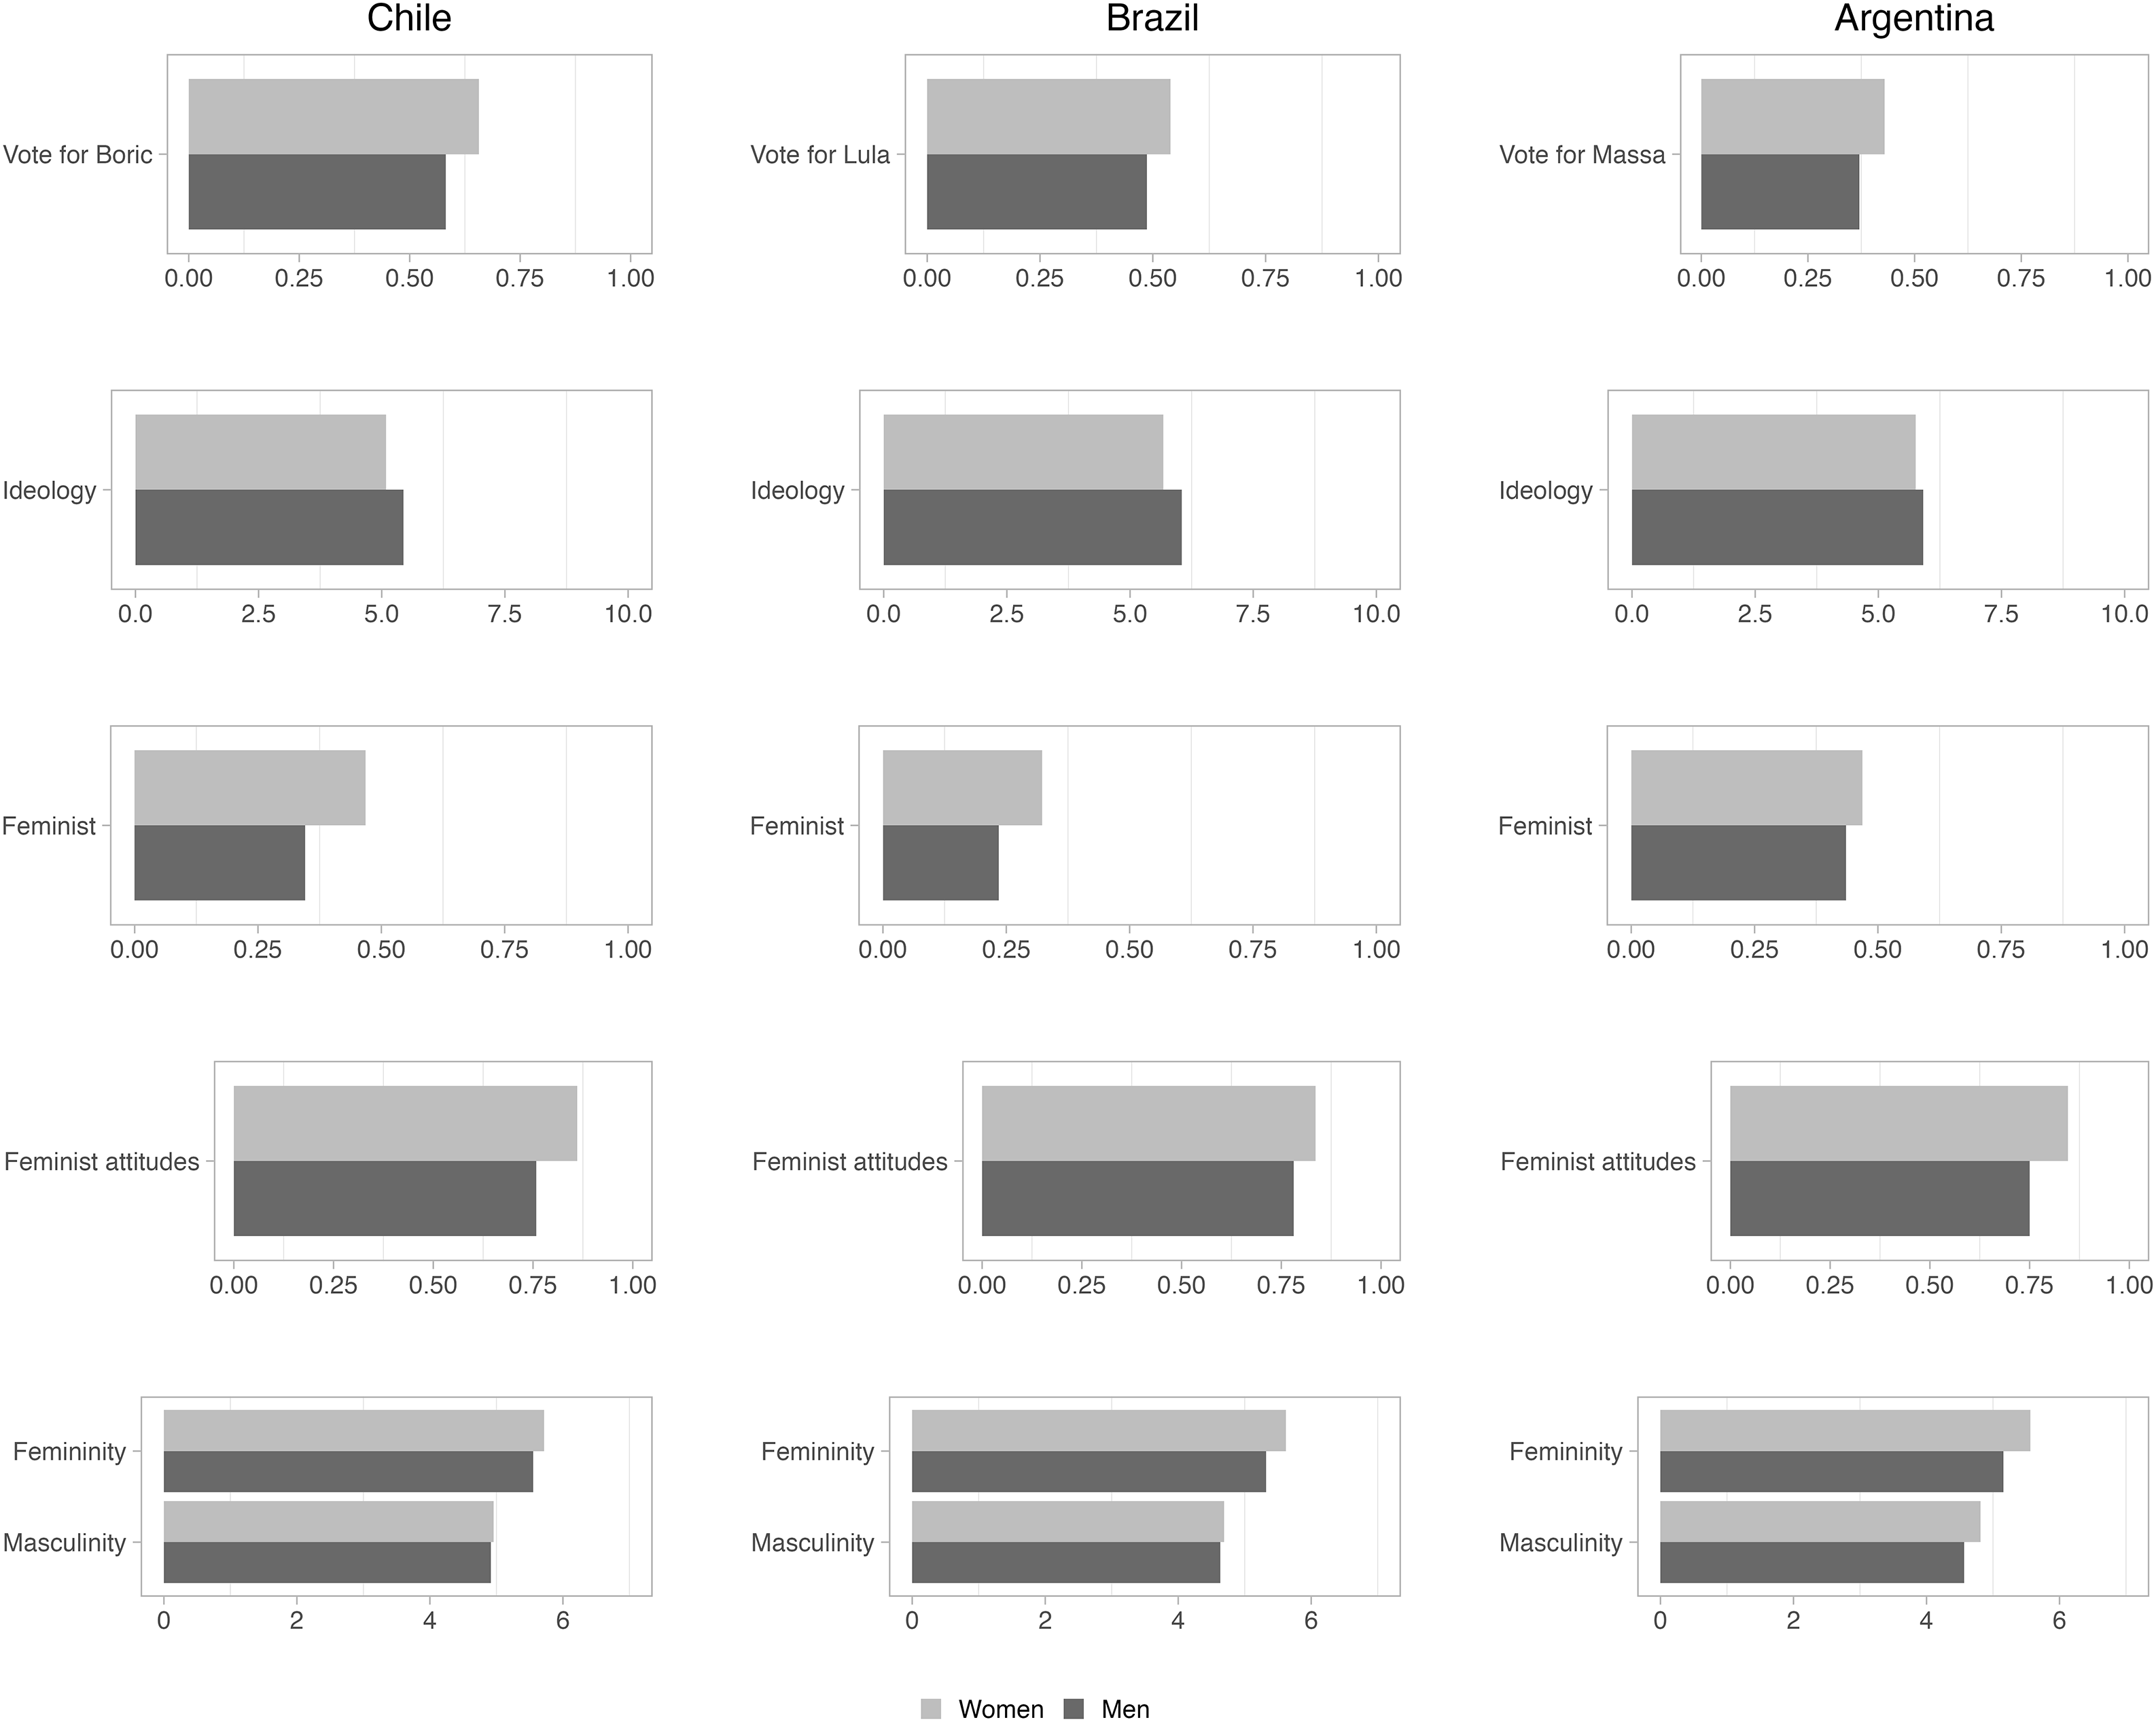
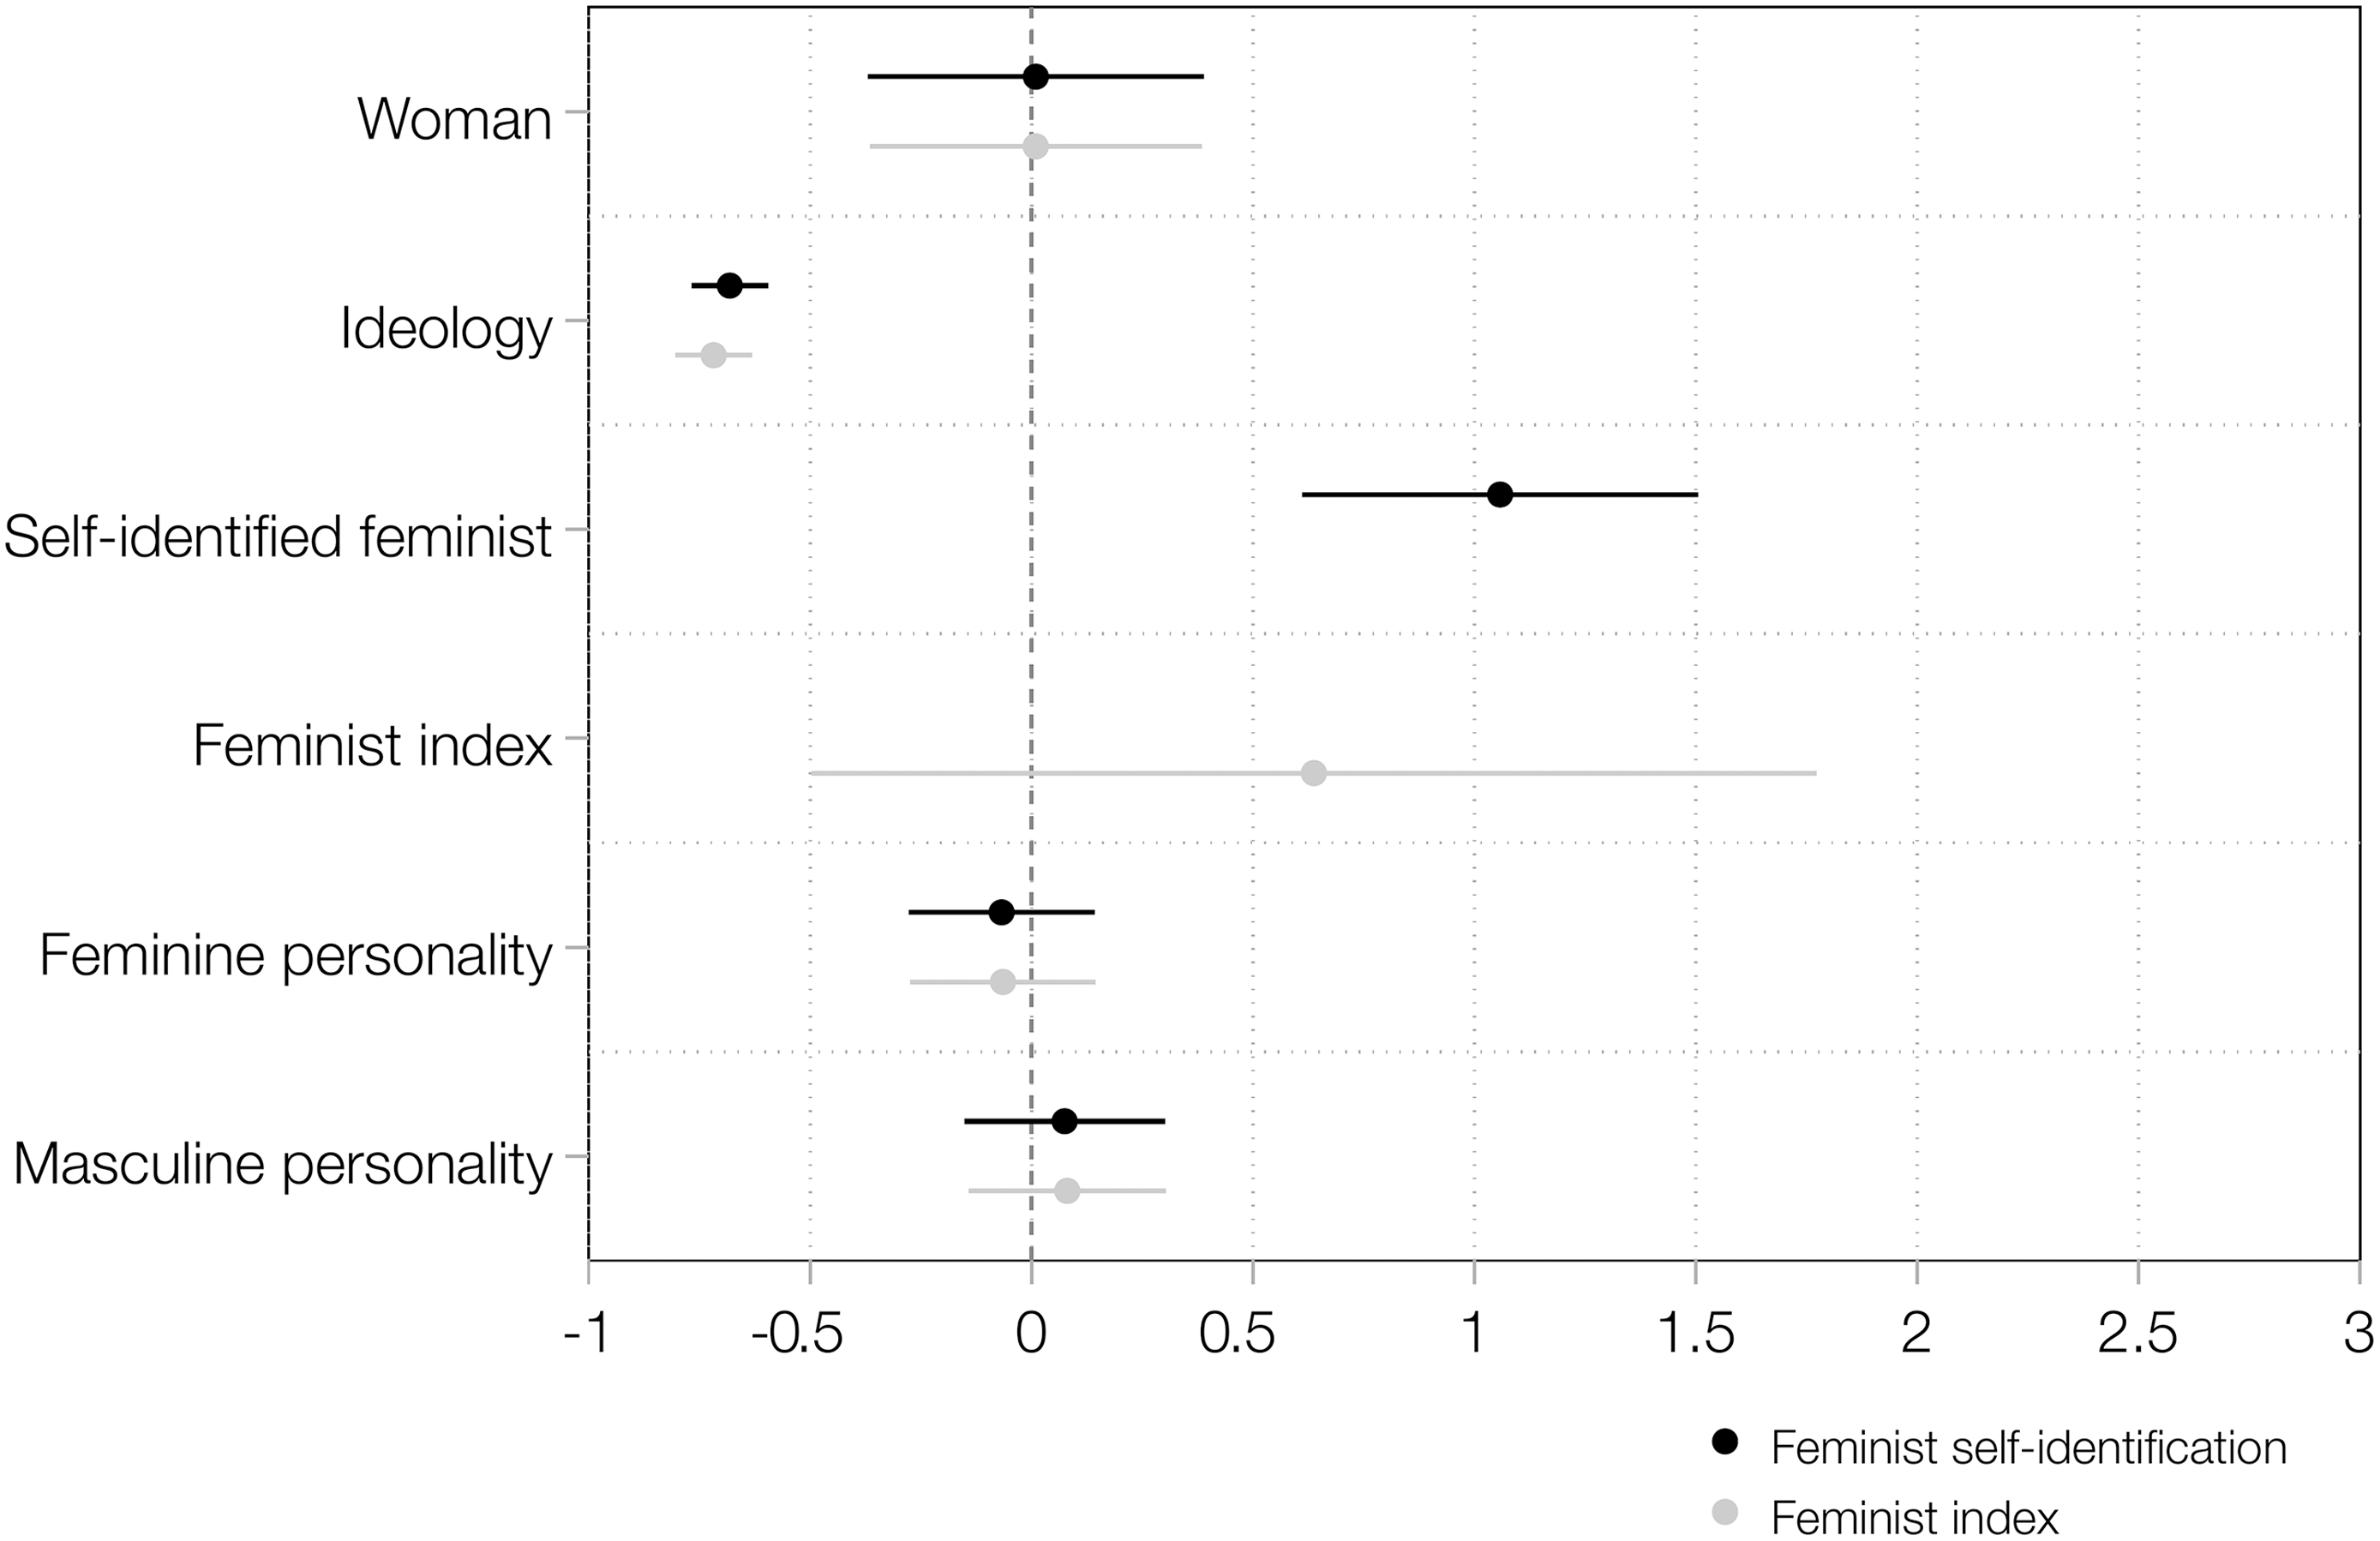
Figure 2 shows sex gaps of the dependent and independent variables in each country. Consistent with our expectations, modern sex gaps appear in all three countries. The gaps are 8 per cent in Chile, 5 per cent in Brazil, and 6 per cent in Argentina, with controls included in the models. The raw sex gap in Brazil is 8.8 per cent, in models without controls. All gaps are statistically significant and map onto those detected by other major, publicly available polls fielded just prior to the second round of voting.Footnote 18
Sex gaps in Chile, Brazil, and Argentina.
Note: panels show the predicted gap in each variable from regression models controlling for socio-economic status, age, political interest, and education (where available). All other variables are held at their means * p < 0.1, ** p < 0.05, *** p < 0.01.

Figure 2 also shows that women in Chile and Brazil self-identified as feminists more than men and expressed significantly more left-leaning ideologies than their male counterparts. However, Argentine women and men did not self-identify as feminists at significantly different rates, and they expressed statistically similar ideologies.Footnote 19 Women in all these countries expressed stronger feminist attitudes than their male counterparts, and they possessed more feminine personalities than the men did. However, women and men in Chile and Brazil scored similarly on masculinity, and contrary to expectations, Argentine women scored higher on masculinity than men. This suggests that Latin Americans may not think about gendered personality traits in the same ways as voters in the United States or Australia do.
The Appendix provides correlation matrices that illustrate how ideology correlates with feminism and gendered personalities. Ideology and feminism are most strongly correlated in Brazil at r = −0.38 for feminist self-identification and r = −0.30 for the feminist index. In Chile, the correlation is r = −0.28 and r = −0.25, respectively, and in Argentina, it is r = −0.26 and r = −0.19. Ideology and gendered personalities never correlate higher than r = 0.06 in any country. Ideology thereby appears less likely to operate through gendered personalities to affect vote choice, but the closer association between ideology and feminism highlights the need to explore how they each affect sex gaps in presidential voting independently.
Explanations for Sex Gaps in Retrospective Voting in Chile
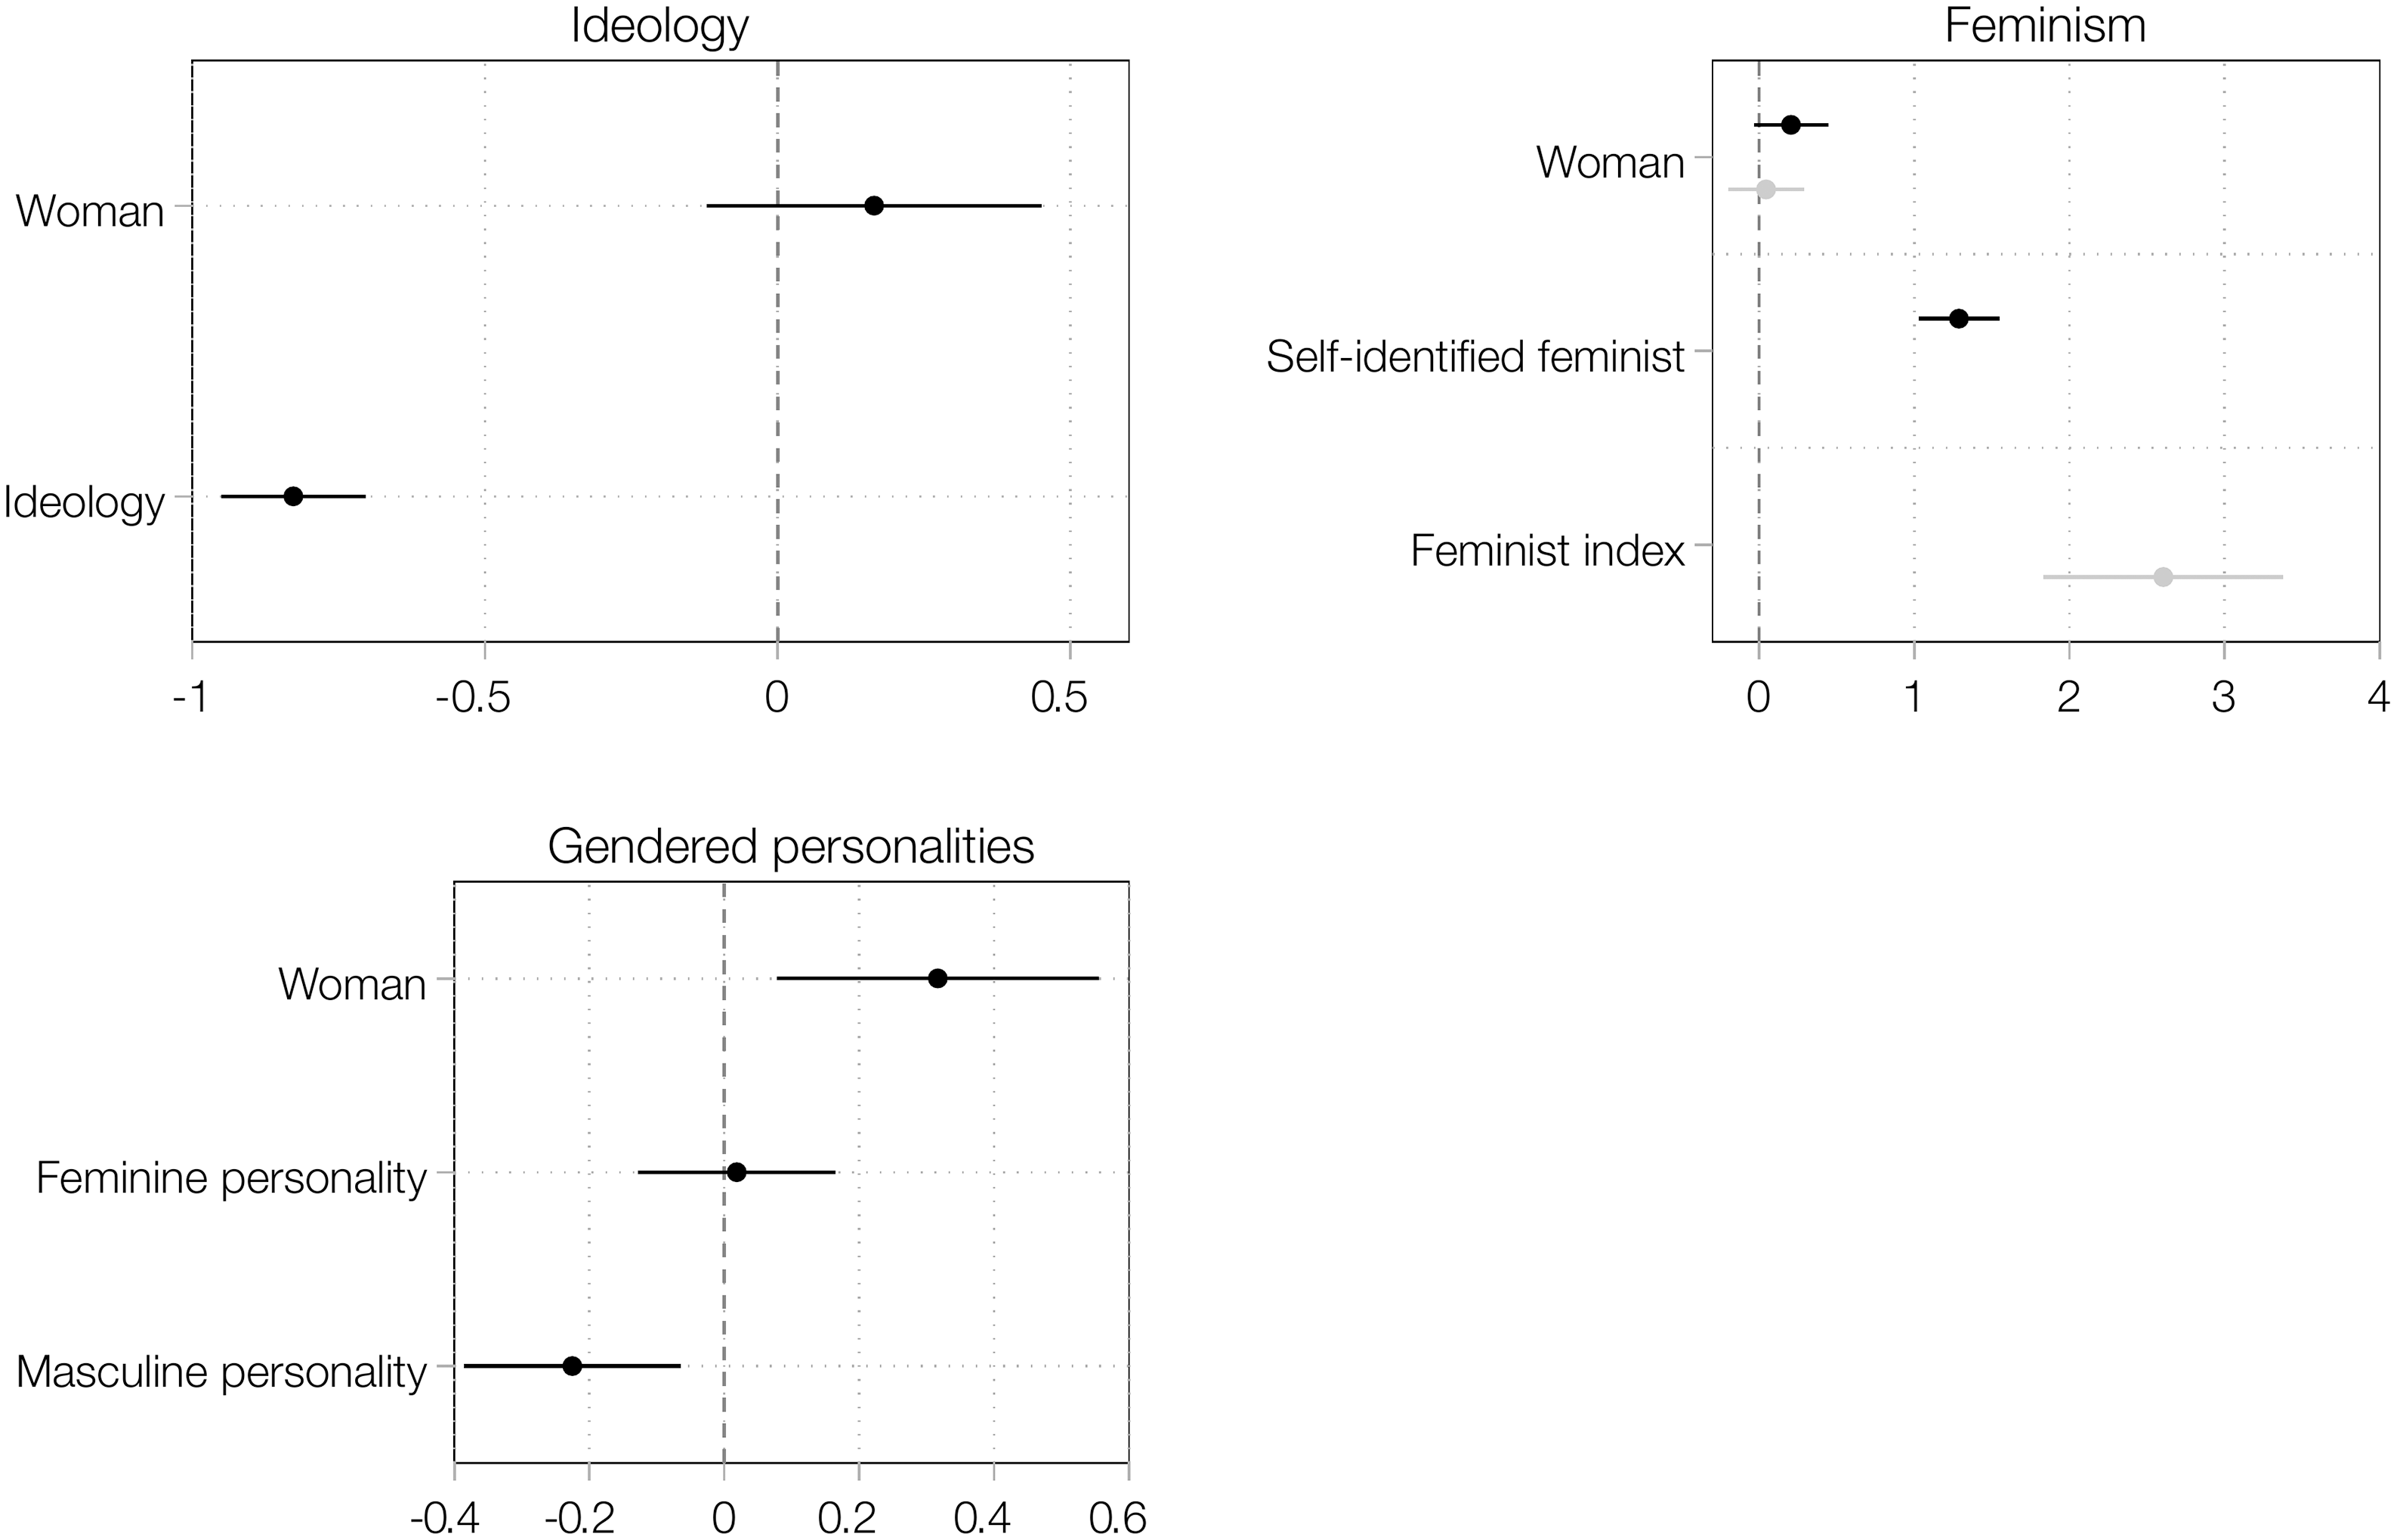
Figure 3 plots the results of four models of retrospective voting in Chile that estimate associations of ideology, feminism (self-identified feminists and feminist attitudes index), and gendered personalities (masculine and feminine) alongside the sex of the respondent. The goal of these models is to explore whether the significance of respondent sex shrinks or becomes insignificant once our theorized explanations are accounted for. If it does, this indicates that the theorized variable is an explanation for the sex gaps because sex, in and of itself, is no longer a significant predictor of vote choice. Figure 3 reports the results of models that incorporate the theorized explanations individually, so we can isolate how each factor works alongside respondent sex. Figure 4 reports the results of models with all theorized explanations included together to observe how they work together additively in the model.
Explanations for sex gaps in voting for Boric versus Kast in Chile.
Note: each panel shows estimated logit coefficients from a different statistical model. Models control for socio-economic status, age, and political interest. Horizontal lines denote 95 per cent confidence intervals.

Full models for sex gaps in Boric versus Kast vote.
Note: the figure shows estimated logit coefficients predicting vote for Boric instead of Kast with all variables in the same model. Models control for socio-economic status, age, and political interest. Horizontal lines denote 95 per cent confidence intervals.

Figure 3 shows that ideology and feminism both explain the sex gap in choosing Boric over Kast. The sex gap becomes statistically insignificant once ideology is accounted for, and right-leaning ideology has a negative effect on voting for Boric instead of Kast, as would be expected. Feminism, measured as self-identified feminism and feminist attitudes, strongly and positively correlates with voting for Boric versus Kast, and their inclusion in the models yields insignificant voting differences between men and women. Gendered personalities do not explain sex gaps in presidential vote choice. After accounting for gendered personalities, we find that women were still significantly more likely to say they voted for Boric rather than Kast, and being more feminine did not affect voting. However, being more masculine does mean Chileans were less likely to report voting for Boric over Kast (but it doesn’t explain away the sex gap).
Figure 4 presents models with all explanations included together – one model for self-identified feminists and one for respondents with feminist attitudes. Findings are similar for both models. The sex gap is almost nil once all explanations are included in the models. Ideology is strongly negative, with rightists being significantly less likely to say they voted for Boric and more likely to say they voted for Kast, even after accounting for feminism. Feminists, both self-identified feminists and those with feminist attitudes, were significantly more likely to say they voted for Boric over Kast, even after accounting for the fact that feminists are more leftist (r = −0.28 and r = −0.26, per the correlation matrix in the Appendix). Neither measure of gendered personalities is significant.
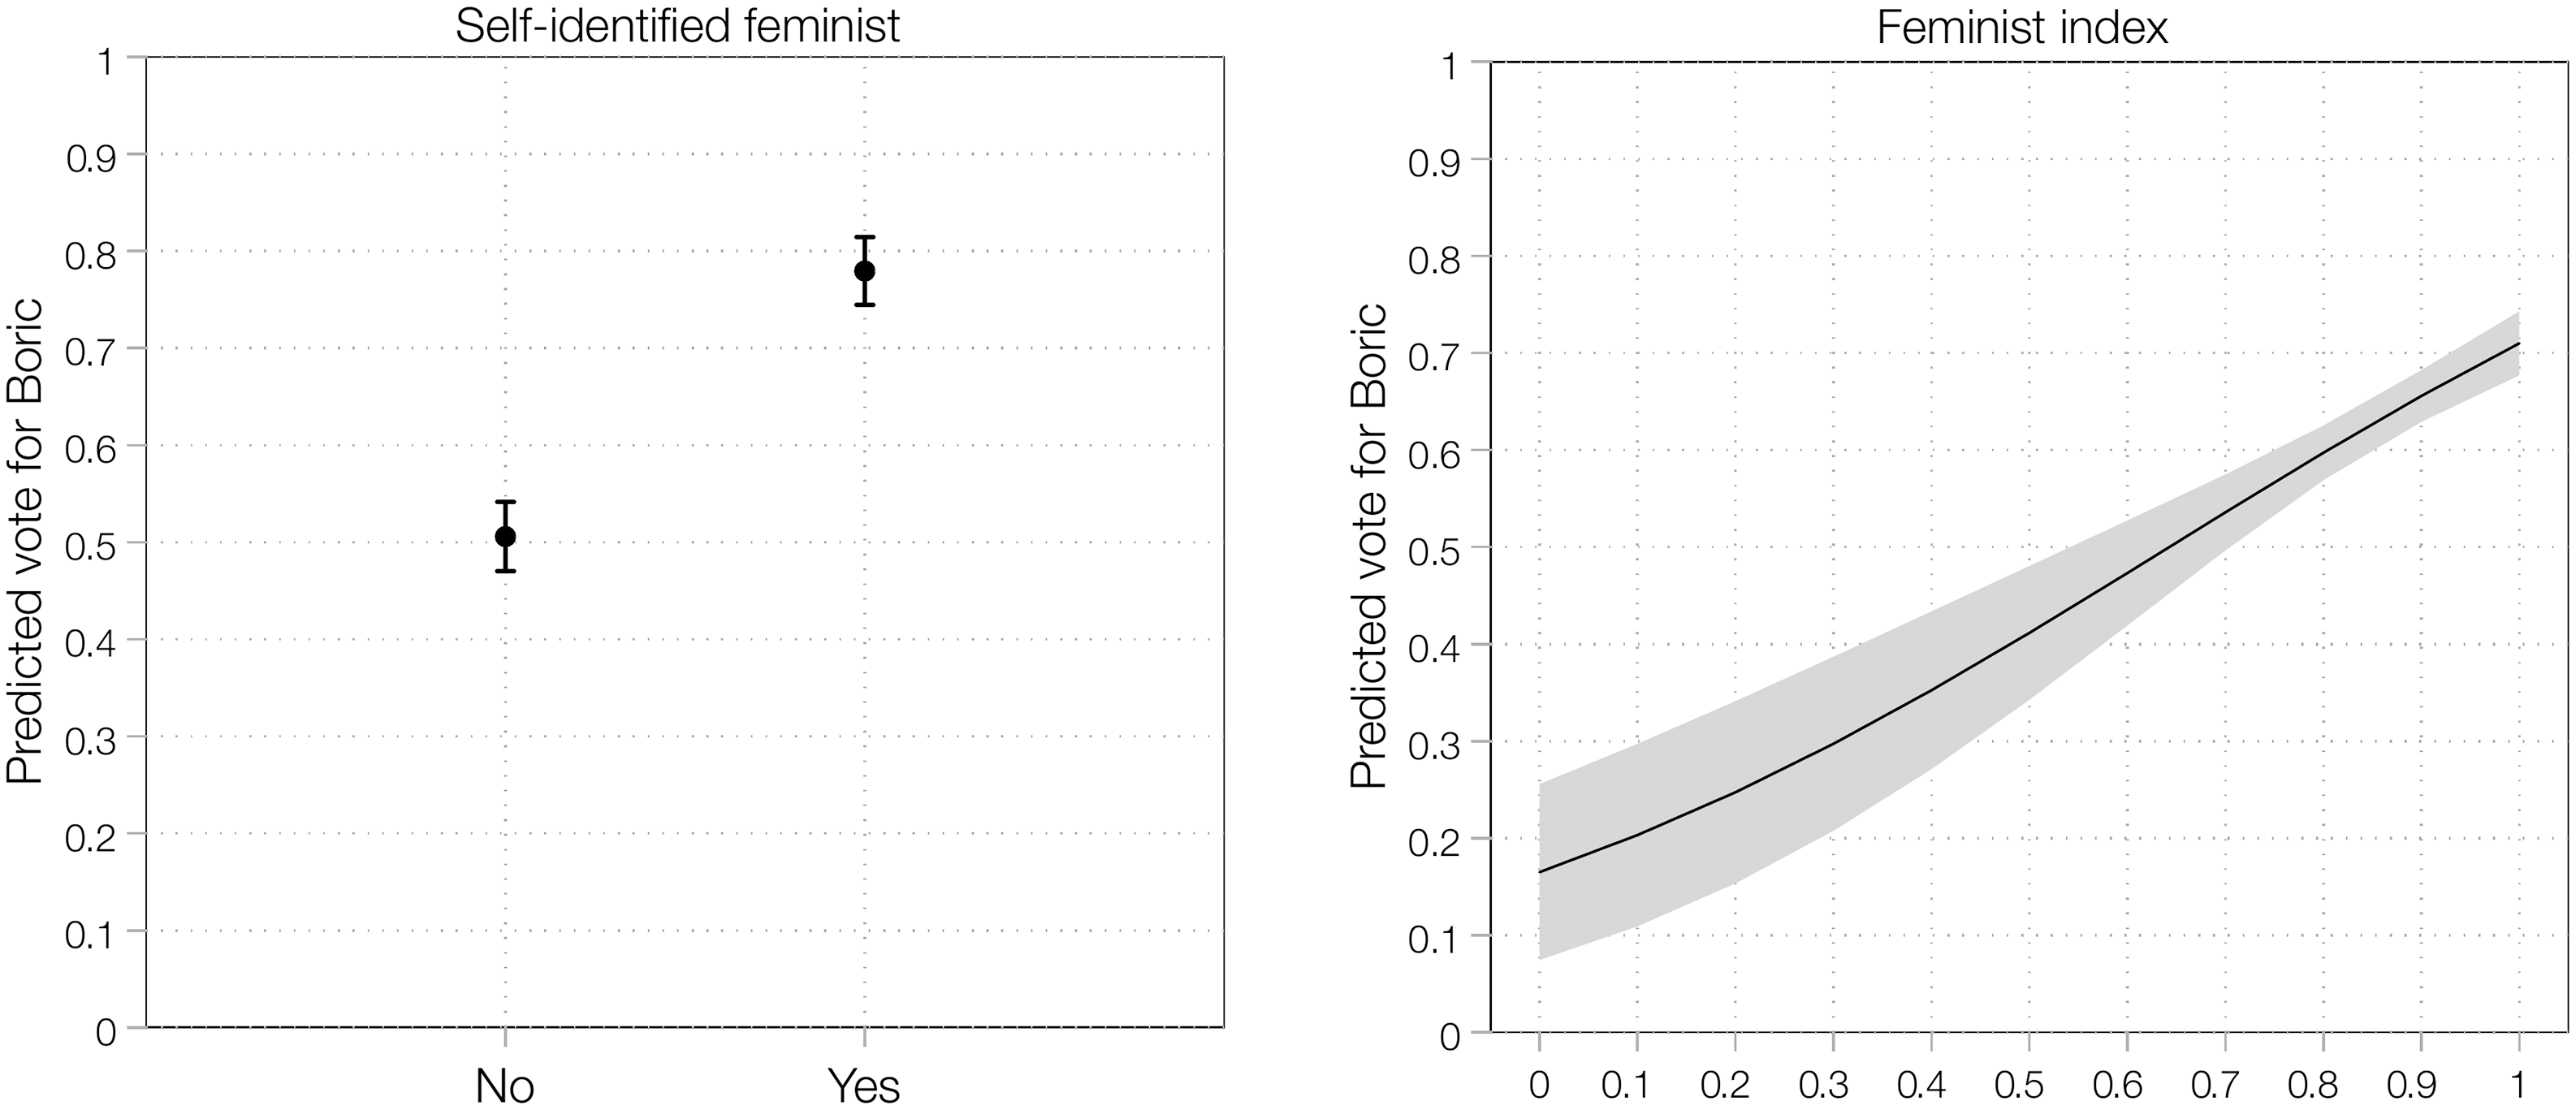
Figure 5 shows the predicted probability of reported voting for Boric rather than Kast for the feminist variables.Footnote 20 If a Chilean does not identify as a feminist, the predicted probability of reporting a vote for Boric compared to Kast was 0.51. This probability jumps to 0.78 if a Chilean identifies as a feminist. This is a substantively large difference. Feminist attitudes also matter. Chileans with the least feminist attitudes have a predicted probability of just 0.18 for saying they voted for Boric over Kast whereas Chileans with the most feminist attitudes have a 0.70 probability. The feminist index mean was 0.84, indicating that most Chileans fall on the more feminist side of the plot, but the figure still shows a significant increase from 0.6 (−1 s.d.) to 1.0 (+1 s.d.) on the scale. Feminism, captured by both measures, is strongly linked to self-reported presidential voting in the 2021 Chilean election, even after accounting for the also important role of left–right ideology.
Feminism and predicted probabilities of Boric versus Kast vote.
Note: each panel presents predicted probabilities of voting for Boric compared to Kast for feminists calculated from the analyses presented in Figure 3 and show 95 per cent confidence intervals. The left panel shows probabilities when feminism is measured as self-identified feminists; the right panel is for feminist attitudes. Models control for socio-economic status, age, and political interest.

Explanations for Sex Gaps in Vote Intention in Brazil
Figure 6 shows the results of analyses testing the role of ideology, feminism, and gendered personalities in explaining the sex gap in voting for Lula rather than Bolsonaro in Brazil’s 2022 round. Left–right ideology is very important, and including ideology makes the sex gap in voting disappear, meaning ideology is a key explanation for sex gaps in voting. As expected, rightists were significantly less likely than leftists to plan to vote for Lula over Bolsonaro. Feminism also influenced vote choice. Self-identified feminists were much more likely to intend to vote for Lula rather than Bolsonaro, as were those with more feminist attitudes, and the inclusion of either variable eliminates the sex gap. Gendered personalities played no distinguishable role in Brazil, however. Feminine and masculine personality traits are near zero in their effect on vote intention, and the sex gap in voting persists with them in statistical models.
Explanations for sex gaps in Lula versus Bolsonaro vote in Brazil.
Note: each panel shows estimated logit coefficients from different statistical models. Models control for socio-economic status, education, age, and political interest. Horizontal lines denote 95 per cent confidence intervals.

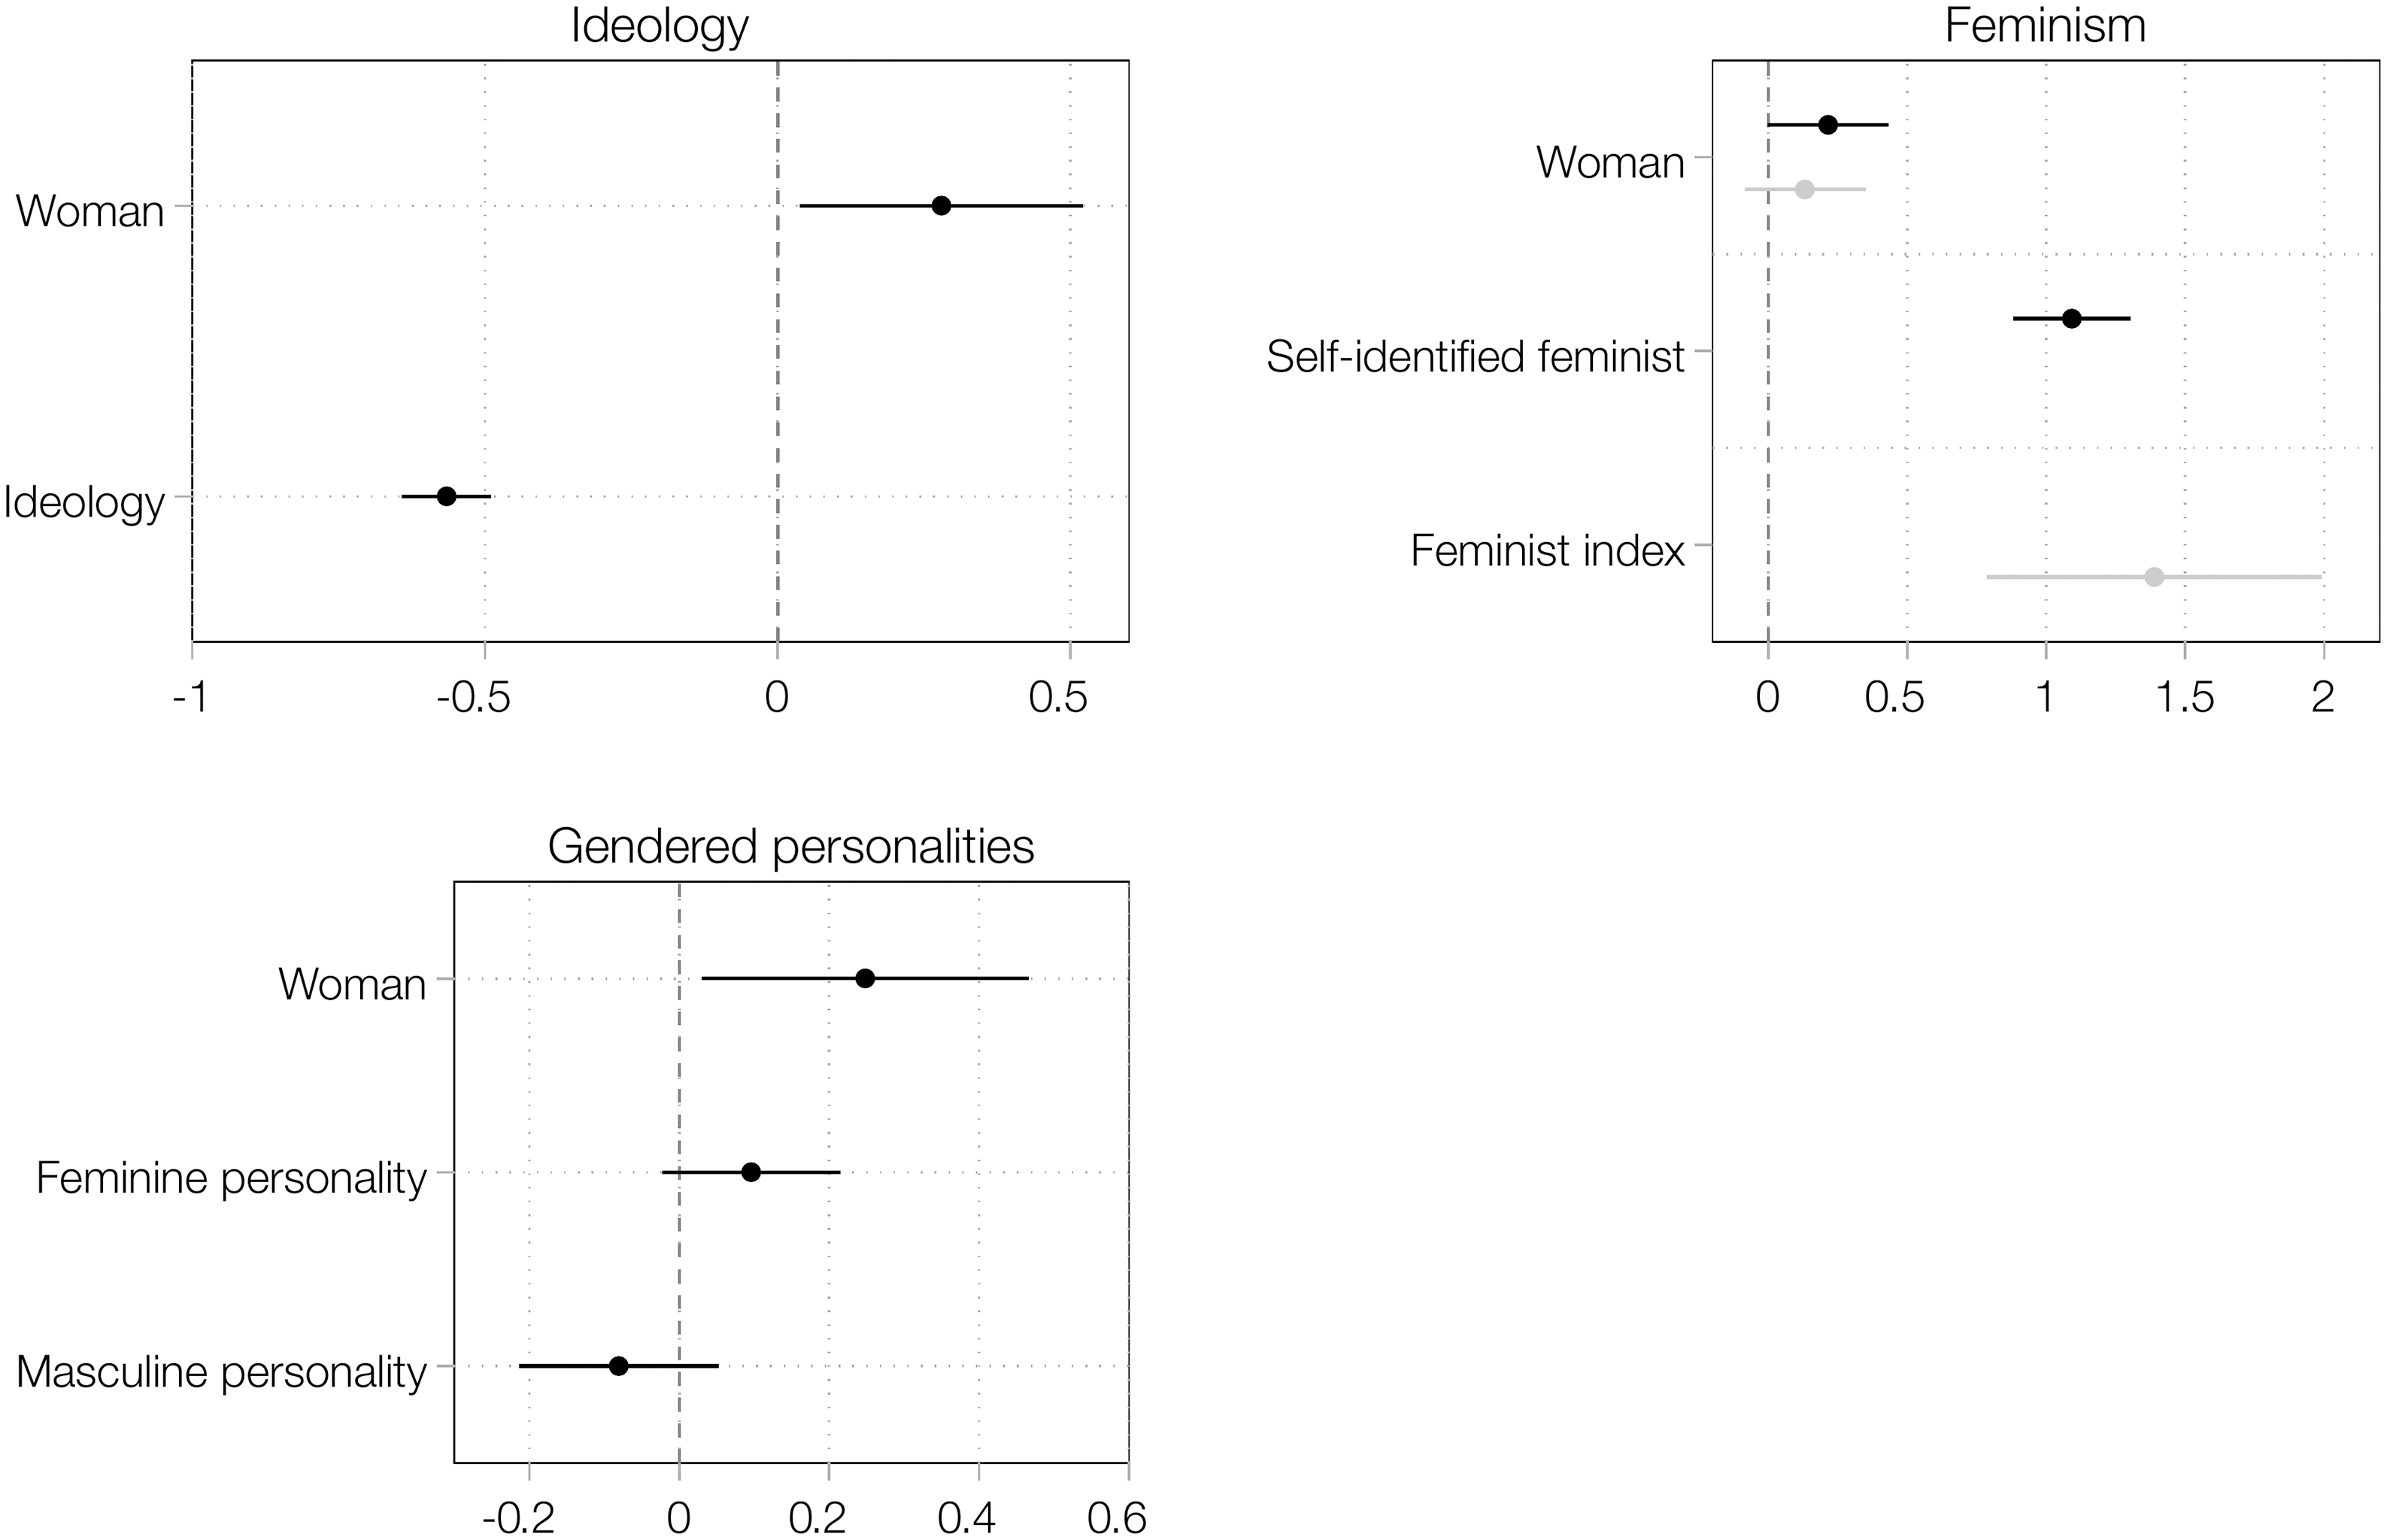
Figure 7 underscores the relevance of ideology and feminism. With all independent variables in the models, ideology emerges again as a key explanation for vote intention, and its inclusion eliminates the significance of the sex gap. The same happens with self-identified feminism in the model. However, once ideology is accounted for in the feminist attitudes model, the feminist index is positive but with a wide confidence interval and is not significant. Gendered personalities still do not affect vote choice.
Full models for sex gaps in Lula versus Bolsonaro vote.
Note: the figure shows estimated logit coefficients predicting vote for Lula compared to Bolsonaro with all variables in the same model. Models control for socio-economic status, education, age, and political interest. Horizontal lines denote 95 per cent confidence intervals.

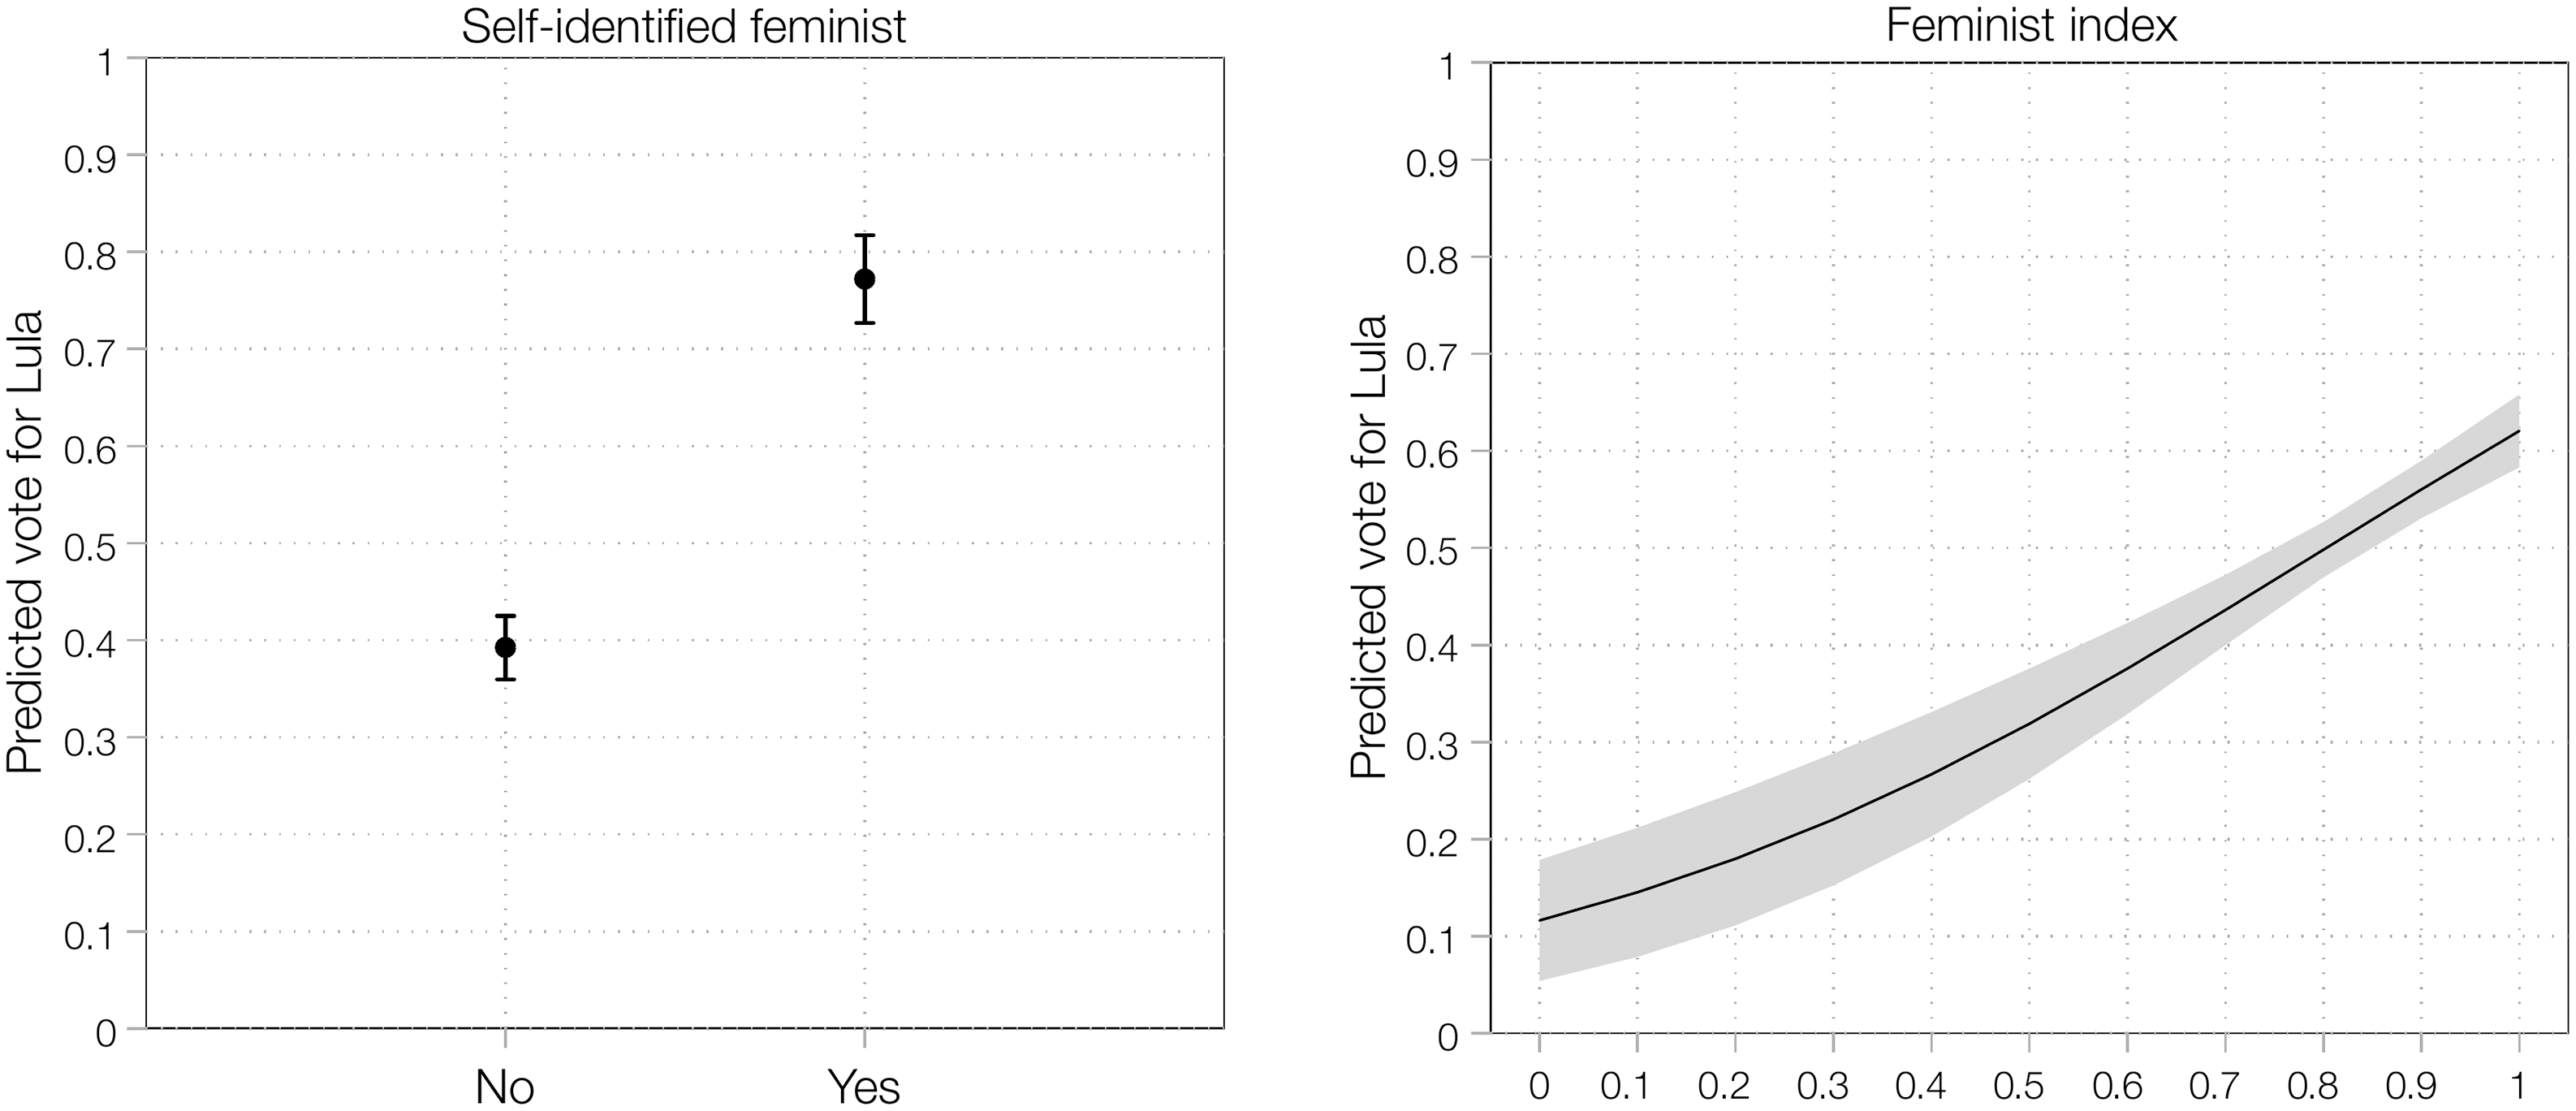
Figure 8 illustrates the substantive effects of feminism on presidential vote choice in Brazil. It displays the predicted probabilities of vote intention for Lula compared to Bolsonaro for feminist self-identification and feminist attitudes. Those who do not identify as feminists have a 0.39 probability of planning to vote for Lula rather than Bolsonaro, whereas those who do have a probability of 0.78. This is a large difference of 0.39. The predicted probability of vote intention for Lula rather than Bolsonaro increases from 0.13 to 0.62 as respondents express more feminist attitudes. As in Chile, the mean of the feminist index variable is high, 0.82, indicating that most people express feminist attitudes. The figure importantly reveals a significant increase in vote intention for Lula around that mean.
Feminism and predicted probabilities of voting for Lula versus Bolsonaro.
Note: each panel presents predicted probabilities of support for Lula compared to Bolsonaro calculated from the analyses presented in Figure 6. The left panel shows probabilities when feminism is measured as self-identified feminists; the right panel is for feminist attitudes. Models control for socio-economic status, age, and political interest. We report 95 per cent confidence intervals.

Explanations for Sex Gaps in Vote Intention in Argentina
Results for Argentina mirror those in Chile and Brazil, but the patterns are weaker (Figure 9). Unsurprisingly, rightists are much less likely to intend to vote for Massa and more likely to say they would vote for Milei, but ideology does not explain away the sex gap. This may be because Argentine men and women in our sample did not have statistically significant ideological differences (see Figure 2). The feminism variables, however, do independently eliminate the significance of the sex gap. The sex gap becomes much smaller or statistically insignificant when self-identified feminists or feminist attitudes are modeled, and both measures of feminism predict greater likelihoods of vote intention for Massa over Milei. As in Chile and Brazil, feminism emerges as an important determinant of sex gaps in presidential vote choice in Argentina. Gendered personalities again are not statistically significant, though more feminine voters trend positively towards Massa (and away from Milei), whereas masculine voters trend negatively. The sex gap remains after accounting for gendered personalities.
Explanations for sex gaps Massa versus Milei vote in Argentina.
Note: each panel shows estimated logit coefficients from a different statistical model. Models control for socio-economic status, education, age, and political interest. Horizontal lines denote 95 per cent confidence intervals.

Reinforcing these results, Figure 10 has all the independent variables in one model to show how ideology and feminism work together to reduce and almost eliminate sex gaps. Ideology and self-identified feminism are statistically significant variables for predicting vote intention in Argentina, and with both in the model together, the voting sex gap is close to insignificant. Again, the smaller sex gaps in ideology in Argentina (Figure 2) may explain why ideology does not completely explain the sex gaps in voting, but the model with ideology and feminist attitudes together does reveal a statistically insignificant voting sex gap. As in Brazil, the feminist index confidence interval is large and includes zero, but we can see that both measures of feminism work alongside ideology to reduce the sex gap in vote intention. Leftists and feminists are much more likely to intend to vote for Massa than Milei.
Full models of sex gaps in Massa versus Milei vote.
Note: the figure shows estimated logit coefficients predicting vote for Massa compared to Milei with all variables in the same model. Models control for socio-economic status, education, age, and political interest. Horizontal lines denote 95 per cent confidence intervals.

Figure 11 shows the substantive effect of feminism in Argentina. It is smaller than in Chile and Brazil but still quite notable. Self-identified feminists have a 0.52 probability of voting for Massa over Milei compared to 0.28 for non-feminists. Those with the most feminist attitudes were more than twice as likely to vote for Massa over Milei than those with the least feminist attitudes, but the increase from one standard deviation below the mean (0.80) to one above it still reveals a significant increase in probability of voting for Massa. Feminism strongly influenced presidential vote choice in Argentina, as it did in Chile and Brazil.
Feminism and predicted probabilities of Massa versus Milei vote.
Note: each panel presents predicted probabilities of support for Massa compared to Milei calculated from the analyses of Figure 9. The left panel shows probabilities when feminism is measured as self-identified feminists; the right panel corresponds to feminist attitudes. Models control for socio-economic status, age, and political interest. We report 95 per cent confidence intervals.

Contextualizing the Results
Our modeling shows that ideology and feminism help explain sex gaps in voting in Chile, Brazil, and Argentina. Which factor matters the most? We ran Blinder–Oaxaca decomposition models to explore how much of the sex gaps in the three countries was explained by each of the main independent variables and controls (Hlavac Reference Hlavac2022) (see Appendix for full results). We found that ideology explains more of the gender gap in all three countries than any other variable. Feminism comes second. This additional analysis confirms the role of ideology and feminism in explaining why women vote differently from men in Chile, Brazil, and Argentina. The decomposition models also make clear that while ideology is most important, feminism distinctly reduces sex gaps in voting as well.
Our analyses reveal many cross-country similarities in the role of ideology, feminism, and gendered personalities explaining sex gaps, but some differences do emerge. Chile’s results most consistently support our theory, with a strong role for ideology and feminism (both self-identified feminism and feminist attitudes) in explaining sex gaps in voting for Boric compared to Kast. The results are weakest in Argentina, where the sex gap persists after accounting for ideology and feminism, though it has been reduced. One reason for this may be that Chile’s competition between Boric and Kast most clearly maps onto a contest between a feminist leftist and an anti-feminist rightist, allowing the strong role of ideology and feminism to emerge. Argentina’s election certainly included an anti-feminist rightist, but Massa’s credentials as a feminist were weaker, and he is much more centrist than leftist ideologically. As other research has shown, ideology does not always predict vote choice well in Argentina (Zechmeister Reference Zechmeister, Zechmeister, Rosas, Kitschelt, Luna and Hawkins2010).
Another cross-country difference is how self-identified feminism operates compared to feminist attitudes. Self-identified feminism strongly predicted vote choice in all three elections and explained sex gaps in presidential vote choice, but feminist attitudes were a bit less significant in Brazil and Argentina. This highlights that the two variables are related to one another but not interchangeable. More than half of respondents in all three countries responded high on the feminist attitudes scale (means around 0.80 on the 0–1 scale), whereas fewer than half identified themselves as feminist (41 per cent in Chile, 27 per cent in Brazil, and 45 per cent in Argentina). Labeling oneself as a ‘feminist’ is a stronger statement of one’s feminism than affirming gender equality.
Conclusions
As groups, women and men vote for different candidates for many reasons. This study has developed a theory that integrates ideological, feminist, and gendered personality explanations for sex gaps in presidential vote choice. While influential statistical models of sex gaps often treat ideology as a dependent variable, that is, a proxy for electoral preferences (Inglehart and Norris Reference Inglehart and Norris2003; Iversen and Rosenbluth Reference Iversen and Rosenbluth2006; Morgan Reference Morgan, Carlin, Singer and Zechmeister2015), we theorize ideology as a central independent variable that directly contributes to sex gaps but also relates to feminism and gendered personalities and may partly exert effects through them. This holistic theory of sex gaps enables exploration of how three dominant explanations operate alongside one another, rather than in isolation, and which matter more. A main implication of our theorization of the connectedness of ideology, feminism, and gendered personalities relates to the construction and interpretation of statistical models of sex gaps. Models that fail to incorporate these dominant explanations – ideology, feminism, and gendered personalities – may come to unwarranted conclusions that either over- or underestimate the impact of these variables for why women and men for vote different candidates.
While most studies of sex gaps in political behavior examine advanced Western democracies, we research sex gaps in presidential voting in Latin America, which has experienced a resurgence of and backlash against feminism during the 2010s and 2020s. Employing original data to measure ideology, feminism, and gendered personalities, we modeled sex gaps in vote choice during the second rounds of the 2021 Chilean, 2022 Brazilian, and 2023 Argentine presidential elections. We found sex gaps in all three races, with women more likely than men to vote for Boric, Lula, and Massa than Kast, Bolsonaro, and Milei, respectively. In all three countries, ideology and feminism reduced or explained away sex gaps. Self-identified feminism predicted vote choice most consistently, but decomposition models showed that ideology explained more of the sex gaps than other variables, with feminism coming second. We cannot determine whether more left-leaning and feminist voters preferred Boric, Lula, and Massa because of their ideological and feminist credentials or because they more strongly disliked the more rightist, anti-feminist alternative. We can, however, show that feminism and ideology fundamentally drove differences in women’s and men’s choices.
Unlike in many Western countries, voters’ gendered personalities did not seem to influence vote choice in this area of the world. Despite some presidential candidates’ attempts to exude and leverage masculinity, we find little evidence that voters in Chile, Brazil, and Argentina are deciding who to vote for based on psychological idealizations of men and women as they seem to do in the United States and other countries experiencing a rise in the far right. This could mean that Latin American voters think about masculinity and femininity in different ways than in the United States, where Bem’s measures were originally developed and thoroughly validated. Alternatively, these null findings for gendered personalities may suggest that voters care about or use gendered cues less than in other areas of the world. Finding that gender stereotypes matter less than expected may augur well for Latin America’s democracies, or even partly appear as a feminist achievement. Future research might explore whether specific traits – such as compassion or independence – by themselves predict presidential vote choice better than the combinations of traits deemed as ideally feminine or masculine.
We theorized how and empirically demonstrated that the role of ideology, feminism, and gendered personalities can depend on context. Chile’s results most neatly mapped onto our theoretical model whereas Argentina’s results were supportive but weaker. Ideology and feminism did not fully explain away the sex gaps in Argentina, though they did reduce the gaps. We suspect this is driven by a pairing of presidential candidates who may have been perceived to be less ideological than programmatic and where feminism may not have been as strong a factor in election campaigns and rhetoric. Ideological and feminist cleavages may need to clear in an election and men and women voters may need to differ on these identities for these factors to be top explanations of sex gaps in voting. Future research should explore other countries and elections – in Latin America and elsewhere – to help isolate exactly when and why ideology and feminism emerge as primary explanations for sex gaps in voting.
Finally, this study illuminates how, even in all-male competitions, gender persistently influences presidential vote choice through multiple avenues. That feminism influences presidential vote choice independent of ideology has major implications for the study of political behavior in Latin America. It suggests that any assumption that ideology by itself will explain why women and men vote differently constitutes a gross misunderstanding of how presidential elections generally operate. Our work shows that any model of presidential vote choice that does not consider gender, or more specifically feminism, will fail to capture fundamental dynamics in the region’s most consequential democratic contests.
Supplementary material
The supplementary material for this article can be found at https://doi.org/10.1017/S0007123425101117.
Data availability statement
Replication data for this article can be found in Harvard Dataverse at: https://doi.org/10.7910/DVN/BKXWMX.
Acknowledgments
We thank Cinthia Carvalho Dalcin, Emily Elia, Gustavo Guajardo, Isabela Padilha Vilela, and Ana María Lluminquinga for their research assistance. We also are grateful for feedback from Cristóbal Rovira Kaltwasser, participants of a panel at the American Political Science Association in Los Angeles in August 2023, participants of the workshop Feminismo, Antifeminismo y la Ultraderecha at the Pontificia Universidad Católica in Chile in October 2024, and participants of the Empirical Study of Politics and Gender (EGEN) conference at ITAM in Mexico City in May 2025.
Financial support
This research received financial support from Rice University, a Fondecyt Regular Grant #1250145, and the Center for Social Conflict and Cohesion Studies (COES) via ANID/FONDAP/1523A0005.


 Open access