


Guidelines for healthy diets recommend consumption of fruits and vegetables because of their role in preventing several chronic diseases, including heart disease, obesity, cancer, and diabetes (U.S. Departments of Agriculture (USDA) and Health and Human Services (DHHS) 2010). The Dietary Guidelines for Americans 2010 (USDA DHHS 2010), for example, recommended increasing consumption of nutrient-dense foods such as fruits and vegetables and decreasing energy intake from solid fats and added sugars currently consumed in excess. Despite this guidance, more than 80 percent of Americans consumed less than the recommended amounts of fruits and vegetables (Krebs-Smith et al. Reference Krebs-Smith, Guenther, Subar, Kirkpatrick and Dodd2010), on average meeting only 42 percent of the target for fruit and 59 percent of the target for vegetables (USDA DHHS 2010). A recent study by the Centers for Disease Control and Prevention found that adults were meeting only 13.1 percent of the recommended intake of fruit and 8.9 percent of the recommended intake of vegetables (Moore and Thompson Reference Moore and Thompson2015).
Many individuals consume fruit and vegetable juices and drinks to meet a portion of their recommended daily servings, but there are challenges associated with this solution, especially in the case of fruit drinks, which contain added sugar. Added sugars contribute an average of 16 percent of total calories to American diets (USDA DHHS 2010). Nearly half of the added sugar Americans consume comes from sugar-sweetened beverages; the calories attributed to sweetened beverages such as soda and fruit drinks increased 135 percent between 1977 and 2001 (Nielsen and Popkin Reference Nielsen and Popkin2004), primarily because of larger portions and more servings per day (Nielsen and Popkin Reference Nielsen and Popkin2004, Piernas and Popkin Reference Piernas and Popkin2011).
Numerous studies have examined demand for ready-to-drink fruit and vegetable juices and beverages sold at retail stores (Okrent and MacEwan Reference Okrent and MacEwan2014, Zhen et al. Reference Zhen, Wohlgenant, Karns and Kaufman2011, Reference Zhen, Finkelstein, Nonnemaker, Karns and Todd2014, Finkelstein et al. Reference Finkelstein, Zhen, Bilger, Nonnemaker, Farooqui and Todd2013, Lin et al. Reference Lin, Smith, Lee and Hall2011, Smith Reference Smith2010, Dharmasena and Capps Reference Dharmasena and Capps2012), but little research has been conducted on the rapidly emerging subcategory of so-called “super-premium” fruit and vegetable juices and beverages in terms of consumers’ demand and responses to price changes. The term super-premium is used widely by the beverage industry, and several characteristics generally set these beverages apart from other products in the fruit and vegetable juice and drink category: they are generally found refrigerated, are promoted for their health and nutrition properties, contain juices that have not been commonly used before (unlike orange, apple, cranberry, grapefruit, and grape juices), and are typically sold for higher prices than other fruit and vegetable beverages (BevNET 2008).
Companies in the super-premium subcategory market these products for their health and nutritional properties, including servings of fruits and vegetables. Several brands have recently been acquired by large food and beverage companies that are committing substantial advertising, manufacturing, and distribution resources, thus increasing their ability to market the healthful properties of these products and sell them to consumers. These same companies have seen slow growth and even declines in sales of their products in other, larger categories such as soda (Wong Reference Wong2013, Esterl Reference Esterl2015) and thus have an incentive to increase sales in alternative healthier categories to compensate.
Super-premium beverages are marketed for their health properties but do not uniformly fit into the 100-percent juice or fruit drink definitions used in beverage-related research and dietary guidelines. Some of the products contain 100-percent juice and no added sugar while others contain a smaller percentage of juice and have added ingredients, including sugar. Therefore, it can be difficult for consumers to apply the recommendations from the dietary guidelines and existing research findings directly to super-premium beverages.
In view of these dietary considerations, it is important to have an understanding of the consumption trends and characteristics associated with these beverages. Such analysis allows us to determine how significant the super-premium juice subcategory is in the population's overall diet relative to the overall juice and juice drink market and whether these products are growing in popularity. An analysis of prices specifically provides an indication of consumer willingness to pay for the qualities that differentiate these products. Evaluating the responsiveness of the market to changes in price and inter-relationships between super-premium juice purchases and purchases of other fruit and vegetable beverages provides a more complete picture of consumer behavior.
This research aims to contribute to the literature in two primary ways. First, we conduct a detailed trend analysis of total retail dollar sales, volume of sales, and retail prices for super-premium juices and drinks, 100-percent fruit juices, fruit drinks, and vegetable juices and drinks using data for 2007 through 2012. While this trend analysis focuses on understanding the market for super-premium beverages, it also contributes to an up-to-date understanding of the overall retail market for fruit and vegetable juices and drinks. A second contribution is the estimation of a demand model and analysis of the super-premium subcategory's responsiveness to changes in own-prices and its relationship to other subcategories—100-percent fruit juices, fruit drinks, and vegetable juices and drinks—evaluated through estimation of cross-price elasticity values.
Data and Methodology
Data
The data used in this research were obtained from Nielsen Inc.’s retail scanner data set for January 1, 2007, through December 31, 2012; USDA Economic Research Service rural-urban continuum codes; and the U.S. Census Bureau's American Community Survey for 2008–2012. The Nielsen data consist of weekly price and quantity information for individual products identified by universal product codes (UPCs) from point-of-sale systems of more than 35,000 participating retail stores. The rural-urban continuum codes provide a classification system that distinguishes metropolitan counties from non-metropolitan counties by population size and degree of urbanization. These are used to factor in the influence of metropolitan and non-metropolitan areas on demand for beverages since the availability of fruit and vegetable juices and drinks, especially super-premium ones, can vary by the type of location. The American Community Survey provides data at a county level for our socio-economic and demographic variables, including median incomes, average household sizes, race/ethnicity, and education attained. We merged the USDA and Census Bureau data sets with the Nielsen data set using state and county federal information processing codes to estimate a demand model in which the dependent variables were shares of total national consumer expenditures for the four subcategories of beverages: 100-percent fruit juices, fruit drinks, super-premium juices and drinks, and vegetable juices and drinks.
The primary data source was the Nielsen data set, which allowed us to extract and analyze price and quantity information by product subcategory at a county and individual-store level. This data set is an appropriate source for this study since it is comprehensive in terms of capturing retail sales relevant to our target product category, provides a large representative sample, and offers data for our 2007–2012 study period. Those years capture a substantial portion of the total period in which super-premium products have been available on the market.
The data in the study came from Nielsen's “juice, drinks–canned, bottled” group, which we subdivided into the four subcategories previously mentioned. In estimating the demand model, we assumed that the demand for fruit and vegetable juices and drinks was separable from the demand for other beverages and foods in the consumer budget because of their health and nutrient claims and benefits. In a multi-stage budgeting framework, it is common to assume that consumers first allocate their budgets to separate commodity groups and then base their subsequent purchase decisions on the amount of the budget allocated to each group and the prices of products in it. Hence, using weak separability, we focus on a demand structure in which the total expenditure for fruit and vegetable juices and drinks is allocated to various products within this group.
A few notes regarding the organization of the four juice and juice drink subcategories are important. First, while many studies have compared fruit drinks to either fruit juices or to all juices (Dharmasena and Capps Reference Dharmasena and Capps2012, Finkelstein et al. Reference Finkelstein, Zhen, Bilger, Nonnemaker, Farooqui and Todd2013, Lin et al. Reference Lin, Smith, Lee and Hall2011, Zhen et al. Reference Zhen, Wohlgenant, Karns and Kaufman2011, Reference Zhen, Finkelstein, Nonnemaker, Karns and Todd2014), we use a separate subcategory for vegetable juices and drinks. Observing this subcategory independently is useful because vegetable juices and drinks are also marketed as healthy and nutritious. We can thus gain useful insights by comparing the separate vegetable beverage category to super-premium juices and drinks.
Second, we combined super-premium juices and other super-premium drinks into a single group because the subcategory is relatively new and because these types of super-premium beverages are marketed similarly in terms of their placement in stores and associated health claims. As a result, consumers would be less likely to understand the distinction between super-premium beverages that are made with 100-percent juices and ones that are not. Instead, we assumed that consumers selected individual products for one of their other attributes—price, a specific health benefit, or a unique flavor or ingredient. Furthermore, we anticipated that sales of super-premium juices and drinks would constitute a relatively minor share of the market and chose to reflect them jointly in the trend analysis to make the presentation of those results more concise.
Third, we did not combine other 100-percent fruit juices and fruit drinks into one category because prior studies of beverages have found significant differences in those two subcategories, which we wanted to capture. We also assumed that consumers would be more likely to understand the differences between those products and would make purchasing decisions based on their differences.
Finally, Nielsen combines cranberry juices and drinks into a single category. We assumed that most of the products in this subcategory were not 100-percent juice and classified all of the products in this Nielsen category as fruit drinks. All cider products were categorized as 100-percent juices, and “fruit juice nectars” were included under fruit drinks since nectars often include added sweeteners and we aimed to treat fruit drink products that are not 100-percent juice separately.
The Nielsen data contained information that allowed us to separate fruit juices, fruit drinks, and vegetable juices and drinks but did not provide information needed to define the super-premium subcategory. To address this issue and create a data set for super-premium juices and drinks, we first established a set of criteria that defined products in that subcategory using information from industry sources (e.g., BevNET.com). Products in the super-premium category had to be ready-to-drink, refrigerated, pasteurized, and promoted as healthy and nutritious and also had to contain unique ingredients such as so-called “superfruits”—e.g., pomegranate, açai, goji berry, and blueberry—that beverage companies often market as providing antioxidants.Footnote 1 Exceptions were made when one of the brands in the super-premium subcategory also marketed a product containing only orange, apple, cranberry, grapefruit, or grape juice based on the assumption that consumers would still view such products as an alternative to other super-premium beverages. We recognize that other definitions of the subcategory could be used and would produce a different data set. Therefore, it is important to view the results of this study in light of the aforementioned process.
After defining the super-premium subcategory, we reviewed industry websites and multiple online grocery store sites to develop an initial short-list of possible brands that sold products matching our criteria. We then reviewed websites of more than 50 companies and hundreds of unique products to confirm whether those brands matched our super-premium subcategory definition. Twenty brands were included in the final list from this process.
We then searched the Nielsen data set for those brands. Several were not included in the data set, often because they were not yet available in the market during the study period. In addition, private-label products were not associated with specific brands in the data to protect proprietary sales information. As a result, it is possible that products that otherwise would have been included as super-premium were instead included in a different subcategory.
From this process, we developed a final set of eleven brands that matched our criteria and were covered by the Nielsen data set for 2007–2012. The Nielsen codes for the selected super-premium brands were then used to identify UPCs from the data that corresponded to the relevant fruit and vegetable juice and drink products. We identified 891 individual products sold under the brands to include in the analysis and extracted the relevant observations, including prices and quantities sold, to form a complete set of data for the super-premium subcategory.
With a data set in place for each of the four subcategories, quarterly dollar sales and volumes sold (in ounces) were calculated for each product by store using thirteen-week quartersFootnote 2 with January, February, and March comprising the first quarter. Quarterly figures allowed us to capture the effects of seasonal changes in demand. The current nominal prices were converted to real values using December 2012 as the reference period and monthly values from the U.S. Bureau of Labor Statistics’ consumer price index. All dollar-based figures presented are in real terms. Our final sample consists of 824,064 quarterly store-level observations with 38,880 unique stores in 2,566 counties for the period 2007–2012.
For the trend analysis, we aggregated total sales for all stores into annual values by subcategory.Footnote 3 Then, the total annual sales values were weighted based on the approximate “percent of stores selling” figures provided in the Nielsen data documentation.
Demand Model
We estimate the Quadratic Almost Ideal Demand System (QUAIDS) model of Banks, Blundell, and Lewbel (Reference Banks, Blundell and Lewbel1997) specified as
 $$w_i = {\rm \alpha} _i + \sum\limits_j {{\rm \gamma} _{ij}\ln p_j + {\rm \beta} _i\ln \left( {\displaystyle{x \over {{ a} (\,p)}}} \right)} + \displaystyle{{{\rm \lambda} _i} \over {b(\,p)}}\left\{ {\ln \left[ {\displaystyle{x \over {a(\,p)}}} \right]} \right\}^2\comma \;i = 1\comma \ldots\comma n$$
where w i is the expenditure share for good i, p j is the price of the jth good, x denotes total expenditure on n goods, and p is the translog price index given by
 $$\ln {a} \lpar p\rpar = {\rm \alpha} _0 + \sum\limits_i {{\rm \alpha} _i\ln p_i + \displaystyle{1 \over 2}\sum\limits_i {\sum\limits_j {{\rm \gamma} _{ij}\ln p_i\ln p_j}}}. $$
The Cobb-Douglas price aggregation is defined as
 $$b\lpar p \rpar = \prod \limits_{i = 1}^n p_i^{{\rm \beta} _i} $$
and
 $${\rm \lambda}\left( p \right) = \sum \nolimits_{i = 1}^n {\rm \lambda}_{i} \;ln p_i\,\,{\rm where}\,\,\, \sum \nolimits_i {\rm \lambda}_{i} = 0.$$
The following restrictions are imposed in estimating the constrained model:
 $$\sum \nolimits_{i = 1}^n {\rm \alpha} _i = 1\comma \; $$
 $$\sum \nolimits_{ji}^n {\rm \gamma} _{ij} = 0\comma \; $$
 $$\mathop \sum \nolimits_i {\rm \lambda} _i = 0\,{\rm and}$$
 $$\mathop \sum \nolimits_{i = 1}^n {\rm \beta} _i = 0\, \hbox{for adding up}\comma \; $$
 $$\mathop \sum \nolimits_j^n {\rm \gamma} _{ij} = 0\, \hbox{for homogeneity}\comma \;{\rm and}$$
 $${\rm \gamma} _{ij} = {\rm \gamma} _{\,ji}\comma \; \; \; \forall \; i \ne j\, \hbox{for symmetry}.$$
The uncompensated price elasticities are calculated using $$\sum\nolimits_k {} $$
 $${\rm \epsilon }_{ij}^U = \displaystyle{{{\rm \gamma }_{ij} - {\rm \mu }_i({\rm \alpha }_j + \mathop \sum \nolimits_k {\rm \gamma }_{jk}lnp_k) - \displaystyle{{{\rm \lambda}_i{\rm \beta}_j} \over {b\left( p \right)}} {\left\{ {ln\left[ {\displaystyle{{x} \over {a\left( p \right)}}} \right]} \right\}}^2} \over {w_i}} - {\rm \delta}_{ij}$$
with δ ij = 1 if i = j (own-price elasticity) and δ ij = 0 if i ≠ j (cross-price elasticity). The expenditure (or income) elasticity is calculated using
 $$e_i = \displaystyle{{{\rm \mu}_i} \over {w_i}} + 1 \quad {\rm where}\; {\rm \mu}_i = {\rm \beta}_i + \displaystyle{{2{\rm \lambda}_i} \over {b\left(p \right)}}{\left\{{ln{\left[{\displaystyle{{x} \over {a\left(\,p \right)}}}\right]}}\right\}}.$$
Compensated price elasticities are calculated from the Slutsky equation:
 $${\rm \epsilon }_{ij}^C = {\rm \epsilon }_{ij}^U + \; e_iw_j.$$
Results
Analysis of Descriptive Trends
Our analysis of trends in total dollar sales, shares of dollar and volume sales, unit prices (in dollars per ounce), and volume per item sold identifies considerable differences across the four subcategories of beverages. Super-premium juices and drinks particularly stand out. Our analysis shows that their sales grew rapidly (yet remained a relatively small share of the overall market), increasing from 3.0 percent in 2007 to 6.0 percent in 2012 based on (real) total dollar sales. The rates of annual growth in dollar and volume terms were consistently in double digits, far exceeding the rates of the other three subcategories. In terms of dollars, super-premium juice sales increased 108 percent, from $474.25 million in 2007 to $986.36 million in 2012, and grew between 14.6 percent and 18.9 percent each year (Tables 1 and 2). The volume sold (total ounces) increased even more—133.2 percent with annual rates ranging from 14.4 percent to 22.1 percent, reflecting an overall decline in the unit price of super-premium beverages during the period of 10.8 percent. We analyze average per-unit (ounce) prices across the subcategory rather than controlling for a particular container size; as a result, the decrease in price is partially attributable to a change in container sizes sold, which increased from 22 to 24 ounces (9.4 percent) between 2007 and 2012.
Projected Total Dollar Sales, Mean Prices, and Market Shares of Total Dollar Sales and Total Volume Sales, 2007–2012 by Subcategory
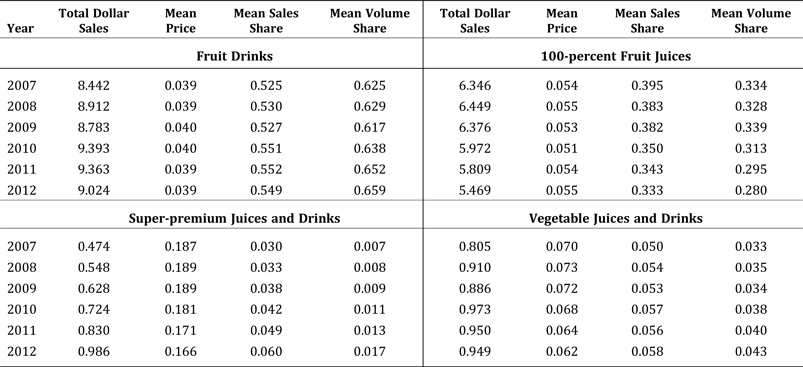
Notes: The sales represented are $s in billions; prices are weighted mean prices ($/ounce). Units are rounded to the third decimal point. As a result, calculations in the text, which are based on figures that were not rounded, may be slightly different from calculations made using the figures in this table.
Growth Rates of Total Dollar Sales, 2007–2012 (inclusive of 2012) by Subcategory
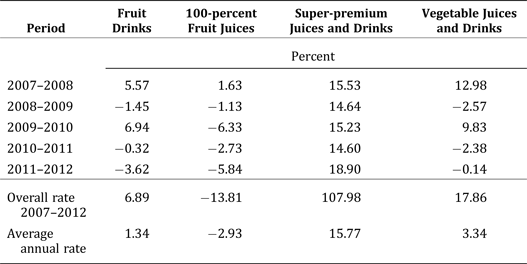
Note: The results reported are weighted.
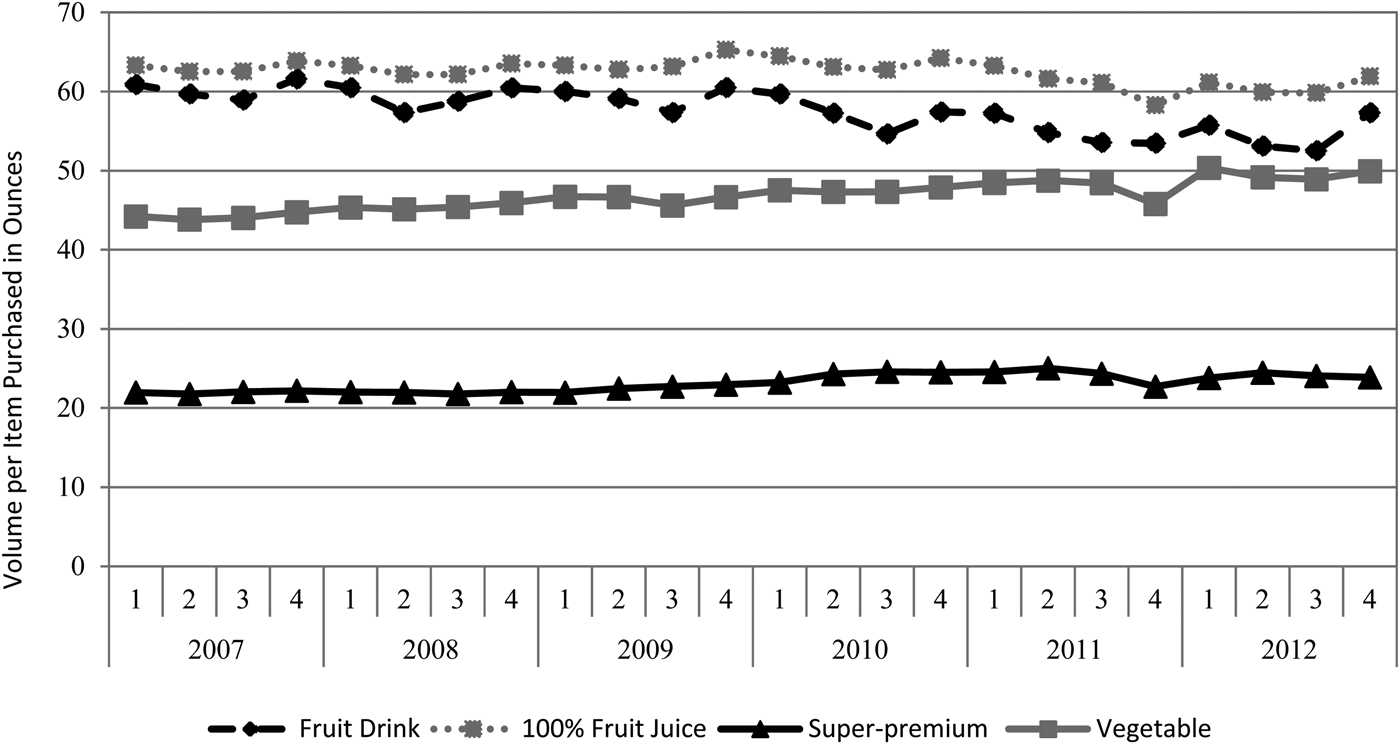
The rapid expansion of super-premium beverages occurred despite these products having much higher per-unit prices than other fruit and vegetable juices and drinks—on average, 3.60 times higher than fruit drinks, 2.36 times higher than fruit juices, and 1.65 times higher than vegetable juices and drinks (see Table 1). Despite super-premium beverage volumes being just 38.7 percent of vegetable beverage volumes by 2012, dollar sales of super-premium beverages increased from 58.9 percent of vegetable beverage dollar sales in 2007 to nearly 104 percent by 2012. The significantly higher prices are explained, in part, by their considerably smaller average volume per item sold (see Figure 1).
Average Annual Volume per Item Sold by Subcategory, 2007–2012
Such increases in sales likely reflect adjustments in consumer tastes and preferences and their willingness to pay more for perceived health and nutritional benefits of super-premium beverages, the convenience of receiving those benefits as ready-to-drink items, and the variety of newly introduced flavors and ingredients that they presented. Super-premium prices, while higher than the other subcategories, also declined during the study period (Table 1). This could also help explain increases in the quantities demanded.
Vegetable juice and drink sales, which also represent a small share of total fruit and vegetable beverage sales, increased substantially between 2007 and 2012 as well, but not nearly as much as super-premium beverages. Dollar sales of vegetable juices and drinks increased 17.9 percent, from $805.17 million to $948.96 million (Table 1), and the volume of sales increased 32.8 percent, partly as a reflection of decreases in average prices during those years and possibly from an outward shift in demand. There were considerable fluctuations in vegetable juice sales year to year. As reported in Table 2, strong growth was seen in 2008 relative to 2007 and 2010 relative to 2009, while volume growth was slower and dollar sales declined in 2012 relative to 2011. Vegetable-based beverages also had higher per-unit prices than fruit drinks and juices throughout the study period, 74 percent higher than fruit drinks and 27 percent higher than fruit juices, averaging $0.07 per ounce (Table 1). Several industry articles (Watson Reference Watson2013, Schroeder Reference Schroeder2015) have discussed the reasons behind slower sales of vegetable beverages, noting poor sales of shelf-stable juices in general and a shift in consumer preferences away from products with primarily tomato-based flavors.
Dollar sales of 100-percent juices declined 14 percent (from $6.35 billion to $5.47 billion) during the study period, while dollar sales of fruit drinks increased 7 percent (from $8.44 billion to $9.02 billion) (Tables 1 and 2). Dollar sales of fruit drinks fluctuated year to year, whereas sales of 100-percent fruit juices consistently decreased beginning in 2009. Likewise for total volumes sold: the volume of fruit drinks sold grew 6.2 percent, but the volume of 100-percent fruit juices sold declined 15.6 percent. Several studies covering years that overlapped our study period using different data sets found similar trends (Okrent and MacEwan Reference Okrent and MacEwan2014, Bloom Reference Bloom2014).
There are several possible explanations for the differences between fruit drinks and 100-percent fruit juices. First, consumers who view fruit drinks as substitutes for 100-percent fruit juices may have chosen fruit drinks because of their lower prices. Our data indicate that prices for 100-percent fruit juices were between 30 percent and 40 percent higher, on average, than prices for fruit drinks (Table 1), potentially reducing consumers’ willingness to pay for 100-percent juices and favorably affecting sales of fruit drinks perceived as providing many of the same benefits.Footnote 4 Furthermore, the period covered by the data set largely coincides with the 2007–2009 financial recession in the United States (Guidolin and Tam Reference Guidolin and Tam2013), which led to a sharp increase in unemployment. Dave and Kelly (Reference Dave and Kelly2012) showed that 100-percent juices were among the first products dropped by consumers 26 to 58 years of age with increases in unemployment. Consumers might have deliberately chosen fruit drinks as a lower-priced, next-best alternative to 100-percent juices. Growing awareness among health-conscious consumers of the large amount of sugar and calories in juices may also have been a contributor.
Estimates of Demand
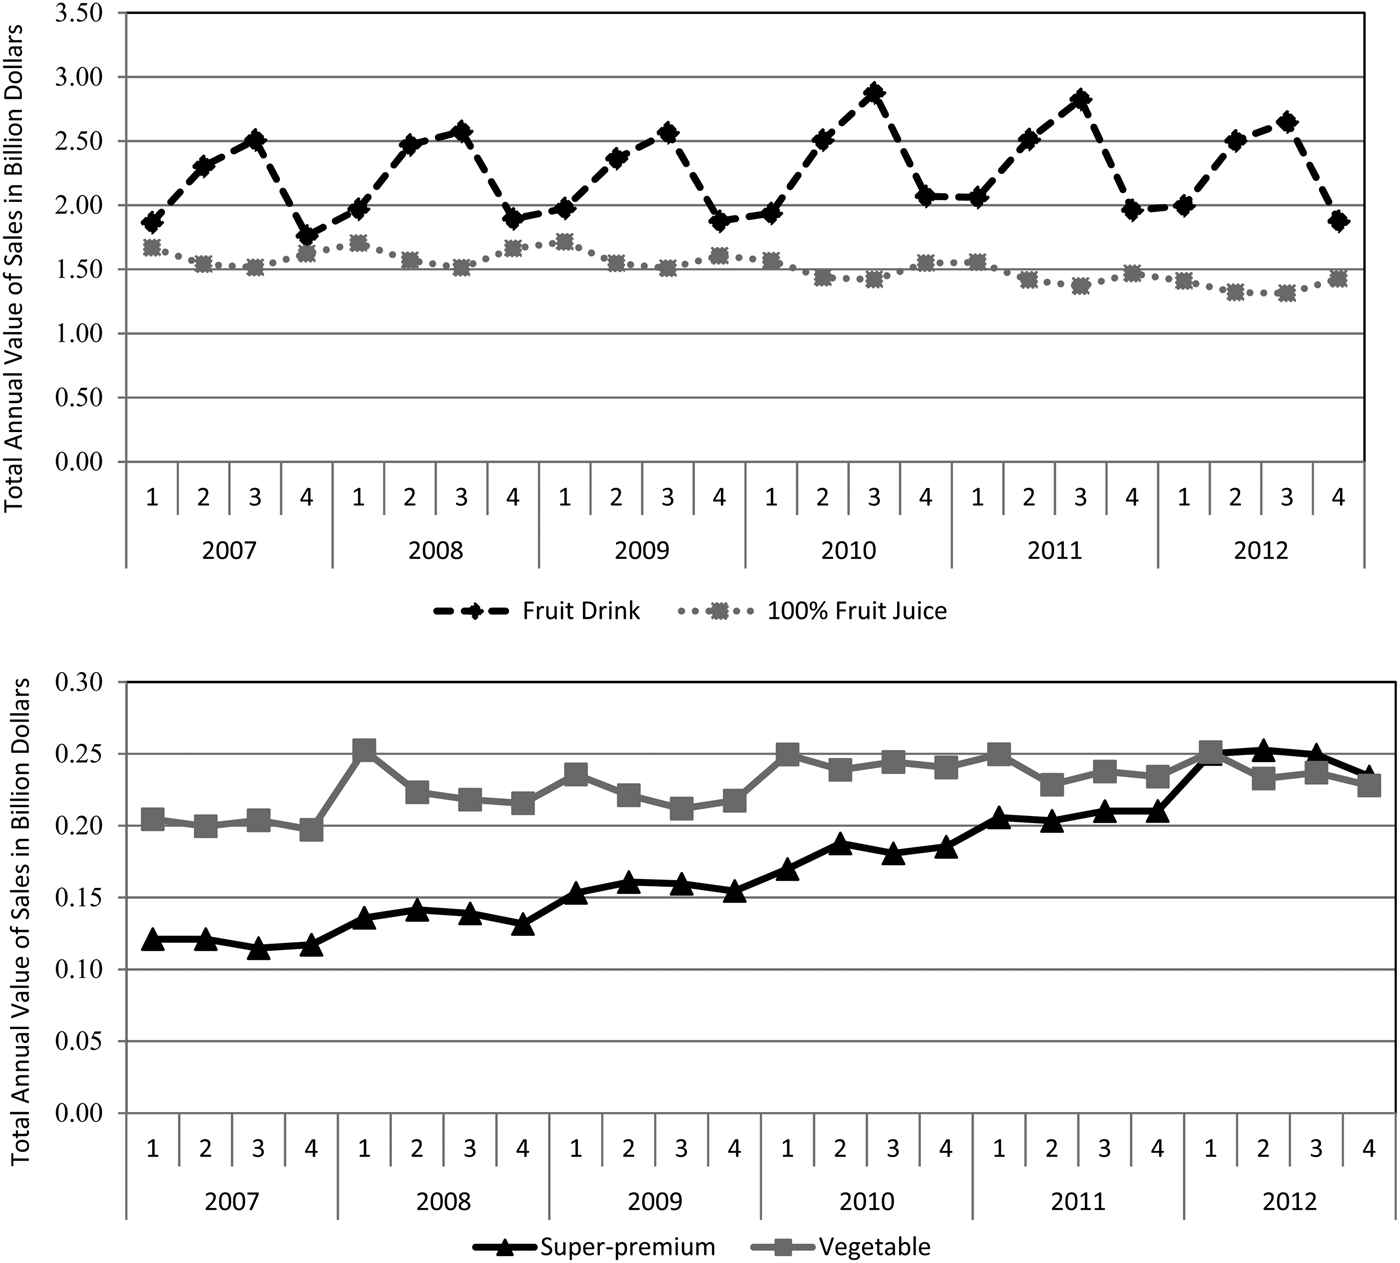
We present summary statistics for the explanatory variables used in the QUAIDS model in Table 3.Footnote 5 Year and quarter dummy variables were included in the model to account for observed fluctuations in total sales for some of the subcategories by year and season (Figure 2). The county-level socio-demographic variables were included to serve as proxy indicators for population characteristics and capture differences among counties in which the stores in our sample were located. Table 4 reports the parameter estimates from the QUAIDS model, which imposed the theoretical restrictions of adding up, homogeneity, and symmetry. All of the parameter estimates from the demand model are statistically significant at the 1 percent level, and they were used to calculate uncompensated and compensated elasticities for own-prices, cross-prices, and expenditures, which are presented in Tables 5 and 6.
Quarterly Dollar Sales per Subcategory, 2007–2012
Mean Values for Explanatory Variables in the Demand Estimation Model
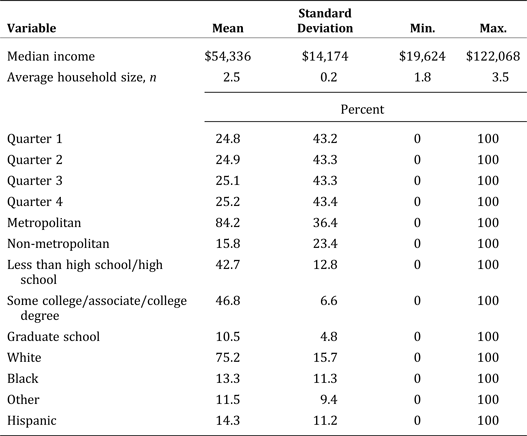
Note: The averages reported are unweighted.
Parameter Estimates of the Quadratic Almost Ideal Demand System Model
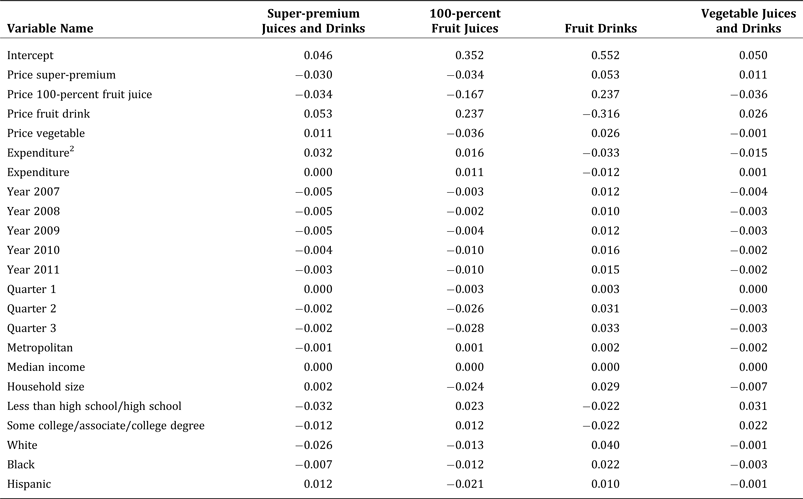
Notes: All parameter estimates are significant at the 1 percent level and the p-values for all parameter estimates are less than 0.000000. The model is estimated using Stata 14 statistical software and is an unweighted analysis.
Uncompensated Own-price, Cross-price, and Expenditure Elasticities
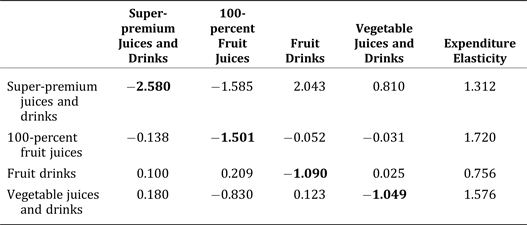
Note: All of the elasticities are significant at the 1 percent level.
Compensated Own-price and Cross-price Elasticities

Note: All of the elasticities are significant at the 1 percent level.
All of the own-price elasticities are negative, which is consistent with our theory-based expectations. Super-premium beverages were considerably more responsive to changes in price than the other subcategories (own-price elasticity of –2.580). This was expected because the super-premium subcategory is more narrowly defined than the other subcategories and substitute products such as freshly squeezed juices are available. The 100-percent fruit juice subcategory also had a high own-price elasticity of –1.501, which was surprising since that subcategory was more broadly defined. The fruit drink and vegetable juice subcategories were nearly unit elastic at –1.090 and –1.049, respectively. Unit elasticity for fruit drinks could be due, in part, to the broad nature of the subcategory. However, we expected greater elasticity since consumers might perceive fruit drinks as having many substitutes, including sport drinks and soda. For the vegetable juices and drinks, unit elasticity could reflect a perception by consumers that there are few available substitutes.
The cross-price elasticities reported in Tables 5 and 6 suggest a combination of complements and substitutes, some in line with our expectations and others not. We find that fruit drinks and vegetable beverages are substitutes for super-premium beverages, whereas 100-percent fruit juices are not. We expected that vegetable beverages would be a substitute for super-premium beverages since both are promoted for their health properties. Thus, an increase in price for one would lead to an increase in purchases of the other. We did not anticipate that fruit drinks would be a substitute for super-premium beverages, however, since we expected that consumers would perceive fruit drinks as not having the same unique health attributes. Perhaps a subset of fruit drinks were successfully marketed as offering the same sort of health properties as super-premium beverages (e.g., antioxidants), leading consumers to view them as substitutes. Also surprising was the complementarity between super-premium beverages and 100-percent fruit juices. We expected both to be perceived by consumers as having comparable characteristics in terms of fruit and vegetable servings and overall nutrient content and, therefore, to be substitutes. That consumers may be purchasing 100-percent fruit juices and super-premium beverages together is a useful insight into the purchasing behavior related to super-premium beverages.
The expenditure elasticities are all positive, indicating that all of the beverages are normal goods. The expenditure elasticities for all of the subcategories except fruit drinks are greater than one, indicating that those subcategories are more responsive to changes in total expenditure levels than fruit drinks and may be luxury goods. The expenditure elasticity for fruit drinks is less than one, so expenditures for those beverages are less responsive to changes in total expenditures and the subcategory could be a necessity good.
Conclusion
Super-premium juices and drinks are relatively new entrants to the fruit and vegetable beverage market and little is known about consumer demand for them. This study uses retail-level scanner data for 2007 through 2012 to analyze retail sales and market trends and to estimate demand for this new subcategory of beverages as well as 100-percent fruit juices, fruit drinks, and vegetable juices and drinks.
Our analysis of sales data indicates that total sales of super-premium beverages more than doubled between 2007 and 2012 and grew at an average annual rate of approximately 16 percent. This rate significantly outpaced the annual growth of the other subcategories analyzed, which grew at slower rates or even declined. These results indicate that super-premium beverages became an increasingly dominant component of the overall diet of consumers in the United States. This growth occurred despite the fact that these products had much higher prices than products in the other juice and juice-drink subcategories, reflecting consumers’ willingness to pay for their differentiated characteristics. We estimated demand using the Quadratic Almost Ideal Demand System model of Banks, Blundell, and Lewbel (Reference Banks, Blundell and Lewbel1997) and calculated elasticities for the four beverage subcategories. The super-premium beverage subcategory was the most responsive to changes in own-price with an elasticity of –2.580, followed by 100-percent fruit juices at –1.501; fruit drinks and vegetable juices and drinks were effectively unit-elastic.
In this study, we assume that fruit and vegetable juices and drinks are separable from other foods and beverages, which permits us to interpret the demand estimates without concern for the potential effects on those other categories. Relaxing this assumption in subsequent studies could provide additional insight into the relationship between super-premium beverages and other beverage subcategories, such as so-called “functional” beverages (e.g., kombucha teas) and foods like fresh or processed fruits and vegetables. Another limitation of this study is that the data set did not cover other fresh-squeezed juices from at-home juicing or made to order at juice bars and thus could not address overall consumption of fruit and vegetable beverages.
The results of this study make an important contribution to our understanding of the increasing consumption of this emerging beverage subcategory and characteristics of demand for many of the fruit and vegetable juices and drinks in the market, as well as point to potential avenues for further study. First, household panel data sets, such as those available from Nielsen and IRI, could allow studies to analyze individual household purchasing decisions related to these beverage products and control for socio-economic and demographic factors. Such data could be used, for example, to compare purchases of super-premium beverages and fresh produce by a specific set of households to determine the extent to which consumption of those products is correlated at the household level. Future research could also evaluate the nutritional implications of increased consumption of super-premium beverages to determine their overall impact on the diet and health of consumers.


 Open access

