Introduction
Estimates of the mass budget of the Greenland ice sheet are constrained by lack of data. Currently, there is no accumulation and ablation measurement network that can provide this information. Satellite and aircraft measurements show the potential to provide crucial information for the assessment of ice-sheet properties (Reference Zwally, Brenner, Major, Bindschadler and MarshZwally and others, 1989; Reference Jezek, Gogineni and ShanablehJezek and others, 1994; Rignot and others, 1993; Reference Abdalati and SteffenAbdalati and Steffen, 1997). The Program for Arctic Regional Climate Assessment (PARCA), which was initialed in 1995 by combining several ongoing programs, has the primary goal of measuring and explaining the mass balance of the Greenland ice sheet (Reference AbdalatiAbdalati, 1996). One of the components of the program is to retrieve shallow ice cores (10–200 m) in order to infer recent climate history and interannual variability of snow-accumulation rates (Anklin and others, in press). It also includes the installation of automatic weather stations (AWSs) at many of the drillhole sites for continual monitoring of local climate conditions.
The mean annual accumulation in northeast Greenland is estimated to be 10 cm w.e. (Reference Ohmura and ReehOhmura and Reeh, 1991). Preliminary analysis of three ice cores located within 25 km of Tunu-N (Fig. 1) gave accumulation rates of 8–13 cm w.e., averaged over 43 years (personal communication from E. Mosley-Thompson, 1997). Several shallow ice cores were retrieved from this low-accumulation region during the 1995 and 1996 field campaigns (Fig. 1). These, and coincident detailed snow-pit studies, showed several faceted crystal layers, some of which could not be related to annual accumulation cycles based on O18 isotope analysis (personal communication from J. White, 1998). In the following, we discuss some mechanisms that might be responsible for the formation of these faceted layers.
The formation of faceted crystal layers in dry-snow regions of the ice sheet is of interest for the interpretation of brightness temperatures from passive microwave satellites. For dry snow, 19 GHz radiation is emitted primarily in the top 2.5 m of the snowpack, and at 37 GHz most of the emission is from the top 30 cm (Reference Ulaby, Moore and FungUlaby and others, 1986). Both theory and field measurements have shown that active and passive microwave signatures of a snowpack are sensitive to parameters describing the snow-cover stratification and the snow microstructure of each layer (Reference StogrynStogryn, 1986; Reference MätzlerMätzler, 1987; Reference West, Tsang and WinebrennerWest and others, 1993). Large snow grains such as faceted crystals (size > 2 mm) within the snowpack act as strong scatterers of microwave emission; consequently, they reduce the microwave brightness temperature.
Time series of brightness temperatures from the Scanning Multichannel Microwave Radiometer (SMMR) and from the Special Sensor Microwave Imager (SSM/I) showed an increase of 18 K in the dry-snow areas of the ice sheet between 1981 and 1987, followed by a decrease after 1987 (Reference Steffen, Abdalati and StroeveSteffen and others, 1993). This anomaly was strongest in the northeastern part of the ice sheet, where accumulation is believed to be minimal. The brightness-temperature increase/decrease did not coincide with observed air-temperature variations from nearby meteorological stations on the northeast coast of Greenland (Reference Steffen, Abdalati and StroeveSteffen and others, 1993). One hypothesis is that the microwave brightness-temperature anomaly is related to metamorphism in the snowpack, and is caused by wind-crust formation and the formation of near-surface faceted crystals, though changes in accumulation rate may also affect brightness temperatures (Abdalati and Steffen, in press).

Fig. 1. The Greenland ice sheet with elevation contour lines (thin) and the margin of the ice sheet (thick line). Tunu-N (78°01′0″ N, 33° 59′ 38″ W; 2113 m) and Humboldt (78° 31′ 36″ ?, 56° 49′ 50″ W; 1995 m) were the locations of shallow ice-coring in 1995 and 1996.
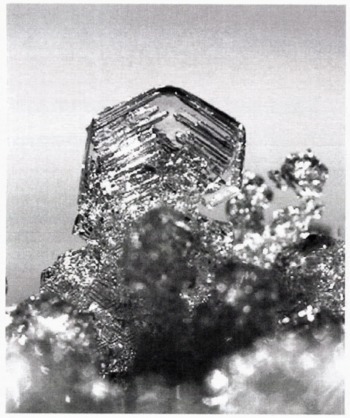
Faceted crystals several mm in size (Fig. 2) develop when large temperature gradients act on low-density snow (Reference ColbeckColbeck, 1983; Reference AlleyAlley, 1988), or because of solar radiation penetration and periodic surface-temperature changes (Reference ColbeckColbeck, 1989; Reference Alley, Saltzman, Cuffey and FitzpatrickAlley and others, 1990; Reference Sturm and BensonSturm and Benson, 1997). Usually, low-density snow forms close to the surface by mass loss to the atmosphere. In polar snow, faceted layers are sometimes found below thin, hard crusts (Reference PalaisPalais, 1984) or dense layers. Reference ColbeckColbeck (1989) reviewed the different mechanisms that lead to faceted crystal formation in polar snow, and concluded that when a dense layer is present in the snow, it is less permeable, and the upward flux of water vapor decreases below the layer. Reference Fukuzawa and AkitayaFukuzawa and Akitaya (1993) have also reported the growth of depth-hoar and faceted crystals in low-density seasonal snowpack. Their held observations and laboratory measurements showed faceted crystal growth in surface layers within 24 hours due to high temperature gradients (>100 K m-1). New results of vapor transport, grain growth and depth-hoar development in subarctic snow are reported by Reference Sturm and BensonSturm and Benson (1997). They found a grain-size increase by a factor of 2–3 by the end of winter, and that sublimation rates from grains are generally higher than the rate at which grains grow.
There are at least two processes that form layers of faceted snow in the polar snow cover. The first process is due to insolation and periodic surface-temperature changes.

Fig. 2. Faceted crystal with a six-sided plate structure, generally found in the mid-winter layers. The crystal diameter is approximately 2 mm for this sample.
It occurs during the late summer and early fall and has been documented previously (Reference ColbeckColbeck, 1989). In the following, we refer to these faceted layers as “summer markers”. Reference BensonBenson (1962) used these distinctive faceted and hoar layers in stratigraphic studies as annual markers for the Greenland ice sheet. The second process, suggested by faceted layers that we found below crusts at the Tunu-N site, takes place during winter, and appears to be the result of rapid changes in winter air temperature associated with katabatic winds. Reference BensonBenson (1962) also reported similar crusts and faceted crystals.
Methods
The snow stratification was studied in two snow pits 100 m apart, with the prime objective of obtaining accumulation values. Snow density was measured every 10 cm using a Kelly-Cutter sampler of 100 cm3 volume and an electronic balance. Average grain-size was observed on a black plate using a magnifying glass (ten-times) with 0.1 mm engravings on a glass plate at its focal point. The hardness of the different snow layers was determined by hand according to Reference ColbeckColbeck and others (1990). At one site, a double pit was prepared with only a thin wall 10 cm wide separating the two holes. Snow-stratigraphie mapping along the exposed wall was greatly enhanced by the through-light, once the primary pit was covered with plywood. Small differences in density and hardness could be distinguished by the differentiated intensity of solar light absorption.
Snow samples were collected in the field from pit 2, by carefully cutting blocks of 10 cm × 10 cm area and 5 cm in height at different depths. To fix the structure, dimethylphtalate at –20°C was introduced into each sample from bottom to top, to replace the air inside the snow. Then the snow samples were stored frozen for laboratory analysis at the U.S. Army Cold Regions Research and Engineering Laboratory (CRREL), Hanover, New Hampshire, following the method described by Reference PerlaPerla (1982), Reference Davis, Dozier and ChangDavis and others (1987) and Reference Good and GuyenneGood (1989). The samples were cut vertically, polished with a microtome, and left for a few hours in the cold room to allow the ice to sublimate. Carbon powder was used to enhance the contrast between the ice and the dimethylphtalate for gray-level digital photography of a 2 cm × 2 cm area, using reflected light from above. The carbon powder (former ice crystals) absorbs the incident light, whereas the air space (now dimethylphtalate) appears to be transparent.
Results and Discussion
Snow characteristics such as hardness, density, crusts and crystal shape are quite similar for both snow pits (Fig. 3). There are more stratigraphie details given for pit 1 due to the observation technique (through-light pit). Layers of faceted and cup-shaped crystals, marked as S95–S92 in Figure 3, were used to divide the snow stratigraphy into annual layers. These layers were verified as summer layers using O18 isotope analysis of a core just beside the snow pit (personal communication from J. White, 1998). Based on these “summer markers”, the accumulation rates varied between 6.5 and 17.6 cm w.e. between 1992 and 1995 (Table 1). The O18 isotope analysis was done in 3 cm steps, which results in an accumulation uncertainty of ± 0.5 cm w.e. assuming a mean snow density of 330 kg m-3. Also snow-density measurements have an inherent error, which we estimate to be in the order of ±0.05 cm w.e. (±1 g weight accuracy of the balance). Combined, we estimate the uncertainty in accumulation rate to be ±0.55 cm w.e. Individual annual accumulation rates for the two snow pits agree within 1.6 cm w.e., which is about 20% for an individual year. A mean accumulation of 11.8 and 11.9 cm w.e. was found for the 4 year record. It is not surprising to find large accumulation variations for individual years on a 100 m horizontal scale in a desert-like climate, such as the low-accumulation region of Greenland. Surface undulation of the summer horizon of several cm, or the “thinning out” of individual snow layers is not uncommon (Fig. 4a).

Fig. 3. Snow stratigraphy from the Tunu-N location for two pits, 100 m apart. Corresponding snow-stratigraphy pictures are shown in Figure 4. Summer horizons for 1992–95 are marked with S92–S95. Eight faceted layers (fa) were found, which are believed to form due to katabatic storm events during winter.
Table 1. Accumulation rates for snow pits at Tunu-N

The faceted layer at 18 cm depth (S95 horizon) in pit 1 can be identified as a bright feature in the photographs (Fig. 4a and b), as more light passes through the low-density media. The crystals consisted mainly of solid six-sided plates 2 mm in size (facet shape, Fig. 2). The next summer horizon (S94) is found at 66 cm depth (pit 1) and 72 cm depth (pit 2). Large cup-shaped crystals 3 mm in size and with a mean layer density of 216 kg m-3 were recorded. The snow grains of the 1993 summer horizon were composed entirely of large cup-shaped crystals, with a mean grain-size of 6.5 mm, showing a significant increase in grain-size with depth for the “summer marker”.
Surface height change at the Tunu-N AWS site was measured with two ultrasonic depth sounders 4.5 m apart at 1.8 and 2.5 m above the surface between June 1996 and June 1997 (Fig. 5). The two depth sounders were used to distinguish surface height change by snow accumulation or snowdrift (sastrugi). Due to the low accumulation at this site, the latter was not observed and data from the two sounders were averaged. The snow-height recordings provide some insight into the annual surface height variations. A lowering of 6.5 cm was found during the summer months June and July 1996, due to snow densification, sublimation and wind erosion. Snow accumulation occurred mainly in November–April based on this 1 year record. A net snow accumulation of 23 cm recorded between June 1996 and May 1997 (approximately 8 cm w.e. assuming 350 kg m -3) is within the variability of the 4 year mean derived for the snow pit. It is interesting to note that snow accumulation from individual precipitation events can be resolved with the sonic height sensors (Fig. 6), and those subsequent storm events aie responsible for a drastic reduction in snow height after the new snowfall.
Throughout the snow pit, several crusts were observed (labeled we in Fig. 3). The crusts had a hard surface (wind-glazed) and were probably formed during katabatic winter storms, which are common at this elevation, originating by gravitational outflow of cold air from higher regions of the ice sheet. When katabatic events occur, wind mixing of the cold-air inversions causes dramatic surface warming; we counted at least ten such storm events during winter 1996–97 coinciding with abrupt temperature changes of up to 30°C (Fig. 5). Cold-air inversions of 10–30°C are common in the Arctic during winter due to radiative cooling of the snowpack and the surface-based air mass. The AWS records from Tunu-N show that near-surface air-temperature variations are correlated with the wind speed, the latter leading the former by 6–9 hours for increasing wind, and 1–4 hours for decreasing wind (Fig. 6). These abrupt temperature changes occur simultaneously over a distance of several hundred km (e.g. they were observed at both Humboldt and Tunu AWS locations). Both stations are affected by the same katabatic outflow of cold air from central Greenland (Reference Bromwich, Du and HinesBromwich and others, 1996). Reference Murphy and SimmondsMurphy and Simmonds (1993) reported the same phenomenon for Antarctica during winter.

Fig. 4. Through-light photography of Tunu-N snow-pit 1 samples. The locations for (a) – (c) are marked in Figure 3. (a), with an area of 25 cm × 35 cm, shows low-density snow (top), followed by a wind-pack snow layer with two wind crusts, the 1995 summer horizon and a fueled layer at 24 cm depth, which we believe formed during winter. The black square identifies the location of (b), covering an area of 9 cm × 13.5 cm. The faceted layer appears bright in the through-light photography, as less light is absorbed by the low-density media. (c) covers cm area of 36 cm × 54 cm and shows several wind crusts (see Fig. 3), which were caused by repealed effect of katabatic storms on the snow cover during winter. In the lower third of the picture the 1994 summer horizon can be identified.

Fig. 5. Averaged snow-height change recorded with two sonic depth sounders at ?unu-N, June 1996–June 1997. The corresponding air temperature is shown in the upper part of the graph. During June and July a net surface lowering was observed due to sublimation, wind erosion and snow compaction, and a net accumulation occurred during November–April. Note the strong air-temperature fluctuations during winter caused by winds mixing cold-air inversions. Eleven such storm events are labeled. The wind forcing of the near-surface temperature is shown for the shaded part of the air-temperature graph in Figure 6.

Fig. 6. Abrupt temperature variations at Tunu-N for a period of 8 days in November 1996. The near-surface air-temperature variations are correlated with wind speed, the latter leading the former by 6–9 hours for increasing wind, and 1–4 hours for decreasing wind. A temperature change of 30°C within 2–3 days was observed at least ten times (Fig. 5).
Faceted layers were found below must crusts in the pit (labeled fa in Fig. 3). These layers, with smaller faceted crystals than the ones found in the “summer markers”, were identified at 24, 35, 43, 63, 78, 84, 102 and 128 cm depth (Fig. 3). A notable faceted layer with a mean grain-size of 2 mm was round in both snow pits at 43 cm depth. The grain shape varied between facet- and cup-shaped. We believe that the faceted layers were formed during winter: (a) they are found between summer layers, and (b) their isotopic signal is typical for winter conditions. We suggest the following mechanism for the formation of these faceted layers: During the “warm winter storms” the surface snow cover densities due to the mechanism of the wind breaking up the snow grains, and occasionally a crust is formed by the wind-packing of these broken grains. The snow temperature near the surface increases due to the warm air. The subsequent radiative cooling of the top snow layer after the storm sets up a strong temperature gradient in the upper snow layers, resulting in an increased vapor-pressure gradient. If the temperature gradient is sufficiently large, the condensation increase can lead to faceting of the snow crystals (Reference ColbeckColbeck, 1989), and consequently the creation of faceted layers in mid-winter. Wind crusts or wind-packed snow are particularly favorable for the formation of faceted crystals, as they are less permeable and the upward flux of water vapor is forced to condense. In general, we observed winter crusts underlain by faceted layers in the two snow pits.
We used the AWS data from Tunu-N (11 November–3 December 1996) to approximate near-surface temperature gradients in the snow during the katabatic storms and the subsequent cooling after the storm. One thermocouple was placed on the snow surface in June 1996, and was buried in snow as the season progressed (Fig. 7, snow-depth curve). The snow height above this sensor is shown in Figure 7. Since we have no snow-surface temperature record, we used the air temperature as a proxy value. We are aware that the use of air temperature as a surrogate for snow-surface temperature is problematic since the latter lags in time (< 1 h) with a reduced amplitude response to external forcing. This approximation will tend to be closer to reality when there is wind flow over the snow surface, but when the winds stop. the snow surface will cool even more dramatically than the air due to radiative cooling. Therefore, during low wind, the temperature gradient will be underestimated. The approximated temperature gradients for the top snow cover (5–14 cm in depth) show values in excess of 50 K m-1 (a 5 K gradient over 10 cm) for periods of high wind (Fig 7). The gradient even exceeds 100 K m-1 on 11 November 1996, assuming a 3–4 K error in snow-surface temperature approximation (colder snow surface during low wind). Also large negative temperature gradients in excess of 100 K m-1 were found to be caused by atmospheric warming during katabatic storms, resulting in a reversal of the water-vapor flux. The snow température at Im depth varied only by ±1°C over the period of 8 days shown in Figure 7; hence, large temperature gradients (negative as well as positive) are limited in the top snow layer. This simple approximation suggests that snow-temperature gradients in excess of the critical gradient (~25 K m-1) necessary for faceted crystal development (Reference Sturm and BensonSturm and Benson, 1997) can occur during katabatic storms, and after the storms with subsequent radiative cooling.

Fig. 7. Hourly AWS record of wind speed, air and snow temperatures, and snow height for Tunu-N in northeast Greenland (Fig. 1). The zero level for the snow height represents the summer 1996 height, and the position of the first snow-temperature thermistor. The temperature gradient in the top snow layer exceeds the critical value of 25 K m-1 necessary for faceted crystal development (Reference Sturm and BensonSturm and Benson, 1997) several times.
Due to the low accumulation rate at Tunu-N during winter (Fig. 5), several “warm storm events” and the subsequent radiative cooling interact with the same snow surface, and hence this process occurs repeatedly on the same surface layer. For example, eight katabatic storms acted on the same snow surface over a period of 2.5 months (sec Fig. 5, snow height 15 November 1996–20 January 1997). We suggest that most of the faceted layers found at the Tunu-N site can be explained by this repealed heating/cooling sequence.
Conclusion
A mean accumulation of 11.9 cm w.e. was found fora 4 year period for both snow pits, 100 m apart. This agrees well with the value of 10 cm published by Reference Ohmura and ReehOhmura and Reeh (1991), and falls within the 9–13 cm range obtained from preliminary analysis of three ice cores in the vicinity of Tunu-N (personal communication from E. Mosley-Thompson, 1997). An accumulation value of 8 cm w.e. was also measured with sonic height sounders for Tunu-N between June 1996 and June 1997. However, annual differences as huge as 20% were found in pits less than 100 m apart. We attribute these large accumulation variations to local wind erosion and redistribution of snow. Future analysis of the 15 Greenland Climate Network (GC-Net) snow-height records, distributed over the entire ice sheet (Reference AbdalatiAbdalati, 1996), will provide more information on the spatial accumulation variability.
Several crusts with only a few grains in thickness, invariably associated with an underlying faceted layer, were detected in two snow pits. We believe that most of these crusts underlain by faceted crystals were caused by katabatic winter storms, based on wind records from Tunu-N. On average, two wind crusts with underlain faceted crystals were found per annual accumulation depth.
These katabatic storms are also responsible for large air-temperature fluctuai ion throughout winter. Abrupt temperature changes of up to 30°C were observed within two days, due to turbulent mixing of cold-air inversions. We suggest that the “warm winter storms” and the subsequent radiative cooling of the snow surface are the cause of the faceted layers found within the annual accumulation. The frequent abrupt air-temperature change causes a strong temperature gradient in the top snow layer. This can lead to strong vapor-pressure gradients and faceted crystal growth. Because of low accumulation, up to eight katabatic storms acted on the same snow surface over a period of 2.5 months in winter 1996. This repeated occurrence of katabatic storms has probably the strongest effect on the snow cover in northeast Greenland due to its low accumulation rate. Six times we found a faceted layer underneath a wind crust, indicating that the two suggested processes have a strong link. On three occasions we observed a wind crust only. It is possible that some of the wind crusts (without faceted layers) are formed in late fall when wind-induced abrupt temperature changes are much smaller (Fig. 5)).
We have no direct proof that the faceted layers were formed due to increased temperature gradient in the snow-pack as the result of katabatic storms. However, our AWS record from the following winter suggests temperature gradients of up to 100 K m-l in the top 10 cm snow layer as a plausible cause. Subsequent research either in the laboratory or, more likely, in a field plan designated for that purpose should be carried out in the future. However, these findings have important implications for snow-pit analysis in low-accumulation areas in general, and for the interpretation of microwave radiation in particular, where a single season’s faceted layer can impact the microwave brightness temperature by several K (Abdalati and Steffen, in press). The observed wind crusts and faceted layers are also important in snow ventilation, as a wind crust will decrease air flow, and a faceted layer will channel the air flow horizontally according to wind-pumping model results for layered snow (Reference ColbeckColbeck, 1997). Further, in low-accumulation regions such as at Tunu-N, the existence of faceted layers close to the surface is important for ice-core analysis, as these layers tend to trap more aerosols and other foreign material due to enhanced airflow.
Acknowledgements
This project was supported by NASA Polar Program grant NAPW-2158 and U.S. National Science Foundation grant OPP-9423530. We would like to thanks A. Nolin for her help in retrieving snow-pit data and her ceaseless efforts during the ice-coring. We are grateful to R. Davis from the CRREL for his help and advice in sample preparation and analysis. Also, we want to thank the Snow and Ice Research Group of the University of Nebraska for their logistical support. Three reviewers provided valuable suggestions that greatly improved the paper.