


Introduction
Eating disorders (EDs) are complex mental health conditions associated with significant physical and psychological impairments (van Hoeken and Hoek, Reference van Hoeken and Hoek2020). Early intervention is critical in ED care and can reduce service-level barriers to access and improve outcome (Allen et al., Reference Allen, Mountford, Elwyn, Flynn, Fursland, Obeid, Partida, Richards, Schmidt, Serpell, Silverstein and Wade2023). Recognising this, clinical guidelines emphasise the importance of timely detection and treatment (Royal College of Psychiatrists, 2019). This is particularly important given that individuals who seek support for EDs often experience more prolonged and severe symptoms, heightened body image concerns, and co-morbid mental health difficulties compared with those who do not seek treatment (Carrino et al., Reference Carrino, Flatt, Pawar, Sanzari, Tregarthen, Argue, Thornton, Bulik and Watson2023). Consequently, eating disorder services may be disproportionately accessed by individuals with more severe and chronic presentations. For those with milder symptoms, several barriers to seeking care have been identified. Individuals may delay treatment due to concerns that they are not ‘sick enough’ to warrant professional support (Eiring et al., Reference Eiring, Wiig Hage and Reas2021). Additionally, healthcare professionals may trivialise mild presentations or apply weight-based service access criteria, further preventing early intervention (Ali et al., Reference Ali, Farrer, Fassnacht, Gulliver, Bauer and Griffiths2017; Kästner et al., Reference Kästner, Weigel, Buchholz, Voderholzer, Löwe and Gumz2021). Primary healthcare clinicians also tend to have greater knowledge of the diagnostic criteria for anorexia nervosa (AN) and bulimia nervosa (BN) than for binge eating disorder (BED) or other specified feeding or eating disorders (OSFED), contributing to under-recognition of these conditions (Cain et al., Reference Cain, Buck, Fuller-Tyszkiewicz and Krug2017). Lived experience individuals, researchers and clinicians also argue that an overfocus of physical and behavioural metrics can overlook emotional and psychological impacts of an ED, yet there is a growing population of individuals without a diagnosis who would benefit from early intervention (Brown et al., Reference Brown, Murphy-Morgan and Downs2025). In line with recommendations for attending to transition-age individuals including students and increasing access as well as reducing waiting time (Department of Health and Social Care, 2025; Viljoen et al., Reference Viljoen, King, Harris, Hollyman, Costello, Galvin and Ayton2024), there is a need for a no-minimum threshold service for ED to provide timely support to emerging adults.
From a service provision perspective, traditionally, ED treatment is resource-intensive. Evidence-based treatment such as enhanced cognitive behavioural therapy for eating disorders (CBT-E) is delivered over 20 or more sessions (Fairburn, Reference Fairburn2008). More recently, brief CBT for ED (CBT-T), a brief and protocol-driven 10-session model, has gained attention as a clinically effective intervention for patients with non-underweight EDs (Keegan et al., Reference Keegan, Waller and Wade2022). CBT-T incorporates a structured approach that addresses key areas such as regular eating, emotion regulation, and body image concerns, and leverages the principle of early behavioural change. A review session at session 4 is used to assess treatment suitability, with six subsequent sessions offered contingent upon meaningful early therapy engagement (Waller et al., Reference Waller, Turner, Tatham, Mountford and Wade2019). Engagement is indicated by undertaking of the requested therapy tasks such as appropriate weighing, regular eating or completing a food diary. Emerging evidence suggests that CBT-T is associated with significant reductions in global ED psychopathology, with large effect sizes observed at mid-treatment, post-treatment, and follow-up at 1 and 3 months (Wade et al., Reference Wade, Ghan and Waller2021). A meta-analysis by Keegan et al. (Reference Keegan, Waller and Wade2022) reported medium to large effect sizes for eating disorder symptoms, psychosocial impairment, depression, anxiety, and the frequency of binge eating and purging behaviours. Furthermore, a narrative synthesis by Paphiti and Newman (Reference Paphiti and Newman2023), examining eight studies of CBT-T in clinical settings demonstrated large reductions in ED psychopathology, with outcomes comparable to both CBT-E and guided self-help (GSH). CBT-T was particularly effective in reducing binge eating, with smaller to moderate effects on purging behaviours. Additionally, CBT-T resulted in significant improvements in co-morbid depression and anxiety symptoms, comparable to GSH by the end of treatment and at follow-up.
Despite the growing evidence supporting CBT-T, certain gaps remain. Most treatment studies in CBT-ED examined global pre/post-treatment effectiveness rather than utilising session-by-session data, with the exception of few studies such as that of Jenkins et al. (Reference Jenkins, Luck, Violato, Robinson and Fairburn2021) in the context of guided self-help for binge eating disorder, as well as Kambanis et al. (Reference Kambanis, Graver, Palmer, Stern, Tabri, Dunford, Burton-Murray, Breithaupt, Wang, Rossman, Mancuso, Andrea, Waller, Freid, Eddy, Thomas and Becker2025) for non-underweight ED. Kambanis et al. (Reference Kambanis, Graver, Palmer, Stern, Tabri, Dunford, Burton-Murray, Breithaupt, Wang, Rossman, Mancuso, Andrea, Waller, Freid, Eddy, Thomas and Becker2025) explored the relationship between early behavioural change and subsequent cognitive change in CBT-T. Whilst they observed large reductions in both cognitive and behavioural symptoms from pre- to mid-treatment, and from pre- to post-treatment, these changes had distinct trajectories: cognitive changes were more gradual than behavioural changes; contrary to what they predicted, behavioural change did not predict subsequent cognitive changes. Understanding the trajectory of change during treatment and identifying when attrition occurs could provide valuable insights into optimising care and supporting recovery. Future research is necessitated to explore the relationship between behavioural and cognitive changes. Another question that arises is whether session 4 is the most predictive of change and recovery, which impacts on subsequent treatment allocation and planning.
Current study aims
This current evaluation aims to address these gaps by examining CBT treatment outcomes in a naturalistic routine care setting specialising in non-underweight individuals with EDs in a diverse area of London. The service operates as a ‘no-minimum threshold’ service, increasing access to treatment.
Specifically, the aims were to:
-
(1) Assess the effectiveness, predictors, and attrition of CBT-T in a naturalistic, diverse setting among young adults;
-
(2) Explore the relationship between changes in eating concern, weight/shape concern and ED symptom severity;
-
(3) Explore the timing at which reliable improvement predicts the ED symptom score below the clinical cut-off at the last session.
We hypothesised that CBT-T was effective in reducing ED symptoms in routine clinical service. However, given the relatively nascent studies regarding session-by-session changes in CBT-T, we did not formulate specific directional hypotheses about changes in eating and weight/shape concern on ED severity, or about the relationship between the timing of reliable improvement and whether the ED symptom score falls below the clinical cut-off at the last recorded session.
Method
As this was an evaluation of routine clinical practice, ethical approval was not needed according to the UK Health Research Authority decision tool (https://www.hra.nhs.uk/). The evaluation was pre-registered in an internal database and was approved by Central and Northwest London NHS Foundation Trust Audit and Governance team.
Setting
The service is established within a large ED service in the National Health Service (NHS) in the UK to meet the needs of young adults with mild to moderate eating disorders. The team is staffed by allied health professionals, primarily psychological therapists. The majority of the team consists of pre-qualification assistant psychologists (psychology graduates who have not undergone substantial psychotherapy training working under supervision of qualified psychologists), and medical care is held by the general practitioner outside of the service. The age range of the service was initially 18–25 years but as of May 2024 this was widened to 35-year-olds. The aims of the service are to operate without minimum access thresholds, promote ease of access, and offer rapid referral to treatment times for all individuals presenting with mild to moderate EDs. The service offers CBT interventions of different intensities according to clinical need, including bookable one-off workshops, guided self-help, CBT-T, and enhanced CBT (CBT-E).
Patient group
The new service pathway became fully operational in January 2023 and all data from patients allocated to CBT-T between January 2023 and July 2024 were analysed. Eligibility for the service was determined by internal risk-based criteria that require patients to be have a BMI above 17 kg m−2, not engage in more than one episode of purging behaviour per day at the time of assessment, present as psychiatrically stable, and have stable bloodwork or medical condition, meaning that a full multi-disciplinary team (MDT) is not necessary for safe case management. If service users were determined ineligible for the service, they would be referred to the sister service where a full MDT was present. As the service primarily supported young adults, service agreements were in place with university health centres. An exception to the age criteria is mature students who were registered at a university GP practice where a service agreement was in place to support all registered students requiring the service.
Treatment procedure
On average, the waiting time from referral for first contact for assessment was 2 weeks.
Cognitive Behavioural Therapy-Ten (CBT-T) (10 sessions with maximum of two follow-ups) was mostly delivered by pre-qualified assistant psychologists. All clinicians received a 2-day training on the CBT-T model as well as weekly supervision (in the form of individual or group supervision) by the consultant clinical psychologist in the service to ensure adherence and fidelity to the model.
Measures
The following information was collected at the referral/assessment: demographics, first presentation, BMI, treatment history, ED diagnosis. The diagnosis was determined following a clinical assessment by the assessor followed by discussion with the duty senior clinician or at the weekly team meeting. All patients completed the Eating Disorders Examination Questionnaire (EDE-Q; Fairburn and Beglin, Reference Fairburn, Beglin and Fairburn2008), Clinical Impairment Assessment (CIA; Bohn and Fairburn, Reference Bohn and Fairburn2008), Patient Health Questionnaire-9 (PHQ-9; Kroenke et al., Reference Kroenke, Spitzer and Williams2001), and Generalised Anxiety Disorders Questionnaire-7 (GAD-7; Spitzer et al., Reference Spitzer, Kroenke, Williams and Löwe2006) at assessment and at the end of treatment. Patients additionally filled in ED-15 (Tatham et al., Reference Tatham, Turner, Mountford, Tritt, Dyas and Waller2015), a 15-item weekly measure to monitor core diagnostic eating disorder behaviour and attitudes over the previous week on a 6-point Likert scale. Two subscales (Weight and Shape Concerns, and Eating Concerns) were derived and were averaged to calculate the global score. These are all questionnaires with well-established psychometric properties.
Reliable change and clinically significant improvement
EDE-Q
Reliable change index (RCI) was calculated based on Jacobson and Truax (Reference Jacobson and Truax1991), taking the r value from the non-clinical population norm (Rose et al., Reference Rose, Vaewsorn, Rosselli-Navarra, Wilson and Weissman2013). The RCI in this study using the EDE-Q is 0.96. For EDE-Q, clinical recovery was defined as below cut-off of ≤2.77 on the EDE-Q Global scale (Fairburn et al., Reference Fairburn, Cooper, Doll, O’Connor, Bohn, Hawker, Wales and Palmer2009).
ED-15
RCI in the current evaluation is 1.375 on the ED-15 Eating Concern subscale, and 0.926 on the Weight/Shape Concern subscale using the clinical and non-clinical norm from Tatham et al. (Reference Tatham, Turner, Mountford, Tritt, Dyas and Waller2015). Eating concern refers to difficulty experienced around food, namely restrictive practices or worry about losing control over eating; weight and shape concerns refers to difficulties relating to thoughts about appearance, weight and shape. To measure clinical recovery using the ED-15 scale, the cut-off score was computed using formula C from Jacobson and Truax, (Reference Jacobson and Truax1991), resulting in a cut-off of 3 on the ED-15 Global score.
PHQ-9 and GAD-7
The NHS Talking Therapies in Anxiety and Depression Services defines anxiety and depression caseness as a reported score of ≥8 on the Generalised Anxiety Disorder Questionnaire (GAD-7) and ≥10 on the Patient Health Questionnaire (PHQ-9), respectively. Reliable change is a decrease of ≥6 on PHQ-9 or ≥4 on GAD-7 (Porter et al., Reference Porter, Franklin, De Vocht, d'Apice, Curtin, Albers and Kidger2024).
Analysis
Analyses were performed in R Studio (R Core Team, 2021) and IBM SPSS Statistics for Windows, version 29.0 (IBM Corporation, 2023). Linear mixed-effects models with maximum likelihood estimation were used to examine if there were significant changes in the pre- to post-intervention scores on the (i) EDE-Q global and subscales, (ii) CIA, (iii) PHQ-9 and (iv) GAD-7 as intent-to-treat (ITT) analyses. Participant was specified as a random effect to allow for individual variation. Time point (pre/post) was specified as a categorical fixed factor. Additional LMMs were conducted to reduce negative bias by excluding patients who were still in treatment at the time of data analysis. Paired-sample t-tests were used to evaluate treatment outcomes as completer analysis (see Supplementary material). In terms of moderator analyses to examine predictors of outcomes and drop-outs, chi-squared and linear regression were used. The Kaplan-Meier curve was also used to visualise the timing of drop-outs.
Using the session-by-session data, ROC analysis was used to determine the timing at which reliable improvement predicted remission at last session of CBT-T using the approach similar to Jenkins et al. (Reference Jenkins, Luck, Violato, Robinson and Fairburn2021). For the ROC analysis, At least 66 participants were needed to achieve a power of 0.8 and alpha level of 0.05 (Jenkins et al., Reference Jenkins, Luck, Violato, Robinson and Fairburn2021). In the current evaluation, data from the first six sessions of CBT-T were entered into analysis to achieve the participant size at the later stage of treatment. Patients who attended at least six sessions were included in this analysis, and patients with subthreshold EDs were excluded. Six sessions were chosen as it was not necessary to include data at later stages of treatment as this was not the main research question as we were interested in the earliest point where reliable improvement could be predicted.
Results
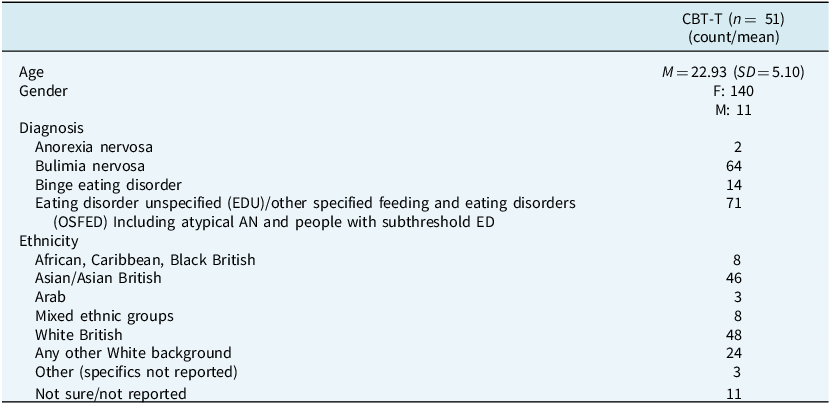
Across the time period, 159 patients were allocated CBT-T, and 119 of them were first-time treatment seekers (74.8%). Table 1 shows the demographic characteristics of patients who were offered CBT-T. Figure S1 (Supplementary material) shows a flow diagram of the service users who were offered CBT-T. One CBT-T patient had to be stepped up to a higher level of care after assessment (i.e. the sister specialist ED service with a full MDT), two delayed treatment and three did not take up treatment. These people were excluded in the analysis. As a result, 151 service users received CBT-T in the service, and were therefore entered in the ITT analysis. Among patients who received/were receiving CBT-T, 62 patients completed treatment; at the time of data analysis, 40 were still in treatment. The 62 patients were entered in the completer analysis.
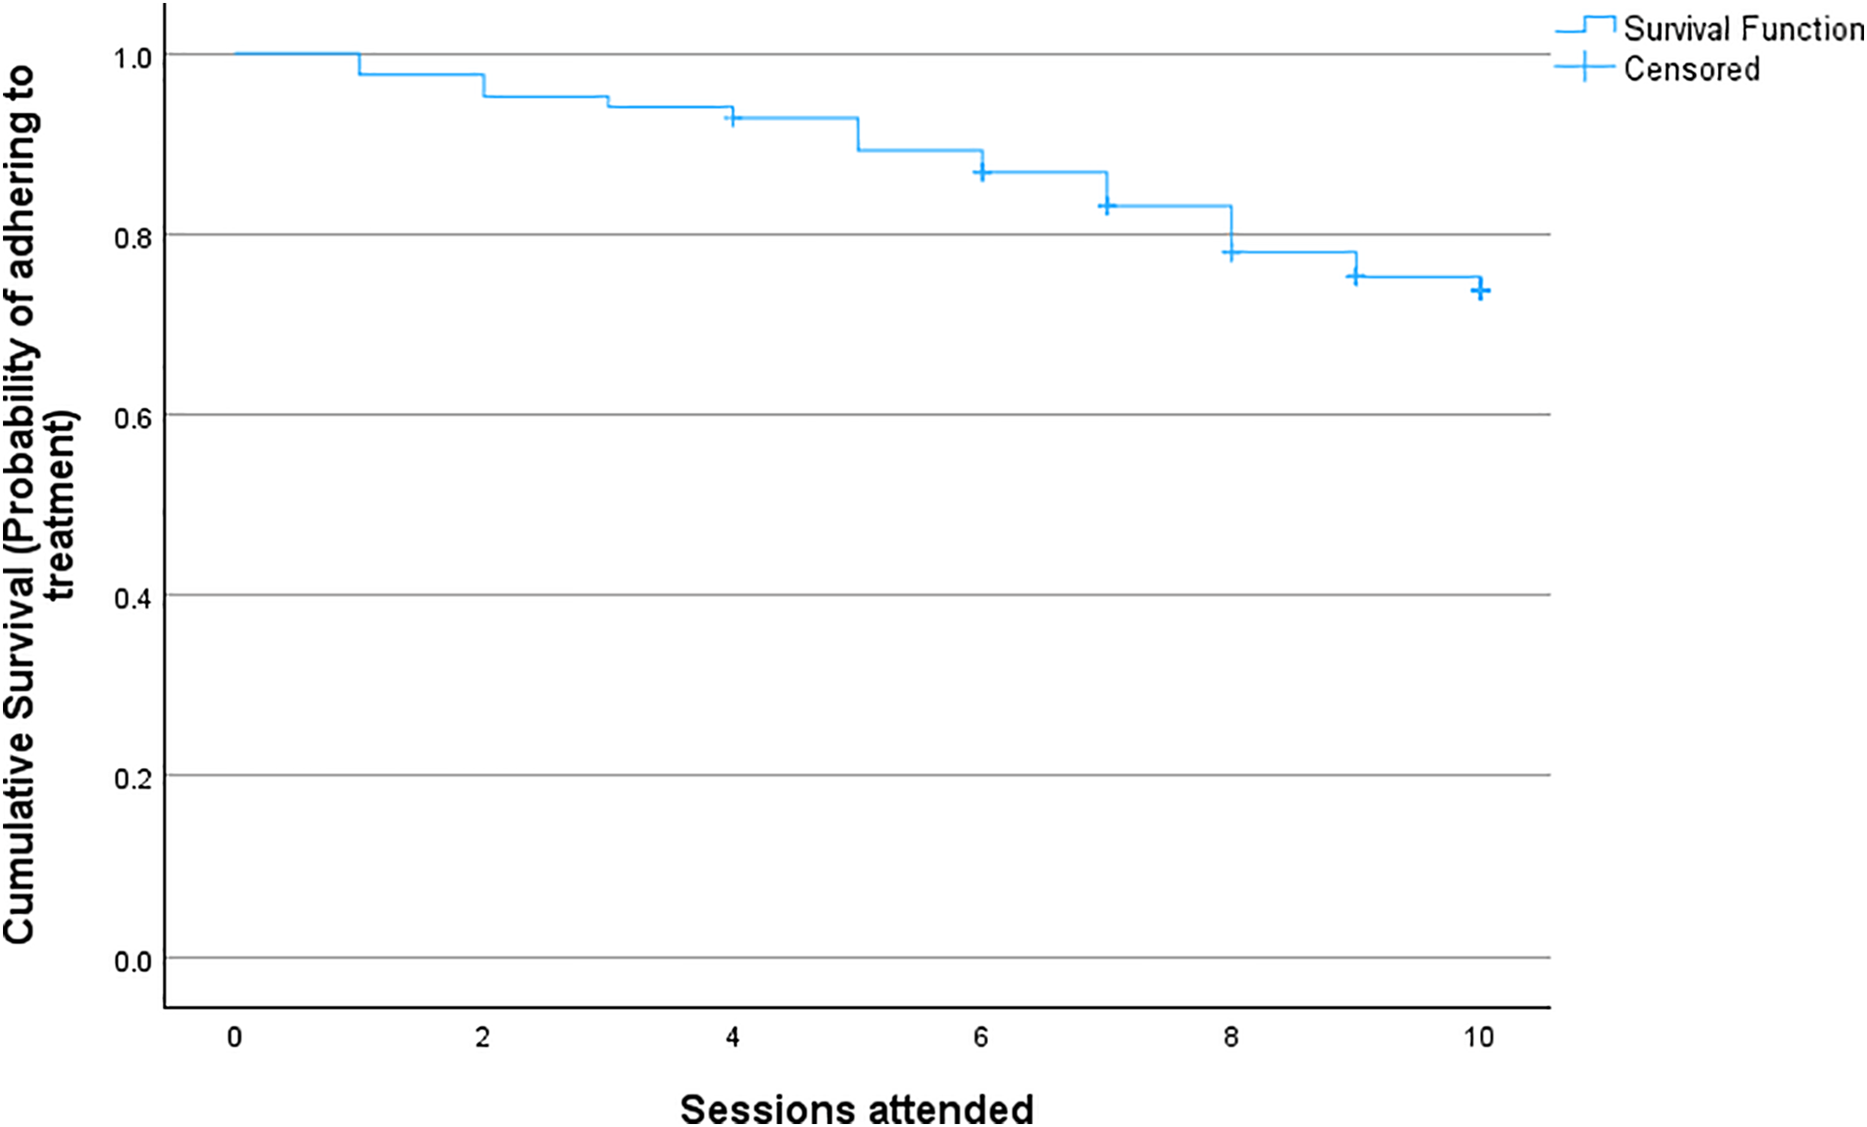
Kaplan-Meier curve of timing of ending treatment in CBT-T.

Patient demographics

Table 1. Long description
A table with 10 rows and 3 columns detailing patient demographics for a study on CBT-T. The columns are labeled ‘Age’, ‘Gender’, and ‘Diagnosis’. The ‘Age’ row shows a mean of 22.93 with a standard deviation of 5.10. The ‘Gender’ row indicates 140 females and 11 males. The ‘Diagnosis’ row includes Anorexia nervosa with 2 cases, Bulimia nervosa with 64 cases, Binge eating disorder with 14 cases, and Eating disorder unspecified/other specified feeding and eating disorders including atypical AN and people with subthreshold ED with 71 cases. The table also includes rows for ethnicity with counts for African, Caribbean, Black British (8), Asian/Asian British (46), Arab (3), Mixed ethnic groups (8), White British (48), Any other White background (24), Other (specifics not reported) (3), and Not sure/not reported (11).
Treatment effectiveness
ED-symptom change
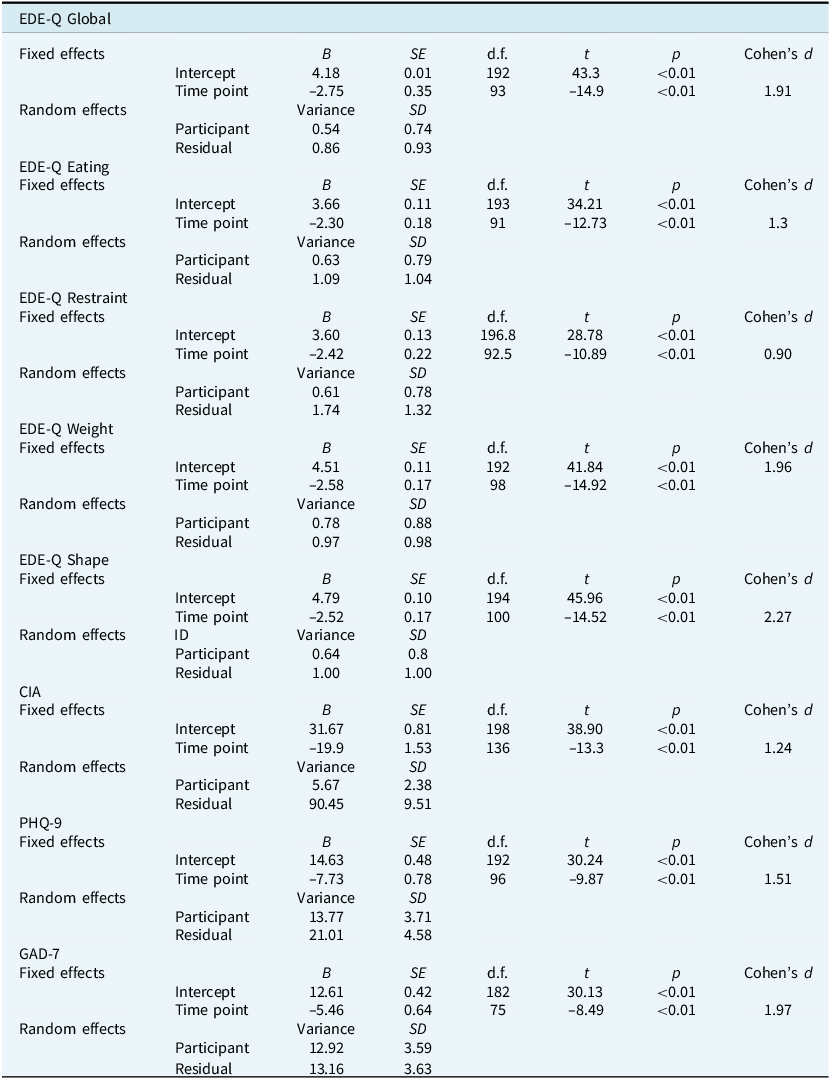
Tables S1a and 1b (Supplementary material) show the ITT and completer correlation matrixes of EDE-Q, CIA, PHQ-9 and GAD-7. Table 2 shows the ITT results of the linear mixed effects (LMM) models. Significant fixed effects were found for time (i.e. treatment), showing that CBT-T was associated with lower scores on EDE-Q global and all subscales, as well as less ED-related impairment indicated by CIA. To avoid negative bias, additional LMMs were conducted to exclude patients who were in treatment (Table S2, Supplementary material). The results corroborate the ITT analyses with large effect size for EDE-Q global and for all EDE-Q subscales and CIA. For the completer analysis, paired-sample t-tests indicate that ED treatment significantly improved ED-related symptoms across all subscales and reduced impairment in daily life, with a large effect size on the EDE-Q global score and large effect sizes on the EDE-Q subscales and CIA among patients who completed pre- and post-treatment questionnaires (see Supplementary material, Tables S3 and S4). Using EDE-Q global score, all patients who completed pre/post-measures achieved reliable change (n=50). Based on the cut-off of 2.77, of those who provided both pre/post-data and those whose baseline EDE-Q reached a clinical threshold (n=38), 73.7% of the patients scored below the clinical cut-off at the end of the treatment.
Summary of the LMM models

Table 2. Long description
The table presents the results of linear mixed effects (LMM) models for different psychological assessments. It includes fixed effects such as Intercept and Time point, with corresponding B, SE, d.f., t, p, and Cohen’s d values. Random effects include Participant Variance and Residual SD. The assessments covered are EDE-Q Global, EDE-Q Eating, EDE-Q Restraint, EDE-Q Weight, EDE-Q Shape, CIA, PHQ-9, and GAD-7. Each assessment section lists the fixed and random effects with their respective statistical values. Notable trends include significant negative B values for Time point across all assessments, indicating lower scores post-treatment. Cohen’s d values show large effect sizes for most assessments, suggesting substantial improvements. The table provides a comprehensive overview of the statistical analysis of treatment effects on various psychological measures.
Mood-related symptoms change
LMM analyses indicated that CBT-T was associated with a significantly lower depression score and anxiety scores indicated by PHQ-9 and GAD-9 at post-treatment (Table 2). For the completer analysis, paired-sample t-tests show that, on average, patients reached caseness on both anxiety and depression scales pre-treatment, and on average both reliable change and clinical significant change (i.e. below caseness) were achieved at post-treatment (see Supplementary material).
Moderator analyses
Predictors of outcome
Linear regression was used to determine whether baseline scores (EDE-Q, CIA, PHQ-9, GAD-7) predicted ED outcome measured by differences in pre–post EDE-Q Global scale (post-treatment score minus pre-treatment score). The overall model was statistically significant (F 5,42=158.53, p<.001), explaining 94.4% of the variance. However, only baseline EDE-Q score predicted the outcome (β=–1.02, p<.001). Higher baseline score predicts larger magnitude of symptoms reduction.
Attrition
In the real-world setting, some service users ended the treatment early due to other life priorities (e.g. focusing on academic studies or other non-ED issues) (n=41), some decided to end treatment early due to goals being reached/eating issues being resolved (n=3), some terminated early due to lack of progress and were agreed with the therapist at session 4 (n=5), some were still in treatment at the time of audit (n=40) (Fig. S1, Supplementary material). As the service did not have a waiting list, people were encouraged to re-refer themselves and access the treatment when they needed. Those who were still in treatment were excluded from the attrition analysis.
Those who ended treatment early due to life priorities or lack of progress were classified as ‘non-completers’ in the current data analysis. Chi-squared analyses and linear regression revealed that attrition was not significantly associated with demographics (e.g. gender, ethnicity, BMI, diagnosis) or with baseline symptoms (EDE-Q, PHQ-9, GAD-7) (p>0.05).
The Kaplan-Meier survival curve shows the cumulative probability of staying in the service. At the end of 10 sessions, cumulatively, roughly 25% of patients ended treatment due to other life priorities/lacking progress.
Relationship between change in eating concern and weight/shape concern on recovery
Table 3 shows the mean and standard deviation of the ED-15 scales at sessions 1, 4 (review session), and 10.
Descriptives of ED-15 score in sessions 1 and 4

Table 3. Long description
The table presents the mean and standard deviation of the ED-15 scales at sessions 1, 4, and 10. It consists of three columns and four rows, including the header row. The columns are labeled Session 1 Mean (SD) with n=122, Session 4 Mean (SD) with n=96, and Session 10 Mean (SD) with n=47. The rows are labeled ED-15 Global, ED-15 Eating Concern, and ED-15 Weight/Shape Concern. Row 1: ED-15 Global, Session 1 Mean (SD) 3.77 (1.15), Session 4 Mean (SD) 3.32 (1.23), Session 10 Mean (SD) 2.098 (1.25). Row 2: ED-15 Eating Concern, Session 1 Mean (SD) 3.88 (1.16), Session 4 Mean (SD) 3.31 (1.18), Session 10 Mean (SD) 2.11 (1.18). Row 3: ED-15 Weight/Shape Concern, Session 1 Mean (SD) 3.71 (1.38), Session 4 Mean (SD) 3.34 (1.44), Session 10 Mean (SD) 2.10 (1.48).
A chi-squared test of independence was performed to evaluate the relationship between reliable change of the subscales at session 4 (compared with baseline) and recovery status as indicated by the ED-15 clinical cut-off (<3) at the last session. The relationship between the Eating Concern subscale and remission at last session was non-significant, χ2 (1,46)=.26, p=.61. The relationship between the Weight/Shape Concern subscale and recovery status defined by lower than the ED-15 clinical cut-off was significant, χ2 (1,46)=4.02, p=.045, meaning that people with a reliable improvement on the Weight/Shape concern subscale of ED-15 at session 4 were more likely to reach subclinical threshold indicated by ED-15.
The timing at which reliable improvement predicted recovery at last session
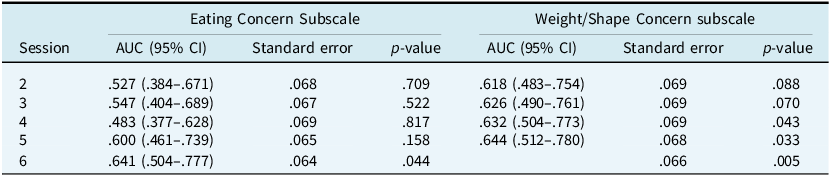
To examine the predictive power of treatment time (as indicated by session number using the data from the first six sessions) on recovery (using the clinical cut-off of ED-15 at the last recorded session), ROC analysis was used. A total of 76 patients were included in the analysis. Figures S2a and S2b (Supplementary material) show the ROC curve for the Eating Concern subscale and the Weight/Shape Concern subscale. In Table 4, a reliable decrease in ED-15 Eating Concern subscale at session 6 was significant (but not at other sessions) in relation to recovery status at last session (p=.044). For Weight/Shape Concern, a reliable decrease before session 4 was significantly associated with reaching subclinical level indicated by ED-15 (p=.043). In other words, reliable changes in Weight/Shape Concern subscale but not Eating Concern Subscale at session 4 was found to be better than random chance at predicting recovery at last session.
ROC analysis of reliable change of the two subscales predicting recovery at last session using ED-15

Table 4. Long description
A table with two main columns: Eating Concern Subscale and Weight/Shape Concern subscale. Each main column is divided into three sub-columns: AUC (95% CI), Standard error, and p-value. The table has six rows labeled by Session numbers from 2 to 6. Row 2: Eating Concern Subscale AUC (.527 (.384–.671)), Standard error .068, p-value .709; Weight/Shape Concern subscale AUC (.618 (.483–.754)), Standard error .069, p-value .088. Row 3: Eating Concern Subscale AUC (.547 (.404–.689)), Standard error .067, p-value .522; Weight/Shape Concern subscale AUC (.626 (.490–.761)), Standard error .069, p-value .070. Row 4: Eating Concern Subscale AUC (.483 (.377–.628)), Standard error .069, p-value .817; Weight/Shape Concern subscale AUC (.632 (.504–.773)), Standard error .069, p-value .043. Row 5: Eating Concern Subscale AUC (.600 (.461–.739)), Standard error .065, p-value .158; Weight/Shape Concern subscale AUC (.644 (.512–.780)), Standard error .068, p-value .033. Row 6: Eating Concern Subscale AUC (.641 (.504–.777)), Standard error .064, p-value .044; Weight/Shape Concern subscale AUC (.660 (.525–.795)), Standard error .066, p-value .005.
Discussion
Summary of key findings
The service evaluation aimed to assess the effectiveness of CBT-T in a naturalistic routine care setting specialising in non-underweight EDs in a young, ethnically diverse population. The evaluation also aimed to look at whether there were any moderators of change and the attrition to guide clinical decision making. Additionally, the evaluation explored the predictive power of different types of cognitive changes on ED symptom severity, as well as the timing at which reliable improvement of these changes predicted recovery.
This clinical evaluation of a new eating disorder service pathway for young adults with mild to moderate EDs yielded promising results, challenging the common narrative that ED is always hard to treat, and attesting to the idea that offering dedicated care while symptoms are mild is a favourable treatment model. Overall, both ITT and supplementary analyses (completer and analysis without the in-treatment group) showed that patients had significant improvements in ED-related symptoms, daily life impairment, and mood-related outcomes. Furthermore, the study demonstrates that such treatments can be effectively delivered by pre-qualification assistant psychologists with suitable experience, training, and supervision. The recovery rate was comparable to other studies in different settings (Paphiti and Newman, Reference Paphiti and Newman2023). The effect sizes in this study (ITT analysis) were comparable to previous studies (e.g. Keegan et al., Reference Keegan, Waller and Wade2022). However, although the completer analysis yielded significant recovery rate of people who no longer met the clinical cut-off indicated by EDE-Q, it is important to recognise that these findings may be biased, as the service only takes in people with mild to moderate ED, and that pre- and post-treatment data were only available for patients who remained engaged with the service and completed questionnaires.
This study offers additional insights into session-by-session changes through the use of ED-15 data, which is rarely explored in the literature. When examining the cognitive change separately, it seems that change in eating concern was less predictive of recovery. In other words, early change in weight/shape concern was more predictive of recovery, and that among people who were still above clinical cut-off at session 10, their weight and shape concern persisted. This is a novel finding that if replicated in controlled studies, this could possibly inform future clinical practice through further refining CBT-T and identifying key treatment targets. The results also complement Kambanis et al. (Reference Kambanis, Graver, Palmer, Stern, Tabri, Dunford, Burton-Murray, Breithaupt, Wang, Rossman, Mancuso, Andrea, Waller, Freid, Eddy, Thomas and Becker2025), where they argued that cognitive change may require a longer period of intervention, and that behavioural change and cognitive change might occur independently. Our current findings suggest a more nuanced picture, where it may be weight and shape concern that is more resistant to change. This result, however, should be interpreted with caution. The finding may reflect psychometric limitations, such as the lower reliability score of the eating subscale, meaning that it is less sensitive to detect difference, rather than a mechanism of change in CBT-T. Trials of larger participant size and higher statistical power are needed to ascertain the finding.
Clinical implications
These findings have several implications for clinical practice. First, the effectiveness of low-intensity treatments like CBT-T in mild to moderate EDs suggests they should be offered more broadly. From a service perspective, the findings also give preliminary evidence for a no-minimum threshold service that was able to reach a diverse ethnic population with favourable outcomes. Of note, data from session-by-session measures, particularly the ED-15, indicate that the most significant changes may occur slightly later than anticipated, particularly around eating concern. While session 4 is typically a key review point in CBT-T, only the Weight/Shape Concern subscale of ED-15 at session 4 reached statistical significance in the ROC analysis, whereas the Eating Concern subscale did not. Clinically, a review at session 4 can be meaningful, as clinicians’ emphasis on engagement and change during this session may prompt a delayed but significant shift in ED-related behaviour. Nevertheless, this suggests that clinicians should exercise caution regarding early termination of treatment after session 4, as meaningful changes may still occur in subsequent sessions.
The current findings may have implications on treatment allocations and treatment focus. The strong predictive value of changes in weight and shape concerns also raises important clinical questions, if this finding is replicated and extended. For example, it may be clinically useful to bring the body image work forward in order to aim for an earlier change in weight and shape concern, as commonly used ED treatment manuals (e.g. CBT-T, CBT-E) typically place body image work at a later stage. Nevertheless, it is essential to acknowledge that data quality issues, such as missing follow-up data and patient attrition, are common in routine services, complicating systematic evaluations. Another finding that needs to be interpreted with caution is the attrition. Many of the service users who discontinued treatment might not have found it helpful, despite reported reasons like re-prioritising life events. The strength of a no-minimum threshold service was that the service users were able to re-refer to the service quickly without a long waiting list, which also means that the attrition rate may be higher as the user knew that they did not have to wait for months to restart therapy. The exploratory findings do not necessarily suggest a need to intensify focus on these concerns; however, clinicians may want to monitor this area more closely throughout treatment.
Limitations and future research
Several limitations must be considered when interpreting these findings. First, the study included individuals with questionnaire scores below clinical cut-off, which could introduce a floor effect. Additionally, the study’s reliance on self-reported outcomes from those who completed treatment introduces a potential bias. The service evaluation was not pre-registered and there was no a priori sample size calculation.
Several definitions that we have adopted could be seen as arbitrary based on our service specification and practical constraints in a routine clinical service. First, the definition of mild to moderate EDs could be seen as arbitrary in our service specification, which was determined by predominantly physical stability and weight due to the absence of medical professionals and a full MDT. This is in the context of operating alongside a service that supports those with severe or high-risk presentations, meaning that internal guidance has been developed to help ensure that individuals access the most suitable care. We were aware of the limitations of using BMI as a criterion in our service specification. The cut-off of the data analysis point could be seen as arbitrary where some service users were still in treatment. Furthermore, the recovery criterion was purely based on clinical cut-off scores on validated psychometric measures. There is no one definition of ‘recovery’ from an eating disorder and it is understood that this may represent something different for everyone, for example some focusing on restoring their quality of life, mood, or psychosocial functioning, rather than achieving full remission from the cognitive and behavioural characteristics of ED per se (Bardone-Cone et al., Reference Bardone-Cone, Hunt and Watson2018). Clinically, a sustained abstinence of symptoms might be required. As was the case in other routine clinical evaluations, many service users did not complete the post-treatment questionnaires or follow-up questionnaires following completion of treatment. The evaluation is also heavily dependent on data quality, where more systematic data recording needs to be set up, especially around the reason of discontinuing treatments as well as consistent recording of behavioural symptoms. The lack of follow-up data, along with a small sample size for moderator analyses, limits the ability to draw strong conclusions about predictors of treatment success.
Future research can be improved by examining changes in behavioural symptoms. More research should investigate the mechanisms of change using session-by-session data, particularly to understand whether early improvements in weight concerns, rather than eating concerns, leads to more significant improvement. Sudden gains – significant improvements in symptoms between sessions – should also be explored to determine particular techniques leading to significant improvements when using protocalised treatment approaches. Understanding the nuances of patient engagement and attrition could also improve service delivery and retention in ED services. This could include qualitative evaluation of service users’ perspectives.
By providing insights into the progression of treatment outcomes, this study may inform future adaptations of CBT-T and contribute to enhancing early intervention efforts for non-underweight individuals with EDs.
Supplementary material
To view supplementary material for this article, please visit https://doi.org/10.1017/S1352465826101350
Data availability statement
Data are available from the corresponding author upon reasonable request.
Acknowledgements
None.
Author contributions
See Heng Yim: conceptualization, writing - original draft, methodology, visualization, formal analysis, data curation; Eve Dore: writing - original draft, data curation; Emily King: writing - review and editing, data curation, project administration; Ronelle Bloomfield: data curation, project administration, writing - review and editing; Zuzanna Malecka: data curation, project administration, writing - review and editing; Laura Fialko: writing - review and editing, supervision, conceptualization.
Financial support
The study is unfunded.
Competing interests
The authors declare none.
Ethical standards
As the study was classified as a service audit and evaluation, ethical approval was not needed. The study was by approved by Central and Northwest London NHS Foundation Trust Audit and Governance team. All authors have abided by the Ethical Principles of Psychologists and Code of Conduct as set out by the BABCP and BPS.



 Open access


Comments
No Comments have been published for this article.