

Introduction
The concept of causality is based on temporal relationships: causes must precede consequences. Some consequences may exist only as long as the cause applies, but in other cases, they persist after it stops, presumably because mediating processes have been recruited or modified. Sometimes the emergence of a consequence may modify its cause, either enhancing or reducing its effect. Such positive and negative feedback loops also have temporal attributes, and may be abrupt or leisurely.
The medical approach to disease defines disorders on the basis of concatenations of symptoms (syndromes), and then infers an underlying pathology (a diathesis): this, in turn, becomes the basis of causal explanation and the target of research. This approach is applied equally to psychiatric disorders, including psychosis. Current accounts of the origins of the psychotic diathesis acknowledge contributions from biological, social and psychological domains, which are seen as likely to act synergistically (Broome et al. Reference Broome, Woolley, Tabraham, Johns, Bramon, Murray, Pariante, McGuire and Murray2005; Howes & Murray, Reference Howes and Murray2014).
However, our understanding of psychiatric disorders has been amplified by the emergence of interactional models. These treat psychiatric symptoms as a network of individual interacting variables, exerting mutual causal influences without requiring the formulation of a consistent underlying pathology (Borsboom & Cramer, Reference Borsboom and Cramer2013; McNally et al. Reference McNally, Robinaugh, Wu, Wang, Deserno and Borsboom2015; Isvoranu et al. Reference Isvoranu, Borsboom, van Os and Guloksuz2016, Reference Isvoranu, van Borkulo, Boyette, Wigman, Vinkers and Borsboom2017; McNally, Reference McNally2016; Klippel et al. Reference Klippel, Viechtbauer, Reininghaus, Wigman, van Borkulo, Myin-Germeys and Wichers2017; Fried et al. Reference Fried, van Borkulo, Cramer, Boschloo, Schoevers and Borsboom2017; Murphy et al. Reference Murphy, McBride, Fried and Shevlin2017). The network then becomes the locus of causality. This allows the possibility that different causes may operate through different points of entry in the network, information that may have useful implications for treatment.
We have long argued against the rigid distinction between psychotic and non-psychotic problems in psychiatric classifications and that it is important to model the relationships between psychotic, non-psychotic, and environmental variables. Non-psychotic experiences such as low self-esteem, worry, sleep disturbance, anxiety, and depression may be contributory causes of particular psychotic symptoms, especially paranoia (e.g. Kuipers et al. Reference Kuipers, Garety, Fowler, Freeman, Dunn and Bebbington2006; Bebbington et al. Reference Bebbington, McBride, Steel, Kuipers, Radovanovic, Brugha, Jenkins, Meltzer and Freeman2013; Freeman, Reference Freeman2016). Most researched has been the cross-sectional and longitudinal association of anxiety and depression with psychotic experiences (e.g. Krabbendam et al. Reference Krabbendam, Myin-Germeys, De Graaf, Vollebergh, Nolen, Iedema and Van Os2004; Scott et al. Reference Scott, Martin, Bor, Sawyer, Clark and McGrath2009; Ben-Zeev et al. Reference Ben-Zeev, Ellington, Swendsen and Granholm2011; Thewissen et al. Reference Thewissen, Bentall, Oorschot, A Campo, van Lierop, van Os and Myin-Germeys2011), with a smaller number of studies indicating similar findings for low self-esteem, worry, and sleep disturbance (e.g. Freeman et al. Reference Freeman, Stahl, McManus, Meltzer, Brugha, Wiles and Bebbington2012; Hartley et al. Reference Hartley, Haddock, Vasconcelos E Sa, Emsley and Barrowclough2014; Sheaves et al. Reference Sheaves, Bebbington, Goodwin, Harrison, Espie, Foster and Freeman2016). Damaging social experiences also increase the likelihood of a range of psychological symptoms, including psychotic experiences (e.g. Bebbington et al. Reference Bebbington, Jonas, Kuipers, King, Cooper, Brugha, Meltzer, McManus and Jenkins2011; Kelleher et al. Reference Kelleher, Keeley, Corcoran, Ramsay, Wasserman, Carli, Sarchiapone, Hoven, Wasserman and Cannon2013; McGrath et al. Reference McGrath, Saha, Lim, Aguilar-Gaxiola, Alonso, Andrade, Bromet, Bruffaerts, Caldas de Almeida, Cardoso, de Girolamo, Fayyad, Florescu, Gureje, Haro, Kawakami, Koenen, Kovess-Masfety, Lee, Lepine, McLaughlin, Medina-Mora, Navarro-Mateu, Ojagbemi, Posada-Villa, Sampson, Scott, Tachimori, Ten Have, Kendler and Kessler2017). In particular, non-psychotic symptoms may modulate the relationship between adversity and psychotic experiences, as moderators and mediators (e.g. Gracie et al. Reference Gracie, Freeman, Green, Garety, Kuipers, Hardy, Ray, Dunn, Bebbington and Fowler2007; Marwaha & Bebbington, Reference Marwaha and Bebbington2015; Gibson et al. Reference Gibson, Alloy and Ellman2016). If so, this has clinical relevance, as such symptoms may then serve as significant candidate targets for psychological or pharmacological treatments. Moreover, while psychoactive substances such as cannabis may elicit paranoia by inducing anomalous perceptual experiences such as hallucinations directly, they may also operate through these common affective processes (Freeman et al. Reference Freeman, Dunn, Murray, Evans, Lister, Antley, Slater, Godlewska, Cornish, Williams, Di Simplicio, Igoumenou, Brenneisen, Tunbridge, Harrison, Harmer, Cowen and Morrison2015a).
The gold standard for causal inference in putative causal systems is direct intervention, itself an attempt to capture the temporal element required for causal inference. Although they may have valuable practical implications, intervention studies can be expensive. They may also be difficult to implement, though there are new opportunities with digital interventions (Freeman et al. Reference Freeman, Sheaves, Goodwin, Yu, Nickless, Harrison, Emsley, Luik, Foster, Wadekar, Hinds, Gumley, Jones, Lightman, Jones, Bentall, Kinderman, Rowse, Brugha, Blagrove, Gregory, Fleming, Walklet, Glazebrook, Davies, Hollis, Haddock, John, Coulson, Fowler, Pugh, Cape, Moseley, Brown, Hughes, Obonsawin, Coker, Watkins, Schwannauer, MacMahon, Siriwardena and Espie2017). As a result, attempts have been made to optimise causal inference in datasets that do not involve interventions. Analysis of cross-sectional datasets using variants of logistic regression has been used to establish mediation (e.g. Marwaha et al. Reference Marwaha, Broome, Bebbington, Kuipers and Freeman2014, Reference Marwaha, Thompson, Bebbington, Singh, Freeman, Winsper and Broome2015; Catone et al. Reference Catone, Marwaha, Kuipers, Lennox, Freeman, Bebbington and Broome2015). These approaches narrow the field of plausible candidate mediators, essentially by excluding variables that do not meet the criteria for mediation.
Nonetheless, there remains a due wariness about making positive causal inferences from cross-sectional data. However, we have argued elsewhere that such data capture participants at different stages of causal progressions; the time dependence remains to some extent encoded in the data, and is thus not completely lost. Different causal hypotheses would predict different patterns of relationship, each with different levels of support from the observed data. The task is then to decode the data, and this can be done to a significant extent through the use of advanced statistical methods. In particular, we have argued for the introduction in psychiatry of probabilistic graphical models in the form of Directed Acyclic Graphs (DAGs) to ascertain which causal patterns best fit cross-sectional datasets (Moffa et al. Reference Moffa, Catone, Kuipers, Kuipers, Freeman, Marwaha, Lennox, Broome and Bebbington2017).
DAGs are the representation of Bayesian networks and model the overall dependence structure of multiple variables. `Edges` are directed links (lines with an arrow head) that connect `nodes`, the specific variables being analysed (these conventions are illustrated in the figure summarising our results). Nodes are described as the parents of those immediately below them, which are conversely referred to as children. Nodes that can be reached from another node by following a directed path are called its descendants. The connections between the nodes of a Bayesian network represent conditional independence relationships between the represented variables. Each variable in a Bayesian network is independent of its non-descendants conditional on its parents. As a consequence, the joint probability distribution of the variables in the network decomposes as a product of the conditional distribution of each node, given its parent nodes in the graph.
Alongside the probabilistic interpretation of DAGs, a causal interpretation is also widespread. The logic behind using DAGs to depict hypothetical causal structures is set out in detail by Pearl (Reference Pearl2009). In this interpretation, a direct edge in the graph is held to imply a causal relationship. A directed pathway from one variable to another also implies a causal relationship, though one operating through intermediary variables on the path.
Causal discovery through DAG remains controversial (Dawid, Reference Dawid2010). However, the probabilistic DAG-based inference is capable of pointing to the most likely directional links between multiple variables, thereby locating them in a putative causal cascade, in which upstream variables are potential causes of those downstream. Sometimes a given dataset is incapable of allowing the full specification of the direction of the edges of a DAG, thereby limiting insights about potential causal links between pairs of variables. These variables then need to be placed at the same level of the graph (i.e. neither upstream nor downstream). We recently applied this method to investigate mechanisms linking bullying with persecutory ideation and hallucinations, obtaining consistent findings with data from two British national surveys of psychiatric morbidity (Moffa et al. Reference Moffa, Catone, Kuipers, Kuipers, Freeman, Marwaha, Lennox, Broome and Bebbington2017).
While DAGs may be able to capture some of the time dependence between individual variables in cross-sectional data, they cannot provide information about the length of time over which putative causes have their effects. However, it may be possible to illuminate this using longitudinal studies, although these are constrained by the interval between assessments: if the interval is too short for a given cause to operate, or too long for it to be maintained, there may appear to be no relationship even where one exists. Nevertheless, applying DAG discovery to longitudinal data may illuminate the characteristics of specific causal relationships, in particular because it may allow the identification of the feedback loops likely in social/psychological systems. Bayesian networks are incapable of modelling feedback loops in single cross-sectional datasets; however such loops may be identifiable by subjecting time course data to analysis in terms of dynamic Bayesian networks (Friedman et al. Reference Friedman, Murphy and Russell1998).
In the current study, we applied a dynamic Bayesian network approach for learning graphical structures to data from the 2000 British National Psychiatric Morbidity survey. This provided two equivalent waves, as it included follow-up interviews after 18 months with a stratified subsample. We took hallucinations and persecutory ideation as key symptoms of psychosis, and identified potential causal links between them and non-psychotic psychiatric symptoms both cross-sectionally and longitudinally.
Survey methods
Setting and design
The second National Psychiatric Morbidity Survey of adults living in private households in England, Scotland, and Wales was carried out in 2000 (Singleton et al. Reference Singleton, Bumpstead, O'Brien, Lee and Meltzer2001). The initial assessment was based on a sample of 8580 participants, while a subsample of 2406 participants was reassessed 18 months later (Singleton and Lewis, Reference Singleton and Lewis2003). The follow-up survey focused on participants with disorders and those likely to develop them. Thus all people identified as having a mental disorder, and all others with six or more common mental disorder symptoms were re-interviewed, along with 20% of the remainder selected at random.
Measures
The assessment of persecutory ideation was based on question PSQ3a in the Psychosis Screening Questionnaire (PSQ; Bebbington & Nayani, Reference Bebbington and Nayani1995): ‘Have there been times when you felt that people were deliberately acting to harm you or your interests?’ Auditory hallucinations were identified from question PSQ5a: ‘Have you at any time heard voices saying quite a few words or sentences when there was no-one around that might account for it?’ Both these items were assessed at baseline in relation to the past year, and over the intervening 18 months at follow up. At both time-points, the Clinical Interview Schedule-Revised (CIS-R; Lewis et al. Reference Lewis, Pelosi, Araya and Dunn1992) was used to establish the presence of insomnia, generalised anxiety, situational anxiety, social anxiety, worry, and depressed mood over a consistent period lasting at least 2 weeks in the past month. Cannabis use, cannabis dependence, and hazardous alcohol use were also assessed at both interviews. Cannabis use was assessed in relation to the past month, and current cannabis dependence was identified on the basis of a positive answer to any of five questions characterising dependence in the Diagnostic Interview Schedule (Robins et al. Reference Robins, Helzer, Croughan and Ratcliff1981). Current hazardous alcohol use (a pattern of consumption carrying a risk of physical and psychological harm) was defined as a score of 8 or more on the Alcohol Use Disorders Identification Test (AUDIT; Saunders et al. Reference Saunders1993).
All variables were analysed in binary form, suitable for the DAG procedures employed. Data were weighted back to the first stage sample, using a weighting variable that took account both of the sampling strategy and of refusals.
Statistical methods
Given the longitudinal nature of the data, we employed dynamic Bayesian networks to capture the time component and to describe the dynamic evolution of the variables (Friedman et al. Reference Friedman, Murphy and Russell1998). Such networks model the overall dependence structure of multiple variables, measured over different time points, and visualised in DAGs. Nodes representing the specific variables being analysed are connected by directed edges to form a network (see Moffa et al. Reference Moffa, Catone, Kuipers, Kuipers, Freeman, Marwaha, Lennox, Broome and Bebbington2017 for a more detailed description). In dynamic Bayesian networks, different waves of data collection are referred to as time slices: we then have a node for each variable in each time slice. Nodes may be connected within a time slice, but may also be linked to variables in the follow-up time slice, thereby forming a larger Bayesian network incorporating measurements of all variable over time. The connections are assumed to be stationary over time and identical across time slices, implying that the way symptoms relate to each other does not change with time. Under this assumption, the problem of inferring the network that describes the observed data is essentially reduced to learning a network of size equal to the number of variables considered at each time point. However, for each variable in the follow-up time slice, we also need to learn the set of parents from the previous time slice (i.e. the variables from the previous time point with a direct edge into the variable under consideration, for which no conditional independence is found to hold). Analysing the same connections at different time points enables us to characterise the networks describing both time slices, together with the relationships between the time slices. A feedback loop may be tentatively inferred if a variable A at time 1 affects a variable B at time 2, and B at time 1 affects A at time 2.
In the current analysis, the discovery of the DAG relied on an appropriately modified version of our partition MCMC method (Kuipers & Moffa, Reference Kuipers and Moffa2017), a novel Bayesian method for graphical structure learning. The range of causal effects was also predicted in a Bayesian fashion, as implemented by Moffa et al. (Reference Moffa, Catone, Kuipers, Kuipers, Freeman, Marwaha, Lennox, Broome and Bebbington2017) for binary variables. The main underlying assumptions are that the variables are causally linked, and that the causal relationship can be represented by a causal DAG. The method has two special features. First, it quantifies both the strength and the direction of causal effects. Second, since several different graphical arrangements of variables may each be capable of explaining the data reasonably well, the uncertainty in the inference is captured by sampling from the range of possible DAGs in proportion to their posterior distribution. In total, we sampled 10 000 DAGs, such that better fitting graphs were chosen more often.
Each of the DAGs sampled from the posterior distribution provides a model of the data, and from this, we can derive an estimate of the probability of each variable taking the value 0 or 1 depending on the state of its parents in the network. The individual DAGs allow us to calculate the effect of one variable on another. The value of one variable is set to 0, and the probability that each remaining variable is 0 or 1 can then be calculated. The selected variable is then set to 1 and the process is repeated. In Pearl's terms, the difference between the two sets of values constitutes the causal effect of the selected variable on the others (Pearl, Reference Pearl2009). This procedure is followed in turn for each variable in the DAG. By averaging the estimated effects over all the DAGs in the sample we can then obtain the overall effect of changing each variable on all of the others. This enables us to identify the most plausible causal mechanisms. Further details of the method in action are given by Moffa et al. (Reference Moffa, Catone, Kuipers, Kuipers, Freeman, Marwaha, Lennox, Broome and Bebbington2017). In addition, we improved the characterization of the distribution of intervention effects by taking into account the uncertainty in the parameter estimation of each DAG to provide the full posterior distribution.
Results
The correlations between variables assessed initially and at follow up are displayed in Table 1, while the results of the DAG discovery are shown in Figs 1 and 2.
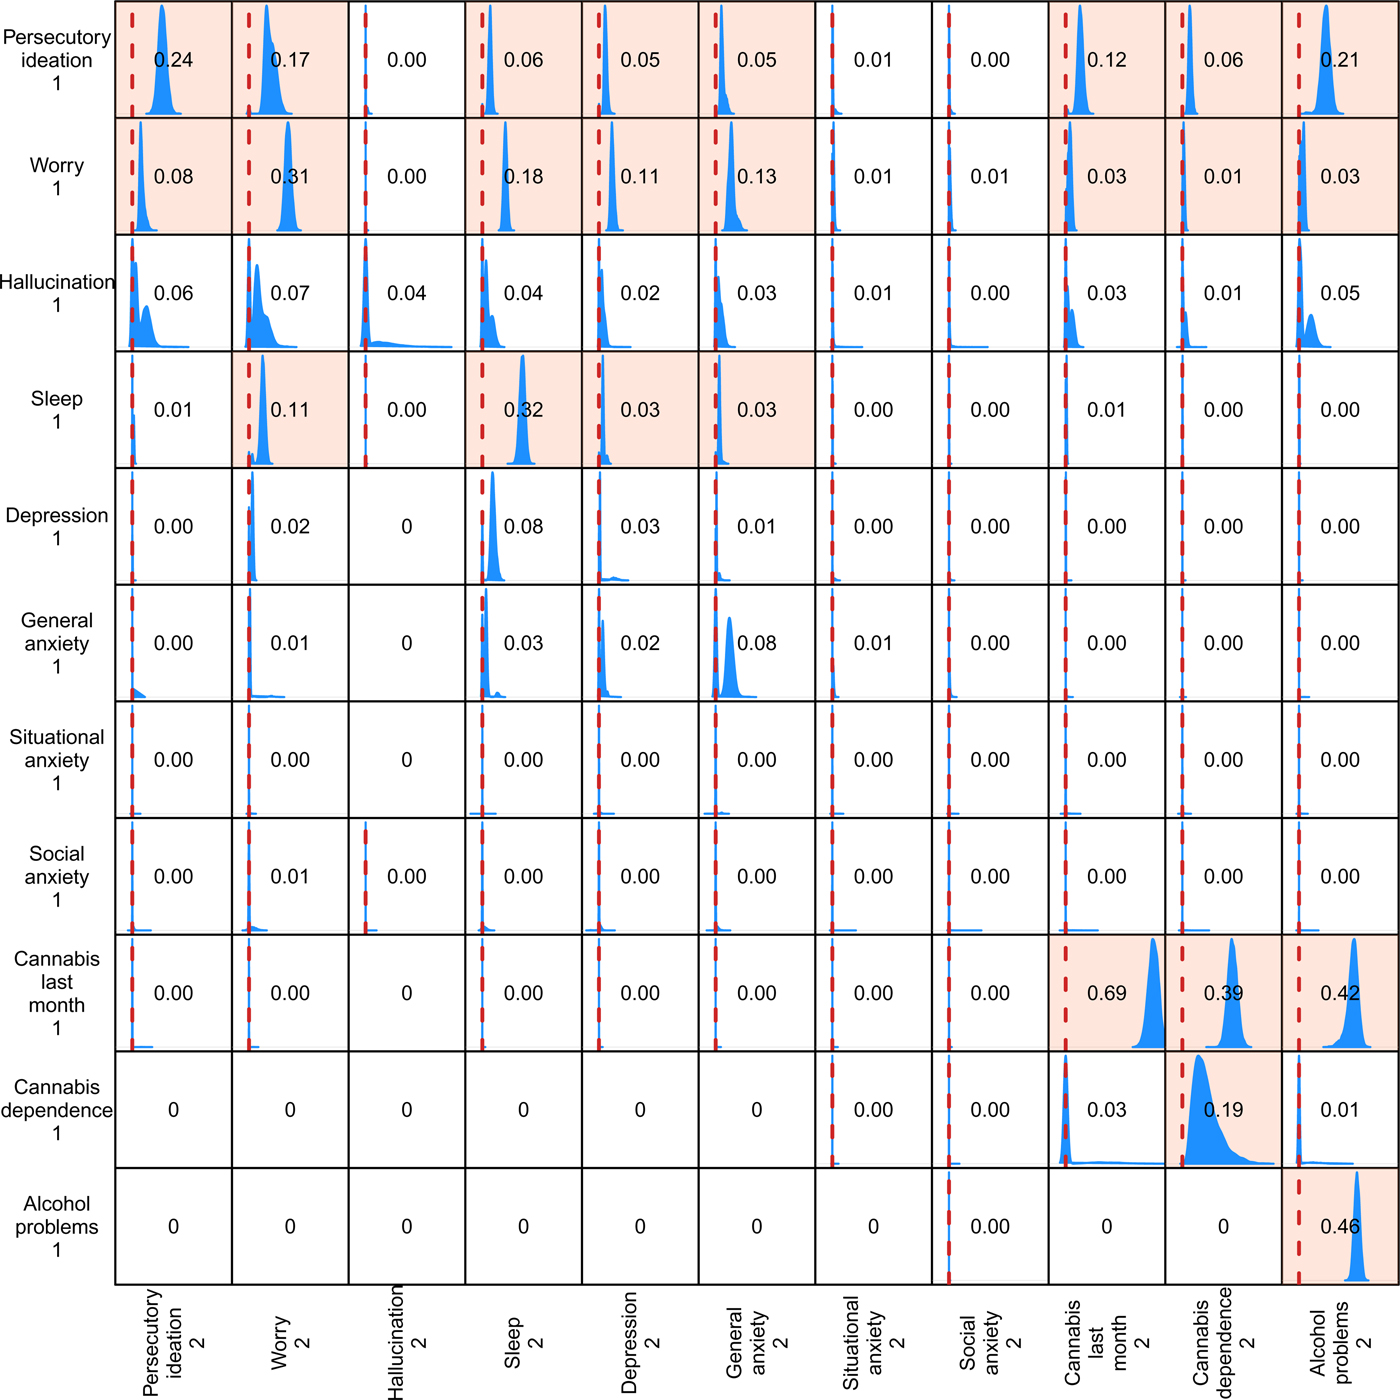
Distributions of downstream causal effects. The row variables are those at Time 1, the column variables those at Time 2. Where there was no effect between variables we entered a zero in the relevant box. For clarity, the graphs are truncated to cover the range −0.1 to 0.75. The red vertical line in each box indicates zero causal effect. Where the 95% credible interval (the Bayesian counterpart of confidence limits) does not cover the point corresponding to zero causal effect, the whole box is coloured. The numbers in the boxes quantify the relevant average causal effect.
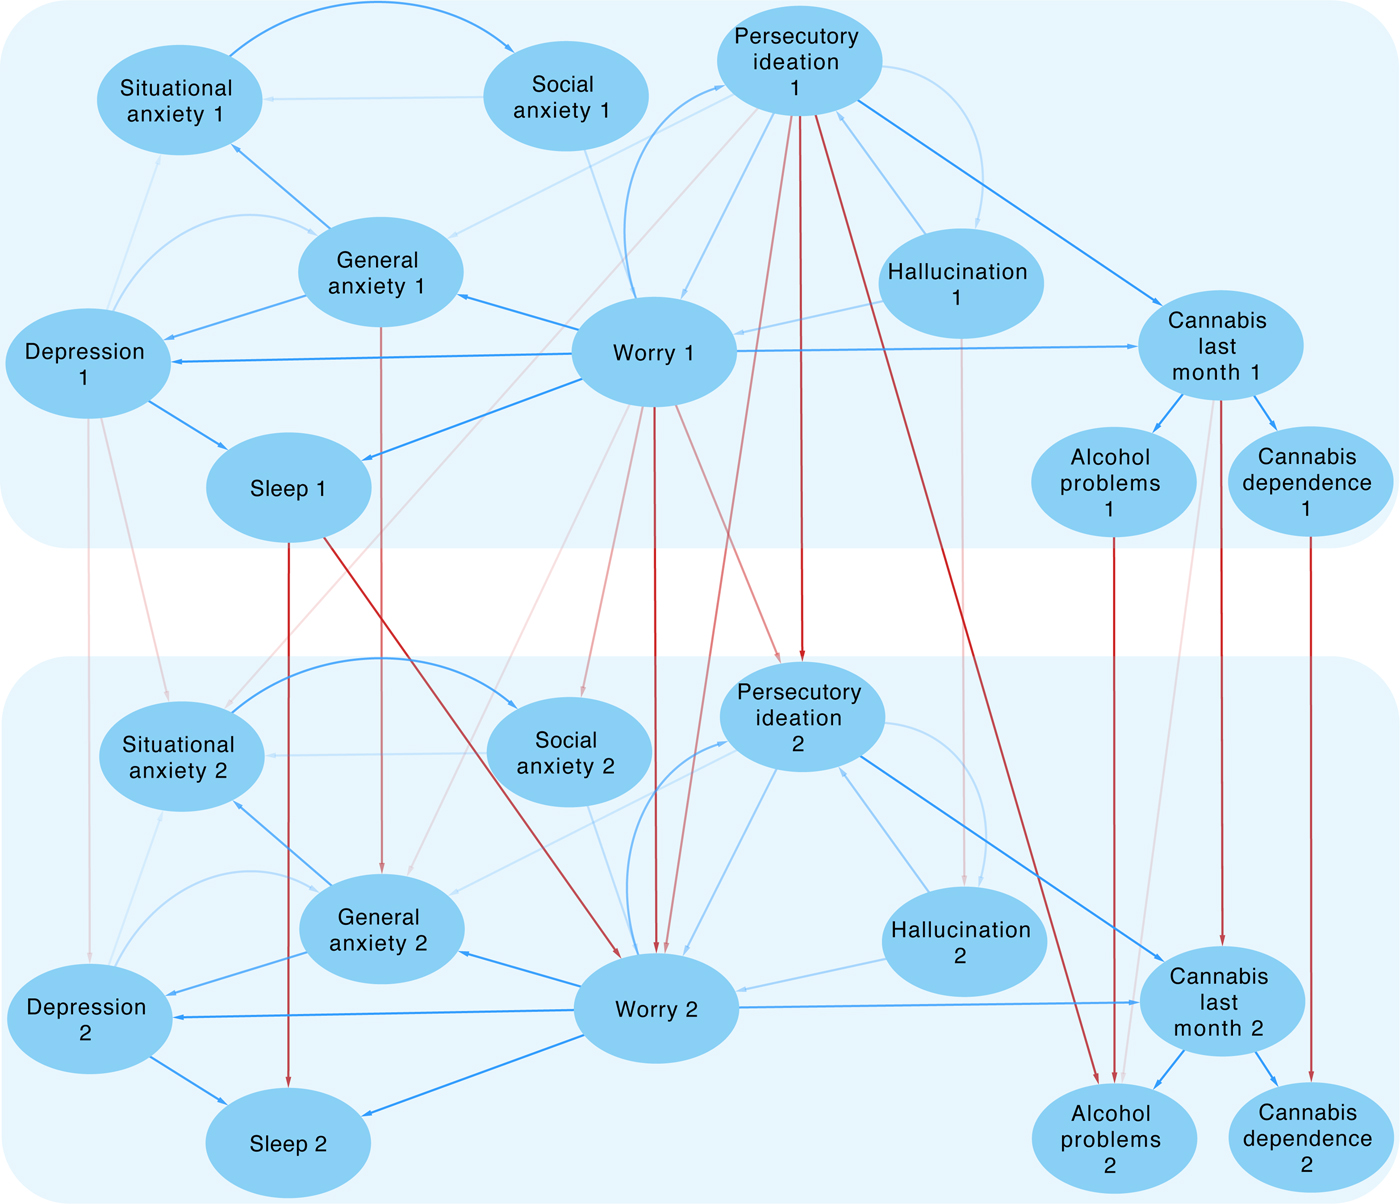
Directed Acyclic Graph of relationships between variables at the two time-points. Arrows within time points are blue, those linking variables across the two time points are red. The density of the arrows represents the strength of the links. Single arrows indicate a plausible causal link, arrows in both directions imply that the data are compatible with causal influences in either direction.
Correlation of variables at each time point
In Fig. 1 we show the distribution of causal effects of the Time 1 variables (the row variables) on the Time 2 variables (the column variables). In cases where there was no effect between two variables, we entered a zero in the relevant box. In all boxes, most of the probability mass of the effect distribution is within the range −0.1 to 0.75 and so we truncated the graphs accordingly. The red vertical line in each box indicates zero causal effect. The whole box is coloured to highlight cases where the 95% credible interval (the Bayesian counterpart of confidence limits) does not cover the point corresponding to zero causal effect. The number reported across the boxes quantifies the relevant average causal effect.
In Fig. 2 we present a consensus graph generated by this analysis. In order to focus on the stronger effects, edges are only shown in the figures if they are present in at least 10% of the sampled DAGs. Note that the graphical structure within each time slice is identical, as this is imposed by the dynamic Bayesian network framework. This restriction then enabled us to quantify the links between the initial and follow up symptoms. The density of the arrows joining the variables represents the strength of the links. The variables are either joined by single arrows, indicating a plausible causal link, or by arrows in both directions, which implies that causal influences in either direction are compatible with the data (this corresponds to the presence of bimodal peaks in the plots in Fig. 1).
We will first consider the cross-sectional relationships apparent within the two waves of data (time slices). Worry appears to have a central role in the links between symptoms. It has plausible direct effects on insomnia, depressed mood and generalised anxiety, and on past-month cannabis use. Via cannabis use, it appears to be linked both to cannabis dependence and to alcohol problems. The relationship between persecutory ideation and worry is indeterminate, consistent with the analyses of Moffa et al. (Reference Moffa, Catone, Kuipers, Kuipers, Freeman, Marwaha, Lennox, Broome and Bebbington2017). Finally, worry is weakly determined by social anxiety and hallucinations.
The relationship between social anxiety and situational anxiety is also indeterminate. While generalised anxiety is clearly upstream of situational anxiety, its link with depressed mood is undetermined. Insomnia is downstream of depressed mood and also of worry. The relationship between persecutory ideation and auditory hallucinations is indeterminate. Hallucinations have no direct link with any other variable, apart from a weak effect on worry (it should be noted the identification of hallucinations did not require that they should be distressing).
In relation to follow up, the variables fell into two groups, those in which a given variable at time 1 was clearly and strongly predictive of its equivalent at time 2, and those in which such relationships were weak or absent. Somewhat unexpectedly, the second group was wholly made up of affective variables: depression, social anxiety, and situational anxiety. The implication is that these variables fluctuate significantly over the 18 months of follow up and are consequently less likely to be endorsed at a given time-point. They may vary in response to changes in other psychological variables, both those included and those absent from the current analysis. However, general anxiety, worry, sleep problems, and persecutory ideation are strongly self-predicting, suggesting they tend to persist over the follow-up period. To a lesser extent, this is also true of auditory hallucination. Finally, the substance use variables relating to alcohol and cannabis are strongly persistent.
The relationship over the 18-month follow-up period between persecutory ideation and worry is of particular theoretical interest, as each variable has an effect on the other. There is no other instance of a putative feedback loop in these data.
Discussion
The identification of causal effects is always hostage to the temporal attributes of data. In this investigation, this includes the time frame forming part of the definition of the individual variables. Thus the affective variables relate to the 2-week period immediately before assessment, while others are recorded in relation to the previous year. In consequence, the former may not have been apparent at an earlier stage in the interval between assessments, and the latter may not be present in the later part of the interval. This will tend to attenuate the apparent causal links between these two sorts of variable.
The analysis presented here distinguishes two groups of plausible causal effects. The first group involves analysis within each time point: this identifies potential causal relationships but cannot provide information about the interval over which the causes operate. The second element of the analysis links the time-points, and relates to potential causes that operate over the 18-month interval. Edges between time points will only appear if the timescale of their effects is similar to the interval between the two assessments. Very slow effects would not be picked up, and shorter-term effects will not be identified unless they are cumulative. The structure of the network within a time point is likely (though not certain) to capture correlations in the data associated with mechanisms acting on a timescale different from the interval between the repeated measurements. Finally, we observe that in some cases nodes of the same variable do not show edges between time points. One plausible explanation is that the causal effects impinging on such nodes are represented entirely within the structure of the single time point, or flow from the previous time point only by transmission through other variables.
It is notable that most of the strongest links over the 18-month follow-up period were within given variables. Worry, persecutory ideation, general anxiety, and sleep disturbance were self-perpetuating. So were hallucinations and depression, though less strongly. This raises the issues of the inception and maintenance of these psychological features. While many mental experiences appear short-lived, either with an inherent tendency to resolve, or dissipating swiftly when their cause abates, we know that other phenomena are self-perpetuating. Once triggered, the resulting emotional and cognitive reactions are self-fulfilling and so maintain the anxiety, worry or depression. Situational and social anxiety may be maintained because they involve repeated episodes of proximity to a feared context followed by retreat. In many cases the triggers are avoided, so that anxiety can never be resolved by the discovery that there is nothing to fear or that the threat has disappeared. Thus people with claustrophobia may avoid all small spaces and never find out that there is no real danger of death or suffocation. Other phenomena reflect propensities that are constantly reinforced by interaction with the social world. So, persecutory ideation may involve a cognitive predisposition that is constantly reinforced by inevitable contact with, and over-interpretation of, anodyne or ambiguous social experiences (e.g. Freeman et al. Reference Freeman, Pugh, Antley, Slater, Bebbington, Gittins, Dunn, Kuipers, Fowler and Garety2008). Worry similarly reveals a continuing propensity for handling cognitive content in a particular way. Worry brings implausible ideas to mind, keeps them there, and elaborates the content in negative directions.
Three of the persistent variables concerned the use of cannabis and alcohol. This may be definitional: habitude is written into the definition of alcohol problems and cannabis dependence. Reported last-month cannabis use seems more likely to identify sporadic use, but even so it may often reflect much more habitual use than is implied by the specific question. Our results suggest strongly that problems with substance use do not lead to persecutory ideation in this population sample, though persecutory ideation has reasonably strong effects on later alcohol problems. Our data also indicate that sleep disturbance is a persistent problem, consistent with other research (e.g. Morphy et al. Reference Morphy, Dunn, Lewis, Boardman and Croft2007).
The relationship between affective variables and persecutory ideation is of particular interest, given that previous research suggests that affective responses induce paranoia, and may mediate the link between traumatic events and paranoia (e.g. Gracie et al. Reference Gracie, Freeman, Green, Garety, Kuipers, Hardy, Ray, Dunn, Bebbington and Fowler2007; Gibson et al. Reference Gibson, Alloy and Ellman2016). In particular, Experience Sampling Methodology studies have found that clear affective responses to minor stress were paralleled by moment-to-moment variation in psychotic phenomena (Myin-Germeys et al. Reference Myin-Germeys, van Os, Schwartz, Stone and Delespaul2001, Reference Myin-Germeys, Delespaul and van Os2005; Delespaul et al. Reference Delespaul, deVries and van Os2002; Myin-Germeys & van Os, Reference Myin-Germeys and van Os2007).
In the current analysis, the affective symptom with a clear direct relationship with paranoia is worry, which provides the only link between paranoia and the other affective phenomena analysed here.
The worry/persecutory ideation link can be interpreted in terms of reciprocal causality, as manifested over an interval of 18 months. This is consistent with the indeterminate relationship within each time point, but cannot be inferred from it. The relationship implies that targeting either symptom in treatment is likely to ameliorate the other, and will influence the other variables upon which they have an effect. The therapeutic benefit of targeting worry has received strong support in a direct intervention clinical trial involving 150 patients with persistent persecutory delusions (Freeman et al. Reference Freeman, Dunn, Startup, Pugh, Cordwell, Mander, Cernis, Wingham, Shirvell and Kingdon2015b). The intervention focused solely on reducing the cognitive style of worry and led to reductions in delusions; the mechanism of action was substantiated by mediation analysis.
In contrast, new research showing that reducing insomnia through sleep management techniques leads to reductions in both paranoia and hallucinations (Freeman et al. Reference Freeman, Sheaves, Goodwin, Yu, Nickless, Harrison, Emsley, Luik, Foster, Wadekar, Hinds, Gumley, Jones, Lightman, Jones, Bentall, Kinderman, Rowse, Brugha, Blagrove, Gregory, Fleming, Walklet, Glazebrook, Davies, Hollis, Haddock, John, Coulson, Fowler, Pugh, Cape, Moseley, Brown, Hughes, Obonsawin, Coker, Watkins, Schwannauer, MacMahon, Siriwardena and Espie2017) appears to run counter to the results of our DAGs analysis. Though the benefits of improved sleep might work via a reduction in worry, as indicated in the DAGs model, the picture seems less straightforward for hallucinations. There is also a discrepancy with work associating cannabis with paranoia and hallucinations (Freeman et al. Reference Freeman, Dunn, Murray, Evans, Lister, Antley, Slater, Godlewska, Cornish, Williams, Di Simplicio, Igoumenou, Brenneisen, Tunbridge, Harrison, Harmer, Cowen and Morrison2015a; Murray et al. Reference Murray, Englund, Abi-Dargham, Lewis, Di Forti, Davies, Sherif, McGuire and D'Souza2017), although these links may operate through shared environmental causes (Shakoor et al. Reference Shakoor, Zavos, McGuire, Cardno, Freeman and Ronald2015). Our results suggest that targeting more persistent features such as worry is likely to be productive. Targeting anxiety and depression may improve well-being, but whether this would ameliorate more established persecutory ideas remains to be tested.
Conclusion
Our novel statistical analysis, based on dynamic Bayesian networks, enabled us to re-examine the relationships between interacting affective and psychotic variables and to evaluate these relationships over time. This, in turn, identifies key variables for interventions aimed at improving outcomes for these distressing conditions.
Acknowledgements
The authors affirm that they have no financial involvement in or affiliation with any organisation whose financial interests may be affected by material in the manuscript or which might potentially bias it. The work was not directly funded: the dataset used in the analyses is publicly accessible.


 Open access